- Table of Contents
-
- H3C WX3000 Series Unified Switches Switching Engine Configuration Guide-6W103
- 00-Preface
- 01-CLI Configuration
- 02-Login Configuration
- 03-Configuration File Management Configuration
- 04-VLAN Configuration
- 05-Auto Detect Configuration
- 06-Voice VLAN Configuration
- 07-GVRP Configuration
- 08-Basic Port Configuration
- 09-Link Aggregation Configuration
- 10-Port Isolation Configuration
- 11-Port Security-Port Binding Configuration
- 12-DLDP Configuration
- 13-MAC Address Table Management Configuration
- 14-MSTP Configuration
- 15-802.1x and System Guard Configuration
- 16-AAA Configuration
- 17-MAC Address Authentication Configuration
- 18-IP Address and Performance Configuration
- 19-DHCP Configuration
- 20-ACL Configuration
- 21-QoS-QoS Profile Configuration
- 22-Mirroring Configuration
- 23-ARP Configuration
- 24-SNMP-RMON Configuration
- 25-Multicast Configuration
- 26-NTP Configuration
- 27-SSH Configuration
- 28-File System Management Configuration
- 29-FTP-SFTP-TFTP Configuration
- 30-Information Center Configuration
- 31-System Maintenance and Debugging Configuration
- 32-VLAN-VPN Configuration
- 33-HWPing Configuration
- 34-DNS Configuration
- 35-Smart Link-Monitor Link Configuration
- 36-PoE-PoE Profile Configuration
- 37-Routing Protocol Configuration
- 38-UDP Helper Configuration
- 39-Acronyms
- 40-Index
- Related Documents
-
| Title | Size | Download |
|---|---|---|
| 31-System Maintenance and Debugging Configuration | 132.43 KB |
1 Host Configuration File Loading
Introduction to Loading Approaches
2 Basic System Configuration and Debugging
Enabling/Disabling System Debugging
Displaying Operating Information about Modules in System
Introduction to Device Management
Device Management Configuration
Device Management Configuration Tasks·
Scheduling a Reboot on the Device
Configuring Real-time Monitoring of the Running Status of the System
Specifying the Main Configuration File to be Used at Next Reboot
Identifying and Diagnosing Pluggable Transceivers
Displaying and Maintaining the Device Management Configuration
![]()
l The term switch used throughout this document refers to a switching device in a generic sense or the switching engine of a WX3000 series.
l The sample output information in this manual was created on the WX3024. The output information on your device may vary.
Traditionally, device software is loaded through a serial port. This approach is slow, time-consuming and cannot be used for remote loading. To resolve these problems, the TFTP and FTP modules are introduced into the device. With these modules, you can load/download software/files conveniently to the device through an Ethernet port.
This chapter introduces how to load the host configuration file to the device remotely.
Introduction to Loading Approaches
You can load software remotely by using:
l FTP
l TFTP
If your terminal is not directly connected to the device, you can telnet to the device, and use FTP or TFTP to load the host configuration file remotely.
Remote Loading Using FTP
Loading procedure using FTP client
1) Loading the host configuration file
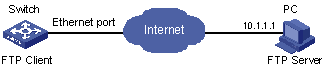
As shown in Figure 1-1, a PC is used as both the configuration device and the FTP server. You can telnet to Switch, and then execute the FTP commands to download the host configuration file from the remote FTP server (whose IP address is 10.1.1.1) to Switch.
Figure 1-1 Remote loading using FTP Client
Step 1: Download the file to the device using FTP commands.
<device> oap connect slot 0
Connected to OAP!
<device_LSW> ftp 192.168.0.100
Trying ...
Press CTRL+K to abort
Connected.
220 3Com 3CDaemon FTP Server Version 2.0
User(none):admin
331 User name ok, need password
Password:
230 User logged in
[ftp]get config.cfg config.cfg
227 Entering passive mode (192,168,0,100,5,95)
125 Using existing data connection
..........226 Closing data connection; File transfer successful.
FTP: 7590 byte(s) received in 15.139 second(s) 501.00 byte(s)/sec.
[ftp] bye
![]()
When using different FTP server software on PC, different information will be output to the device.
Step 2: Update the host configuration file on Switch.
<device_LSW> startup saved-configuration config.cfg main
Please wait........................................Done!
Step 3: Restart Switch.
<device_LSW> reboot
![]()
Before restarting Switch, make sure you have saved all other configurations that you want, so as to avoid losing configuration information.
Loading procedure using FTP server
As shown in Figure 1-2, Switch is used as the FTP server. You can telnet to Switch, and then execute the FTP commands to upload the configuration file config.cfg to Switch.
Figure 1-2 Remote loading using FTP server
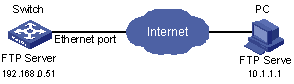
Step 1: As shown in Figure 1-2, connect Switch through an Ethernet port to the PC (whose IP address is 10.1.1.1)
Step 2: Configure the IP address of VLAN-interface 1 on Switch to 192.168.0.51, and subnet mask to 255.255.255.0.
![]()
You can configure the IP address for any VLAN on Switch for FTP transmission. However, before configuring the IP address for a VLAN interface, you have to make sure whether the IP addresses of this VLAN and PC are routable.
<device> oap connect slot 0
Connected to OAP!
<device_LSW> system-view
deviceView: return to User View with Ctrl+Z.
[device_LSW]interface Vlan-interface 1
[device_LSW-Vlan-interface1]ip add 192.168.0.51 255.255.255.0
Step 3: Enable FTP service on Switch, and configure the FTP user name to test and password to pass.
[device_LSW-Vlan-interface1]quit
[device_LSW]ftp server enable
[device_LSW]local-user test
New local user added.
[device_LSW-luser-test]password simple pass
[device_LSW-luser-test]service-type ftp
Step 4: Enable FTP client software on the PC. The following takes the command line interface in Windows for illustration.
C:\Documents and Settings\Administrator>
Step 5: Use the cd command on the interface to enter the path that the upgrade file is to be stored. Assume the name of the path is D:\update.
C:\Documents and Settings\Administrator>d:
D:\>cd update
D:\Update>
C:\Documents and Settings\Administrator>d:
D:\>cd update
D:\Update>ftp 192.168.0.51
Connected to 192.168.0.51.
220 FTP service ready.
User (192.168.0.51:(none)): test
331 Password required for test.
Password:
230 User logged in.
ftp>
Step 7: Use the put command to upload the file config.cfg to Switch.
C:\Documents and Settings\Administrator>d:
D:\>cd update
D:\Update>ftp 192.168.0.51
Connected to 192.168.0.51.
220 FTP service ready.
User (192.168.0.51:(none)): test
331 Password required for test.
Password:
230 User logged in.
ftp> put startup.cfg
200 Port command okay.
150 Opening ASCII mode data connection for /startup.cfg.
226 Transfer complete.
Step 8: Configure config.cfg as the main configuration file at next startup, and then restart Switch.
<device_LSW> startup saved-configuration config.cfg main
Please wait........................................Done!
<device_LSW> reboot
After Switch restarts, the file config.cfg is used as the main configuration file. It indicates that the configuration file loading is finished.
![]()
l The steps listed above are performed in the Windows operating system, if you use other FTP client software, refer to the corresponding user guide before operation.
l Only the configuration steps concerning loading are listed here. For detailed description on the corresponding configuration commands, refer to FTP-SFTP-TFTP in H3C WX3000 Series Unified Switches Switching Engine Configuration Guide.
Remote Loading Using TFTP
The remote loading using TFTP is similar to that using FTP. The only difference is that TFTP is used to load software to Switch, and Switch can only act as a TFTP client.
Basic System Configuration
Follow these steps to perform basic system configuration:
|
To do… |
Use the command… |
Remarks |
|
Set the current date and time of the system |
clock datetime HH:MM:SS { YYYY/MM/DD | MM/DD/YYYY } |
Required Execute this command in user view. The default value is 23:55:00 04/01/2000 when the system starts up. |
|
Set the local time zone |
clock timezone zone-name { add | minus } HH:MM:SS |
Optional Execute this command in user view. By default, it is the UTC time zone. |
|
Set the name and time range of the summer time |
clock summer-time zone_name { one-off | repeating } start-time start-date end-time end-date offset-time |
Optional Execute this command in user view. l When the system reaches the specified start time, it automatically adds the specified offset to the current time, so as to toggle the system time to the summer time. l When the system reaches the specified end time, it automatically subtracts the specified offset from the current time, so as to toggle the summer time to normal system time. |
|
Enter system view from user view |
system-view |
— |
|
Set the system name of the device |
sysname sysname |
Optional By default, the name is device. |
|
Return from current view to lower level view |
quit |
Optional If the current view is user view, you will quit the current user interface. |
|
Return from current view to user view |
return |
Optional The composite key Ctrl+Z has the same effect with the return command. |
Displaying the System Status
|
To do… |
Use the command… |
Remarks |
|
Display the current date and time of the system |
display clock |
Available in any view |
|
Display the version of the system |
display version |
|
|
Display the information about users logging onto the device |
display users [ all ] |
Debugging the System
Enabling/Disabling System Debugging
The device provides a variety of debugging functions. Most of the protocols and features supported by the device are provided with corresponding debugging functions. These debugging functions help users diagnose and troubleshoot the system faults.
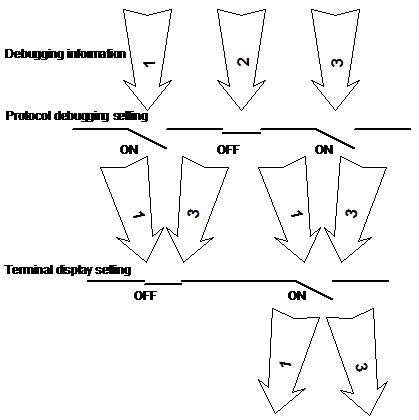
The output of debugging information is determined by the following two settings:
l Protocol debugging setting, which controls whether the debugging information of a protocol is output.
l Terminal display setting, which controls whether the debugging information is output to the screen of a specific user.
The relationship between the two settings is as follows:
Figure 2-1 Debugging information output
You can use the following commands to enable the two settings.
Follow these steps to enable debugging and terminal display for a specific module:
|
To do… |
Use the command… |
Remarks |
|
Enable system debugging for specific module |
debugging module-name [ debugging-option ] |
Required Disabled for all modules by default. |
|
Enable terminal display for debugging |
terminal debugging |
Required Disabled by default. |
![]()
The output of debugging information affects the system operation. Disable all debugging after you finish the system debugging.
Displaying Debugging Status
Follow these steps to display the current debugging status in the system:
|
Use the command… |
Remarks |
|
|
Display all enabled debugging on the current device |
display debugging [ unit unit-id ] [ interface interface-type interface-number ] [ module-name ] |
You can execute the display command in any view. |
Displaying Operating Information about Modules in System
When the device is in trouble, you may need to view a lot of operating information to locate the problem. Each functional module has its corresponding operating information display command(s). You can use the command here to display the current operating information about the modules in the system for troubleshooting your system.
Follow these steps to display the current operation information about the modules in the system:
|
To do… |
Use the command… |
Remarks |
|
Display the current operation information about the modules in the system. |
display diagnostic-information |
You can use this command in any view. You should execute this command twice to find the difference between the two executing results, thus helping locate the problem. |
Network Connectivity Test
ping
You can use the ping command to check the network connectivity and the reachability of a host.
Follow these steps to execute the ping command:
|
To do… |
Use the command… |
Remarks |
|
Check the IP network connectivity and the reachability of a host |
ping [ -a ip-address ] [-c count ] [ -d ] [ -f ] [ -h ttl ] [ -i interface-type interface-number ] [ ip ] [ -n ] [ - p pattern ] [ -q ] [ -s packetsize ] [ -t timeout ] [ -tos tos ] [ -v ] host |
You can execute this command in any view. |
This command can output the following results:
l Response status for each ping packet. If no response packet is received within the timeout time, the message "Request time out" is displayed. Otherwise, the number of data bytes, packet serial number, TTL (time to live) and response time of the response packet are displayed.
l Final statistics, including the numbers of sent packets and received response packets, the irresponsive packet percentage, and the minimum, average and maximum values of response time.
tracert
You can use the tracert command to trace the gateways that a packet passes from the source to the destination. This command is mainly used to check the network connectivity. It can also be used to help locate the network faults.
The executing procedure of the tracert command is as follows: First, the source host sends a data packet with the TTL of 1, and the first hop device returns an ICMP error message indicating that it cannot forward this packet because of TTL timeout. Then, the source host resends the packet with the TTL of 2, and the second hop device also returns an ICMP TTL timeout message. This procedure goes on and on until the packet gets to the destination. During the procedure, the system records the source address of each ICMP TTL timeout message in order to offer the path that the packet passed through to the destination.
Follow these steps to execute the tracert command:
|
To do… |
Use the command… |
Remarks |
|
View the gateways that a packet passes from the source host to the destination |
tracert [ -a source-ip ] [ -f first-ttl ] [ -m max-ttl ] [ -p port ] [ -q num-packet ] [ -w timeout ] string |
You can execute the tracert command in any view. |
Introduction to Device Management
Device Management includes the following:
l Reboot the device
l Configure real-time monitoring of the running status of the system
l Specify the main configuration file to be used at the next reboot
Device Management Configuration
Device Management Configuration Tasks
Complete the following tasks to configure device management:
|
Task |
Remarks |
|
Optional |
|
|
Optional |
|
|
Configuring Real-time Monitoring of the Running Status of the System |
Optional |
|
Specifying the Main Configuration File to be Used at Next Reboot |
Optional |
|
Optional |
Rebooting the Device
You can perform the following operation in user view when the device is faulty or needs to be rebooted.
![]()
Before rebooting, the system checks whether there is any configuration change. If yes, it prompts whether or not to proceed. This prevents the system from losing the configurations in case of shutting down the system without saving the configurations.
Follow the step below to reboot the device:
|
To do… |
Use the command… |
Remarks |
|
Reboot the device |
reboot [ unit unit-id ] |
Available in user view |
Scheduling a Reboot on the Device
After you schedule a reboot on the device, the device will reboot at the specified time.
Follow these steps to schedule a reboot on the device:
|
To do… |
Use the command… |
Remarks |
|
Schedule a reboot on the device, and set the reboot date and time |
schedule reboot at hh:mm [ mm/dd/yyyy | yyyy/mm/dd ] |
Optional |
|
Schedule a reboot on the device, and set the delay time for reboot |
schedule reboot delay { hh:mm | mm } |
Optional |
|
Enter system view |
system-view |
— |
|
Schedule a reboot on the device, and set the reboot period |
schedule reboot regularity at hh:mm period |
Optional |
![]()
The device timer can be set to precision of one minute, that is, the device will reboot within one minute after the specified reboot date and time.
Configuring Real-time Monitoring of the Running Status of the System
This function enables you to dynamically record the system running status, such as CPU, thus facilitating analysis and solution of the problems of the device.
Follow these steps to configure real-time monitoring of the running status of the system:
|
To do… |
Use the command… |
Remarks |
|
Enter system view |
system-view |
— |
|
Enable real-time monitoring of the running status of the system |
system-monitor enable |
Optional Enabled by default. |
![]()
Enabling of this function consumes some amounts of CPU resources. Therefore, if your network has a high CPU usage requirement, you can disable this function to release your CPU resources.
Specifying the Main Configuration File to be Used at Next Reboot
If multiple configuration files exist in the flash memory, you can use the command here to specify the one that will be used when the device reboots.
Follow the step below to specify the main configuration file to be used at reboot:
|
To do… |
Use the command… |
Remarks |
|
Specify the main configuration file to be used at next reboot |
startup saved-configuration filename [ main | backup ] |
Required |
Identifying and Diagnosing Pluggable Transceivers
Introduction to pluggable transceivers
At present, four types of pluggable transceivers are commonly used, and they can be divided into optical transceivers and electrical transceivers based on transmission media as shown in Table 4-1.
Table 4-1 Commonly used pluggable transceivers
|
Transceiver type |
Applied environment |
Whether can be an optical transceiver |
Whether can be an electrical transceiver |
|
SFP (Small Form-factor Pluggable) |
Generally used for 100M/1000M Ethernet interfaces or POS 155M/622M/2.5G interfaces |
Yes |
Yes |
|
GBIC (GigaBit Interface Converter) |
Generally used for 1000M Ethernet interfaces |
Yes |
Yes |
|
XFP (10-Gigabit small Form-factor Pluggable) |
Generally used for 10G Ethernet interfaces |
Yes |
No |
|
XENPAK (10 Gigabit EtherNet Transceiver Package) |
Generally used for 10G Ethernet interfaces |
Yes |
Yes |
![]()
For pluggable transceivers supported by the device, refer to H3C WX3000 Series Unified Switches Installation Guide.
Identifying pluggable transceivers
As pluggable transceivers are of various types and from different vendors, you can perform the following configurations to identify main parameters of the pluggable transceivers, including transceiver type, connector type, central wavelength of the laser sent, transfer distance and vendor name or vendor name specified.
Follow these steps to identify pluggable transceivers:
|
To do… |
Use the command… |
Remarks |
|
Display main parameters of the pluggable transceiver(s) |
display transceiver interface [ interface-type interface-number ] |
Available for all pluggable transceivers |
|
Display part of the electrical label information of the anti-spoofing transceiver(s) customized by H3C |
display transceiver manuinfo interface [ interface-type interface-number ] |
Available for anti-spoofing pluggable transceiver(s) customized by H3C only |
l You can use the Vendor Name field in the prompt information of the display transceiver interface command to identify an anti-spoofing pluggable transceiver customized by H3C. If the field is H3C, it is considered an H3C-customized pluggable transceiver.
l Electrical label information is also called permanent configuration data or archive information, which is written to the storage device of a card during device debugging or test. The information includes name of the card, device serial number, and vendor name or vendor name specified.
Diagnosing pluggable transceivers
The system outputs alarm information for you to diagnose and troubleshoot faults of pluggable transceivers. Optical transceivers customized by H3C also support the digital diagnosis function, which enables a transceiver to monitor the main parameters such as temperature, voltage, laser bias current, TX power, and RX power. When these parameters are abnormal, you can take corresponding measures to prevent transceiver faults.
Follow these steps to display pluggable transceiver information:
|
To do… |
Use the command… |
Remarks |
|
Display the current alarm information of the pluggable transceiver(s) |
display transceiver alarm interface [ interface-type interface-number ] |
Available for all pluggable transceivers |
|
Display the currently measured value of the digital diagnosis parameters of the anti-spoofing optical transceiver(s) customized by H3C |
display transceiver diagnosis interface [ interface-type interface-number ] |
Available for anti-spoofing pluggable optical transceiver(s) customized by H3C only |
Displaying and Maintaining the Device Management Configuration
|
To do… |
Use the command… |
Remarks |
|
Display the module type and operating status of each board |
display device [ manuinfo | unit unit-id ] |
Available in any view |
|
Display CPU usage of the device |
display cpu [ unit unit-id ] |
|
|
Display the operating status of the fan |
display fan [ unit unit-id [ fan-id ] ] |
|
|
Display memory usage of the device |
display memory [ unit unit-id ] |
|
|
Display the operating status of the power supply |
display power [ unit unit-id [ power-id ] ] |
|
|
Display system diagnostic information or save system diagnostic information to a file with the extension .diag into the flash memory |
display diagnostic-information |
|
|
Display enabled debugging on the current device |
display debugging [ unit unit-id ] [ interface interface-type interface-number ] [ module-name ] |