- Table of Contents
-
- 08-System Volume
- 00-System Volume Organization
- 01-Login Configuration
- 02-Basic System Configuration
- 03-Device Management Configuration
- 04-File System Management Configuration
- 05-SNMP Configuration
- 06-RMON Configuration
- 07-MAC Address Table Management Configuration
- 08-System Maintaining and Debugging Configuration
- 09-Information Center Configuration
- 10-PoE Configuration
- 11-Track Configuration
- 12-NQA Configuration
- 13-NTP Configuration
- 14-VRRP Configuration
- 15-HA Configuration
- 16-Hotfix Configuration
- 17-GR Overview
- Related Documents
-
| Title | Size | Download |
|---|---|---|
| 08-System Maintaining and Debugging Configuration | 68.91 KB |
1 System Maintaining and Debugging
System Maintaining and Debugging Overview
Introduction to System Maintaining and Debugging
Introduction to System Debugging
System Maintaining and Debugging
When maintaining and debugging the system, go to these sections for information you are interested in:
l System Maintaining and Debugging Overview
l System Maintaining and Debugging
System Maintaining and Debugging Overview
Introduction to System Maintaining and Debugging
You can use the ping command and the tracert command to verify the current network connectivity.
The ping command
You can use the ping command to verify whether a device with a specified address is reachable, and to examine network connectivity.
The ping command involves the following steps in its execution:
1) The source device sends an ICMP echo request to the destination device.
2) If the network is functioning properly, the destination device responds by sending an ICMP echo reply to the source device after receiving the ICMP echo request.
3) If there is network failure, the source device displays timeout or destination unreachable.
4) The source device displays related statistics.
Output of the ping command falls into the following:
l The ping command can be applied to the destination’s name or IP address. If the destination’s name is unknown, the prompt information is displayed.
l Information on the destination’s responses towards each ICMP echo request. If the source device does not receive an ICMP echo reply within the timeout time, it displays the prompt information. If the source device receives an ICMP echo reply within the timeout time, it displays the number of bytes of the echo reply, the message sequence number, Time to Live (TTL), the response time, and the statistics during the ping operation, which include number of packets sent, number of echo reply messages received, percentage of messages not received, and the minimum, average, and maximum response time.
The tracert command
By using the tracert command, you can trace the Layer 3 devices involved in delivering a packet from source to destination. This is useful for identification of failed node(s) in the event of network failure.
The tracert command involves the following steps in its execution:
1) The source device sends a packet with a TTL value of 1 to the destination device.
2) The first hop (the Layer 3 device that first receives the packet) responds by sending a TTL-expired ICMP message to the source, with its IP address encapsulated. In this way, the source device can get the address of the first Layer 3 device.
3) The source device sends a packet with a TTL value of 2 to the destination device.
4) The second hop responds with a TTL-expired ICMP message, which gives the source device the address of the second Layer 3 device.
5) The above process continues until the ultimate destination device is reached. In this way, the source device can trace the addresses of all the Layer 3 devices involved to get to the destination device.
Introduction to System Debugging
The device provides various debugging functions. For the majority of protocols and features supported, the system provides corresponding debugging information to help users diagnose errors.
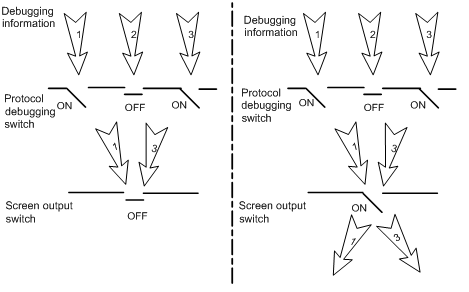
The following two switches control the display of debugging information:
l Protocol debugging switch, which controls protocol-specific debugging information
l Screen output switch, which controls whether to display the debugging information on a certain screen.
As Figure 1-1 illustrates, suppose the device can provide debugging for the three modules 1, 2, and 3. Only when both the protocol debugging switch and the screen output switch are turned on can debugging information be output on a terminal.
Figure 1-1 The relationship between the protocol and screen debugging switch
![]()
Outputting debugging information to a terminal is most commonly used. You can also configure to output debugging information to other directions. For detailed configuration, refer to Information Center Configuration in the System Volume.
System Maintaining and Debugging
System Maintaining
|
To do… |
Use the command… |
Remarks |
|
Check whether a specified IP address can be reached |
ping [ ip ] [ -a source-ip | -c count | -f | -h ttl | -i interface-type interface-number | -m interval | -n | -p pad | -q | -r | -s packet-size | -t timeout | -tos tos | -v | -vpn-instance vpn-instance-name ] * remote-system |
Optional Used in IPv4 network Available in any view |
|
ping ipv6 [ -a source-ipv6 | -c count | -m interval | -s packet-size | -t timeout ] * remote-system [ -i interface-type interface-number ] |
Optional Used in IPv6 network Available in any view |
|
|
View the routes from the source to the destination |
tracert [ -a source-ip | -f first-ttl | -m max-ttl | -p port | -q packet-number | -vpn-instance vpn-instance-name | -w timeout ] * remote-system |
Optional Used in IPv4 network Available in any view |
|
tracert ipv6 [ -f first-ttl | -m max-ttl | -p port | -q packet-number | -w timeout ] * remote-system |
Optional Used in IPv6 network Available in any view |
![]()
l For a low-speed network, you are recommended to set a larger value for the timeout timer (indicated by the -t parameter in the command) when configuring the ping command.
l Only the directly connected segment address can be pinged if the outgoing interface is specified with the -i argument.
l For detailed description of the ping lsp command, refer to MPLS Basics Commands in the MPLS Volume.
l For detailed description of the tracert lsp command, refer to MPLS Basics Commands in the MPLS Volume.
System Debugging
|
To do… |
Use the command… |
Remarks |
|
Enable the terminal monitoring of system information |
terminal monitor |
Optional The terminal monitoring on the console is enabled by default and that on the monitoring terminal is disabled by default. Available in user view |
|
Enable the terminal display of debugging information |
terminal debugging |
Required Disabled by default Available in user view |
|
Enable debugging for a specified module |
debugging { all [ timeout time ] | module-name [ option ] } |
Required Disabled by default Available in user view |
|
Display the enabled debugging functions |
display debugging [ interface interface-type interface-number ] [ module-name ] |
Optional Available in any view |
![]()
l The debugging commands are usually used by administrators in diagnosing network failure.
l Output of the debugging information may reduce system efficiency, especially during execution of the debugging all command.
l After completing the debugging, you are recommended to use the undo debugging all command to disable all the debugging functions.
l You must configure the debugging, terminal debugging and terminal monitor commands first to display the detailed debugging information on the terminal. For the detailed description on the terminal debugging and terminal monitor commands, refer to Information Center Commands in the System Volume.
System Maintaining Example
Network requirements
l The IP address of the destination device is 10.1.1.4.
l Display the Layer 3 devices involved while packets are forwarded from the source device to the destination device.
Network diagram (omitted here)
Configuration procedure
<Sysname> tracert 10.1.1.4
traceroute to 10.1.1.4 (10.1.1.4) 30 hops max, 40 bytes packet
1 128.3.112.1 19 ms 19 ms 0 ms
2 128.32.216.1 39 ms 39 ms 19 ms
3 128.32.136.23 39 ms 40 ms 39 ms
4 128.32.168.22 39 ms 39 ms 39 ms
5 128.32.197.4 40 ms 59 ms 59 ms
6 131.119.2.5 59 ms 59 ms 59 ms
7 129.140.70.13 99 ms 99 ms 80 ms
8 129.140.71.6 139 ms 239 ms 319 ms
9 129.140.81.7 220 ms 199 ms 199 ms
10 10.1.1.4 239 ms 239 ms 239 ms
The above output shows that nine Layer 3 devices are used from the source to the destination device.
