- Table of Contents
-
- 08-System Volume
- 00-System Volume Organization
- 01-Login Configuration
- 02-Basic System Configuration
- 03-Device Management Configuration
- 04-File System Management Configuration
- 05-SNMP Configuration
- 06-RMON Configuration
- 07-MAC Address Table Management Configuration
- 08-System Maintaining and Debugging Configuration
- 09-Information Center Configuration
- 10-PoE Configuration
- 11-Track Configuration
- 12-NQA Configuration
- 13-NTP Configuration
- 14-VRRP Configuration
- 15-HA Configuration
- 16-Hotfix Configuration
- 17-GR Overview
- Related Documents
-
| Title | Size | Download |
|---|---|---|
| 06-RMON Configuration | 67.93 KB |
When configuring RMON, go to these sections for information you are interested in:
l Displaying and Maintaining RMON
RMON Overview
This section covers these topics:
Introduction
Remote Monitoring (RMON) is implemented based on the Simple Network Management Protocol (SNMP) and is fully compatible with the existing SNMP framework without the need of any modification on SNMP.
RMON provides an efficient means of monitoring subnets and allows SNMP to monitor remote network devices in a more proactive and effective way. It reduces traffic between network management station (NMS) and agent, facilitating large network management.
RMON comprises two parts: NMSs and agents running on network devices.
l Each RMON NMS administers the agents within its administrative domain.
l An RMON agent resides on a network monitor or a network probe. It monitors and collects statistics on traffic over the network segments connected to its interfaces, such as the total number of packets passed through a network segment over a specified period, or the total number of good packets sent to a host.
Working Mechanism
RMON allows multiple monitors. A monitor provides two ways of data gathering:
l Using RMON probes. NMSs can obtain management information from RMON probes directly and control network resources. In this approach, RMON NMSs can obtain all RMON MIB information.
l Embedding RMON agents in network devices such as routers, switches, and hubs to provide the RMON probe function. RMON NMSs exchange data with RMON agents using basic SNMP commands to gather network management information, which, due to system resources limitation, may not cover all MIB information but four groups of information, alarm, event, history, and statistics, in most cases.
The device adopts the second way. By using RMON agents on network monitors, an NMS can obtain information about traffic size, error statistics, and performance statistics for network management.
RMON Groups
Among the ten RMON groups defined by RMON specifications (RFC 1757), the device supports the event group, alarm group, history group and statistics group. Besides, H3C also defines and implements the private alarm group, which enhances the functions of the alarm group. This section describes the five kinds of groups in general.
Event group
The event group defines event indexes and controls the generation and notifications of the events triggered by the alarms defined in the alarm group and the private alarm group. The events can be handled in one of the following ways:
l Logging event related information in the event log table
l Sending traps to NMSs
l Logging event information in the event log table and sending traps to NMSs
l No action
Alarm group
The RMON alarm group monitors specified alarm variables, such as statistics on a port. If the sampled value of the monitored variable is bigger than or equal to the upper threshold, an upper event is triggered; if the sampled value of the monitored variable is lower than or equal to the lower threshold, a lower event is triggered. The event is then handled as defined in the event group.
The following is how the system handles entries in the RMON alarm table:
1) Samples the alarm variables at the specified interval.
2) Compares the sampled values with the predefined threshold and triggers events if all triggering conditions are met.
![]()
If a sampled alarm variable overpasses the same threshold multiple times, only the first one can cause an alarm event. That is, the rising alarm and falling alarm are alternate.
Private alarm group
The private alarm group calculates the sampled values of alarm variables and compares the result with the defined threshold, thereby realizing a more comprehensive alarming function.
System handles the prialarm alarm table entry (as defined by the user) in the following ways:
l Periodically samples the prialarm alarm variables defined in the prialarm formula.
l Calculates the sampled values based on the prialarm formula.
l Compares the result with the defined threshold and generates an appropriate event.
![]()
If the count result overpasses the same threshold multiple times, only the first one can cause an alarm event. That is, the rising alarm and falling alarm are alternate.
History group
The history group periodically collects statistics on data at interfaces and saves the statistics in the history record table for query convenience. The statistics data includes bandwidth utilization, number of error packets, and total number of packets.
Once you successfully create a history entry in the specified interface, the history group starts to periodically collect statistics on packet at the specified interface. Each statistical value is a cumulative sum of packets sent/received on the interface during a sampling period.
Ethernet statistics group
The statistics group monitors port utilization. It provides statistics about network collisions, CRC alignment errors, undersize/oversize packets, broadcasts, multicasts, bytes received, packets received, and so on.
After the creation of a statistics entry on an interface, the statistics group starts to collect traffic statistics on the current interface. The result of the statistics is a cumulative sum.
Configuring RMON
Configuration Prerequisites
Before configuring RMON, configure the SNMP agent as described in SNMP Configuration in the System Volume.
Configuration Procedure
Follow these steps to configure RMON:
|
To do… |
Use the command… |
Remarks |
|
Enter system view |
system-view |
— |
|
Create an event entry in the event table |
rmon event entry-number [ description string ] { log | log-trap log-trapcommunity | none | trap trap-community } [ owner text ] |
Optional |
|
Enter Ethernet interface view |
interface interface-type interface-number |
— |
|
Create an entry in the history table |
rmon history entry-number buckets number interval sampling-interval [ owner text ] |
Optional |
|
Create an entry in the statistics table |
rmon statistics entry-number [ owner text ] |
Optional |
|
Exit Ethernet interface view |
quit |
— |
|
Create an entry in the alarm table |
rmon alarm entry-number alarm-variable sampling-interval { absolute | delta } rising-threshold threshold-value1 event-entry1 falling-threshold threshold-value2 event-entry2 [ owner text ] |
Optional |
|
Display log information for the specified or all event entries |
rmon prialarm entry-number prialarm-formula prialarm-des sampling-interval { absolute | changeratio | delta } rising-threshold threshold-value1 event-entry1 falling-threshold threshold-value2 event-entry2 entrytype { forever | cycle cycle-period } [ owner text ] |
Optional |
![]()
l A new entry cannot be created if its parameters are identical with the corresponding parameters of an existing entry Refer to Table 1-1 for the parameters to be compared for different entries.
l The system limits the total number of each type of entries (Refer to Table 1-1 for the detailed numbers). When the total number of an entry reaches the maximum number of entries that can be created, the creation fails.
l When you create an entry in the history table, if the specified buckets number argument exceeds the history table size supported by the device, the entry will be created. However, the validated value of the buckets number argument corresponding to the entry is the history table size supported by the device.
Table 1-1 Restrictions on the configuration of RMON
|
Entry |
Parameters to be compared |
Maximum number of entries that can be created |
|
Event |
Event description (description string), event type (log, trap, logtrap or none) and community name (trap-community or log-trapcommunity) |
60 |
|
History |
Sampling interval (interval sampling-interval) |
100 |
|
Statistics |
Only one statistics entry can be created on an interface. |
100 |
|
Alarm |
Alarm variable (alarm-variable), sampling interval (sampling-interval), sampling type (absolute or delta), rising threshold (threshold-value1) and falling threshold (threshold-value2) |
60 |
|
Prialarm |
Alarm variable formula (alarm-variable), sampling interval (sampling-interval), sampling type (absolute, changeratio or delta), rising threshold (threshold-value1) and falling threshold (threshold-value2) |
50 |
Displaying and Maintaining RMON
|
To do… |
Use the command… |
Remarks |
|
Display RMON statistics |
display rmon statistics [ interface-type interface-number ] |
Available in any view |
|
Display the RMON history control entry and history sampling information |
display rmon history [ interface-type interface-number ] |
Available in any view |
|
Display RMON alarm configuration information |
display rmon alarm [ entry-number ] |
Available in any view |
|
Display RMON prialarm configuration information |
display rmon prialarm [ entry-number ] |
Available in any view |
|
Display RMON events configuration information |
display rmon event [ entry-number ] |
Available in any view |
|
Display RMON event log information |
display rmon eventlog [ entry-number ] |
Available in any view |
RMON Configuration Example
Network requirements
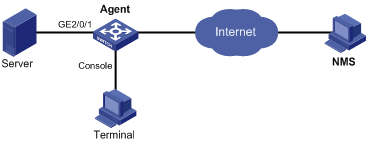
Agent is connected to a configuration terminal through its console port and to a remote NMS across the Internet.
Create an entry in the RMON Ethernet statistics table to gather statistics on GigabitEthernet 2/0/1, and enable logging after received bytes exceed the specified threshold.
Network diagram
Figure 1-1 Network diagram for RMON
Configuration procedure
# Configure RMON to gather statistics for interface GigabitEthernet 2/0/1.
<Sysname> system-view
[Sysname] interface GigabitEthernet 2/0/1
[Sysname-GigabitEthernet2/0/1] rmon statistics 1 owner user1-rmon
[Sysname-GigabitEthernet2/0/1] quit
# Display RMON statistics for interface GigabitEthernet 2/0/1.
<Sysname> display rmon statistics GigabitEthernet 2/0/1
Statistics entry 1 owned by user1-rmon is VALID.
Interface : GigabitEthernet2/0/1<ifIndex.3>
etherStatsOctets : 21657 , etherStatsPkts : 307
etherStatsBroadcastPkts : 56 , etherStatsMulticastPkts : 34
etherStatsUndersizePkts : 0 , etherStatsOversizePkts : 0
etherStatsFragments : 0 , etherStatsJabbers : 0
etherStatsCRCAlignErrors : 0 , etherStatsCollisions : 0
etherStatsDropEvents (insufficient resources): 0
Packets received according to length:
64 : 235 , 65-127 : 67 , 128-255 : 4
256-511: 1 , 512-1023: 0 , 1024-1518: 0
# Create an event to start logging after the event is triggered.
<Sysname> system-view
[Sysname] rmon event 1 log owner 1-rmon
# Configure an alarm group to sample received bytes on GigabitEthernet 2/0/1. When the received bytes exceed the upper or below the lower limit, logging is enabled.
[Sysname] rmon alarm 1 1.3.6.1.2.1.16.1.1.1.4.1 10 delta rising-threshold 1000 1 falling-threshold 100 1 owner 1-rmon
[Sysname] display rmon alarm 1
Alarm table 1 owned by 1-rmon is VALID.
Samples type : delta
Variable formula : 1.3.6.1.2.1.16.1.1.1.4.1<etherStatsOctets.1>
Sampling interval : 10(sec)
Rising threshold : 1000(linked with event 1)
Falling threshold : 100(linked with event 1)
When startup enables : risingOrFallingAlarm
Latest value : 2552
