- Table of Contents
-
- H3C HDM Configuration Examples-6W100
- 01-H3C Redfish Configuration Examples
- 02-H3C LDAP Configuration Examples
- 03-H3C IPMI Configuration Examples
- 04-H3C SNMP Configuration Examples
- 05-H3C HDM Mobile Configuration Examples for Remote Access to a Server Through L2TP VPN
- 06-H3C HDM Configuration Examples for Obtaining Event Logs Through the Redfish Interface
- 07-H3C HDM SMTP Configuration Examples
- 08-H3C HDM Zabbix-Based Server Monitoring Configuration Examples
- 09-H3C HDM Network Settings Configuration Examples
- 10-H3C hREST Configuration Examples for Configuring SNMP and Obtaining the CPU Information
- 11-H3C HDM Configuration Management Configuration Examples
- 12-HDM AD Configuration Examples
- 13-H3C HDM SOL Configuration Examples
- 14-HDM Unified Control Configuration Examples
- Related Documents
-
| Title | Size | Download |
|---|---|---|
| 08-H3C HDM Zabbix-Based Server Monitoring Configuration Examples | 1.09 MB |
H3C HDM
Zabbix-Based Server Monitoring Configuration Examples
Copyright © 2023 New H3C Technologies Co., Ltd. All rights reserved.
No part of this manual may be reproduced or transmitted in any form or by any means without prior written consent of New H3C Technologies Co., Ltd.
Except for the trademarks of New H3C Technologies Co., Ltd., any trademarks that may be mentioned in this document are the property of their respective owners.
The information in this document is subject to change without notice.
Introduction
The following information provides examples for configuring the Zabbix software to monitor a target server through the HDM SNMP interface. Zabbix is enterprise-class open source software that provides distributed system monitoring and network monitoring functions based on the Web interface. Zabbix can monitor the health status of servers through the Simple Network Management Protocol (SNMP).
Prerequisites
Procedures and information in the examples might be slightly different depending on the software or hardware version of the products.
The configuration was created and verified in a lab environment, and all the servers and software were started with the factory default configuration. When you are working on a live network, make sure you understand the potential impact of every command on your network.
The following information is provided based on the assumption that you have learned about the Zabbix and HDM SNMP related functions.
Applicable scenarios
The following information is applicable to scenarios where you need to obtain the server information and monitor the server status through Zabbix so that alarms can be detected in time and server problems can handled as soon as possible.
Example: Using Zabbix to monitor servers
Network configuration
As shown in Figure 1, the target server (H3C UniServer R4900 G5 server in this example) communicates with the Zabbix server and PC client normally after the HDM management IP address of the target server and IP addresses of the Zabbix server and PC client are configured properly. It is required that users can navigate to the Zabbix Web page through the PC, and monitor the health status of the server through the HDM SNMP interface.
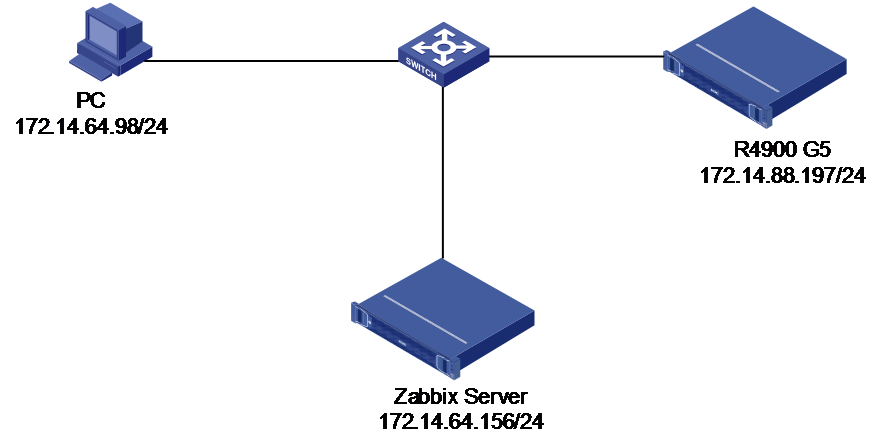
· HDM software:
¡ IP address: 172.14.88.197/24
¡ Administrator account: admin
¡ Administrator password: Password@_
· Zabbix server:
¡ IP address: 172.14.64.156/24
¡ URL:172.14.64.156/zabbix
¡ Zabbix username: Admin
¡ Zabbix password: zabbix
· PC client:
¡ IP address: 172.14.64.98/24
Software versions used
This configuration example was created and verified on HDM 2.63 and Zabbix 4.0.36.
Restrictions and guidelines
Ensure that the Zabbix server is running normally. In addition, configure the IP address of the Zabbix server, HDM management IP address, and IP address of the PC properly to ensure normal communication.
Procedures
Configuring HDM SNMP
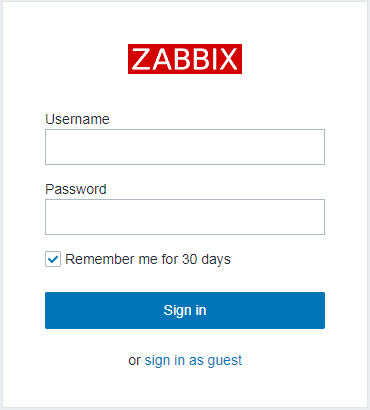
1. Open a browser on the PC, and enter the HDM management IP address 172.14.88.197 to open the HDM login page, as shown in Figure 2. On the HDM login page, enter the default username admin and the default password Password@_, and click Login.

2. On the service configuration page shown in Figure 3, check whether the SNMP service is enabled. If not, enable the SNMP service and configure the SNMP port number.

3. On the SNMP tab shown in Figure 4, configure the SNMP version and read-only community name.
¡ SNMP version: Select an SNMP version available for SNMP GET and SET operations. Options include v1 and v2c. This document takes In this example, set this parameter to v2c.
¡ Read-only community string: Enter the read-only community name. In this example, set this parameter to public.

Configuring the Zabbix server
1. Visit the H3C official website, navigate to the HDM 2.63 firmware download page, and download the MIB file of the corresponding HDM version.
2. Log in to the Zabbix server and upload the MIB file hh3c-server-agent.mib to the specified directory /usr/share/snmp/mibs on the Zabbix server, as shown in Figure 5. After the file is uploaded, execute the restart command to restart the Zabbix server.
Figure 5 Uploading the MIB file
![]()
Configuring data on the Zabbix Web page
Adding a host
1. Open a browser on the PC, and enter the IP address of the Zabbix server 172.16.64.156/zabbix to navigate to the Zabbix Web page, as shown in Figure 6. On the login page, enter the default username Admin and default password zabbix, and click Sign in.
2. (Optional) After successful login, you can click the current login user and change the interface language in the user information.
3. Select Configuration > Hosts to navigate to the Host page, as shown in Figure 7.

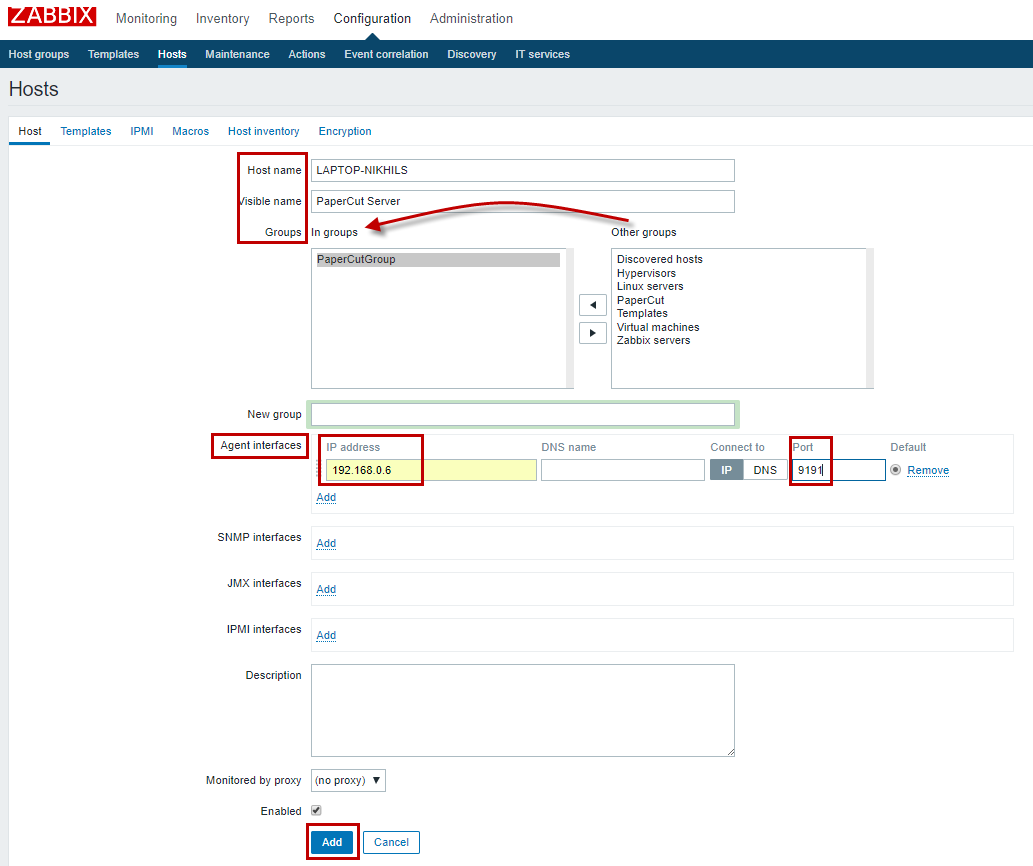
4. Click Create host in the upper right corner. On the page as shown in Figure 8, enter the host information.
a. Enter Host name and Visible name (optional). In this example, enter 172.14.88.197.
b. Set Group to Linux servers, because HDM is a management software developed based on the Linux system.
c. Click Remove in the Agent interface area to remove the default agent interface.
d. Click Add in the SNMP interface area, add an SNMP interface, enter the HDM management IP address and SNMP management port number (the default port number is 161).
Figure 8 Configuring the host information
5. After the host is added, the added server is displayed in the host list, as shown in Figure 9.
6. Click the target host, and select Macros > Inherited and host macros. On the Inherited and host macros tab as shown in Figure 10, set Effective value of the host macro to the SNMP read-only community name public of the HDM Web page.
Figure 10 Configuring the macro information

Adding an application set
The application set is a collection of monitoring items (monitored SNMP nodes). That is, the application set is used to classify monitoring items.
1. Click Application set of the target server. The application set page opens, as shown in Figure 11.

2. Click Create Application Set on the upper right to open the Create Application Set page. You can add application sets according to actual requirements. In this example, the application set added is CPU.
Adding a monitoring item
The monitoring item refers to a monitored SNMP node. For the nodes supported by the server, see the HH3C-SERVER-AGENT-MIB downloaded in "Configuring the Zabbix server."
Monitoring items are classified into two types:
· Property monitoring item: Only one property of the node, for example, the CPU serial number, can be monitored. The return value is the property value or N/A.
· Status monitoring item: Only the status of the node, for example, the CPU health status, can be monitored. The return value is the status.
1. Click Monitoring item of the target server. The monitoring item page opens, as shown in Figure 12.

2. Click Create Monitoring Item in the upper right corner. On the page as shown in Figure 13, enter the information about the monitoring item.
¡ Customize the name. In this example, set this parameter to hh3cCPUSerialNumber_cpu1.
¡ Set Type to the SNMPv2 client.
¡ Key value is the node name (hh3cCPUSerialNumber), which can be found from the MIB file as shown in Figure 14. There may be multiple CPUs and these CPUs have different serial numbers. Therefore, add "1" after the required name to distinguish CPUs.
¡ Set Host interface to the target server.
¡ Set SNMP OID to the OID of the node, which can be found from the MIB file as shown in Figure 14. Because "1" is added after the node name, you also need to add "1" after the OID for identification purpose.
¡ Set SNMP community to the read-only community name public configured in "Configuring HDM SNMP."
¡ Set Information type to Character.
¡ Set Application set to CPU.
¡ Retain default settings for other parameters.
Figure 13 Creating a monitoring item


3. Repeat the above operations, and change the suffixes of the key value and SNMP OID to "2" to add the monitoring item CPU2.
4. Create a status monitoring item to monitor the CPU health status.
¡ Customize the name. In this example, set this parameter to hh3cCPUHealthStatus.0.
¡ Set Type to the SNMPv2 client.
¡ Key value is the node name (hh3cCPUHealthStatus), which can be found from the MIB file as shown in Figure 15. Because the CPU health status is the overall health status of multiple CPUs, add "0" after the node name.
¡ Set Host interface to the target server.
¡ Set SNMP OID to the OID of the node, which can be found from the MIB file as shown in Figure 15. Because "0" is added after the node name, you also need to add "0" after the OID.
¡ Set SNMP community to the read-only community name public configured in "Configuring HDM SNMP."
¡ Set Information type to Character.
¡ Set Application set to CPU.
¡ Retain default settings for other parameters.

Adding a trigger
The trigger is a criterion used by the Zabbix system to determine whether it is necessary to trigger an alarm based on the return value. The monitoring item hh3cCPUHealthStatus is taken as an example in the following description.
Hh3cCPUHealthStatus is classified into four levels, which correspond to the following return values: 0 (Normal), 1 (Warning), 2 (Major), and 3 (Critical). Except the normal state, an alarm is triggered for any of other three states. Therefore, you need to create three triggers for this monitoring item.
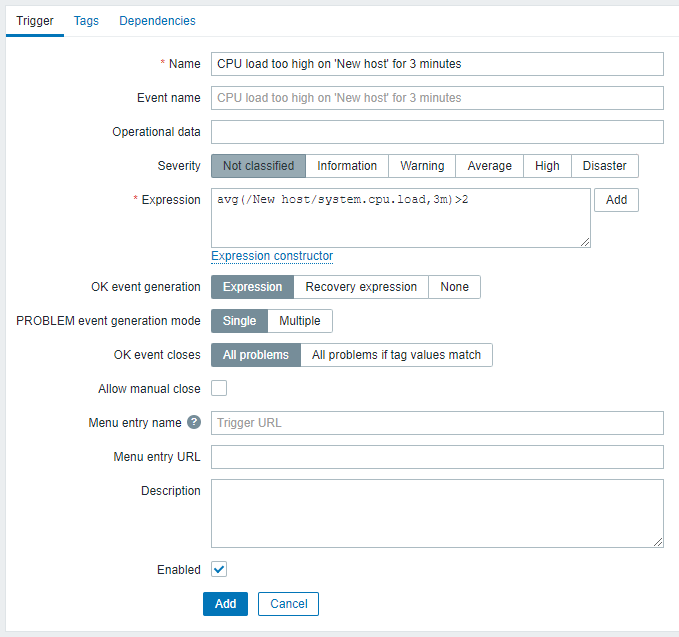
1. Click Trigger of the target server as shown in Figure 9. The trigger page opens, as shown in Figure 16.
2. Click Create Trigger in the upper right corner. Enter the trigger information.
¡ Customize the name. In this example, set this parameter to hh3cCPUHealthStatus_caution.
¡ Select the severity of the trigger. In this example, set this parameter to Warning.
¡ Click Edit in the Expression area, and enter relevant information in the dialog box as shown in _Ref90038381.
- Set Monitoring item to the added monitoring item, that is, hh3cCPUHealthStatus.0 in this example.
- Set Function to str() –Find string V in the last (most recent) value (1-Found; 0: Not Found).
- Set V to 1, which is the return value of the Warning level. For details about return values, see the MIB file.
- Set Last one (T) to 1, indicating one cycle.
- Set Result to 1, indicating the return value of the string V is found.
¡ Retain default settings for other parameters.
Figure 17 Creating a trigger of the Warning level
3. Repeat the above operations, and change the value of V to the return value of the corresponding severity when editing the expression to add a trigger of another level, as shown in Figure 18 and Figure 19.
Figure 18 Creating a trigger of the Major level

Figure 19 Creating a trigger of the Critical level
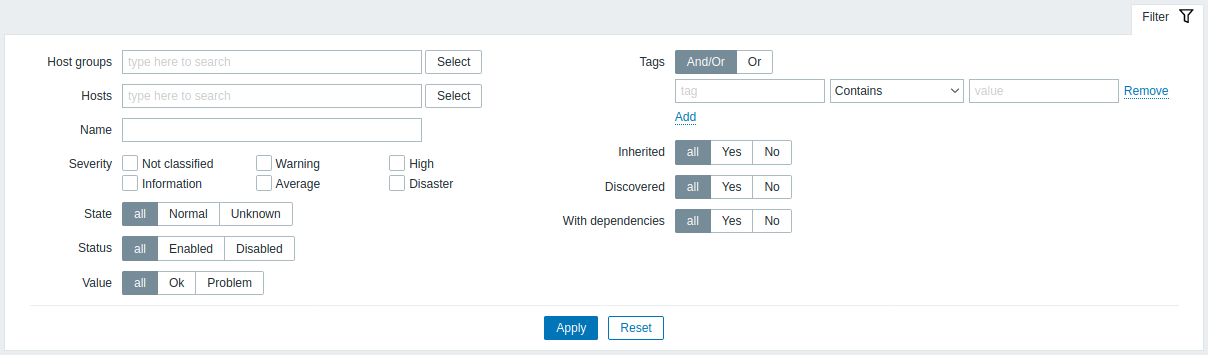
4. After the trigger is created, return to the Trigger page to check the trigger list, as shown in Figure 20.
Verifying the configuration
Verifying monitoring items
1. Select Monitoring > Latest Data, and view the latest data of the three added monitoring items, as shown in Figure 21.
¡ The latest data of hh3cCPUHealthStatus.0 is 0, indicating that the CPU health status is normal.
¡ The latest data of hh3cCPUSerialNumber_cpu1 is A5-9B-81-E3-00-15-F1-85, indicating that the CPU1 serial number is A5-9B-81-E3-00-15-F1-85.
¡ The latest data of hh3cCPUSerialNumber_cpu2 is N/A, indicating that the CPU2 serial number is not obtained.
Figure 21 Data of monitoring items
![]()
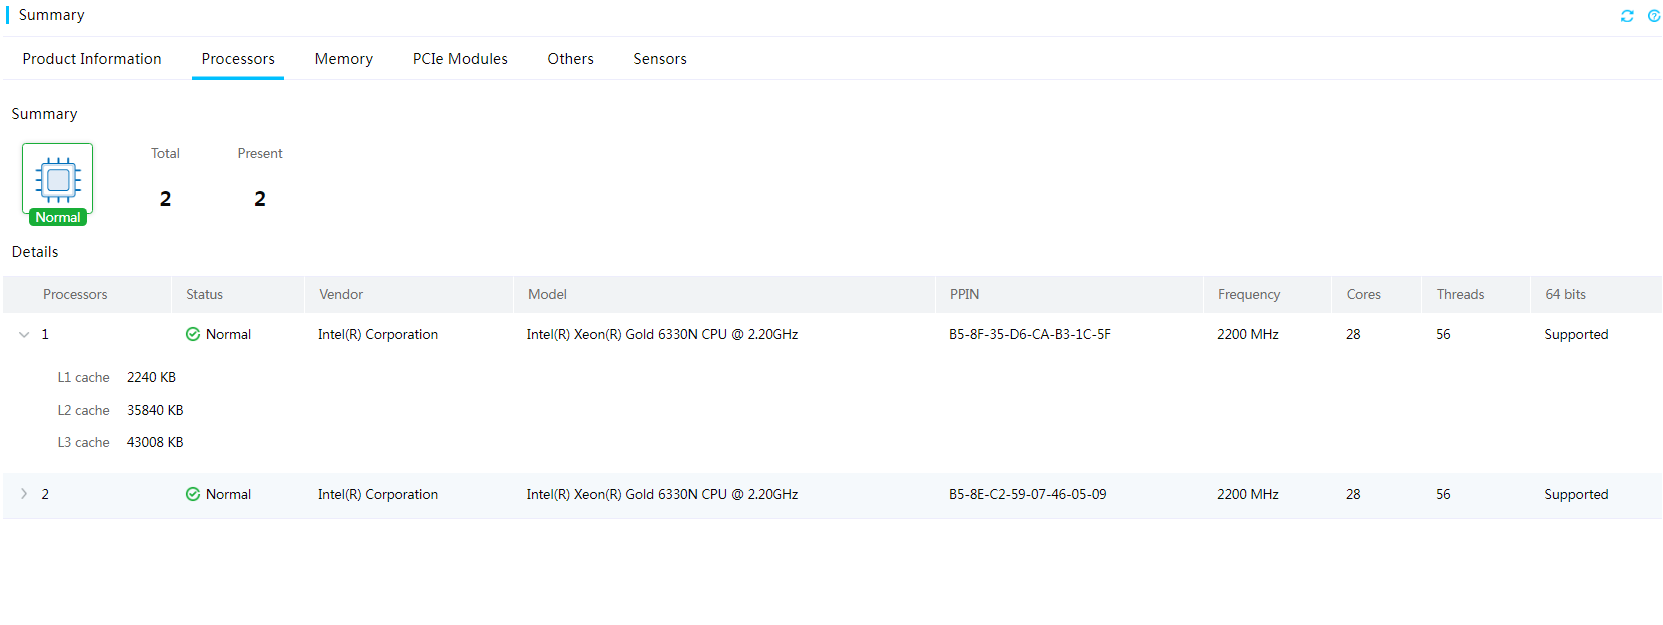
2. Log in to the HDM Web page, navigate to the processor page as shown in Figure 22, and check the CPU health status and CPU serial number (indicated by PPIN in the list). The data is consistent with the latest data monitored by Zabbix.
Verifying triggers
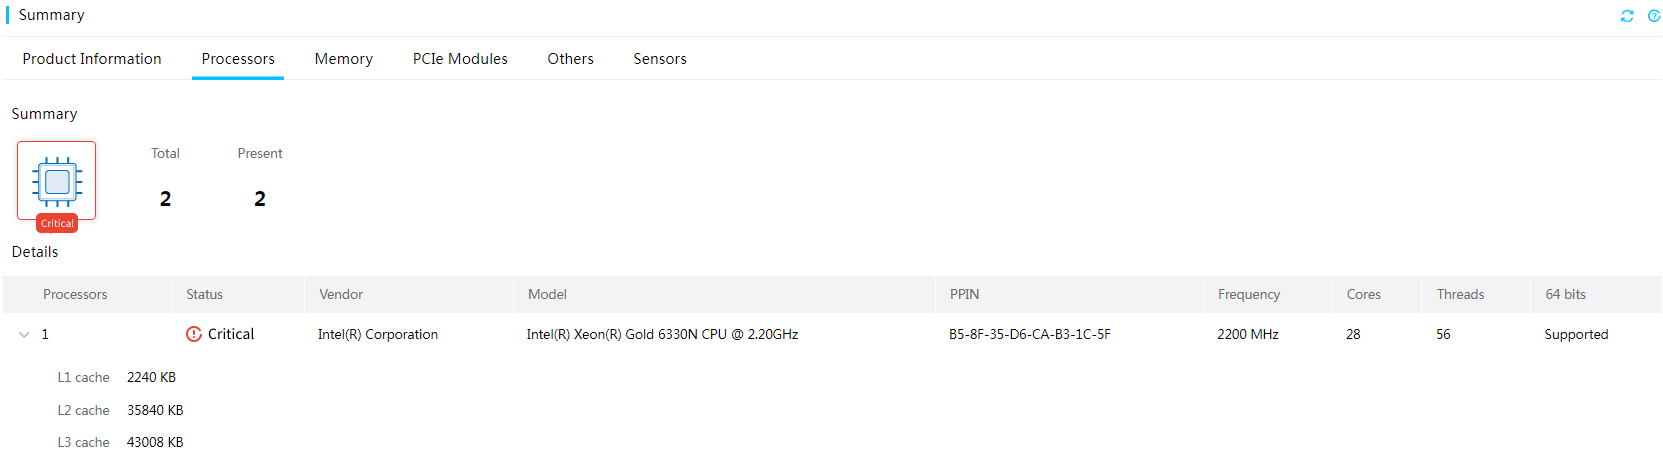
1. Use a technical means to simulate and trigger a CPU alarm. The alarm information on the HDM Web page is shown in Figure 23.
Figure 23 CPU alarm information
2. Log in to the Zabbix Web page, and navigate to the trigger page as shown in Figure 24. The trigger of the Critical level (return value: 3) indicates that a critical alarm is generated, which is consistent with the Critical alarm information (return value in the MIB file: 3) on the HDM Web page.
Figure 24 Alarm information indicated by triggers
3. Navigate to the dashboard page. The host group of the target server also indicates that a critical alarm is generated.
Related documentation
· H3C HDM Technology White Paper
· H3C Servers HDM User Guide
