- Table of Contents
-
- H3C HDM Configuration Examples-6W100
- 01-H3C Redfish Configuration Examples
- 02-H3C LDAP Configuration Examples
- 03-H3C IPMI Configuration Examples
- 04-H3C SNMP Configuration Examples
- 05-H3C HDM Mobile Configuration Examples for Remote Access to a Server Through L2TP VPN
- 06-H3C HDM Configuration Examples for Obtaining Event Logs Through the Redfish Interface
- 07-H3C HDM SMTP Configuration Examples
- 08-H3C HDM Zabbix-Based Server Monitoring Configuration Examples
- 09-H3C HDM Network Settings Configuration Examples
- 10-H3C hREST Configuration Examples for Configuring SNMP and Obtaining the CPU Information
- 11-H3C HDM Configuration Management Configuration Examples
- 12-HDM AD Configuration Examples
- 13-H3C HDM SOL Configuration Examples
- 14-HDM Unified Control Configuration Examples
- Related Documents
-
| Title | Size | Download |
|---|---|---|
| 06-H3C HDM Configuration Examples for Obtaining Event Logs Through the Redfish Interface | 460.45 KB |
H3C HDM
Configuration Examples for Obtaining Event Logs Through the Redfish Interface
Copyright © 2022 New H3C Technologies Co., Ltd. All Rights Reserved.
No part of this manual may be reproduced or transmitted in any form or by any means without prior written consent of New H3C Technologies Co., Ltd.
Except for the trademarks of New H3C Technologies Co., Ltd., any trademarks that may be mentioned in this document are the property of their respective owners.
The information in this document is subject to change without notice.
Example: Querying event logs through the Postman software
Example: Subscribing to event logs through Redfish in the Linux operating system
Introduction
The following information describes how to use the HDM Redfish interface to query and subscribe to event logs.
Prerequisites
Procedures and information in the examples might be slightly different depending on the software or hardware version of the products.
The configuration was created and verified in a lab environment, and all the servers and software were started with the factory default configuration. When you are working on a live network, make sure you understand the potential impact of every command on your network.
In this document, we assume that you have basic knowledge of the Redfish feature.
Applicable scenarios
The following information applies to the scenarios where the HDM information needs to be quickly obtained through the Redfish interface. Based on the obtained HDM information, the O&M tool can generate alarms in time and therefore server problems can be responded to and handled as soon as possible.
Example: Querying event logs through the Postman software
Network configuration
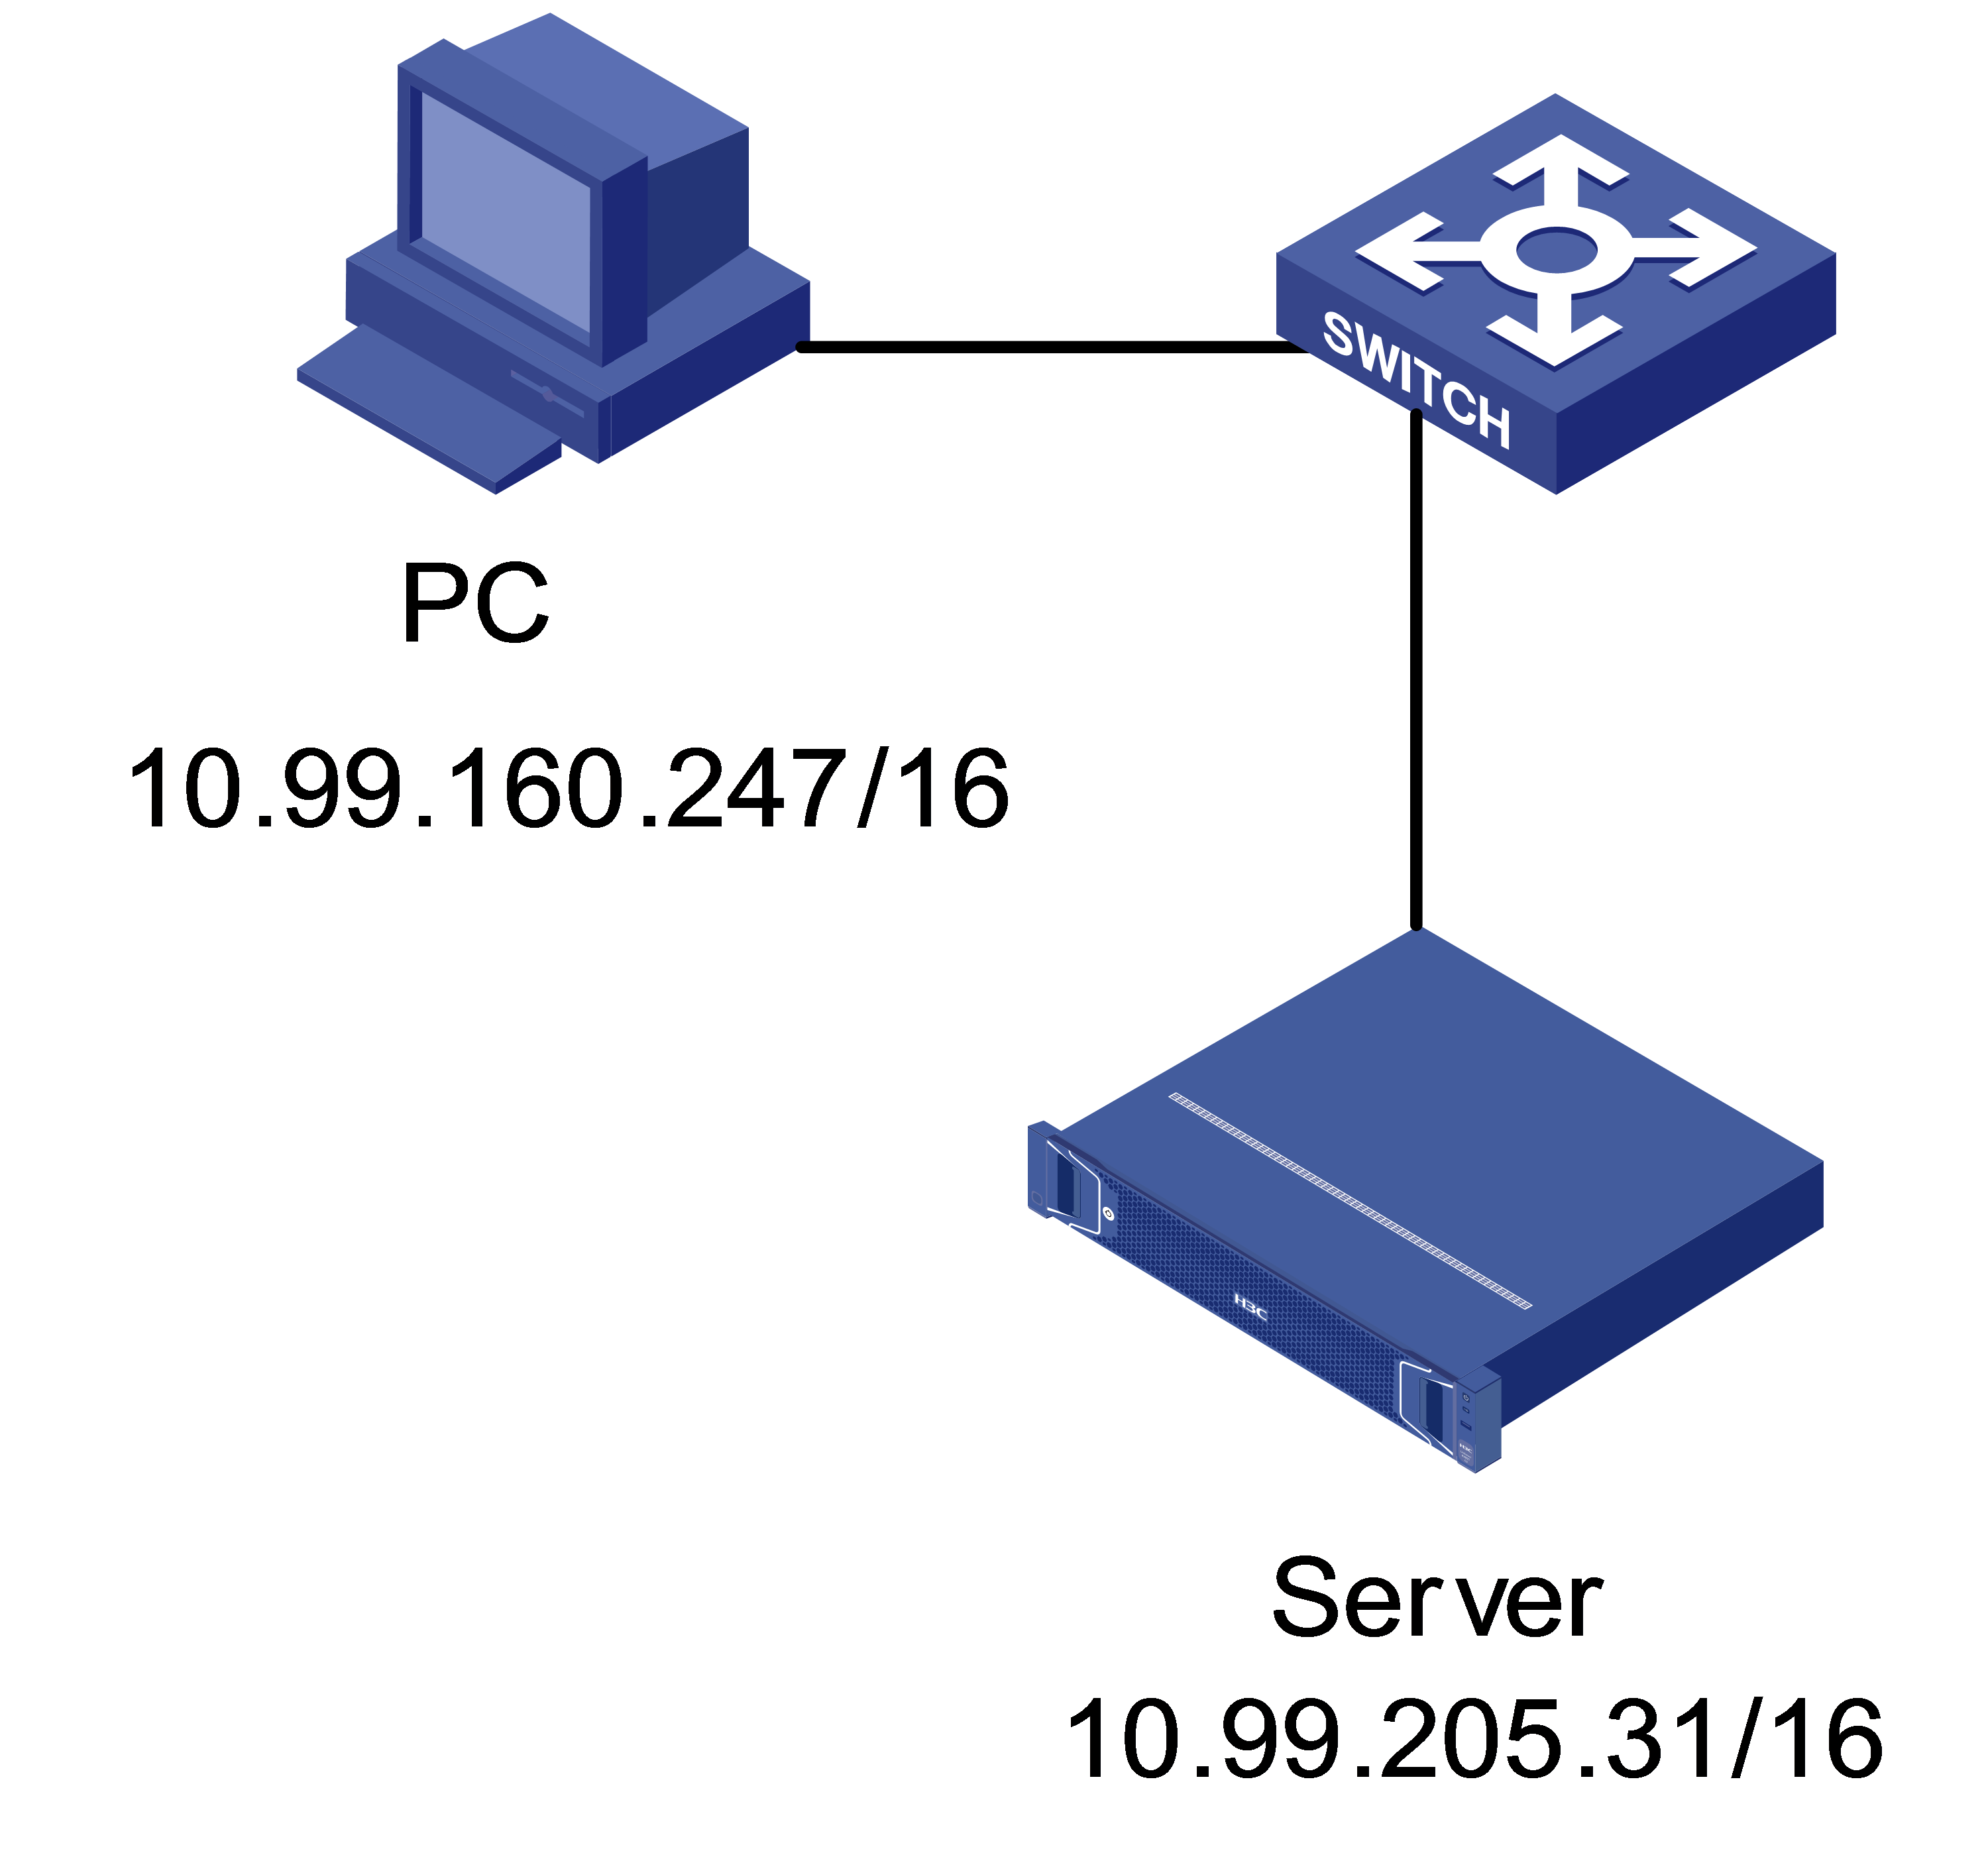
As shown in Figure 1, the user's PC is connected to the server (R4900 G5 in this example) through the HDM dedicated port. The network connection is normal, and the PC can access HDM on the server normally. It is required that the user can uses the Postman tool installed on the PC to query the HDM event log of the server. (Postman is an API tool that can be used to send and view HTTP requests.)
· Server HDM:
¡ HDM IP address: 10.99.205.31/16
¡ HDM administrator account: admin
¡ HDM administrator password: Password@_
· PC:
¡ OS IP address: 10.99.160.247/16
¡ OS: Windows 7
Analysis
To query the specified event log, query the resource information of the event log service collection, obtain the next level URL in the response body until you obtain the URL of the specific event log entry. Then, access the specified event log entry.
Software versions used
This example was created and verified on HDM 2.52 and Postman 6.7.4.
Procedures
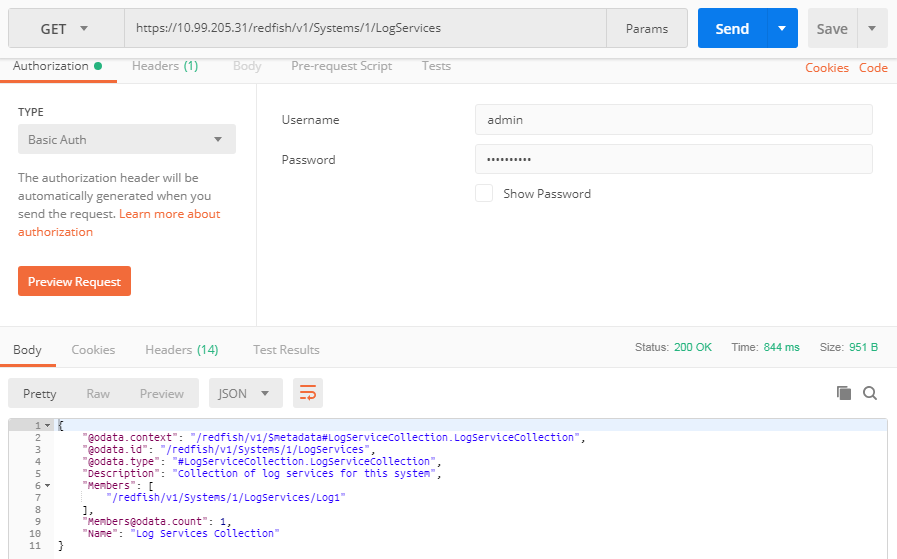
1. Query the resource information of the event log service collection. As shown in Figure 2, launch Postman, set the authentication type (TYPE) to Basic Auth, enter the username and password, select the GET operation, enter https://10.99.205.31/redfish/v1/Systems/1/LogServices, and click Send.
2. In the Members field of the response body, obtain the URL /redfish/v1/Systems/1/LogServices/Log1 of the specified event log service resource list.
Figure 2 Obtaining the event log (1)
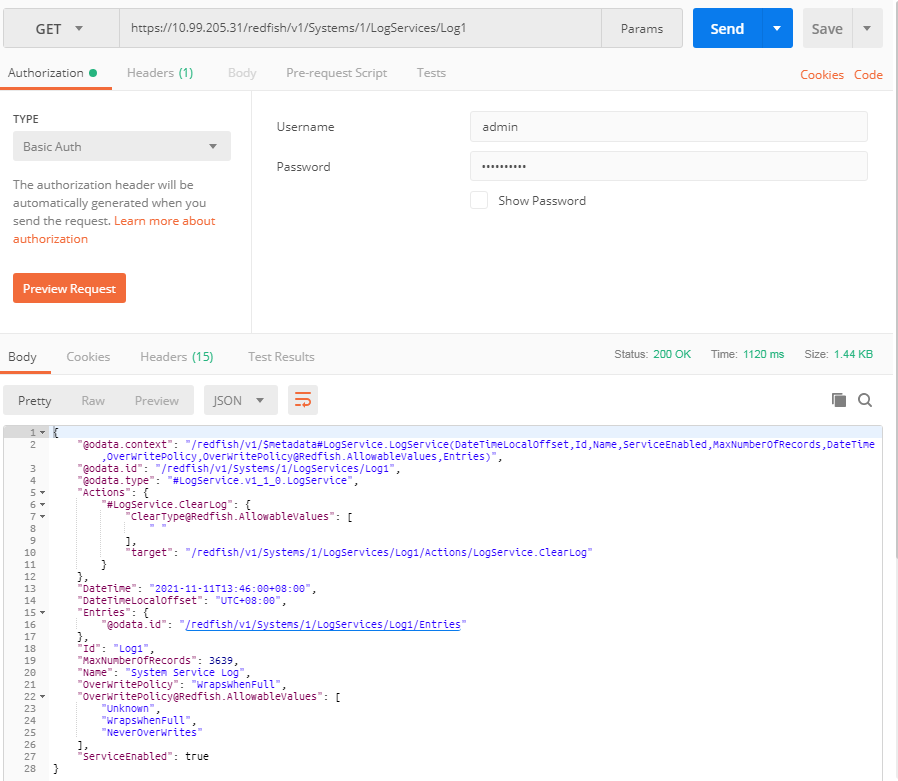
3. Query the resource information of a specified event log service collection. Click the URL /redfish/v1/Systems/1/LogServices/Log1 obtained in the previous step, set the authentication type to Basic Auth, and click Send.
4. As shown in Figure 3, obtain the URL /redfish/v1/Systems/1/LogServices/Log1/Entries of the resource information of the event log collection in the [email protected] field of the response body.
Figure 3 Obtaining the event log (2)
5. Query the resource information of the event log collection. Click the URL /redfish/v1/Systems/1/LogServices/Log1/Entries obtained in the previous step, set the authentication type to Basic Auth, and click Send.
6. As shown in Figure 4, view the event log list in the Members field of the response body. This field indicates that HDM currently has a total of 2380 logs, and the path of the latest event log is /redfish/v1/Systems/1/LogServices/Log1/Entries/2380.
Figure 4 Obtaining the event log (3)

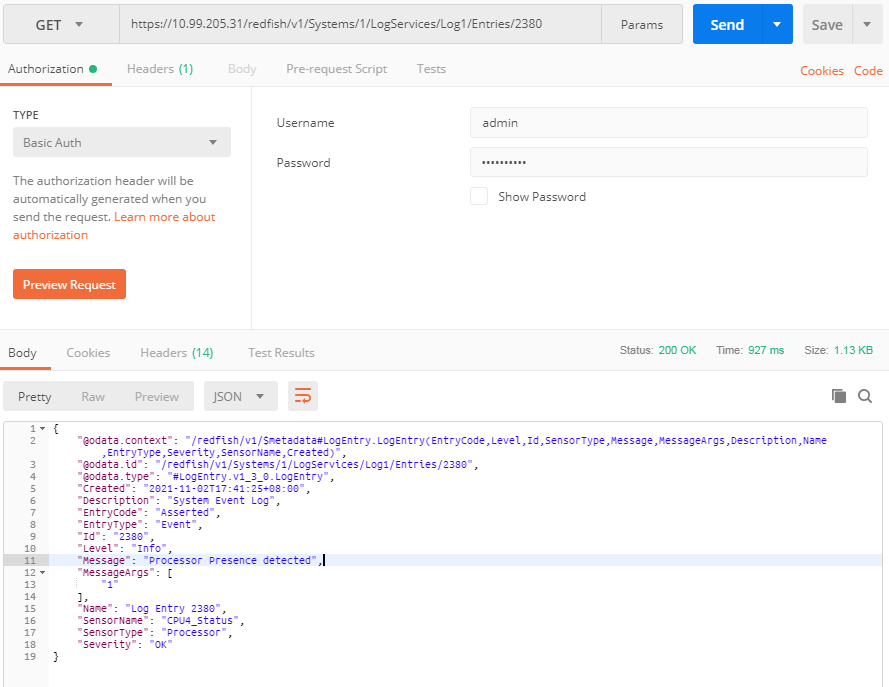
7. Query a specified event log. Click the URL /redfish/v1/Systems/1/LogServices/Log1/Entries/2380 obtained in the previous step, set the authentication type to Basic Auth, and click Send.
8. As shown in Figure 5, the Message field in the response body contains the event log "Processor Presence detected."
Figure 5 Obtaining the event log (4)
Verifying the result
Log in to HDM, and select Remote O&M > Event Log. There are a total of 2380 event logs, and the 2380th log is "Processor Presence detected", which is consistent with the event log obtained through Postman.
![]()
Example: Subscribing to event logs through Redfish in the Linux operating system
Network configuration
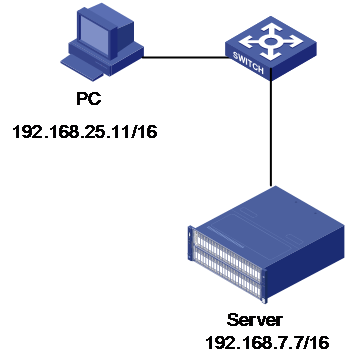
As shown in Figure 7, HDM running on the server (R6900 G5 in this example) is connected to the PC where the event subscription server is built through the dedicated port, and the HDM and PC are in the same network segment. Firewall is disabled on the event subscription server. It is required that the event subscription server be configured to actively report HDM event logs through the Redfish interface.
· PC where the event subscription server is built:
¡ OS IP address: 192.168.25.11/16
¡ OS: Red Hat Enterprise Linux 7.8
¡ Python version: Python 3.6.5
· Server HDM:
¡ HDM IP address: 192.168.7.7/16
¡ HDM administrator account: admin
¡ HDM administrator password: Password@_
Analysis
1. Prepare the Python environment where the event subscription server runs.
2. Configure the configuration file of the event subscription server, and specify the IP address, login user name and password of the HDM.
3. Run the event subscription server.
Software versions used
This example was created and verified on the following versions
· HDM: 2.52
· Python: 3.6.5
· Redfish-Event-Listener-master (event log subscription tool): 1.0.2
Procedures
1. Download Redfish-Event-Listener-master. As a best practice, download this tool from Github.
2. As shown in Figure 8, decompress the tool installation package, and switch to the Redfish-Event-Listener-master directory.
Figure 8 Decompressing Redfish-Event-Listener-master

3. Run Redfish-Event-Listener-master, enter the python3 Redfish-Event-Listener-master.py command, and check and install the missing dependency libraries. When the script is executed for the first time, some components (for example, urllib3) may be missing, as shown in Figure 9.
Figure 9 Error message indicating that a library is missing

4. Install the missing components according to the prompts. After all the dependency libraries are installed, the event subscription server can run normally, as shown in Figure 10.
Figure 10 Running the event subscription server

5. Execute the vim config.ini command to modify the config.ini file. Modify the IP address of the event subscription server, HDM IP address, user name and password according to the network configuration.
[Information]
Updated = April 24, 2017
Description = Redfish Event Listener Tool
[SystemInformation]
ListenerIP = 0.0.0.0
ListenerPort = 443
UseSSL = on
[CertificateDetails]
certfile = cert.pem
keyfile = server.key
[SubsciptionDetails]
Destination = https://192.168.25.11 #IP address of the event subscription server
EventTypes = Alert
Context = Public
Protocol = Redfish
SubscriptionURI = /redfish/v1/EventService/Subscriptions
[ServerInformation]
ServerIPs = https://192.168.7.7 #HDM IP address
UserNames = admin #HDM username
Passwords = Password@_ #HDM password
certcheck = off
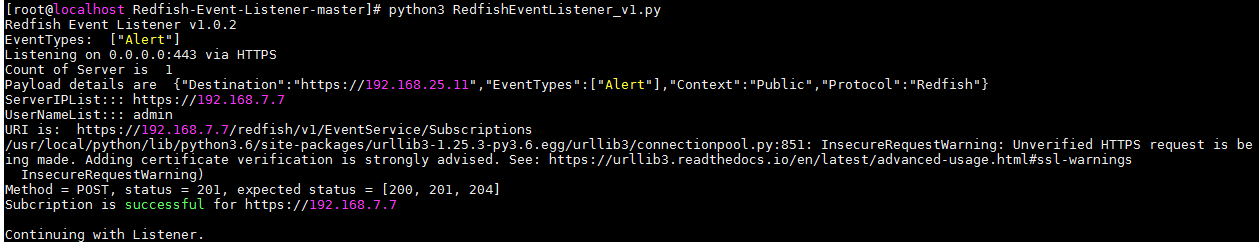
6. Execute the Python3 RedfishEventListener_v1.py command to enable event subscription monitoring, as shown in Figure 11. Then the event subscription server calls the Redfish interface to start subscribing to the HDM event logs.
Figure 11 Enabling event subscription monitoring
Verifying the function
1. Simulate a fault. Disconnect the network cable from the HDM shared port to simulate a LAN Leash Lost fault. Log in to the HDM Web page, and select Remote O&M > Event Log. The generated fault information is displayed, as shown in Figure 12.
Figure 12 Viewing the event logs on the HDM Web page

2. Check the log receiving status. As shown in Figure 13, the event subscription server can receive the LAN Leak Lost fault information, indicating that the event subscription server has normally received the event log information sent by HDM.
Figure 13 Viewing the event logs on the event subscription server

Related documentation
· H3C HDM Redfish Reference Manual
· H3C HDM Redfish Technology White Paper
