- Table of Contents
-
- H3C S6820 Switch Series Configuration Examples-Release 630x-6W100
- 01-Login Management Configuration Examples
- 02-RBAC Configuration Examples
- 03-Software Upgrade Examples
- 04-ISSU Configuration Examples
- 05-Software Patching Examples
- 06-Ethernet Link Aggregation Configuration Examples
- 07-Port Isolation Configuration Examples
- 08-Spanning Tree Configuration Examples
- 09-VLAN Configuration Examples
- 10-VLAN Tagging Configuration Examples
- 11-DHCP Snooping Configuration Examples
- 12-Cross-Subnet Dynamic IP Address Allocation Configuration Examples
- 13-IPv6 over IPv4 Manual Tunneling with OSPFv3 Configuration Examples
- 14-ISATAP Tunnel and 6to4 Tunnel Configuration Examples
- 15-IPv6 over IPv4 GRE Tunnel Configuration Examples
- 16-GRE with OSPF Configuration Examples
- 17-OSPF Configuration Examples
- 18-IS-IS Configuration Examples
- 19-BGP Configuration Examples
- 20-Policy-Based Routing Configuration Examples
- 21-OSPFv3 Configuration Examples
- 22-IPv6 IS-IS Configuration Examples
- 23-Routing Policy Configuration Examples
- 24-IGMP Snooping Configuration Examples
- 25-IGMP Configuration Examples
- 26-BIDIR-PIM Configuration Examples
- 27-Multicast VPN Configuration Examples
- 28-MLD Snooping Configuration Examples
- 29-IPv6 Multicast VLAN Configuration Examples
- 30-Basic MPLS Configuration Examples
- 31-MPLS L3VPN Configuration Examples
- 32-ACL Configuration Examples
- 33-Control Plane-Based QoS Policy Configuration Examples
- 34-Traffic Policing Configuration Examples
- 35-GTS and Rate Limiting Configuration Examples
- 36-Priority Mapping and Queue Scheduling Configuration Examples
- 37-Traffic Filtering Configuration Examples
- 38-AAA Configuration Examples
- 39-Port Security Configuration Examples
- 40-Portal Configuration Examples
- 41-SSH Configuration Examples
- 42-IP Source Guard Configuration Examples
- 43-Ethernet OAM Configuration Examples
- 44-CFD Configuration Examples
- 45-DLDP Configuration Examples
- 46-VRRP Configuration Examples
- 47-BFD Configuration Examples
- 48-NTP Configuration Examples
- 49-SNMP Configuration Examples
- 50-NQA Configuration Examples
- 51-Mirroring Configuration Examples
- 52-sFlow Configuration Examples
- 53-FCoE Configuration Examples
- 54-OpenFlow Configuration Examples
- 55-MAC Address Table Configuration Examples
- 56-Static Multicast MAC Address Entry Configuration Examples
- 57-IP Unnumbered Configuration Examples
- 58-MVRP Configuration Examples
- 59-MCE Configuration Examples
- 60-Congestion Avoidance and Queue Scheduling Configuration Examples
- 61-Attack Protection Configuration Examples
- 62-Smart Link Configuration Examples
- 63-RRPP Configuration Examples
- 64-BGP Route Selection Configuration Examples
- 65-IS-IS Route Summarization Configuration Examples
- 66-IRF Configuration Examples
- 67-MPLS OAM Configuration Examples
- 68-MPLS TE Configuration Examples
- 69-NetStream Configuration Examples
- 70-VXLAN Configuration Examples
- 71-DRNI Configuration Examples
- 72-DRNI and EVPN Configuration Examples
- 73-EVPN-DCI over an MPLS L3VPN Network Configuration Examples
- 74-S-MLAG Configuration Examples
- 75-MPLS SR Configuration Examples
- 76-Puppet Configuration Examples
- Related Documents
-
| Title | Size | Download |
|---|---|---|
| 69-NetStream Configuration Examples | 408.01 KB |
|
|
|
H3C S6820 Switches |
|
NetStream Configuration Examples |
|
|
Copyright © 2020 New H3C Technologies Co., Ltd. All rights reserved.
No part of this manual may be reproduced or transmitted in any form or by any means without prior written consent of New H3C Technologies Co., Ltd.
Except for the trademarks of New H3C Technologies Co., Ltd., any trademarks that may be mentioned in this document are the property of their respective owners.
The information in this document is subject to change without notice.
Introduction
This document provides NetStream statistics analysis configuration examples.
Prerequisites
This document is not restricted to specific software or hardware versions.
The configuration examples in this document were created and verified in a lab environment, and all the devices were started with the factory default configuration. When you are working on a live network, make sure you understand the potential impact of every command on your network.
This document assumes that you have basic knowledge of NetStream.
Example: Configuring NetStream statistics analysis
Network configuration
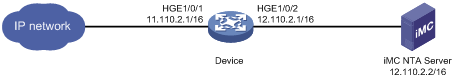
As shown in Figure 1, configure NetStream on the device to collect and export traffic statistics as follows:
· Randomly capture one packet out of every 256 packets (both inbound and outbound) for NetStream traffic statistics collection on HundredGigE 1/0/1.
· Export the collected traffic statistics to the IMC server with IP address 12.110.2.2/16 and UDP port 6343.
Analysis
To ensure that the device and the IMC server can communicate with each other, add the device to IMC NTA with the correct SNMP community string and port number.
To collect bidirectional traffic statistics on HundredGigE 1/0/1 of the device, enable NetStream for both the inbound and outbound traffic on HundredGigE 1/0/1. Specify a sampler to implement sampled-NetStream as required.
For the device to send NetStream statistics to the IMC server, specify the IMC server with IP address 12.110.2.2/16 and UDP port 6343 as the destination host for NetStream data export.
For the IMC server to analyze the NetStream statistics and generate reports based on the statistics, configure a traffic analysis task in IMC NTA.
Software versions used
This configuration example was created and verified on R6301.
The IMC platform version running on the IMC server is PLAT 7.3 (E0504).
Restrictions and guidelines
NetStream supports only random sampling. The packets are randomly selected out of a group of packets.
Procedures
Configuring the device
1. Configure SNMP:
# Enable the SNMP agent.
<Device> system-view
[Device] snmp-agent
# Set the read-only community name to public.
[Device] snmp-agent community read public
# Specify the UDP port number for receiving SNMP packets as 161.
[Device] snmp-agent port 161
2. Create sampler 256 in random sampling mode. Set the sampling rate to 8, which indicates that one packet will be randomly selected out of every 256 packets.
[Device] sampler 256 mode random packet-interval n-power 8
3. Configure NetStream:
# Enable NetStream sampling for both incoming and outgoing traffic on HundredGigE 1/0/1 with sampler 256.
<Device> system-view
[Device] interface hundredgige 1/0/1
[Device-HundredGigE1/0/1] ip netstream inbound
[Device-HundredGigE1/0/1] ip netstream outbound
[Device-HundredGigE1/0/1] ip netstream inbound sampler 256
[Device-HundredGigE1/0/1] ip netstream outbound sampler 256
[Device-HundredGigE1/0/1] quit
# Specify the IMC server as the NetStream data export destination.
[Device] ip netstream export host 12.110.2.2 6343
Configuring IMC
Adding the device to IMC NTA
1. Log in to IMC.
2. Click the Service tab.
3. From the left navigation pane, select Traffic Analysis and Audit > Settings.
4. On the Settings page that opens, click Device Management.
The Device Management page opens.
5. Click Add.
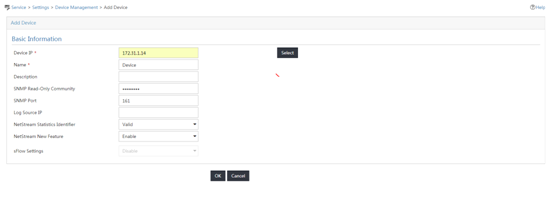
6. On the Add Device page shown in Figure 2, perform the following steps:
a. Enter the device IP address (12.110.2.1) in the Device IP field.
b. Specify the device name, SNMP community name, SNMP port number, and other parameters as needed.
c. Click OK.
Figure 2 Adding the device to IMC NTA
Deploying NTA server configuration to the device
1. On the Settings page, click Server Management.
The Server List page opens.
2.
Click the Modify icon ![]() for the NTA server.
for the NTA server.
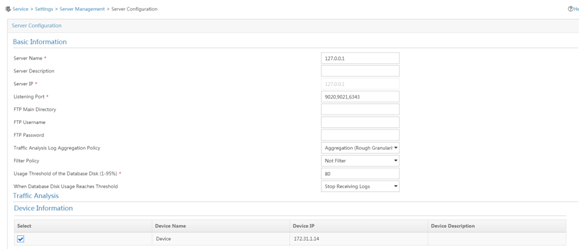
3. On the Server Configuration page shown in Figure 3, configure the following parameters:
a. Set port 6343 as the listening port for the server.
b. Select the device (12.110.2.1) in the Traffic Analysis area.
c. Use the default settings for other parameters.
d. Click Deploy.
Adding a traffic analysis task
1. On the Settings page, click Traffic Analysis Task Management.
The Traffic Analysis Task Management page opens.
2. Click Add.
The Select Task Type page opens.
3. Select Interface and click Next.
The Add Traffic Analysis Task page opens.
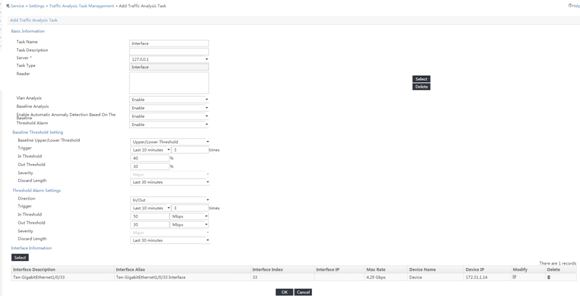
4. In the Basic Information area, configure the following settings:
¡ Task Name—Enter a task name. This example uses Interface.
¡ Server—Select 127.0.0.1 from the list.
¡ Reader—Click Select next to the Reader field, select the operator groups that have access to the analysis and reports provided by the task, and click OK.
¡ Vlan Analysis—Select Disable from the list.
¡ Baseline Analysis—Select Enable from the list.
The Enable Automatic Anomaly Detection Based On The Baseline parameter and the Baseline Threshold Setting area are displayed.
¡ Enable Automatic Anomaly Detection Based On The Baseline—Select Disable from the list.
¡ Threshold Alarm—Select Enable from the list.
The Threshold Alarm Settings area is displayed.
5. In the Baseline Threshold Settings area, set the In Threshold to 40% and the Out Threshold to 30%.
6. In the Threshold Alarm Settings area, set the In Threshold to 50 Mbps and the Out Threshold to 30 Mbps.
7. In the Interface Information area, click Select and select interface HundredGigE 1/0/2.
8. Use the default settings for other parameters.
9. Click OK.
Figure 4 Adding an interface traffic analysis task
Verifying the configuration
Verifying the configuration on the device
# Display NetStream data export information.
[Device] display ip netstream export
IP export information:
Flow source interface : HundredGigE1/0/2
Flow destination VPN instance : Not specified
Flow destination IP address (UDP) : 12.110.2.2 (6343)
Version 5 exported flow number : 0
Version 5 exported UDP datagram number (failed) : 0 (0)
Version 9 exported flow number : 10
Version 9 exported UDP datagram number (failed) : 10 (0)
Verifying the configuration on IMC
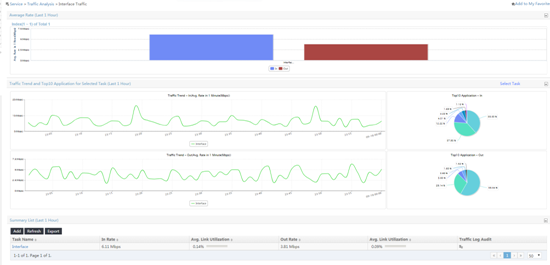
1. View the interface traffic analysis task summary reports.
a. Click the Service tab.
b. From the left navigation pane, select Traffic Analysis and Audit > Interface Traffic Analysis Task.
The interface traffic analysis task summary reports are displayed, as shown in Figure 5.
Figure 5 Summary reports for interface traffic analysis tasks
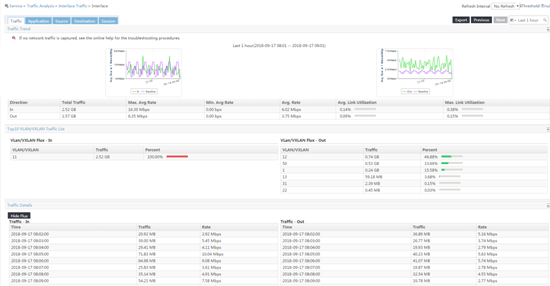
2. View detailed reports for the interface traffic analysis task named Interface:
a. Click the Service tab.
b. From the left navigation tree, select Traffic Analysis and Audit > Interface Traffic Analysis Task.
c. Use either of the following methods to access the report page of interface traffic analysis task Interface:
- In the Summary List area, click the name of interface traffic analysis task.
- On the left navigation pane, move your mouse pointer to the shortcut menu icon ![]() next to
next to ![]() Interface Traffic Analysis Task, and
then select Interface from the menu.
Interface Traffic Analysis Task, and
then select Interface from the menu.
The Traffic tab displays the traffic analysis reports of the task.
Figure 6 Viewing the traffic analysis reports of the task
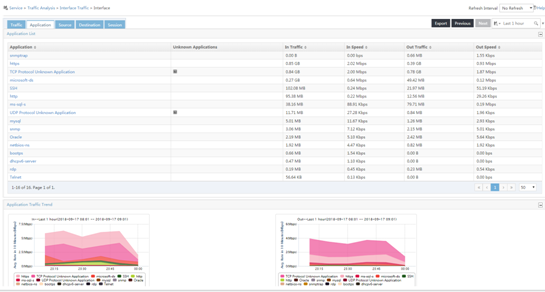
3. To view the application usage reports of the task, click the Application tab.
Figure 7 Viewing the application usage reports of the task
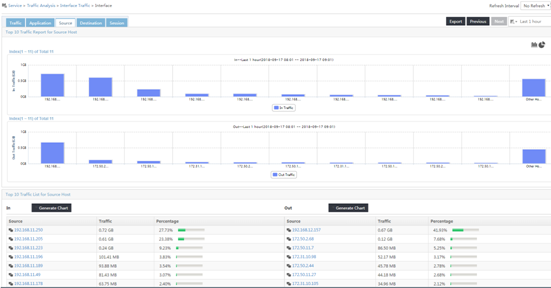
4. To view the source host-based traffic analysis reports of the task, click the Source tab.
Figure 8 Viewing source host-based traffic analysis reports of the task
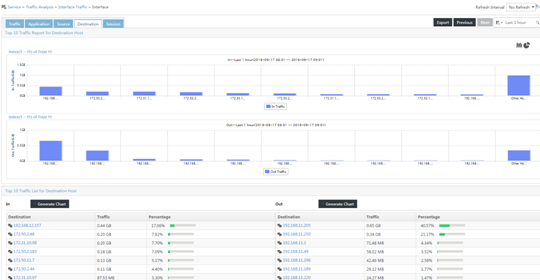
5. To view the destination host-based traffic analysis reports of the task, click the Destination tab.
Figure 9 Viewing destination host-based traffic analysis reports of the task
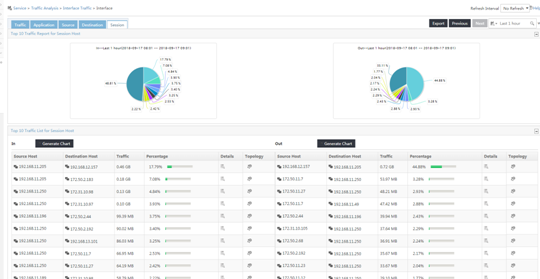
6. To view the session-based traffic analysis reports of the task, click the Session tab.
Figure 10 Viewing session-based traffic analysis reports of the task
Configuration files
#
snmp-agent
snmp-agent community read public
snmp-agent port 161
#
sampler 256 mode random packet-interval n-power 8
#
interface HundredGigE1/0/1
ip address 11.110.2.1 255.255.0.0
ip netstream inbound
ip netstream outbound
ip netstream inbound sampler 256
ip netstream outbound sampler 256
#
interface HundredGigE1/0/2
ip address 12.110.2.1 255.255.0.0
#
ip netstream export host 12.110.2.2 6343
#
Related documentation
· H3C S6800[S6860][S6861] (R27xx) & S6820 (R630x) Switch Series Network Management and Monitoring Command Reference
· H3C S6800[S6860][S6861] (R27xx) & S6820 (R630x) Switch Series Network Management and Monitoring Configuration Guide