- Table of Contents
-
- 07-System
- 01-High availability group
- 02-VRRP
- 03-Track
- 04-BFD
- 05-NQA
- 06-Basic log settings
- 07-Email server
- 08-Session log settings
- 09-Sandbox log settings
- 10-Heartbeat log settings
- 10-Threat log settings
- 11-Application audit log settings
- 12-URL filtering log settings
- 13-Attack defense log settings
- 14-Reputation log settings
- 15-Bandwidth alarm logs
- 16-Configuration log settings
- 17-Security policy log
- 18-Terminal identification logging
- 20-WAF log settings
- 21-IP access logs
- 22-MAC access log
- 23-Bandwidth management logs
- 24-Context rate limit logging
- 25-Report settings
- 26-Session settings
- 27-Signature upgrade
- 28-Software upgrade
- 29-License management
- 30-IRF
- 31-IRF advanced settings
- 32-Contexts
- 33-Administrators
- 34-Date and time
- 35-MAC address learning through a Layer 3 device
- 36-SNMP
- 37-Configuration management
- 38-Reboot
- 39-About
- 40-Ping
- 41-Tracert
- 42-Packet capture
- 43-Webpage Diagnosis
- 44-Diagnostic Info
- 45-Packet trace
- 46-Fast Internet Access
- Related Documents
-
| Title | Size | Download |
|---|---|---|
| 05-NQA | 35.09 KB |
NQA
Introduction
NQA
Network quality analyzer (NQA) allows you to measure network performance, verify the service levels for IP services and applications, and troubleshoot network problems.
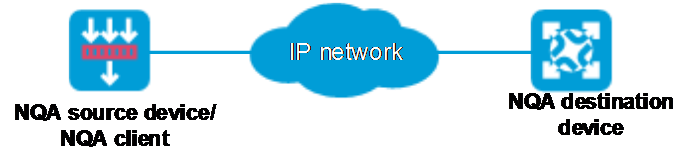
NQA operating mechanism
As shown in Figure 1, the NQA source device (NQA client) sends data to the NQA destination device by simulating IP services and applications to measure network performance.
All types of NQA operations require the NQA client, but only the TCP operations require the NQA server. The NQA operations for services that are already provided by the destination device such as FTP do not need the NQA server. You can configure the NQA server to listen and respond to specific IP addresses and ports to meet various test needs.
Collaboration with Track
NQA can collaborate with the Track module to notify application modules of state or performance changes so that the application modules can take predefined actions. For more information about Track, see the Track help.
Threshold monitoring
Threshold monitoring enables the NQA client to take a predefined action when the NQA operation performance metrics violate the specified thresholds.
Configure NQA
To configure NQA:
1. Click the System tab.
2. In the navigation pane, select High Availability > NQA.
3. Click Add.
4. Configure an NQA operation.
Table 1 NQA operation configuration items
|
Item |
Description |
|
NQA operation administrator |
Enter the administrator name of the NQA operation. An nQA operation is identified by an administrator name and operation tag. |
|
Operation tag |
Enter an NQA operation tag. |
|
Probe mode |
Select a probe mode. NQA supports using packets of different protocols for link detection. |
|
Destination IP |
Enter the destination IP address for probe packets. |
|
Destination port |
Enter the destination port number for probe packets. |
|
Probe interval |
Set the interval at which the NQA operation repeats. If you set the interval to 0, NQA performs the operation only once and does not generate any statistics. |
|
Probe times |
Specify the probe times. If an operation is to perform multiple probes, the NQA client starts a new probe in one of the following conditions: · The NQA client receives responses to packets sent in the last probe. · The probe timeout time expires. |
|
Probe timeout |
Set the timeout time for waiting for a response. |
|
Save history records |
Enable the saving of history records for the NQA operation. If you disable this feature, the device removes existing history records of the NQA operation and does not save history records any more. |
|
Max history records |
Set the maximum number of history records that can be saved for an NQA operation. If the number of history records for an NQA operation exceeds the maximum number, earliest history records are removed. |
|
Starting time |
Configure the start time of the NQA operation: · Immediately—The NQA operation starts immediately after the configuration is deployed. · Scheduled time—The NQA operation starts at the scheduled time. |
|
Operation duration |
Configure the operation duration: · Permanent—The device indefinitely repeats the NQA operation. · Specified duration—The device repeats the NQA operation during the duration. |
Table 2 NQA threshold monitoring configuration items
|
Item |
Description |
|
Reaction entry ID |
Enter the ID of the reaction entry. |
|
Monitored element |
Select a monitored element. · probe-duration—Duration of the probe. · probe-fail—Number of probe failures. |
|
Threshold type |
Select a threshold type. · Accumulate—Checks the total number of threshold violations. · Consecutive—Checks the number of consecutive threshold violations after the NQA operation starts. |
|
Probe failures |
Set the number of probe failures to determine an operation failure. |
|
Threshold value range |
Enter a threshold value range. |
|
Triggered action |
Select a triggered action: · None—Records the monitoring results locally. · Trap-only—Records the monitoring results and sends SNMP trap messages to the NMS. If you select this action, you must configure the trap message receiver host on the System > Maintenance > SNMP page. · Trigger-only—Records the monitoring results locally and triggers the collaboration with other modules. |