- Table of Contents
-
- H3C WBC580 G2 Multiservice Access Controller Installation Guide-5W105
- 00-Preface
- 01-Preparing for installation
- 02-Installing and removing the device
- 03-Powering on, powering off, and rebooting the device
- 04-Logging in to the device
- 05-Maintenance
- 06-Appendix A Chassis views and technical specifications
- 07-Appendix B LEDs
- 08-Appendix C Optional transceiver modules
- Related Documents
-
| Title | Size | Download |
|---|---|---|
| 04-Logging in to the device | 3.90 MB |
Browser, resolution, and operating system requirements
Logging into the WBC monitoring platform and components
Logging in to the WBC monitoring platform from a browser
Logging in to the WBC monitoring platform from HDM
Launching a KVM or H5 KVM remote console
Setting up an environment for KVM
Logging in to the WBC monitoring platform
Logging in to Cloudnet from the WBC monitoring platform
Accessing the Cloudnet Web interface
Accessing the Cloudnet O&M interface
Logging in to Cloudnet from a local PC
Logging in to the AC from the WBC monitoring platform
Accessing the AC local Web interface
Accessing the AC O&M interface
Logging in to the AC from a local PC
Logging in to the AC from the CLI
Logging in to the AC from the Web interface
Logging in to the license server
Logging in to the license server from the WBC monitoring platform
Accessing the license server Web interface
Accessing the license server O&M interface
Logging in to the license server from a local PC
Logging in to Oasis IoT from the WBC monitoring platform
Logging in to the VM component
Logging in to the Devices component
Back up or roll back configuration
About the device
|
|
IMPORTANT: The information in this document might be slightly different depending on the software or hardware version of the device. |
The device uses the H3Linux operating system and contains the following management components:
· Cloudnet—Allows users to monitor network conditions, manage the device, and operate O2O services online.
· Oasis IoT—Supports device management, rule engine, edge computing, application management, and industrial scenario categorization. The device has a built-in VM, which supports the WSM feature. WSM allows users to configure wireless parameters and monitor wireless performance.
· VM—You can install and use user-defined VMs.
· License Server—Manages licenses in a unified way and provides license server hot backup to achieve high service availability. It can simplify license management and control dynamic service licensing to solve licensing interruption caused by single-point failure.
· Access controller (AC)—Controls wireless data forwarding and centrally manages access points (APs).
· Device management—Provides device network configuration, system update, backup and restore, and real-time monitoring on device health state and CPU usage.
Browser, resolution, and operating system requirements
· As a best practice, use one of the following browsers to access the Web interface:
¡ Google Chrome 48 or higher.
¡ Internet Explorer 11.836.18362.0 or higher in the Windows 10 system.
¡ Mozilla Firefox 50 or higher.
· Make sure the browser allows third-party cookies and is enabled with Active Scripting (or JavaScript).
· If an Internet Explorer is used, make sure the following functions are enabled:
¡ Script ActiveX controls marked safe for scripting.
¡ Run ActiveX controls and plugins.
· After software update, first clear cache in the browser and then log in to the Web interface as a best practice.
· Make sure the resolution ratio of the PC (desktop, laptop, or tablet PC) is 1024 × 768 or higher.
Logging into the WBC monitoring platform and components
WBC monitoring platform
Table1-1 shows the methods of logging in to the WBC monitoring platform. Select an appropriate method depending on whether the IP address of the WBC monitoring platform is known.
Table1-1 Methods of logging in to the WBC monitoring platform
|
Login method |
Whether the IP address of the WBC monitoring platform is known |
|
Logging in to the WBC monitoring platform from a browser |
Yes |
|
Logging in to the WBC monitoring platform from HDM |
No |
Components
Table1-2 shows the methods of logging in to a component. Select an appropriate method depending on whether the IP addresses of the component and WBC monitoring platform are known.
Table1-2 Methods of logging in to the service components
|
Login method |
Whether the IP address of the component is known |
Whether the IP address of the WBC monitoring platform is known |
|
|
Indirect login |
Accessing the component after logging in to the WBC monitoring platform from a browser |
No |
Yes |
|
Accessing the component after logging in to the WBC monitoring platform from HDM |
No |
No |
|
|
Direct login |
Logging in to the component directly from a local PC |
Yes |
N/A |
Logging in to the WBC monitoring platform from a browser
|
|
IMPORTANT: If you use a Microsoft Internet Explorer browser, you must enter the complete URL to log in to the WBC monitoring platform. |
You can directly log in to the WBC monitoring platform from a browser, and then access the Cloudnet, license server, and VM components from the WBC monitoring platform.
To log in to the WBC monitoring platform from a browser:
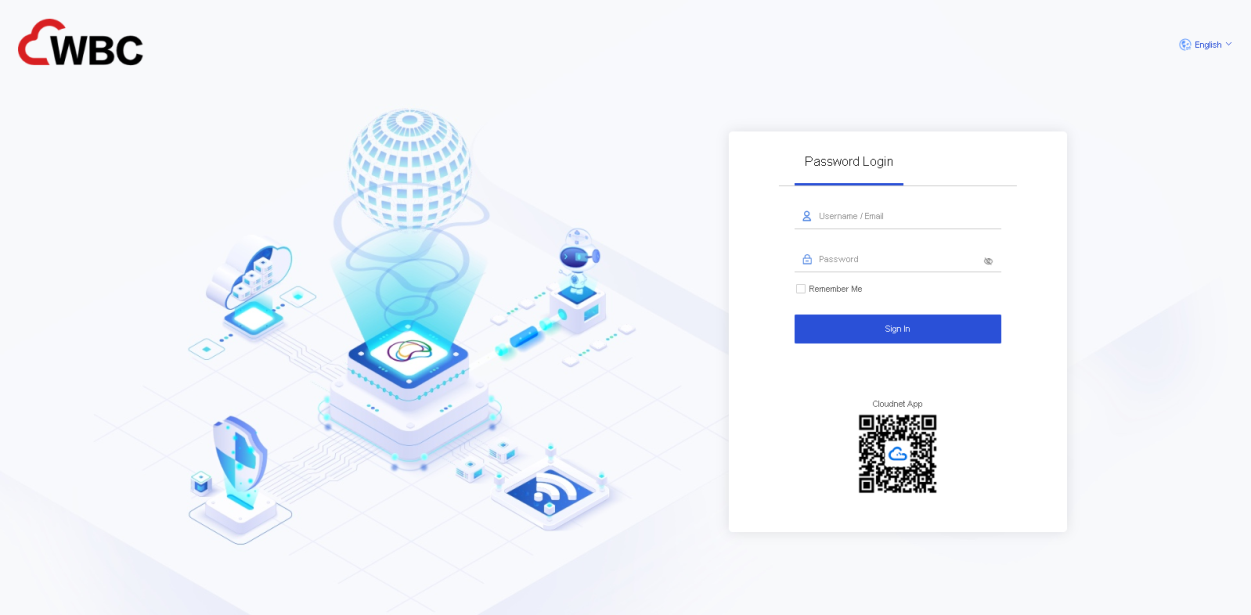
1. Enter the URL address of the WBC monitoring platform in a browser and press Enter. The WBC monitoring platform login page opens.
This example uses a Google Chrome browser and default URL address https://192.168.0.101:9999.
Figure1-1 WBC monitoring platform login page
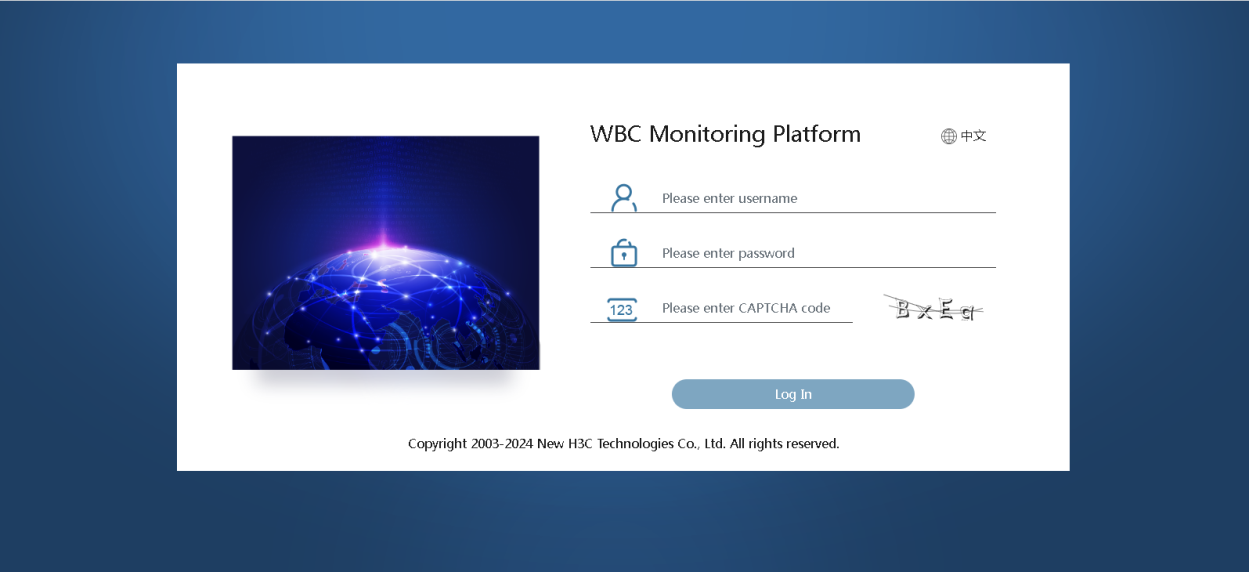
2. Enter the username and password, and then click Log In.
The default username and password are admin and admin.Default.0506, respectively.
Figure1-2 WBC monitoring platform homepage 1
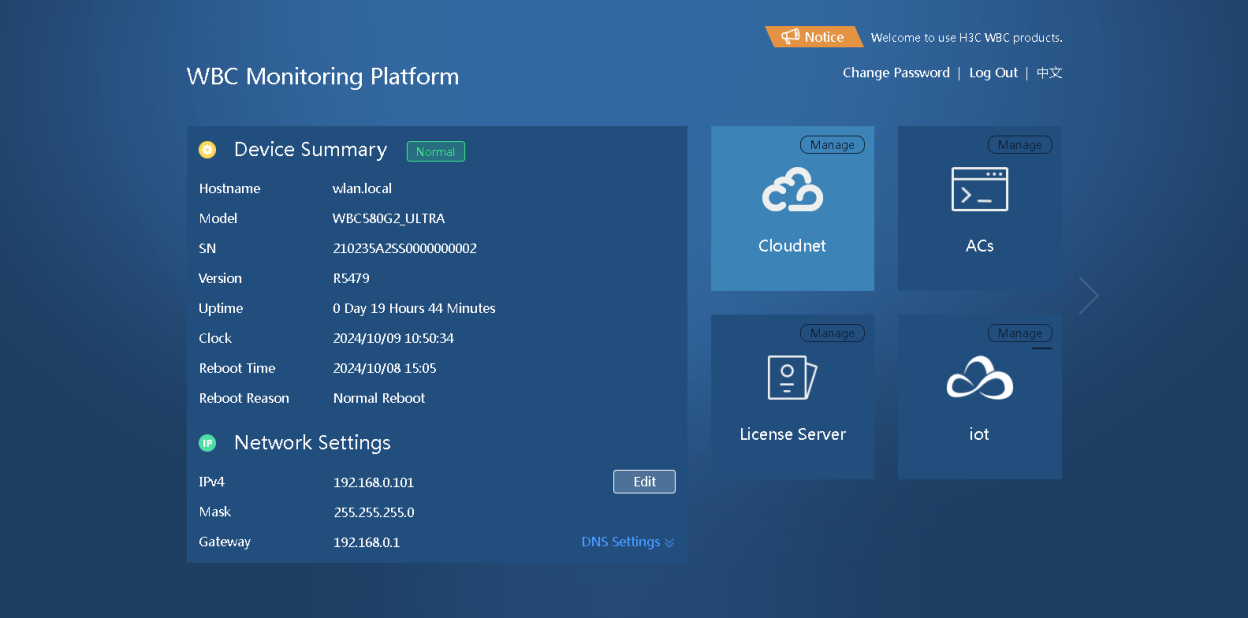
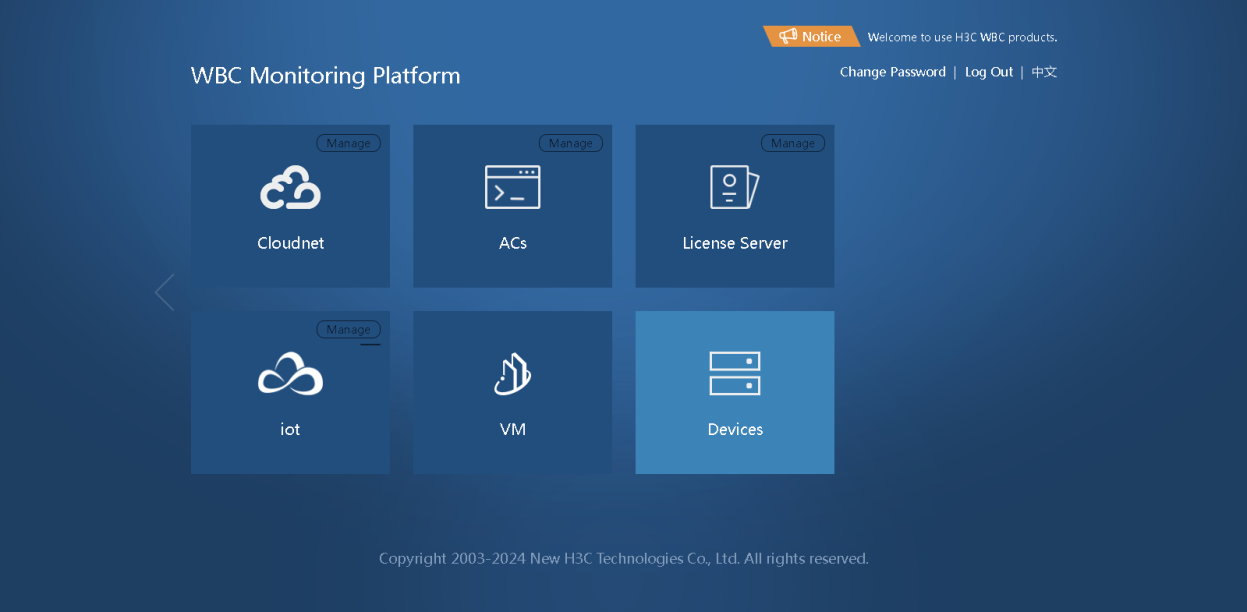
Figure1-3 WBC monitoring platform homepage 2
3. (Optional.) Select the interface language. The WBC monitoring platform supports both simplified Chinese and English. To change the login password, click Change Password.
4. To access components, perform the following tasks:
¡ To access Cloudnet, see "Logging in to Cloudnet from the WBC monitoring platform."
¡ To access the AC, see "Logging in to the AC from the WBC monitoring platform."
¡ To access the license server, see "Logging in to the license server from the WBC monitoring platform."
¡ To access Oasis IoT, see "Logging in to Oasis IoT from the WBC monitoring platform."
¡ To access the VM component, see "Logging in to the VM component."
¡ To access the Devices component, see "Logging in to the Devices component."
Logging in to the WBC monitoring platform from HDM
When logging in to the WBC monitoring platform with HDM, please execute the following steps:
3. Logging in to the WBC monitoring platform
Logging in to HDM
Hardware Device Management (HDM) is a remote server management system. HDM enables easy server configuration, server component information retrieval, operating health status monitoring, and remote control.
Before logging in to HDM, perform the following tasks:
· Connect the HDM shared or dedicated port on the server to the network.
¡ The HDM shared network port transmits HDM management traffic and server data traffic simultaneously.
¡ The HDM dedicated network port transmits only HDM management traffic.
· Obtain HDM management IP address and user account information. For the first login, use the default settings in Table1-3.
Table1-3 Default HDM login settings
|
Item |
Default setting |
|
IP address |
· HDM shared network port: DHCP assigned IP address · HDM dedicated network port: 192.168.1.2/24 |
|
Username |
admin |
|
Password (case-sensitive) |
|
|
Domain name |
You can obtain the domain name from the label at the lower left corner on the chassis hood. |
To log in to HDM:
1. Launch the browser, enter the HDM management IP address in the https://hdm_ip_address format in the address bar, and then press Enter. This example uses a Google Chrome browser and an HDM management IP address of 192.168.1.2.
2. On the verification page, click ADVANCED, and then click Proceed to IP address (unsafe). The HDM login page opens.
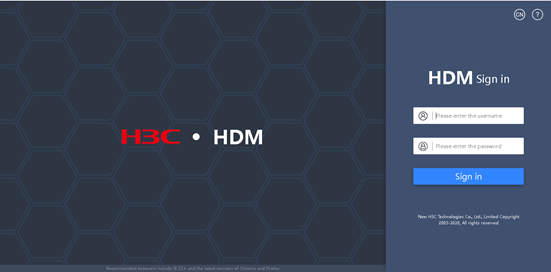
Figure1-4 HDM login page
3. (Optional.) Click Select language at the bottom of the page to select the interface language. HDM supports both simplified Chinese and English.
4. On the login page, enter the username and password, and then click Sign in. The HDM homepage opens.
The default username and password are admin and Password@_, respectively.
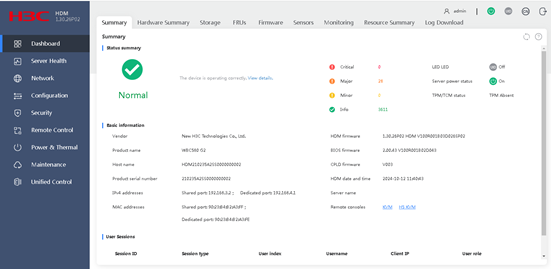
Figure1-5 HDM homepage
Launching a remote console
About remote consoles
You can manage the device and install an operating system (OS) from a remote console.
In the current software version, HDM supports the KVM and H5 KVM remote consoles.
· To use H5 KVM, no OS environment or client installation is required.
· To use KVM, you must first set up the OS environment. The environment setup configuration method varies by OS type. For more information, see "Setting up an environment for KVM."
Launching a KVM or H5 KVM remote console
Restrictions and guidelines
Do not use KVM and H5 KVM at the same time or start the remote console in multiple browsers on one PC.
The dedicated KVM and H5 KVM modes are available only for HDM-1.30.08 or later.
The unencrypted H5 KVM modes are available only for HDM-1.30.09 or later.
For security purposes, grant full permission to a trustworthy secondary user when you close the remote console session as the primary user.
Granting full permission to a secondary user removes the full permission from the primary user. Then, the primary user has only the read-only permission.
The primary user can grant full permission to any secondary user when closing the KVM window. If the primary user does not grant full permission in 10 seconds, the permissions of secondary users remain unchanged.
Prerequisites
Before you can launch a remote control console, perform the following tasks:
· Make sure your user account has the remote control privilege. If you do not have the remote control privilege, contact the administrator.
· To launch the KVM console, make sure your user account has the KVM extended privilege. To launch the H5 KVM console, make sure your account has the Web and KVM extended privileges. If you do not have the Web or KVM privilege, contact the administrator.
Procedure
1. From the left navigation pane on the HDM homepage, select Remote Control.
The device supports the KVM and H5 KVM remote consoles. Select a remote console as required.
¡ KVM: Click either of the mode buttons to download the .jnlp file. Before you launch the KVM remote console, verify that configuration of the KVM environment has completed. If the configuration is not complete, complete the configuration and connection of the KVM remote console as described in "Setting up an environment for KVM."
¡ H5 KVM: You do not need to configure the environment. To launch the H5 KVM remote console, click any one of the mode buttons.
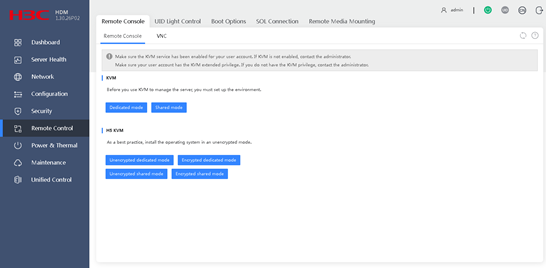
Figure1-6 Remote Console page
2. Differences between launching the remote console in different modes:
H5 KVM supports the encrypted modes and unencrypted modes.
Encrypted modes transmit encrypted data and provide better security performance. Unencrypted modes transmit unencrypted data and provide higher transmission speed.
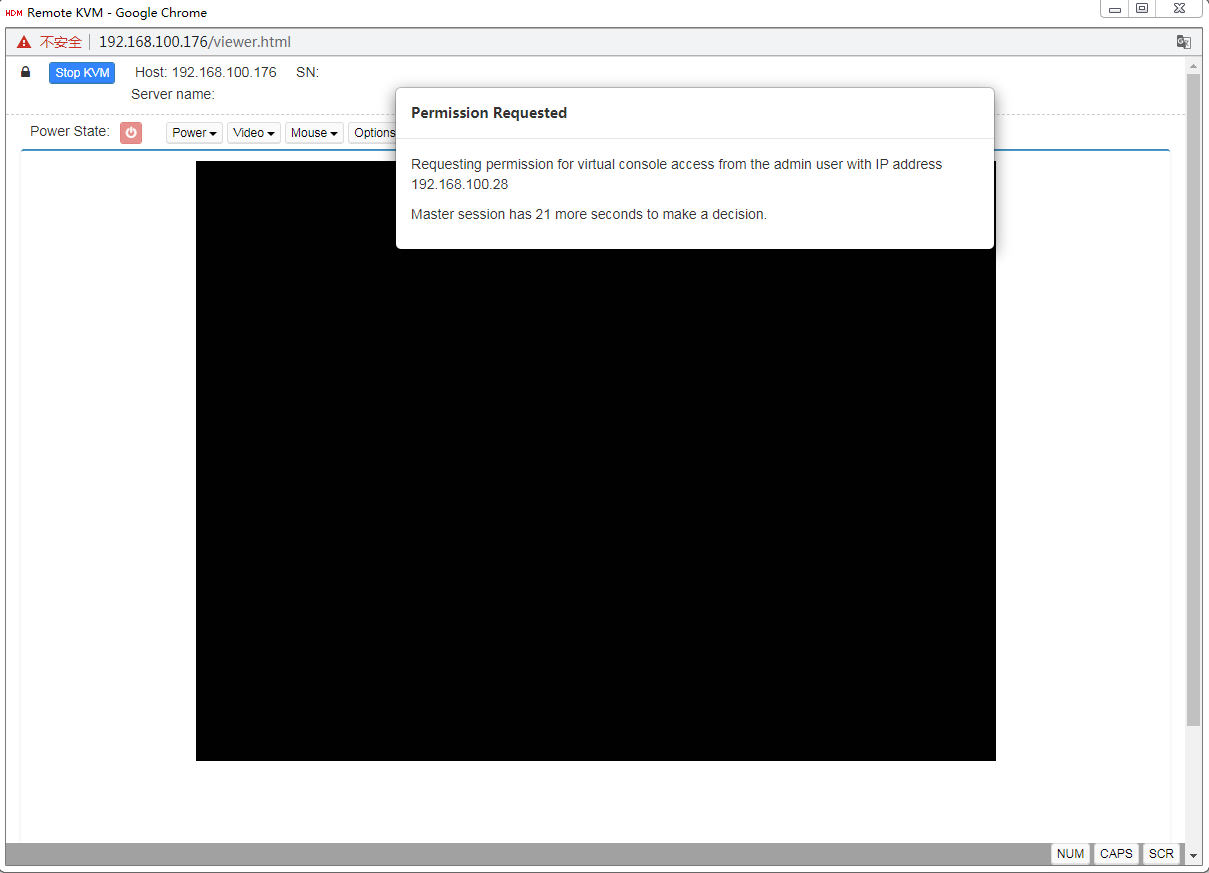
3. For a shared mode, wait for the access authorization from the primary user if you are not the first access user, as shown in Figure1-7.
Figure1-7 Waiting for remote console access authorization
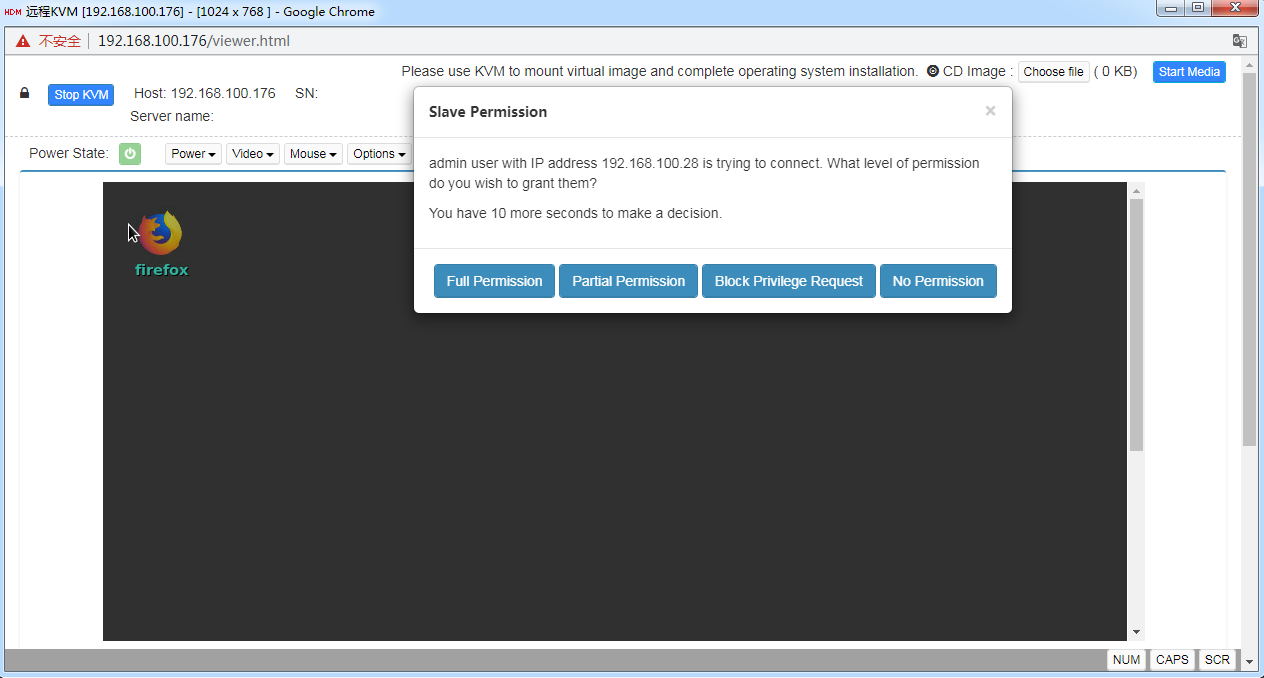
If you are the primary user, you might need to grant access permissions to other users, as shown in Figure1-8.
Figure1-8 Authorizing remote console access
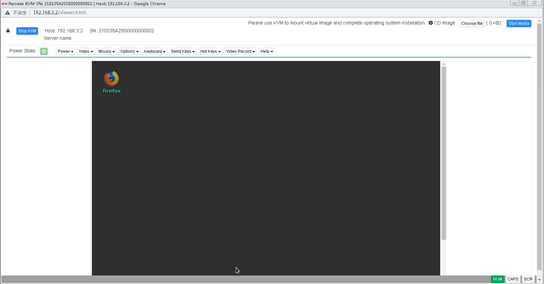
4. Enter the password, and then click Log In. The default password is admin.Default.0506.
Figure1-9 Remote console homepage
Parameters
· Dedicated mode: Includes Encrypted dedicated mode and Unencrypted dedicated mode. A dedicated mode allows for only one remote console session and grants the user with the full access permission. You can launch the remote console successfully in dedicated mode only if no other user is using the remote console. In the current software version, KVM supports only unencrypted dedicated mode.
· Shared mode: Includes Encrypted shared mode and Unencrypted shared mode. A shared mode allows for a primary session and multiple secondary sessions. If you are the first access user, the system assigns you with the full access permission. If you are a secondary user, the granted permission is decided by the primary user as follows:
¡ If you are granted full access permission, you can display information and configure the server.
¡ If you are granted read-only permission, you can only view videos and screenshots, and record videos. You cannot perform any configuration tasks.
¡ If your access is denied, the KVM window closes.
¡ If the primary user does not respond in 30 seconds, you are granted read-only permission.
Setting up an environment for KVM
Setting up the Windows environment for KVM
As a best practice, use Zulu OpenJDK 8 and IcedTea-Web 1.7.1 to run KVM.
You can obtain the installation packages at the following websites:
· Zulu OpenJDK: https://www.azul.com/downloads/zulu/
· IcedTea-Web: http://icedtea.wildebeest.org/download/icedtea-web-binaries/
To set up the Windows environment for KVM:
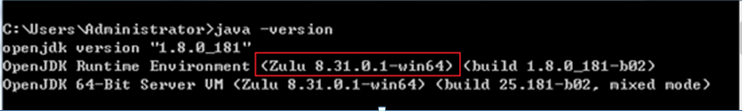
1. Install the OpenJDK Java environment:
a. Obtain the msi. installation file for Zulu OpenJDK and install OpenJDK with the default settings.
b. Verify the version of OpenJDK.
Figure1-10 Verifying the version of OpenJDK
2. Install the IcedTea-Web plugin:
Open the .msi installation file of the target version for the plugin, and install the plugin with the default settings.
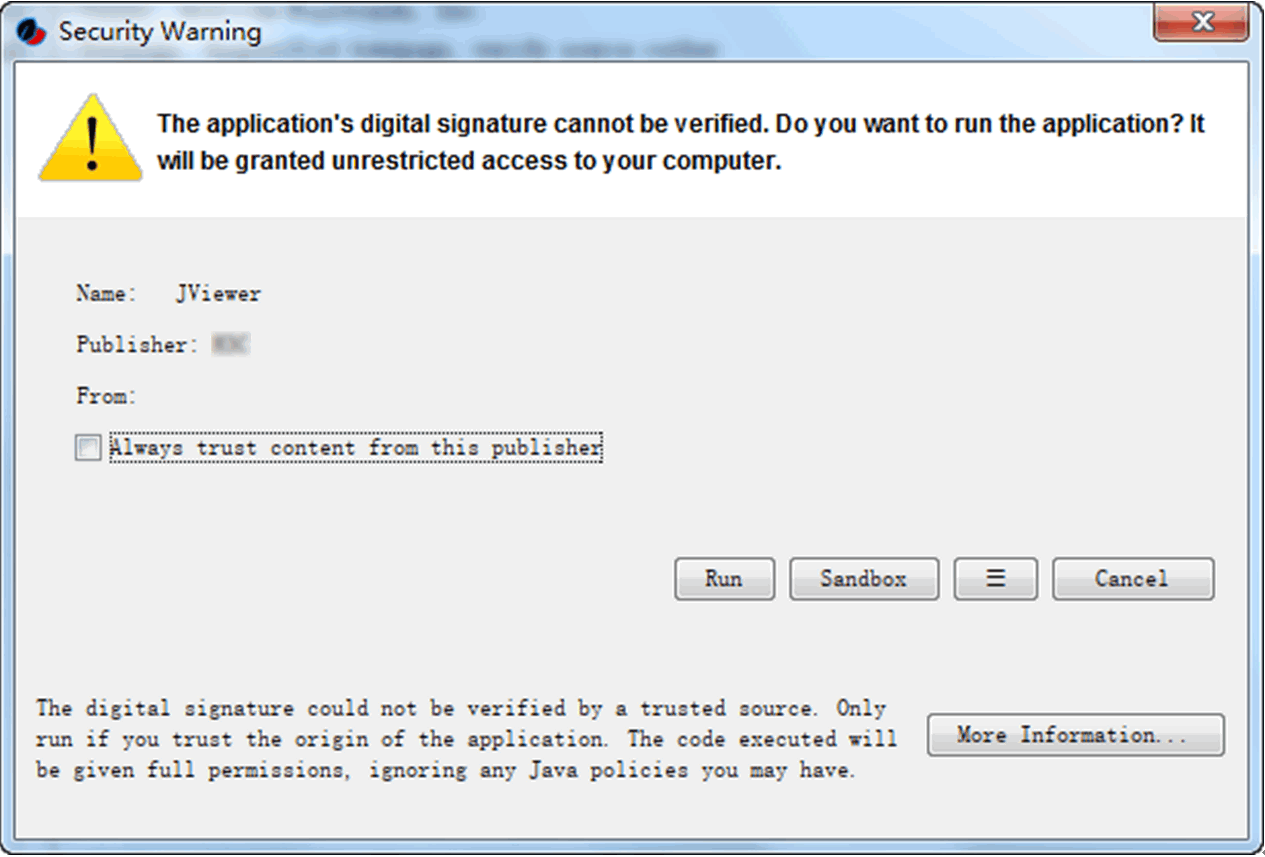
3. Run HDM KVM:
a. Access the installation directory of the IcedTea-Web plugin. This example uses directory C:\Program Files\IcedTeaWeb\WebStart\bin.
b. Open the CLI in the directory and execute the javaws jnlp_directory command. The jnlp_directory argument represents the directory of the downloaded .jnlp file.
c. In the dialog box that opens, click Run.
Figure1-11 Command execution
4. The KVM login window opens. You can enter password admin.Default.0506 to access KVM.
Figure1-12 KVM

Setting up the Linux environment for KVM
As a best practice, use Zulu OpenJDK 8 and IcedTea-Web to run HDM KVM.
You can obtain the installation packages at the following websites:
· Zulu OpenJDK: https://www.azul.com/downloads/zulu/
· IcedTea-Web: http://icedtea.wildebeest.org/download/source/
To set up the Linux environment for KVM:
1. Install the IcedTea-Web plugin:
Use the yum install filename command to install the plugin. The filename argument represents the name of the installation package. In this example, the package name is icedtea-web.x86_64.
Figure1-13 Installing the IcedTea-Web plugin
![]()
2. Install the OpenJDK Java environment:
a. Use either of the following methods to install OpenJDK:
- If you downloaded the .rpm installation package, execute the rpm –ivh xxx.rpm command. The xxx.rpm argument represents the package name.
- If you downloaded the tar.gz package, decompress the package to the /usr/lib/jvm directory, and then append the following commands to the end of the /etc/profile file:
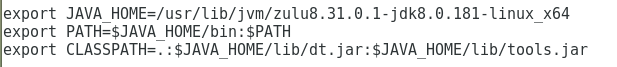
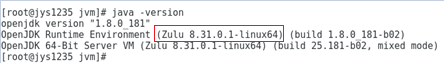
b. Verify that OpenJDK 8 has been installed.
Figure1-14 Verifying OpenJDK version
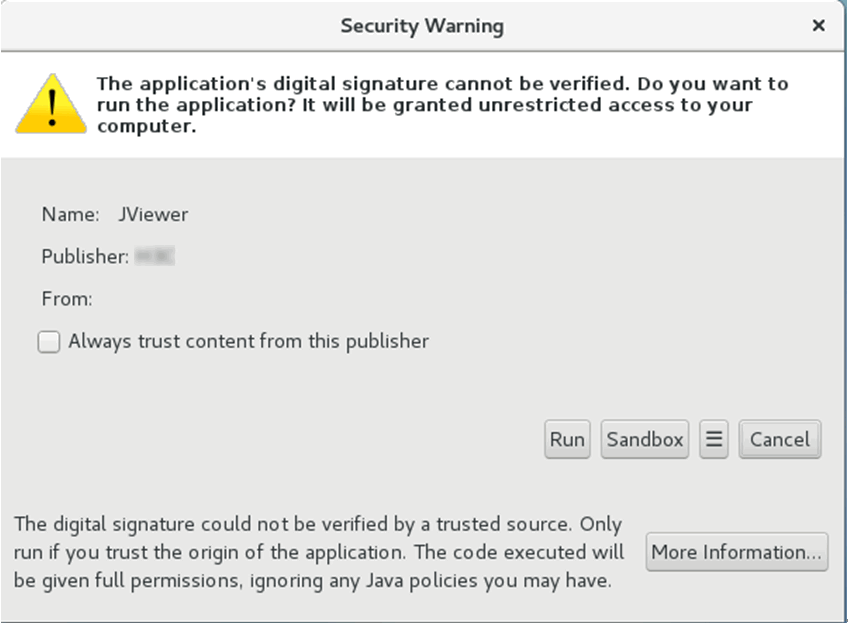
3. Run HDM KVM:
Double-click the downloaded KVM.jnlp file, and then click Run in the dialog box that opens.
Figure1-15 Running the HDM KVM
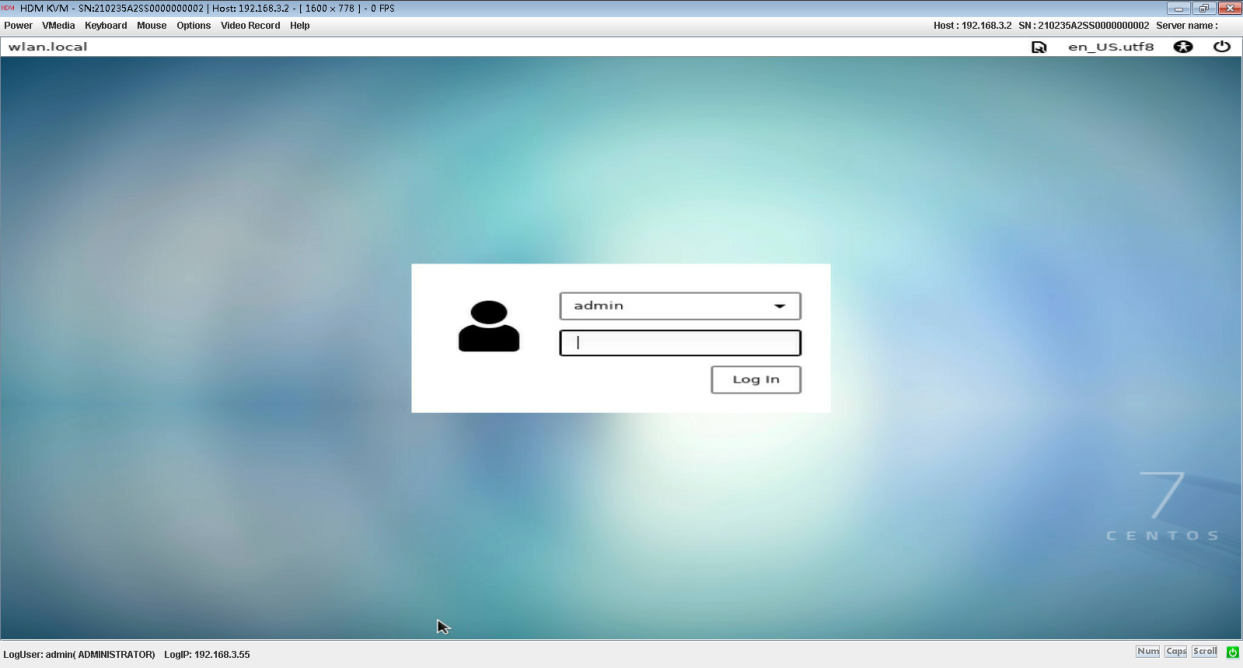
4. The KVM login window opens. You can enter password admin.Default.0506 to access KVM.
Figure1-16 KVM
Logging in to the WBC monitoring platform
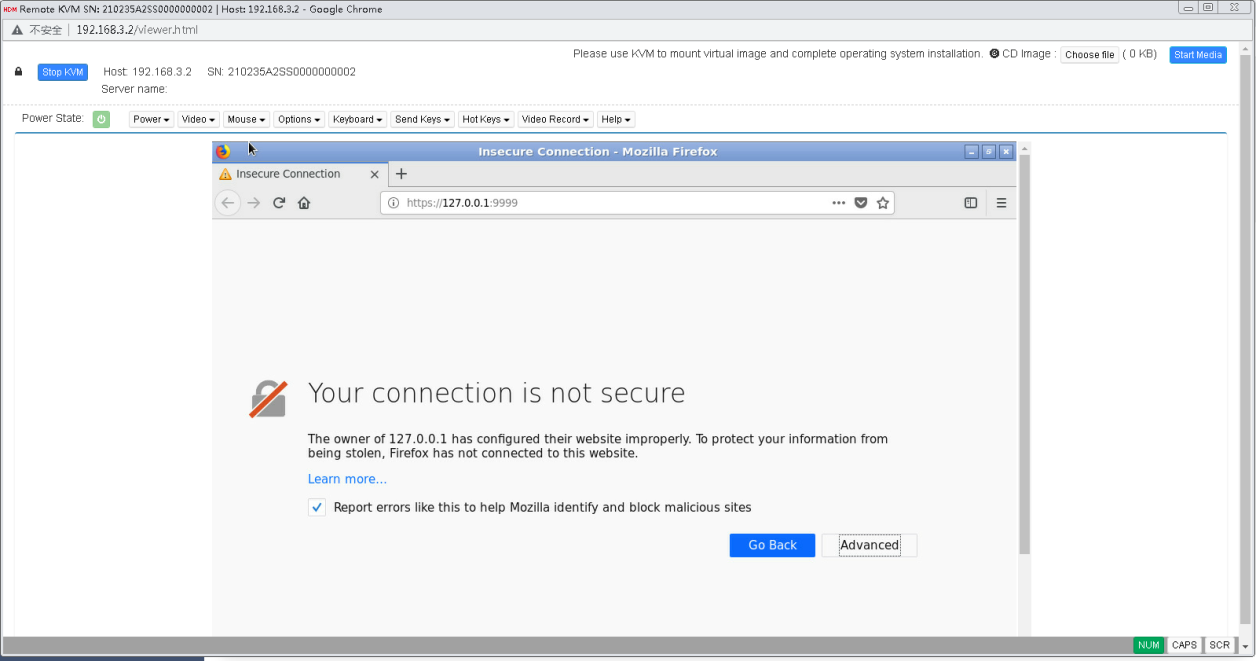
1. Double-click the browser on the remote console homepage of the HDM Web interface. The secure connection confirmation page opens.
Figure1-17 Secure connection confirmation page
2. Click Advanced, Add Exception, and Confirm Security Exception in sequence.
Figure1-18 Clicking Add Exception
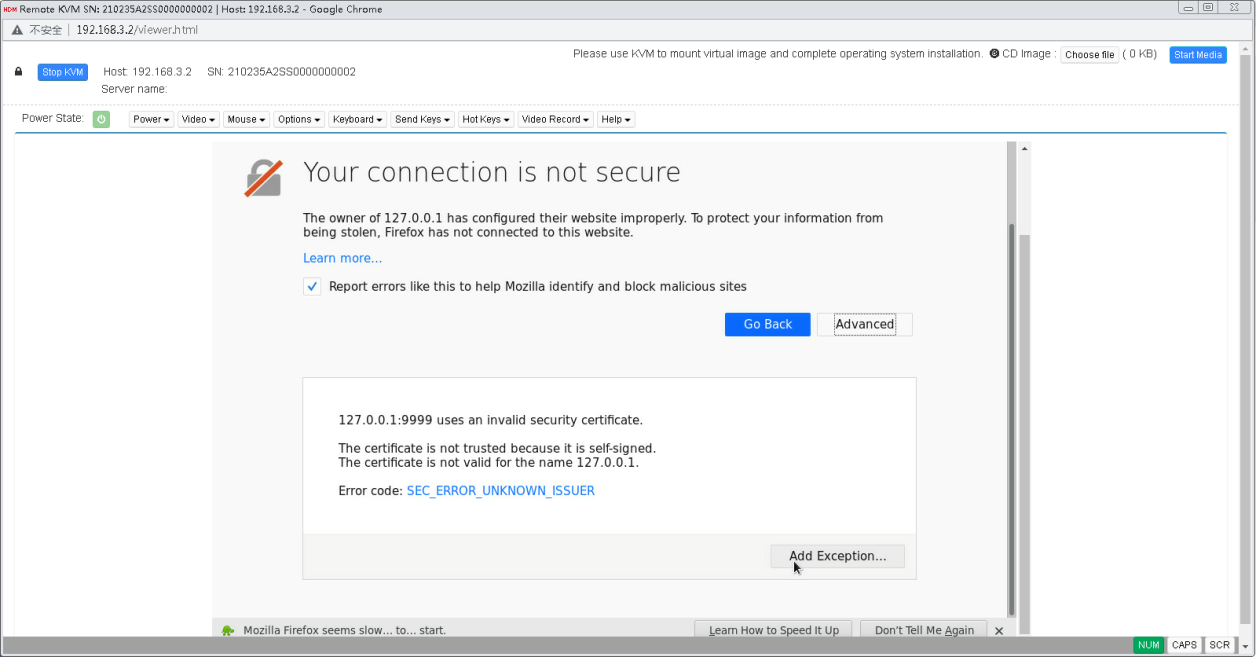
Figure1-19 Clicking Confirm Security Exception
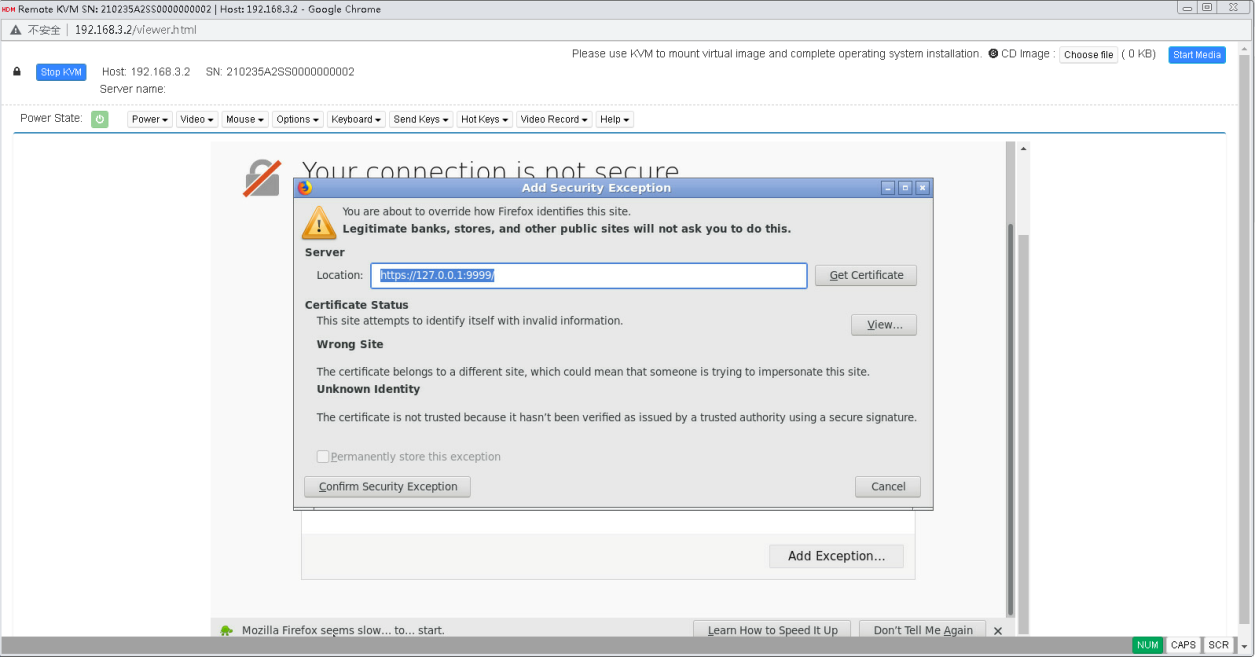
Figure1-20 WBC monitoring platform interface
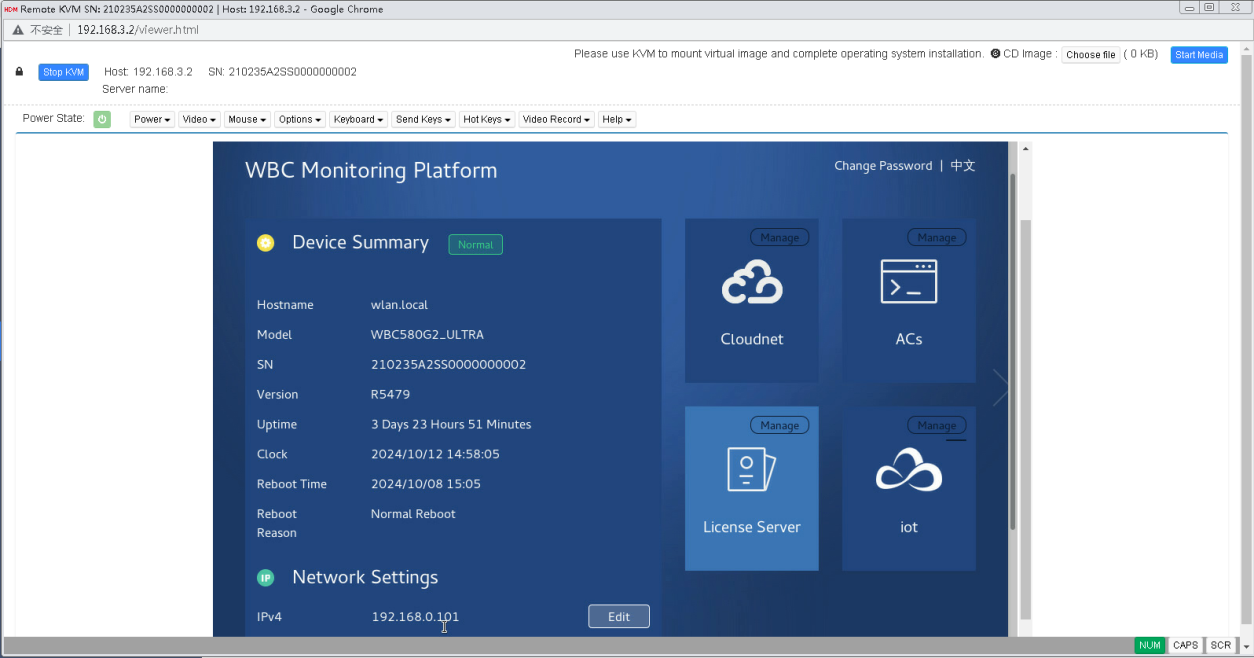
3. (Optional.) Select the interface language. The WBC monitoring platform supports both simplified Chinese and English. To change the login password, click Change Password.
4. To access components, perform the following tasks:
¡ To access Cloudnet, see "Logging in to Cloudnet from the WBC monitoring platform."
¡ To access the AC, see "Logging in to the AC from the WBC monitoring platform."
¡ To access the license server, see "Logging in to the license server from the WBC monitoring platform."
¡ To access Oasis IoT, see "Logging in to Oasis IoT from the WBC monitoring platform."
¡ To access the VM component, see "Logging in to the VM component."
¡ To access the Devices component, see "Logging in to the Devices component."
Logging in to Cloudnet
Logging in to Cloudnet from the WBC monitoring platform
To log in to Cloudnet from the WBC monitoring platform, use either of the following methods:
· Method 1:
a. Log in to the WBC monitoring platform from a browser. For more information, see "Logging in to the WBC monitoring platform from a browser."
b. Access Cloudnet. For more information, see "Accessing the Cloudnet Web interface" and "Accessing the Cloudnet O&M interface."
· Method 2:
a. Log in to the WBC monitoring platform from HDM. For more information, see "Logging in to the WBC monitoring platform from HDM."
b. Access Cloudnet. For more information, see "Accessing the Cloudnet Web interface" and "Accessing the Cloudnet O&M interface."
Accessing the Cloudnet Web interface
1. Click Cloudnet on the WBC monitoring platform homepage.
Figure1-21 Cloudnet Web interface

2. Enter the username and password, and then click Sign In.
The default username and password are oasis_root and oasis_root123456, respectively.
Accessing the Cloudnet O&M interface
To access the Cloudnet O&M interface, click Manage at the top right corner of the Cloudnet tile on the WBC monitoring platform homepage. The Cloudnet O&M interface allows you to view logs, update the system version, manage monitoring, and configure HA and cluster settings.
Figure1-22 Cloudnet O&M homepage
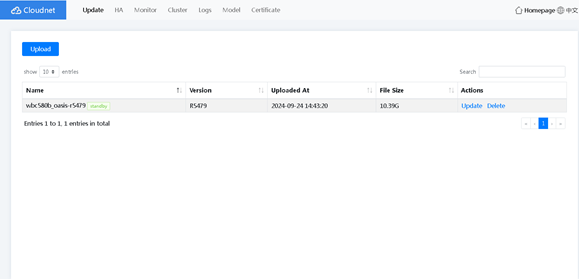
Update the system version
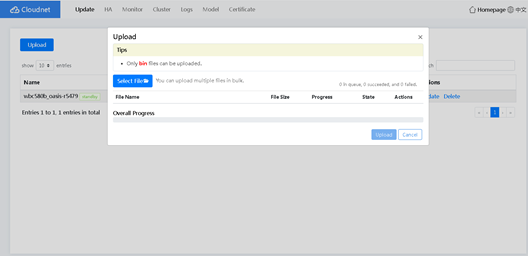
1. Click Upload on the Update tab. In the dialog box that opens, click Select File and select the local Cloudnet image file, and then click Upload. After the upload process ends, close the dialog box.
Figure1-23 Uploading the image file
2. Click Update in the Actions column. In the dialog box that opens, click OK.
|
|
NOTE: As a best practice, back up the Cloudnet data by clicking Back Up on the Rollback tab of the Devices component. |
Configure HA
1. Click the HA tab to configure two devices to back up each other to ensure service continuity.
In the Configure HA area, you can configure the following parameters:
¡ HA ID—The HA ID must be unique in the Layer 2 network. The HA ID must be an integer in the range of 1 to 255.
¡ Virtual IP Address—The virtual IP address is used for the unified management of local and remote devices.
¡ Local IP Address—IP address of the local device.
¡ Remote IP Address—IP address of the remote device.
Figure1-24 Configuring HA
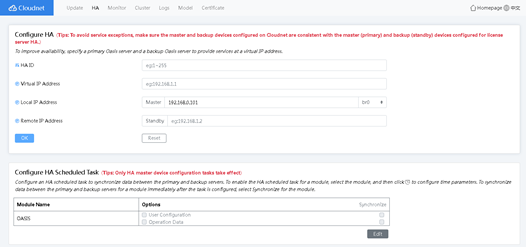
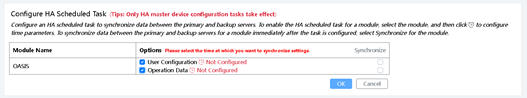
2. Configure an HA task in the Configure HA Scheduled Task area. The device supports 30 data backup tasks. When the 31st data backup task triggers, the first backup data will be overwritten.
¡ To
configure an HA scheduled task, click the ![]() icon to configure the backup interval and then click OK. The local device will back up the data to the remote
device according to the specified backup interval.
icon to configure the backup interval and then click OK. The local device will back up the data to the remote
device according to the specified backup interval.
¡ To configure an immediate HA task, select Synchronize. Thus, the local device will back up the data to the remote device immediately.
Figure1-25 Configuring an HA task
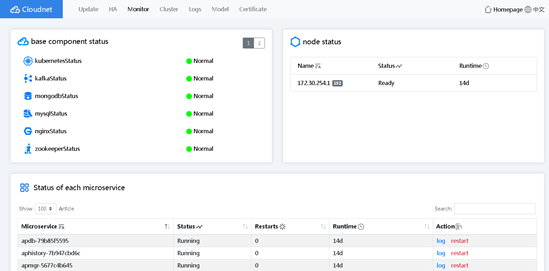
Monitor
Click the Monitor tab to view the component status, node status, and microservice status.
Figure1-26 Monitor page
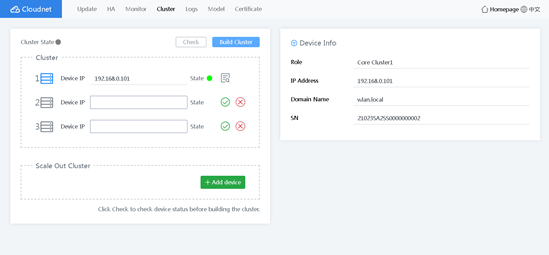
Configure Cluster
Click the Cluster tab to use three physical devices to set up a cluster.
1. Specify the IP addresses of the other two devices and ensure network connectivity between the three devices.
2. Click Check to verify the state of the devices.
3. After the devices pass the check, click Build Cluster.
Figure1-27 Cluster page
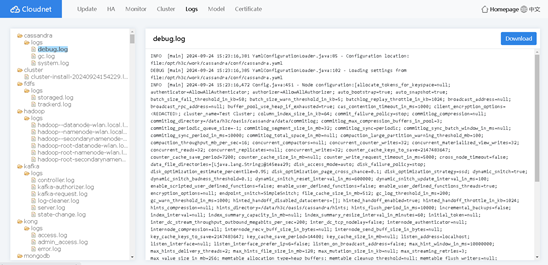
Logs
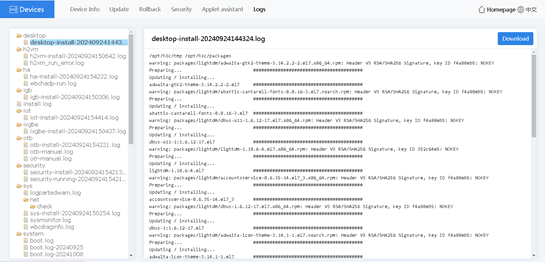
Click the Logs tab to view the detailed logs and perform the following tasks:
· To delete a log file, right-click a log folder name and select Delete.
· To download logs, right-click a log folder name and select Download, or click Download in the upper right corner of the page.
Figure1-28 Logs
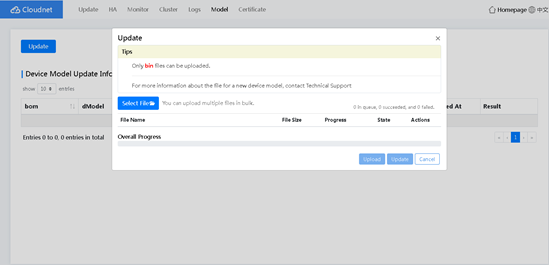
Configure Model
Click the Model tab to update device model information.
1. Click Update.
2. In the dialog box that opens, upload the update file.
Figure1-29 Model management
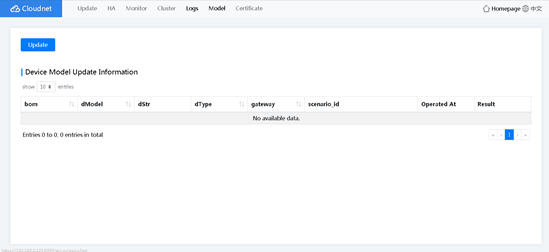
Figure1-30 Uploading the update file
Configure Certificate
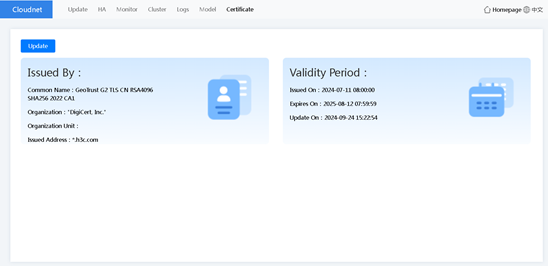
Click the Certificate tab to update the WBC Cloudnet SSL certificate. For more information, see WBC Cloudnet SSL Certificate.
Figure1-31 Updating the WBC Cloudnet SSL certificate
Logging in to Cloudnet from a local PC
1. Enter the URL address of Cloudnet in a browser and press Enter.
This example uses a Google Chrome browser and default URL address https://192.168.0.101:31443.
2. On the verification page, click ADVANCED, and then click Proceed to IP address (unsafe).
3. On the login page, enter the username and password and then click Sign In.
The default username and password are oasis_root and oasis_root123456, respectively.
Figure1-32 Cloudnet login page
Logging in to the AC
Logging in to the AC from the WBC monitoring platform
To log in to the AC from the WBC monitoring platform, use either of the following methods:
· Method 1:
a. Log in to the WBC monitoring platform from a browser. For more information, see "Logging in to the WBC monitoring platform from a browser."
b. Access the AC. For more information, see "Accessing the AC local Web interface" and "Accessing the AC O&M interface."
· Method 2:
a. Log in to the WBC monitoring platform from HDM. For more information, see "Logging in to the WBC monitoring platform from HDM."
b. Access the AC. For more information, see "Accessing the AC local Web interface" and "Accessing the AC O&M interface."
Accessing the AC local Web interface
|
|
IMPORTANT: To access the AC local Web interface, make sure the IP addresses of the PC and AC reside in the same network segment and have network connectivity. |
To access the AC local Web interface:
1. Click ACs on the WBC monitoring platform homepage.
Figure1-33 Local Web interface of the ACs component
2. Enter the username and password, and then click Login.
Both the default username and password are admin.
Accessing the AC O&M interface
To access the AC O&M interface, click Manage at the top right corner of the ACs tile on the WBC monitoring platform homepage. The O&M interface allows you to view logs, update the system version, and view basic configuration.
Figure1-34 O&M homepage
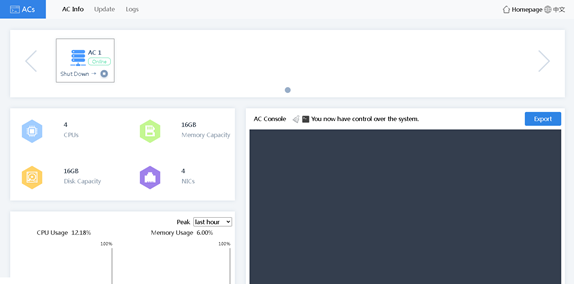
AC Info
On the AC Info page, you can perform the following tasks:
· View the list of ACs that can be managed, and start or shutdown ACs.
· View hardware configuration, CPU usage, memory usage, disk I/O, and network I/O of the ACs.
· Log in to the AC console to operate an AC. To
clear the content of the console, click the ![]() icon.
icon.
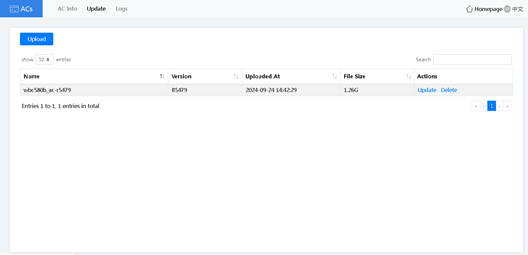
Update the system version
|
|
CAUTION: To avoid AC license loss or AC configuration loss during the update, back up AC license and configuration in advance. |
1. Click the Update tab.
Figure1-35 Update tab
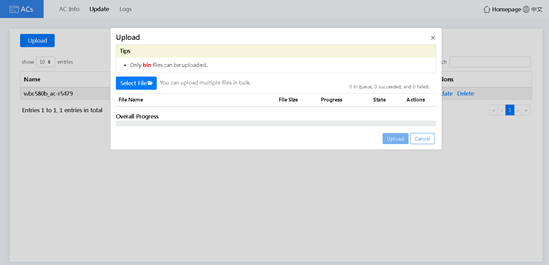
2. (Optional.) Click Upload. In the dialog box that opens, click Select File, select the local update file, and then click Upload. After the upload process ends, close the dialog box.
Figure1-36 Uploading the update file
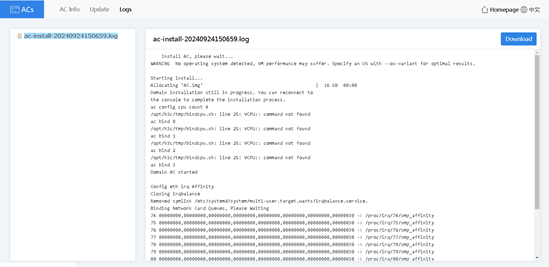
Logs
Click the Logs tab to view the detailed logs and perform the following tasks:
· To delete a log file, right-click a log folder name and select Delete.
· To download logs, right-click a log folder name and select Download, or click Download in the right corner of the page.
Figure1-37 Logs
Logging in to the AC from a local PC
|
|
IMPORTANT: By default, AC is enabled. To disable AC, see "Accessing the AC O&M interface." |
The factory-configured VLAN-interface 1 of the AC obtains an IP address through the DHCP protocol. To enable the AC to obtain an IP address through DHCP, make sure the local PC and AC are in the same subnet. If IP address acquisition through DHCP fails, VLAN-interface 1 of the AC uses the default IP address 192.168.0.100.
You can also log in to the device from HDM or from the WBC monitoring platform to obtain the current IP address of the AC. For more information, see "Logging in to the WBC monitoring platform from a browser" or "Logging in to the WBC monitoring platform from HDM."
Logging in to the AC from the CLI
Use Telnet to log in to the AC from the CLI.
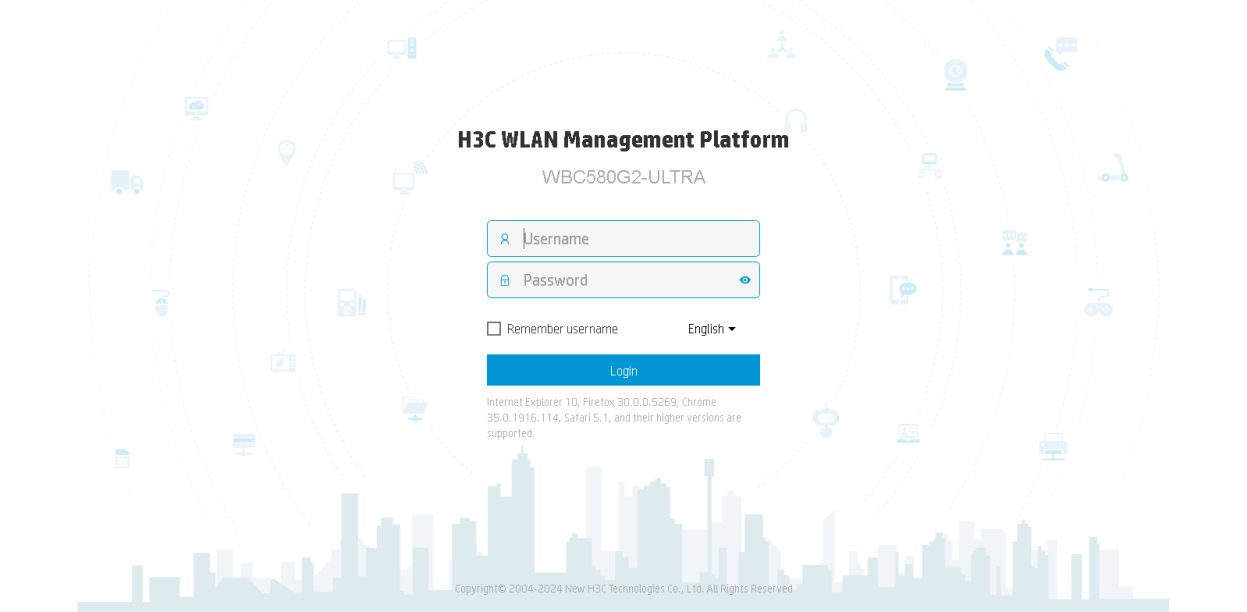
Logging in to the AC from the Web interface
1. Launch the browser, and enter the AC IP address in the https://ip_address format in the address bar and press Enter. This example uses a Google Chrome browser and an AC IP address of 192.168.100.155.
2. On the verification page, click ADVANCED, and then click Proceed to IP address (unsafe).
3. On the login page, enter the username and password, and then click Login.
Both the default username and password are admin.
Figure1-38 AC Web interface login page

Logging in to the license server
Logging in to the license server from the WBC monitoring platform
To log in to the license server from the WBC monitoring platform, use either of the following methods:
· Method 1:
a. Log in to the WBC monitoring platform from a browser. For more information, see "Logging in to the WBC monitoring platform from a browser."
b. Access the license server. For more information, see "Accessing the license server Web interface" and "Accessing the license server O&M interface."
· Method 2:
a. Log in to the WBC monitoring platform from HDM. For more information, see "Logging in to the WBC monitoring platform from HDM."
b. Access the license server. For more information, see "Accessing the license server Web interface" and "Accessing the license server O&M interface."
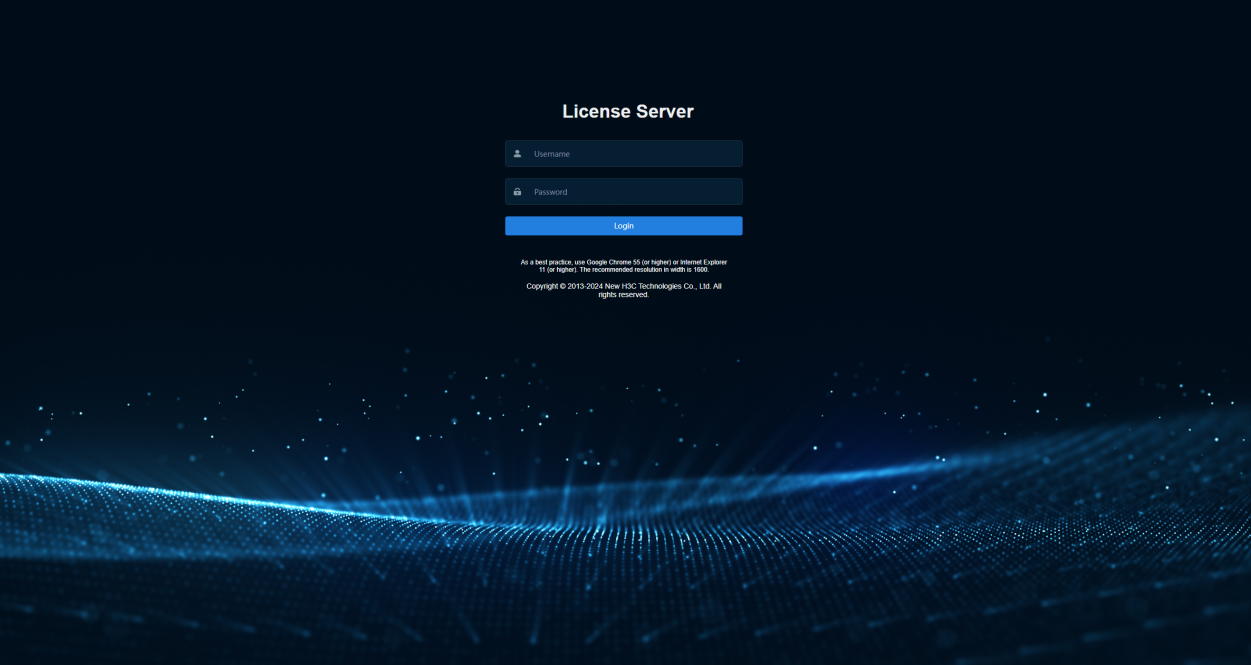
Accessing the license server Web interface
1. Click License Server on the WBC monitoring platform homepage.
2. On the login page, enter the username and password, and then click Login.
The default username is admin.
In a version earlier than E5446P06, the default password is admin@h3c. In E5446P06 or a later version, the default password is admin@123.
Figure1-39 License server login page

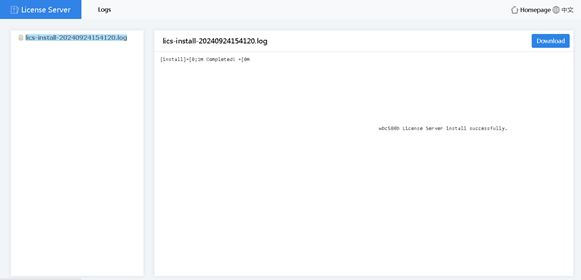
Accessing the license server O&M interface
1. Click Manage at the top right corner of the License Server tile on the WBC monitoring platform homepage.
2. Click the Logs tab to view the detailed logs and perform the following tasks:
¡ To delete a log file, right-click a log folder name and select Delete.
¡ To download logs, right-click a log folder name and select Download, or click Download in the upper right corner of the page.
Figure1-40 License server O&M homepage
Logging in to the license server from a local PC
1. Launch the browser, and enter default license server IP address https://192.168.0.101:28443/licsmger in the address bar. This example uses a Google Chrome browser and the default license server IP address.
2. On the verification page, click ADVANCED, and then click Proceed to IP address (unsafe).
3. On the login page, enter the username and password, and then click Login.
The default username is admin.
In a version earlier than E5446P06, the default password is admin@h3c. In E5446P06 or a later version, the default password is admin@123.
Figure1-41 License server login page
Logging in to Oasis IoT
Logging in to Oasis IoT from the WBC monitoring platform
To log in to Oasis IoT from the WBC monitoring platform, use either of the following methods:
· Method 1:
a. Log in to the WBC monitoring platform from a browser. For more information, see "Logging in to the WBC monitoring platform from a browser."
b. Access Oasis IoT. For more information, see "Accessing Oasis IoT."
· Method 2:
a. Log in to the WBC monitoring platform from HDM. For more information, see "Logging in to the WBC monitoring platform from HDM."
b. Access Oasis IoT. For more information, see "Accessing Oasis IoT."
Accessing Oasis IoT
To access Oasis IoT, click Manage at the top right corner of the iot tile on the WBC monitoring platform homepage. On the page that opens, you can use the WSM feature of the built-in VM to configure wireless parameters and monitor wireless performance.
Figure1-42 Oasis IoT platform
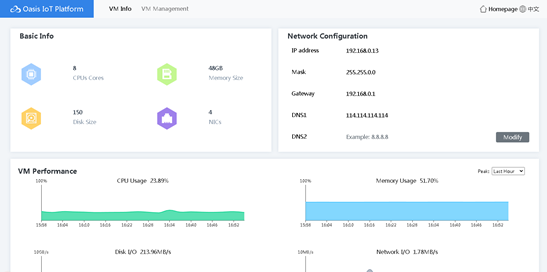
VM Info
On the VM Info tab, you can perform the following tasks:
· View basic VM information, including the number of CPU cores, memory size, disk size, and the number of NICs.
· Configure network settings. Click Modify in the Network Configuration area to edit the IPv4 address, mask, gateway, and DNS servers.
· View VM performance, including the CPU usage, memory usage, disk I/O, and network I/O.
Manage the VM
1. Click the VM Management tab.
Figure1-43 VM management
2. The built-in VM is powered off and
disconnected by default. To start the VM, click ![]() .
.
3. Click Connect.
Figure1-44 Connecting the built-in VM
4. Enter the username and password and press Enter.
The default username and password are root and IoT123qwe$, respectively.
Figure1-45 Logging in to the VM
5. The built-in VM supports WSM, which allows you to configure wireless parameters and monitor wireless performance.
# To log in to WSM, enter the WSM URL address in the address bar of a browser. This example uses a Google Chrome browser and default URL address http://192.168.24.180:8080/imc.
# On the login page, enter the username and password.
Both the default username and password are admin.
|
|
NOTE: · To use WSM, purchase and install the required license. · For more information about WSM, see its online help. |
Logging in to the VM component
To log in to VM component from the WBC monitoring platform, use either of the following methods:
· Method 1:
a. Log in to the WBC monitoring platform from a browser. For more information, see "Logging in to the WBC monitoring platform from a browser."
b. Access the VM component.
· Method 2:
a. Log in to the WBC monitoring platform from HDM. For more information, see "Logging in to the WBC monitoring platform from HDM."
b. Access the VM component.
To log in to the VM component:
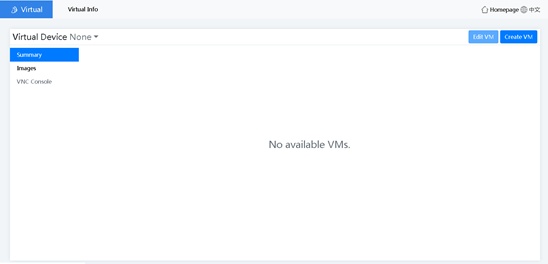
1. Click VM on the WBC monitoring platform homepage. On the page that opens, you can install and use user-defined VMs. You can create a maximum of three VMs on the device.
Figure1-46 VM page
2. From the left navigation pane, select Images.
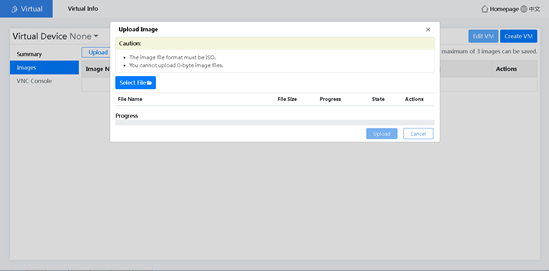
3. Click Upload. In the dialog box that opens, click Select File, select the local VM image file, and then click Upload. After the upload process ends, close the upload dialog box. Do not close the Upload Image dialog box during the upload process.
Figure1-47 Uploading the ISO image file
4. Click Create VM in the upper right corner of the page. In the Create VM dialog box that opens, configure the following parameters and click Create. This example installs a Linux image.
¡ Host Name.
¡ CPUs Cores: The value range is 1 to 4. Configure this parameter based on the total capacity of the AC. As a best practice, set the number of CPU cores to 4.
¡ Memory Size: The value range is 4096 to 32768. Configure this parameter based on the total capacity of the AC. As a best practice, set the memory size to 32768.
¡ Disk Size: The value range is 16 to 256. As a best practice, set the disk size to 256.
¡ Image Type: Options are Linux and Windows. Select an image type based on the uploaded ISO image file.
¡ Image: Select the image file to be installed.
Figure1-48 Creating a VM

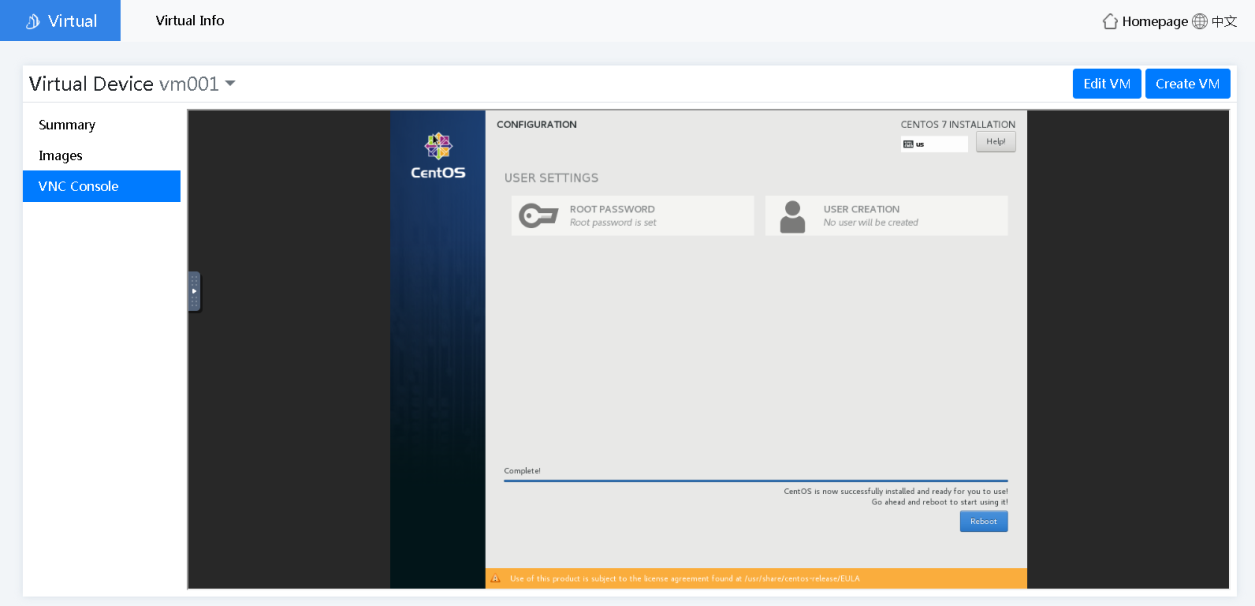
5. After the image is installed, click Finish. The system jumps to the VNC console. Complete VM installation as prompted. The installation procedure varies by VM type.
Figure1-49 Image updated successfully
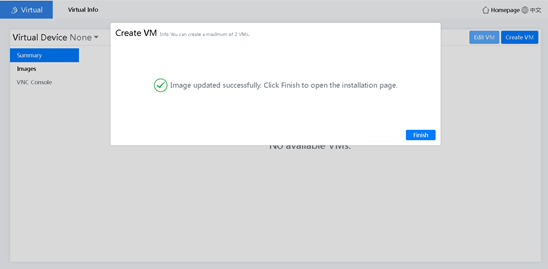
Figure1-50 Installing a VM
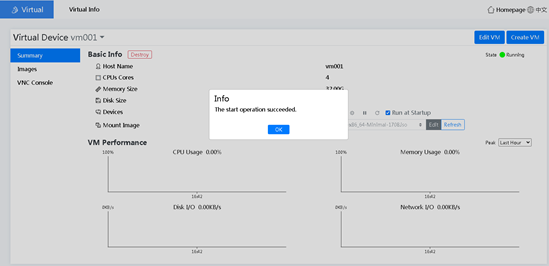
6. A newly-installed VM is powered off. From
the left navigation pane, select Summary. Click the ![]() icon. In the
dialog box that opens, click OK.
icon. In the
dialog box that opens, click OK.
|
|
NOTE: On the Summary page, you can click the icons next to the Devices field to power on, power off, restart, or stop the VM. |
Figure1-51 VM powered on successfully
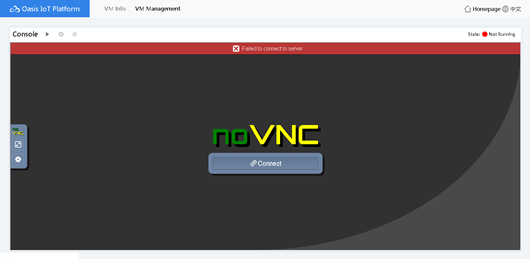
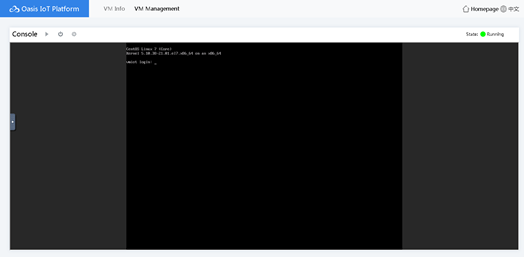
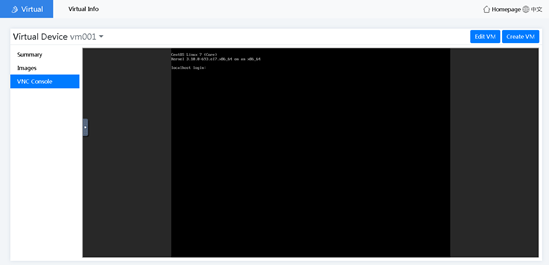
7. From the left navigation pane, select VNC Console. The VM is automatically connected.
Figure1-52 VNC console
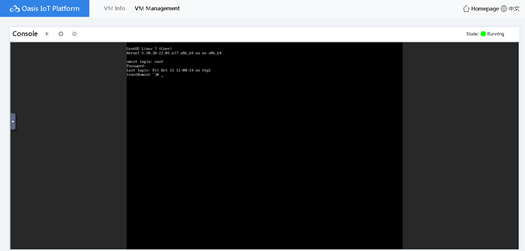
8. Enter the username and password to log in to the VM.
Figure1-53 Logging in to the VM

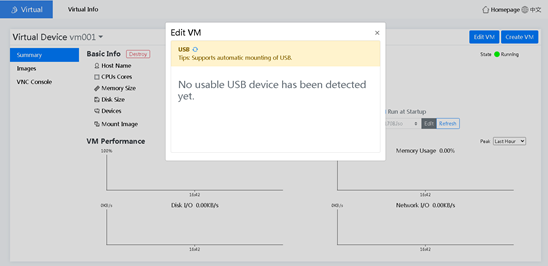
9. (Optional.) To automatically mount USB devices, click Edit VM on the Summary page.
Figure1-54 Editing the VM
Logging in to the Devices component
¡ Log in to the WBC monitoring platform from a browser. For more information, see "Logging in to the WBC monitoring platform from a browser."
¡ Log in to the WBC monitoring platform from HDM. For more information, see "Logging in to the WBC monitoring platform from HDM."
2. To log in to the Devices component:
Click Devices on the WBC monitoring platform homepage. On the Devices page, you can view device information, print logs, update device version, back up or roll back device configuration, and configure security.
Figure1-55 Devices component homepage
Manage the device
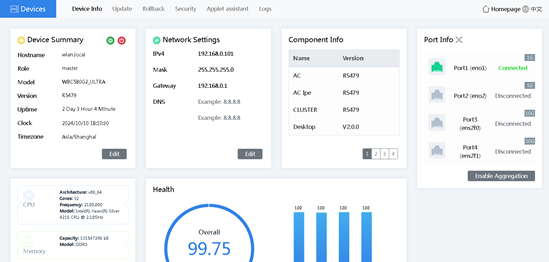
You can perform the following tasks on the Device Info page:
· Device Summary—View hostname, role, model, version, and uptime. To edit the time settings of the device, click Edit.
· Network Settings—View the IPv4 address, mask, gateway, and DNS server addresses. To edit the settings, click Edit.
· Component Info—View the name and version number of each component.
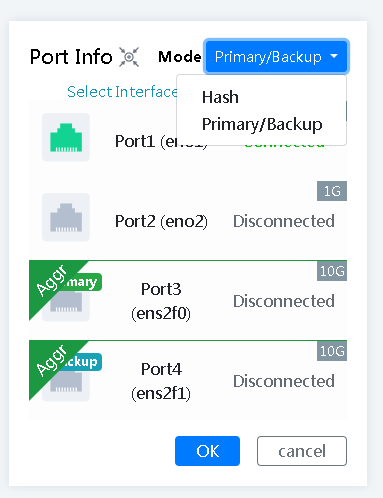
· Port Info—View the port connection status. To enable aggregation, click Enable Aggregation. Then, you can select the Hash or Primary/Backup mode for an aggregation member port.
· Health—View the device health status in real time, including overall health score, CPU usage, memory usage, disk usage, and network I/O rate.
· CPU—View related CPU information.
· Memory—View related memory information.
· Disk—View related disk information.
Figure1-56 Enabling aggregation
Update the system
1. Click the Update tab to update the device to the latest version, thus the device can use the latest features normally.
Figure1-57 Device update page
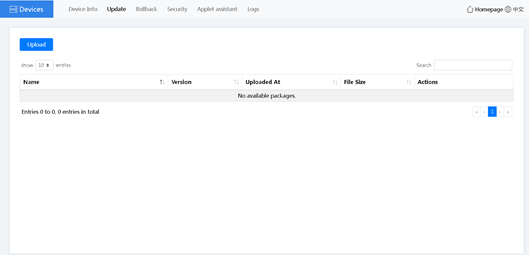
2. (Optional.) Click Upload. In the dialog box that opens, click Select File, select a file for upload, and then click Upload. After the upload process ends, close the dialog box.
Figure1-58 Uploading a file
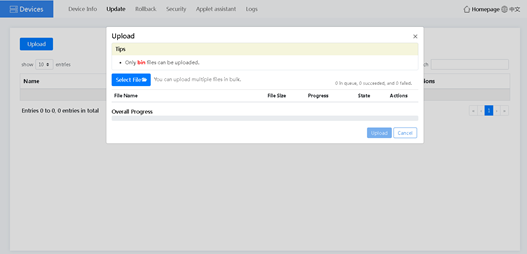
3. Click Update in the Actions column. In the dialog box that opens, click OK.
4. In the dialog box that opens, select an upgrade mode. The system version update will affect the service data.
¡ If you select Uninstall and Upgrade, the system first Uninstall the current system version and then update the system version. During the Uninstallation and update process, the device logout occurs and the device login page displays. After you log in to the device again, you can view the update progress. After the update is completed, a message indicating the successful update will pop up.
¡ If you select Update, the system will update the current system version to the specified system version.
Back up or roll back configuration
Click the Rollback tab to back up the configuration or roll back the history configuration.
Figure1-59 Device rollback page
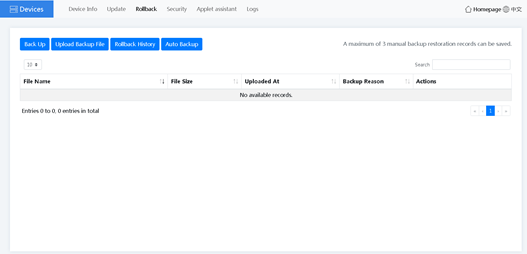
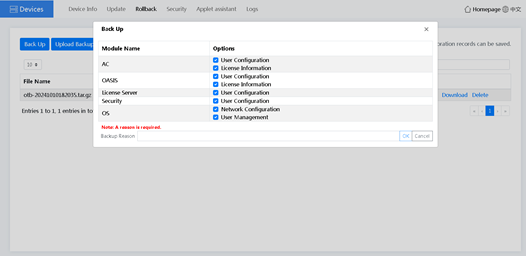
Back Up
1. To back up the device configuration, click Back Up. In the dialog box that opens, select the configuration of modules to be backed up and enter a backup reason, click OK.
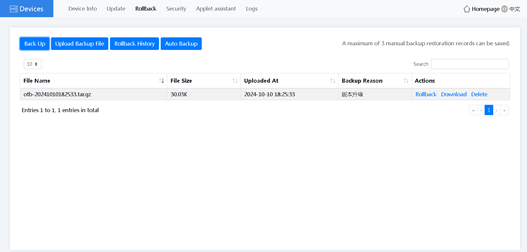
Figure1-60 Backing up the device configuration
2. After the configuration backup is completed, you can click Download, Rollback, or Delete as required.
Figure1-61 Managing the configuration file package
Upload Backup File
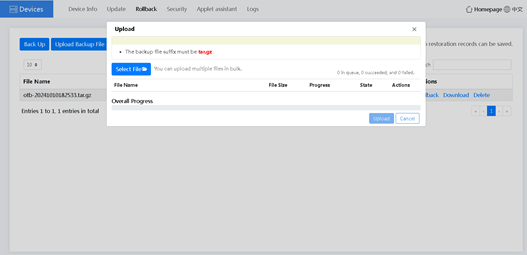
To upload a backup file package, click Upload Backup File. In the dialog box that opens, click Select File, select a file package, and then click Upload.
Figure1-62 Uploading a backup file
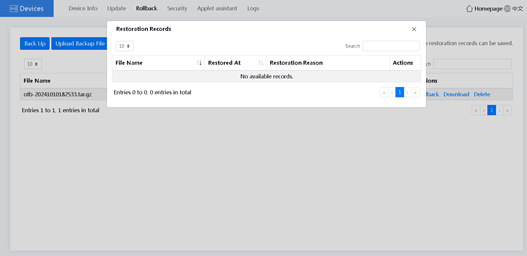
Rollback History
To roll back the history configuration, click Rollback History. You can then view and delete the rollback history records.
Figure1-63 Rolling back history configuration
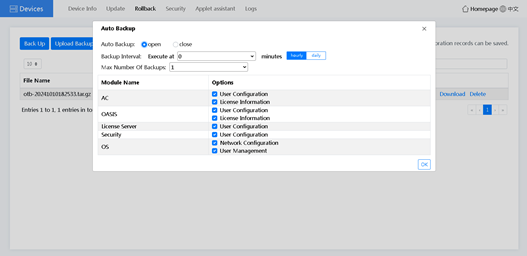
Auto Backup
To configure automatic backup, click Auto Backup. You can enable or disable the automatic backup feature as required.
Figure1-64 Enabling automatic backup
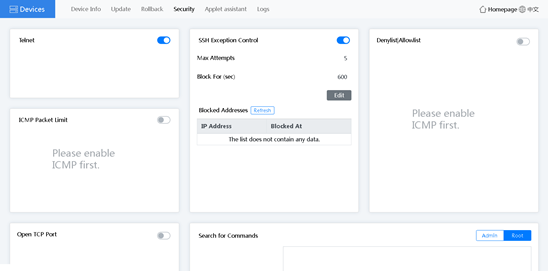
Security
To configure security settings, click the Security tab. Then you can configure the following parameters:
· Telnet—If you disable Telnet, you cannot log in to the device through Telnet to ensure the system security.
· SSH Exception Control—With this feature enabled, the password brute force cracking and DOS attacks can be prevented. You can set the maximum failures per minute and IP disabled duration.
· ICMP Message Limit—With this feature enabled, you can prevent the frequent external device Ping packets from consuming the system resources.
· Blacklist/Whitelist—You can configure blacklists and whitelists to control the device access.
· Open TCP Port—With this feature enabled, the external devices can access the device only through the configured TCP port.
· Query User History Commands—You can use this feature to view the user history operations to determine whether the issue is caused by user improper operation.
Figure1-65 Device security page
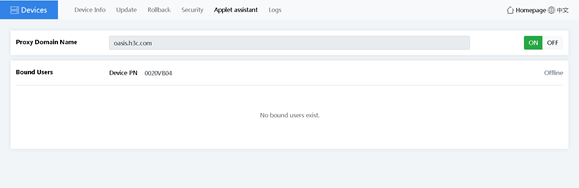
Applet assistant
1. Click the Applet assistant tab.
2. Click ON to the right of the Proxy Domain Name field, as shown in Figure1-66.
3. Search for the WBC Cloud Assistant mini-program on WeChat and bind the device to the mini-program. To ensure successful binding, make sure the device has been connected to the Internet.
Figure1-66 Applet assistant page
Logs
Click the Logs tab to view the detailed logs and perform the following tasks:
· To delete a log file, right-click a log folder name and select Delete.
· To download logs, right-click a log folder name and select Download, or click Download in the right corner of the page.
Figure1-67 Device logs page