- Table of Contents
-
- 09-Network Management Configuration Guide
- 00-Preface
- 01-System Maintenance and Debugging Configuration
- 02-NQA Configuration
- 03-NTP Configuration
- 04-IPC Configuration
- 05-SNMP Configuration
- 06-RMON Configuration
- 07-Mirroring Configuration
- 08-Information Center Configuration
- 09-sFlow Configuration
- 10-Flow Log Configuration
- Related Documents
-
| Title | Size | Download |
|---|---|---|
| 06-RMON Configuration | 107.61 KB |
Configuring the RMON statistics function·
Configuring the RMON Ethernet statistics function·
Configuring the RMON history statistics function
Configuring the RMON alarm function
Displaying and maintaining RMON
Ethernet statistics group configuration example
History group configuration example
Alarm group configuration example
Configuring RMON
Overview
Remote Monitoring (RMON) is an enhancement to SNMP for remote device management and traffic monitoring. An RMON monitor, typically the RMON agent embedded in a network device, periodically or continuously collects traffic statistics for the network attached to a port, and when a statistic crosses a threshold, logs the crossing event and sends a trap to the management station.
RMON uses SNMP traps to notify NMSs of exceptional conditions. RMON SNMP traps report various events, including traffic events such as broadcast traffic threshold exceeded. In contrast, SNMP standard traps report device operating status changes such as link up, link down, and module failure.
RMON enables proactive monitoring and management of remote network devices and subnets. The managed device can automatically send a trap when a statistic crosses an alarm threshold, and the NMS does not need to constantly poll MIB variables and compare the results. As a result, network traffic is reduced.
Working mechanism
RMON monitors typically take one of the following forms:
· Dedicated RMON probes—NMSs can obtain management information from RMON probes directly and control network resources. In this approach, NMSs can obtain all RMON MIB information.
· RMON agents embedded in network devices—NMSs exchange data with RMON agents by using basic SNMP operations to gather network management information. Because this approach is resource intensive, most RMON agent implementations provide only four groups of MIB information: alarm, event, history, and statistics.
H3C devices provide the embedded RMON agent function. You can configure your device to collect and report traffic statistics, error statistics, and performance statistics.
RMON groups
Among the RFC 2819 defined RMON groups, H3C implements the statistics group, history group, event group, and alarm group supported by the public MIB. H3C also implements a private alarm group, which enhances the standard alarm group.
Ethernet statistics group
The statistics group defines that the system collects various traffic statistics on an interface (only Ethernet interfaces are supported), and saves the statistics in the Ethernet statistics table (ethernetStatsTable) for future retrieval. The interface traffic statistics include network collisions, CRC alignment errors, undersize/oversize packets, broadcasts, multicasts, bytes received, and packets received.
After you create a statistics entry for an interface, the statistics group starts to collect traffic statistics on the interface. The statistics in the Ethernet statistics table are cumulative sums.
History group
The history group defines that the system periodically collects traffic statistics on interfaces and saves the statistics in the history record table (ethernetHistoryTable). The statistics include bandwidth utilization, number of error packets, and total number of packets.
The history statistics table record traffic statistics collected for each sampling interval. The sampling interval is user-configurable.
Event group
The event group defines event indexes and controls the generation and notifications of the events triggered by the alarms defined in the alarm group and the private alarm group. The events can be handled in one of the following ways:
· Log—Logs event information (including event name and description) in the event log table of the RMON MIB, so the management device can get the logs through the SNMP Get operation.
· Trap—Sends a trap to notify an NMS of the event.
· Log-Trap—Logs event information in the event log table and sends a trap to the NMS.
· None—No action.
Alarm group
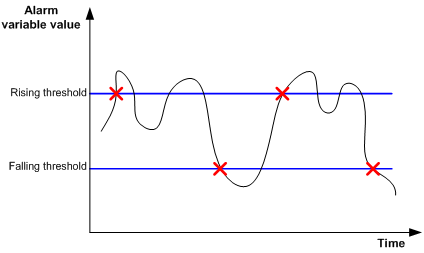
The RMON alarm group monitors alarm variables, such as the count of incoming packets (etherStatsPkts) on an interface. After you define an alarm entry, the system gets the value of the monitored alarm variable at the specified interval. If the value of the monitored variable is greater than or equal to the rising threshold, a rising event is triggered. If the value of the monitored variable is smaller than or equal to the falling threshold, a falling event is triggered. The event is then handled as defined in the event group.
If an alarm entry crosses a threshold multiple times in succession, the RMON agent generates an alarm event only for the first crossing. For example, if the value of a sampled alarm variable crosses the rising threshold multiple times before it crosses the falling threshold, only the first crossing triggers a rising alarm event, as shown in Figure 1.
Figure 1 Rising and falling alarm events
Private alarm group
The private alarm group calculates the values of alarm variables and compares the results with the defined threshold for a more comprehensive alarming function.
The system handles the private alarm entry (as defined by the user) in the following ways:
· Periodically samples the private alarm variables defined in the private alarm formula.
· Calculates the sampled values based on the private alarm formula.
· Compares the result with the defined threshold and generates an appropriate event if the threshold value is reached.
If a private alarm entry crosses a threshold multiple times in succession, the RMON agent generates an alarm event only for the first crossing. For example, if the value of a sampled alarm variable crosses the rising threshold multiple times before it crosses the falling threshold, only the first crossing triggers a rising alarm event. If the count result of the private alarm group overpasses the same threshold multiple times, only the first one can cause an alarm event. In other words, the rising alarm and falling alarm alternate.
Configuring the RMON statistics function
The RMON statistics function can be implemented by either the Ethernet statistics group or the history group, but the objects of the statistics are different, as follows:
· A statistics object of the Ethernet statistics group is a variable defined in the Ethernet statistics table, and the recorded content is a cumulative sum of the variable from the time the statistics entry is created to the current time. For more information, see "Configuring the RMON Ethernet statistics function."
· A statistics object of the history group is the variable defined in the history record table, and the recorded content is a cumulative sum of the variable in each period. For more information, see "Configuring the RMON history statistics function."
Configuring the RMON Ethernet statistics function
You can create one statistics entry for each interface, and a maximum of 100 statistics entries on the device. After the entry limit is reached, you cannot add new entries.
To configure the RMON Ethernet statistics function:
|
Step |
Command |
|
1. Enter system view. |
system-view |
|
2. Enter Ethernet interface view. |
interface interface-type interface-number |
|
3. Create an entry in the RMON statistics table. |
rmon statistics entry-number [ owner text ] |
Configuring the RMON history statistics function
Follow these guidelines when you configure the RMON history statistics function:
· The entry-number for an RMON history control entry must be globally unique. If an entry number has been used on one interface, it cannot be used on another.
· You can configure multiple history control entries for one interface, but you must make sure their entry numbers and sampling intervals are different.
· The device supports a maximum of 100 history control entries.
· You can successfully create a history control entry, even if the specified bucket size exceeds the history table size supported by the device. However, the effective bucket size will be the actual value supported by the device.
To configure the RMON history statistics function:
|
Step |
Command |
|
1. Enter system view. |
system-view |
|
2. Enter Ethernet interface view. |
interface interface-type interface-number |
|
3. Create an entry in the RMON history control table. |
rmon history entry-number buckets number interval sampling-interval [ owner text ] |
Configuring the RMON alarm function
Follow these guidelines when you configure the RMON alarm function:
· To send traps to the NMS when an alarm is triggered, configure the SNMP agent as described in "Configuring SNMP" before configuring the RMON alarm function.
· If the alarm variable is a MIB variable defined in the history group or the Ethernet statistics group, make sure the RMON Ethernet statistics function or the RMON history statistics function is configured on the monitored Ethernet interface. Otherwise, even if you can create the alarm entry, no alarm event can be triggered.
· You cannot create a new event, alarm, or private alarm entry that has the same set of parameters as an existing entry. For parameters to be compared for duplication, see Table 1.
· After the maximum number of entries is reached, no new entry can be created. For the table entry limits, see Table 1.
To configure the RMON alarm function:
|
Step |
Command |
Remarks |
|
1. Enter system view. |
system-view |
N/A |
|
2. Create an event entry in the event table. |
rmon event entry-number [ description string ] { log | log-trap log-trapcommunity | none | trap trap-community } [ owner text ] |
N/A |
|
3. Create an entry in the alarm table or private alarm table. |
· Create an entry in the alarm table: · Create an entry in the private alarm table: |
Use at least one command. |
Table 1 RMON configuration restrictions
|
Entry |
Parameters to be compared |
Maximum number of entries |
|
Event |
Event description (description string), event type (log, trap, logtrap or none) and community name (trap-community or log-trapcommunity) |
60 |
|
Alarm |
Alarm variable (alarm-variable), sampling interval (sampling-interval), sampling type (absolute or delta), rising threshold (threshold-value1) and falling threshold (threshold-value2) |
60 |
|
Prialarm |
Alarm variable formula (alarm-variable), sampling interval (sampling-interval), sampling type (absolute, changeratio or delta), rising threshold (threshold-value1) and falling threshold (threshold-value2) |
50 |
Displaying and maintaining RMON
|
Command |
Remarks |
|
|
Display RMON statistics. |
display rmon statistics [ interface-type interface-number ] [ | { begin | exclude | include } regular-expression ] |
Available in any view. |
|
Display the RMON history control entry and history sampling information. |
display rmon history [ interface-type interface-number ] [ | { begin | exclude | include } regular-expression ] |
Available in any view. |
|
Display RMON alarm configuration. |
display rmon alarm [ entry-number ] [ | { begin | exclude | include } regular-expression ] |
Available in any view. |
|
Display RMON private alarm configuration. |
display rmon prialarm [ entry-number ] [ | { begin | exclude | include } regular-expression ] |
Available in any view. |
|
Display RMON event configuration. |
display rmon event [ entry-number ] [ | { begin | exclude | include } regular-expression ] |
Available in any view. |
|
Display log information for event entries. |
display rmon eventlog [ entry-number ] [ | { begin | exclude | include } regular-expression ] |
Available in any view. |
RMON configuration examples
ACs have either 10 GE or GE interfaces. Table 2 identifies the Ethernet interfaces (GigabitEthernet 1/0/1, in the examples) on different types of ACs.
Table 2 AC Ethernet interfaces
|
Hardware |
AC Ethernet interfaces |
|
AC modules (installed in a switch) |
|
|
LSQM1WCMD0 LSRM1WCM3A1 LSUM3WCMD0 LSUM1WCME0 |
The internal Ethernet interface that connects the AC module to the switch. |
|
Wireless switches |
|
|
WX3024E WX3010E |
The internal Ethernet interface that connects the AC engine to the switching engine. |
|
ACs |
|
|
WX6103 |
The internal Ethernet interface that connects the main control board to the switching board. |
|
WX5002V2 WX5004 WX3510E WX3540E WX5510E |
Any Ethernet interfaces on the AC. |
|
WX2540E WAC360 WAC361 |
Any LAN or WAN interfaces on the AC. |
|
WX5540E |
The internal Ethernet interface that connects the AC engine to the switching engine. |
Ethernet statistics group configuration example
Network requirements
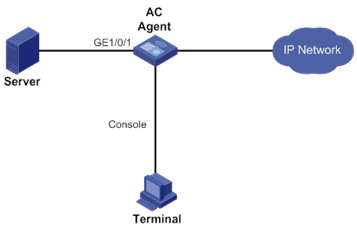
Configure the RMON statistics group on the RMON agent in Figure 2 to gather cumulative traffic statistics for GigabitEthernet 1/0/1.
Configuration procedure
# Configure the RMON statistics group on the RMON agent to gather statistics for GigabitEthernet 1/0/1.
<Sysname> system-view
[Sysname] interface gigabitethernet 1/0/1
[Sysname-GigabitEthernet1/0/1] rmon statistics 1 owner user1
# Display statistics collected by the RMON agent for GigabitEthernet 1/0/1.
<Sysname> display rmon statistics gigabitethernet 1/0/1
EtherStatsEntry 1 owned by user1-rmon is VALID.
Interface : GigabitEthernet1/0/1<ifIndex.3>
etherStatsOctets : 21657 , etherStatsPkts : 307
etherStatsBroadcastPkts : 56 , etherStatsMulticastPkts : 34
etherStatsUndersizePkts : 0 , etherStatsOversizePkts : 0
etherStatsFragments : 0 , etherStatsJabbers : 0
etherStatsCRCAlignErrors : 0 , etherStatsCollisions : 0
etherStatsDropEvents (insufficient resources): 0
Packets received according to length:
64 : 235 , 65-127 : 67 , 128-255 : 4
256-511: 1 , 512-1023: 0 , 1024-1518: 0
# On the configuration terminal, get the traffic statistics through SNMP. (Details not shown.)
History group configuration example
Network requirements
Configure the RMON history group on the RMON agent in Figure 3 to gather periodical traffic statistics for GigabitEthernet 1/0/1 every one minute.

Configuration procedure
# Configure the RMON history group on the RMON agent to gather traffic statistics every one minute for GigabitEthernet 1/0/1. Retain a maximum of eight records for the interface in the history statistics table.
<Sysname> system-view
[Sysname] interface gigabitethernet 1/0/1
[Sysname-GigabitEthernet1/0/1] rmon history 1 buckets 8 interval 60 owner user1
# Display the history data collected for GigabitEthernet 1/0/1.
[Sysname-GigabitEthernet1/0/1] display rmon history
HistoryControlEntry 2 owned by null is VALID
Samples interface : GigabitEthernet1/0/1<ifIndex.3>
Sampling interval : 10(sec) with 8 buckets max
Sampled values of record 1 :
dropevents : 0 , octets : 834
packets : 8 , broadcast packets : 1
multicast packets : 6 , CRC alignment errors : 0
undersize packets : 0 , oversize packets : 0
fragments : 0 , jabbers : 0
collisions : 0 , utilization : 0
Sampled values of record 2 :
dropevents : 0 , octets : 962
packets : 10 , broadcast packets : 3
multicast packets : 6 , CRC alignment errors : 0
undersize packets : 0 , oversize packets : 0
fragments : 0 , jabbers : 0
collisions : 0 , utilization : 0
Sampled values of record 3 :
dropevents : 0 , octets : 830
packets : 8 , broadcast packets : 0
multicast packets : 6 , CRC alignment errors : 0
undersize packets : 0 , oversize packets : 0
fragments : 0 , jabbers : 0
collisions : 0 , utilization : 0
Sampled values of record 4 :
dropevents : 0 , octets : 933
packets : 8 , broadcast packets : 0
multicast packets : 7 , CRC alignment errors : 0
undersize packets : 0 , oversize packets : 0
fragments : 0 , jabbers : 0
collisions : 0 , utilization : 0
Sampled values of record 5 :
dropevents : 0 , octets : 898
packets : 9 , broadcast packets : 2
multicast packets : 6 , CRC alignment errors : 0
undersize packets : 0 , oversize packets : 0
fragments : 0 , jabbers : 0
collisions : 0 , utilization : 0
Sampled values of record 6 :
dropevents : 0 , octets : 898
packets : 9 , broadcast packets : 2
multicast packets : 6 , CRC alignment errors : 0
undersize packets : 0 , oversize packets : 0
fragments : 0 , jabbers : 0
collisions : 0 , utilization : 0
Sampled values of record 7 :
dropevents : 0 , octets : 766
packets : 7 , broadcast packets : 0
multicast packets : 6 , CRC alignment errors : 0
undersize packets : 0 , oversize packets : 0
fragments : 0 , jabbers : 0
collisions : 0 , utilization : 0
Sampled values of record 8 :
dropevents : 0 , octets : 1154
packets : 13 , broadcast packets : 1
multicast packets : 6 , CRC alignment errors : 0
undersize packets : 0 , oversize packets : 0
fragments : 0 , jabbers : 0
collisions : 0 , utilization : 0
# On the configuration terminal, get the traffic statistics through SNMP. (Details not shown.)
Alarm group configuration example
Network requirements
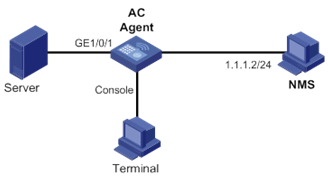
Configure the RMON alarm group on the RMON agent in Figure 4 to send alarms in traps when the 5-second incoming traffic statistic on GigabitEthernet 1/0/1 crosses the rising threshold or drops below the falling threshold.
Configuration procedure
# Configure the SNMP agent with the same SNMP settings as the NMS at 1.1.1.2. This example uses SNMPv1, read community public, and write community private.
<Sysname> system-view
[Sysname] snmp-agent
[Sysname] snmp-agent community read public
[Sysname] snmp-agent community write private
[Sysname] snmp-agent sys-info version v1
[Sysname] snmp-agent trap enable
[Sysname] snmp-agent target-host trap address udp-domain 1.1.1.2 params securityname public
# Configure the RMON statistics group to gather traffic statistics for GigabitEthernet 1/0/1.
[Sysname] interface gigabitethernet 1/0/1
[Sysname-GigabitEthernet1/0/1] rmon statistics 1 owner user1
[Sysname-GigabitEthernet1/0/1] quit
# Create an RMON event entry and an RMON alarm entry so the RMON agent sends traps when the delta sampling value of node 1.3.6.1.2.1.16.1.1.1.4.1 exceeds 100 or drops below 50.
[Sysname] rmon event 1 trap public owner user1
[Sysname] rmon alarm 1 1.3.6.1.2.1.16.1.1.1.4.1 5 delta rising-threshold 100 1 falling-threshold 50 1
# Display the RMON alarm entry configuration.
<Sysname> display rmon alarm 1
AlarmEntry 1 owned by null is Valid.
Samples type : delta
Variable formula : 1.3.6.1.2.1.16.1.1.1.4.1<etherStatsOctets.1>
Sampling interval : 5(sec)
Rising threshold : 100(linked with event 1)
Falling threshold : 50(linked with event 2)
When startup enables : risingOrFallingAlarm
Latest value : 0
# Display statistics for GigabitEthernet 1/0/1.
<Sysname> display rmon statistics gigabitethernet 1/0/1
EtherStatsEntry 1 owned by user1-rmon is VALID.
Interface : GigabitEthernet1/0/1<ifIndex.3>
etherStatsOctets : 57329 , etherStatsPkts : 455
etherStatsBroadcastPkts : 53 , etherStatsMulticastPkts : 353
etherStatsUndersizePkts : 0 , etherStatsOversizePkts : 0
etherStatsFragments : 0 , etherStatsJabbers : 0
etherStatsCRCAlignErrors : 0 , etherStatsCollisions : 0
etherStatsDropEvents (insufficient resources): 0
Packets received according to length:
64 : 7 , 65-127 : 413 , 128-255 : 35
256-511: 0 , 512-1023: 0 , 1024-1518: 0
# Query alarm events on the NMS. (Details not shown.)
On the RMON agent, alarm event messages are displayed when events occur. The following is a sample output:
[Sysname]
#Aug 27 16:31:34:12 2005 Sysname RMON/2/ALARMFALL:Trap 1.3.6.1.2.1.16.0.2 Alarm table 1 monitors 1.3.6.1.2.1.16.1.1.1.4.1 with sample type 2,has sampled alarm value 0 less than(or =) 50.