- Table of Contents
-
- 09-Network Management Configuration Guide
- 00-Preface
- 01-System Maintenance and Debugging Configuration
- 02-NQA Configuration
- 03-NTP Configuration
- 04-IPC Configuration
- 05-SNMP Configuration
- 06-RMON Configuration
- 07-Mirroring Configuration
- 08-Information Center Configuration
- 09-sFlow Configuration
- 10-Flow Log Configuration
- Related Documents
-
| Title | Size | Download |
|---|---|---|
| 01-System Maintenance and Debugging Configuration | 157.93 KB |
Using ping, tracert, and system debugging
Using a ping command to test network connectivity
Using a tracert command to identify failed or all nodes in a path
Debugging information control switches
Using ping, tracert, and system debugging
Use the ping, tracert, and system debugging utilities to test network connectivity and identify network problems.
Ping
The ping utility sends ICMP echo requests (ECHO-REQUEST) to the destination device. Upon receiving the requests, the destination device responds with ICMP echo replies (ECHO-REPLY) to the source device. The source device outputs statistics about the ping operation, including the number of packets sent, number of echo replies received, and the round-trip time. You can measure the network performance by analyzing these statistics.
Using a ping command to test network connectivity
Execute ping commands in any view.
|
Task |
Command |
Remarks |
|
Determine if an address in an IP network is reachable. |
· For IPv4 networks: · For IPv6 networks: |
When you configure the ping command for a low-speed network, set a larger value for the timeout timer (indicated by the -t keyword in the command). Disabling the echo reply function on the destination affects the ping function. |
Ping example
Network requirements
Test the network connectivity between Device A and Device C in Figure 1. If they can reach each other, get detailed information about routes from Device A to Device C.
Configuration procedure
# Use the ping command on Device A to test connectivity to Device C.
<DeviceA> ping 1.1.2.2
PING 1.1.2.2: 56 data bytes, press CTRL_C to break
Reply from 1.1.2.2: bytes=56 Sequence=1 ttl=254 time=205 ms
Reply from 1.1.2.2: bytes=56 Sequence=2 ttl=254 time=1 ms
Reply from 1.1.2.2: bytes=56 Sequence=3 ttl=254 time=1 ms
Reply from 1.1.2.2: bytes=56 Sequence=4 ttl=254 time=1 ms
Reply from 1.1.2.2: bytes=56 Sequence=5 ttl=254 time=1 ms
--- 1.1.2.2 ping statistics ---
5 packet(s) transmitted
5 packet(s) received
0.00% packet loss
round-trip min/avg/max = 1/41/205 ms
# Get detailed information about routes from Device A to Device C.
<DeviceA> ping -r 1.1.2.2
PING 1.1.2.2: 56 data bytes, press CTRL_C to break
Reply from 1.1.2.2: bytes=56 Sequence=1 ttl=254 time=53 ms
Record Route:
1.1.2.1
1.1.2.2
1.1.1.2
1.1.1.1
Reply from 1.1.2.2: bytes=56 Sequence=2 ttl=254 time=1 ms
Record Route:
1.1.2.1
1.1.2.2
1.1.1.2
1.1.1.1
Reply from 1.1.2.2: bytes=56 Sequence=3 ttl=254 time=1 ms
Record Route:
1.1.2.1
1.1.2.2
1.1.1.2
1.1.1.1
Reply from 1.1.2.2: bytes=56 Sequence=4 ttl=254 time=1 ms
Record Route:
1.1.2.1
1.1.2.2
1.1.1.2
1.1.1.1
Reply from 1.1.2.2: bytes=56 Sequence=5 ttl=254 time=1 ms
Record Route:
1.1.2.1
1.1.2.2
1.1.1.2
1.1.1.1
--- 1.1.2.2 ping statistics ---
5 packet(s) transmitted
5 packet(s) received
0.00% packet loss
round-trip min/avg/max = 1/11/53 ms
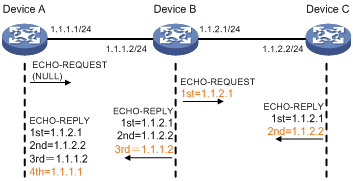
The test procedure with the ping –r command (see Figure 1) is as follows:
1. The source device (Device A) sends an ICMP echo request with the RR option being blank to the destination device (Device C).
2. The intermediate device (Device B) adds the IP address of its outbound interface (1.1.2.1) to the RR option of the ICMP echo request, and forwards the packet.
3. Upon receiving the request, the destination device copies the RR option in the request and adds the IP address of its outbound interface (1.1.2.2) to the RR option. Then the destination device sends an ICMP echo reply.
4. The intermediate device adds the IP address of its outbound interface (1.1.1.2) to the RR option in the ICMP echo reply, and then forwards the reply.
5. Upon receiving the reply, the source device adds the IP address of its inbound interface (1.1.1.1) to the RR option. Finally, you can get the detailed information of routes from Device A to Device C: 1.1.1.1 <-> {1.1.1.2; 1.1.2.1} <-> 1.1.2.2.
Tracert
Tracert (also called "Traceroute") enables you to get the IP addresses of Layer 3 devices in the path to a specific destination. You can use tracert to test network connectivity and identify failed nodes.
Figure 2 Traceroute operation
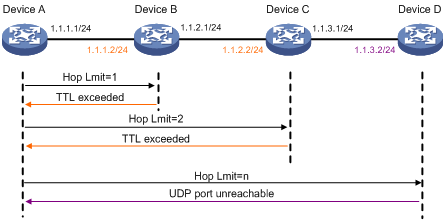
Tracert uses received ICMP error messages to get the IP addresses of devices. As shown in Figure 2, tracert works as follows:
1. The source device (Device A) sends a UDP packet with a TTL value of 1 to the destination device (Device D). The destination UDP port is not used by any application on the destination device.
2. The first hop (Device B, the first Layer 3 device that receives the packet) responds by sending a TTL-expired ICMP error message to the source, with its IP address (1.1.1.2) encapsulated. In this way, the source device can get the address of the first Layer 3 device (1.1.1.2).
3. The source device sends a packet with a TTL value of 2 to the destination device.
4. The second hop (Device C) responds with a TTL-expired ICMP error message, which gives the source device the address of the second Layer 3 device (1.1.2.2).
5. The process continues until the packet sent by the source device reaches the ultimate destination device. Because no application uses the destination port specified in the packet, the destination device responds with a port-unreachable ICMP message to the source device, with its IP address encapsulated. This way, the source device gets the IP address of the destination device (1.1.3.2).
6. The source device thinks that the packet has reached the destination device after receiving the port-unreachable ICMP message, and the path to the destination device is 1.1.1.2 to 1.1.2.2 to 1.1.3.2.
Prerequisites
Before you use a tracert command, perform the tasks in this section.
For an IPv4 network:
· Enable sending of ICMP timeout packets on the intermediate devices (devices between the source and destination devices). If the intermediate devices are H3C devices, execute the ip ttl-expires enable command on the devices. For more information about this command, see Layer 3 Command Reference.
· Enable sending of ICMP destination unreachable packets on the destination device. If the destination device is an H3C device, execute the ip unreachables enable command. For more information about this command, see Layer 3 Command Reference.
For an IPv6 network:
· Enable sending of ICMPv6 timeout packets on the intermediate devices (devices between the source and destination devices). If the intermediate devices are H3C devices, execute the ipv6 hoplimit-expires enable command on the devices. For more information about this command, see Layer 3 Command Reference.
· Enable sending of ICMPv6 destination unreachable packets on the destination device. If the destination device is an H3C device, execute the ipv6 unreachables enable command. For more information about this command, see Layer 3 Command Reference.
Using a tracert command to identify failed or all nodes in a path
Execute tracert commands in any view.
|
Task |
Command |
Remarks |
|
Display the routes from source to destination. |
· For an IPv4 network: · For an IPv6 network: |
Use either method. |
System debugging
The device supports debugging for the majority of protocols and features and provides debugging information to help users diagnose errors.
Debugging information control switches
The following switches control the display of debugging information:
· Protocol debugging switch—Controls whether to generate the protocol-specific debugging information.
· Screen output switch—Controls whether to display the debugging information on a certain screen.
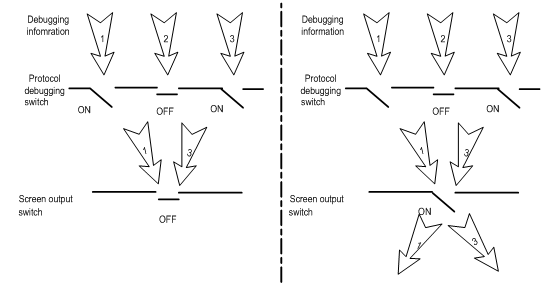
As shown in Figure 3, assume that the device can provide debugging for the three modules 1, 2, and 3. The debugging information can be output on a terminal only when both the protocol debugging switch and the screen output switch are turned on.
Output of debugging information depends on the configurations of the information center and the debugging commands of each protocol and functional module. Debugging information is typically displayed on a terminal (including console or VTY). You can also send debugging information to other destinations. For more information, see "Configuring the information center."
Figure 3 Relationship between the protocol and screen output switch
Debugging a feature module
Output from debugging commands is memory intensive. To guarantee system performance, enable debugging only for modules that are in an exceptional condition. When debugging is complete, use the undo debugging all command to disable all the debugging functions.
Configure the debugging, terminal debugging and terminal monitor commands before you can display detailed debugging information on the terminal. For more information about the terminal debugging and terminal monitor commands, see Network Management and Monitoring Command Reference.
To debug a feature module and display the debugging information on a terminal:
|
Step |
Command |
Remarks |
|
1. Enable the terminal monitoring of system information. |
terminal monitor |
Optional. By default, the terminal monitoring on the console port is enabled and that on the monitoring terminal is disabled. Available in user view. |
|
2. Enable the terminal to display debugging information. |
terminal debugging |
By default, terminal display of debugging information is disabled. Available in user view. |
|
3. Enable debugging for a specified module. |
debugging { all [ timeout time ] | module-name [ option ] } |
By default, debugging for a specified module is disabled. Available in user view. |
|
4. Display the enabled debugging functions. |
display debugging [ interface interface-type interface-number ] [ module-name ] [ | { begin | exclude | include } regular-expression ] |
Optional. Available in any view. |
Ping and tracert example
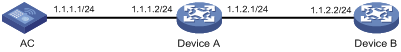
Network requirements
As shown in Figure 4, AC failed to Telnet Device B. Determine whether AC and Device B can reach each other. If they cannot reach each other, locate the failed nodes in the network.
Configuration procedure
1. Use the ping command to test connectivity between AC and Device B.
<AC> ping 1.1.2.2
PING 1.1.2.2: 56 data bytes, press CTRL_C to break
Request time out
Request time out
Request time out
Request time out
Request time out
--- 1.1.2.2 ping statistics ---
5 packet(s) transmitted
0 packet(s) received
100.00% packet loss
The output shows that Device A and Device C cannot reach each other.
2. Use the tracert command to identify failed nodes.
# Enable sending of ICMP timeout packets on Device A.
<DeviceA> system-view
[DeviceA] ip ttl-expires enable
# Enable sending of ICMP destination unreachable packets on Device B.
<DeviceB> system-view
[DeviceB] ip unreachables enable
# Execute the tracert command on AC.
<AC> tracert 1.1.2.2
traceroute to 1.1.2.2(1.1.2.2) 30 hops max,40 bytes packet, press CTRL_C to break
1 1.1.1.2 14 ms 10 ms 20 ms
2 * * *
3 * * *
4 * * *
5
<AC>
The output shows that AC and Device B cannot reach each other, AC and Device A can reach each other, and an error occurred on the connection between Device A and Device B.
# Use the debugging ip icmp command on AC and Device B to verify that they can send and receive the specific ICMP packets, or use the display ip routing-table command to verify the availability of active routes between AC and Device B.