- Table of Contents
-
- H3C S9500 Operation Manual-Release1648[v1.24]-08 System Volume
- 00-1Cover
- 01-Command Line Interface Configuration
- 02-Login and User Interface Configuration
- 03-FTP and TFTP Configuration
- 04-HA Configuration
- 05-NQA Configuration
- 06-NetStream Configuration
- 07-NTP Configuration
- 08-RMON Configuration
- 09-SNMP Configuration
- 10-Packet Statistics Accounting Configuration
- 11-Device Management Configuration
- 12-Configuration File Management Configuration
- 13-File System Management Configuration
- 14-Cluster Management Configuration
- 15-System Maintenance and Debugging Configuration
- 16-Information Center Configuration
- 17-PoE Configuration
- 18-Clock Module Configuration
- 19-ACSEI Server Configuration
- 20-OAP Module Configuration
- Related Documents
-
| Title | Size | Download |
|---|---|---|
| 15-System Maintenance and Debugging Configuration | 80.03 KB |
Chapter 1 System Maintenance and Debugging
1.1 Basic System Configuration
1.1.1 Setting a Name for a Switch
1.1.2 Setting the System Clock
1.2 Displaying the Status and Information of the System
1.3.1 Enabling/Disabling the Terminal Debugging
1.3.2 Displaying Diagnostic Information
1.4 Network Connection Testing Function
1.4.1 Network Connection Testing Configuration Task List
1.4.2 Pinging the IP Address to Check Network Connectivity and Host Reachability
1.4.3 Enabling the tracemac&pingmac Function
1.4.4 Pinging the MAC to Check Network Connectivity and Host Reachability
1.4.5 Testing the Integrity of a Path in the Communication Network
1.4.6 Enabling the quick-ping Function
1.4.7 Testing Gateways Passed by Packets from the Source Host to the Destination One
1.5 Command Line Parser Cache Function
Chapter 1 System Maintenance and Debugging
When configuring system maintenance and debugging, go to these sections for information you are interested in:
l Displaying the Status and Information of the System
l Network Connection Testing Function
l Command Line Parser Cache Function
1.1 Basic System Configuration
The basic system configuration and management includes:
1.1.1 Setting a Name for a Switch
|
To do… |
Use the command… |
Remarks |
|
Set a switch name |
sysname sysname |
Available in system view |
|
Restore the switch name to the default |
undo sysname |
Available in system view |
1.1.2 Setting the System Clock
|
To do… |
Use the command… |
Remarks |
|
Set the system clock |
clock datetime HH:MM:SS YYYY/MM/DD |
Available in user view |
1.1.3 Setting the Time Zone
You can configure the name of the local time zone and the time difference between the local time and the Universal Time Coordinated (UTC) time.
Follow these steps to set the time zone:
|
To do… |
Use the command… |
Remarks |
|
Set the local time |
clock timezone zone-name { add | minus } HH:MM:SS |
Available in user view |
|
Restore to the default UTC time zone |
undo clock timezone |
Available in user view |
By default, the UTC time zone is adopted.
1.1.4 Setting the Summer Time
You can set the name, start and end time of the summer time.
Perform the following configuration to set/remove the summer time:
|
To do… |
Use the command… |
Remarks |
|
Set the name and range of the summer time |
clock summer-time zone-name { one-off | repeating } start-time start-date end-time end-date offset-time |
Available in user view |
|
Remove the setting of the summer time |
undo clock summer-time |
Available in user view |
By default, the summer time is not set.
1.2 Displaying the Status and Information of the System
|
To do… |
Use the command… |
Remarks |
|
Display the system clock |
display clock |
Available in any view |
|
Display the system version |
display version |
Available in any view |
|
Display the status of the debugging |
display debugging [ interface { interface- type interface-number ] [ module-name ] |
Available in any view |
|
Display the information about the optical module connected with an in-position optical port on current frame |
display fiber-module or display fiber-module [ interface-type interface-number ] |
Available in any view |
|
Display the manufacturing information of a card |
display device manuinfo [ slot slot-number ] |
Available in any view |
1.3 System Debugging
System debugging includes:
l Enabling/Disabling the Terminal Debugging
l Displaying Diagnostic Information
1.3.1 Enabling/Disabling the Terminal Debugging
The switch provides various ways for debugging most of the supported protocols and functions, which can help you diagnose and locate the errors.
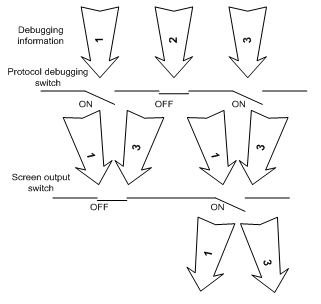
The following ON/OFF switches can control the outputs of the debugging information:
l Protocol debugging ON/OFF switch controls the debugging output of a protocol.
l Terminal debugging ON/OFF switch controls the debugging output on a specified user screen.
The figure below illustrates the relationship between two ON/OFF switches.
Perform the following configuration to enable/disable the debugging:
|
To do… |
Use the command… |
Remarks |
|
Enable the protocol debugging |
debugging { all | timeout interval | module-name [ debugging-option ] } |
Available in user view |
|
Disable the protocol debugging |
undo debugging { all | module-name [ debugging-option ] } |
Available in user view |
|
Enable the terminal debugging |
terminal debugging |
Available in user view |
|
Disable the terminal debugging |
undo terminal debugging |
Available in user view |
For more about the usage and format of the debugging commands, refer to the relevant chapters.
& Note:
Since the debugging output will affect the system operating efficiency, do not enable the debugging without necessity, especially use the debugging all command with caution. When the debugging is over, disable all the debugging.
1.3.2 Displaying Diagnostic Information
When the switch does not run well, you can collect all sorts of information about the switch to locate the source of fault. Each module has its corresponding display command which displays the operating information. You can use the display diagnostic-information command to display the operating information of related modules for fault locating and analyzing.
|
To do… |
Use the command… |
Remarks |
|
Display diagnostic information |
display diagnostic-information |
Available in any view |
& Note:
l When using the display diagnostic-information command to keep track of the switch, you should execute the command at least twice so that you can compare the information for locating problems. After you execute the command, the system prints a large amount of information consecutively, thereby affecting system performance at a certain degree. Therefore, use this command with caution.
l Before executing the display diagnostic-information command, configure the terminal debugging and terminal monitor commands in user view first.
1.4 Network Connection Testing Function
1.4.1 Network Connection Testing Configuration Task List
Complete these tasks to configure network connection testing function:
|
Task |
Remarks |
|
Pinging the IP Address to Check Network Connectivity and Host Reachability |
Optional |
|
Optional |
|
|
Pinging the MAC to Check Network Connectivity and Host Reachability |
Optional |
|
Testing the Integrity of a Path in the Communication Network |
Optional |
|
Optional |
|
|
Testing Gateways Passed by Packets from the Source Host to the Destination One |
Optional |
1.4.2 Pinging the IP Address to Check Network Connectivity and Host Reachability
|
To do… |
Use the command… |
Remarks |
|
Check network connectivity and host reachability |
ping [ ip ] [ -a ip-address | -c count | -d | -f | -h ttl | -i { interface-type interface-number } | -n | - p pattern | -q | -r | -s packetsize | -t timeout | -tos tos | -v | -vpn-instance vpn-instance-name ]* host |
You can use this command in any view. |
The output of the command includes:
l The response to each ping message. If no response packet is received when the timer expires, ”Request time out” information appears. Otherwise, the data bytes, the packet sequence number, TTL, and the round-trip time of the response packet will be displayed.
l The final statistics, including the number of sent packets, the number of received packets, the packet loss ratio, the round-trip time in its minimum value, mean value and maximum value.
1.4.3 Enabling the tracemac&pingmac Function
|
To do… |
Use the command… |
Remarks |
|
Enter system view |
system-view |
— |
|
Enable the tracemac&pingmac function |
tracemac enable |
Disabled by default. |
The tracemac&pingmac functions cannot go without the support of NDP, and will not work if NDP and tracemac are disabled.
By default, NDP and tracemac&pingmac are disabled.
![]() Caution:
Caution:
1.4.4 Pinging the MAC to Check Network Connectivity and Host Reachability
|
To do… |
Use the command… |
Remarks |
|
Enter system view |
system-view |
— |
|
Enable the global NDP function |
ndp enable |
Required Disabled by default. |
|
Enter port view |
interface interface-type interface-number |
— |
|
Enable the NDP function for the port |
ndp enable |
Required Disabled by default. |
|
Ping the MAC to check the Layer 2 network connectivity and host reachability |
pingmac mac-address vlan vlan-id |
You can use this command in any view. The output of the command includes: destination address reachable or unreachable. |
& Note:
Now, the pingmac command can be used to probe only hosts in the same VLAN.
1.4.5 Testing the Integrity of a Path in the Communication Network
Test the integrity of a path in the communication network so as to locate the fault information and the information of the port from which the network attack was originated.
|
To do… |
Use the command… |
Remarks |
|
Test the integrity of a path in the communication network |
tracemac { by-mac mac-address vlan vlan-id | by-ip ip-address } [ nondp ] |
You can use this command in any view. |
1.4.6 Enabling the quick-ping Function
Now, the S9500 Switch responds slowly to a Ping request, because all processing actions of the Ping command (including an ICMP Request) are sent to the SRPU. As a result, it causes great load to the system and even affects system running. To solve this problem, the Switch provides a quick-ping enable command so that all processing actions are implemented on the interface card. It relieves the load on the SRPU, and speeds up the processing of the Ping command.
Follow these steps to enable the quick-ping function:
|
To do… |
Use the command… |
Remarks |
|
Enter system view |
system-view |
— |
|
Enable the quick-ping function |
quick-ping enable |
Enabled by default. |
& Note:
MPLS packets, Ping packets received on an MPLS-enabled interface and large Ping packets (to be fragmented) are still sent to the SRPU of the device for processing.
1.4.7 Testing Gateways Passed by Packets from the Source Host to the Destination One
Test the gateways passed by the packets from the source host to the destination one to check whether the network is connected and analyze where the fault occurs in the network.
|
To do… |
Use the command… |
Remarks |
|
Test the gateways passed by the packets from the source host to the destination one to check whether the network is connected |
tracert [ -a source-IP | -f first-TTL | -m max-TTL | -p port | -q num-packet | -vpn-instance vpn-instance-name | -w timeout ] string |
You can use this command in any view. |
The execution process of the tracert command is described as follows: Send a packet with TTL value as 1 and the first hop sends back an ICMP error message indicating that the packet cannot be sent, for the TTL is timeout. Re-send the packet with TTL value as 2 and the second hop returns the TTL timeout message. The process is carried out over and over until the packet reaches the destination. The purpose to carry out the process is to record the source address of each ICMP TTL timeout message, so as to provide the route of an IP packet to the destination.
![]() Caution:
Caution:
At present, the device does not support using the tracert command to check whether a network is reachable and identify failed node(s) in the event of network failure in an MPLS domain.
1.5 Command Line Parser Cache Function
When the device is running, it takes long time to execute and resolve some commands. In particular, batch execution of this type of commands may increase the system load, or even affect the normal operation of the system. Therefore, the switch provides the command line parser cache function to improve the resolution and execution efficiency of commands.
Follow these steps to enable the command line cache function:
|
To do… |
Use the command… |
Remarks |
|
Enter system view |
system-view |
— |
|
Enable the command line parser cache function |
parser cache |
Disabled by default. |
& Note:
The command line parser cache function takes effect only when all command elements that you enter are complete ones. That is, no abbreviations are used. For example, the command undo arp 1.1.1.1 is not abbreviated to und ar 1.1.1.1. Thus, you are recommended to use the parser cache command to speed up the command execution of the system only in some special cases, for example, you need to batch-execute a certain command.
