- Table of Contents
-
- H3C S9500 Operation Manual-Release1648[v1.24]-08 System Volume
- 00-1Cover
- 01-Command Line Interface Configuration
- 02-Login and User Interface Configuration
- 03-FTP and TFTP Configuration
- 04-HA Configuration
- 05-NQA Configuration
- 06-NetStream Configuration
- 07-NTP Configuration
- 08-RMON Configuration
- 09-SNMP Configuration
- 10-Packet Statistics Accounting Configuration
- 11-Device Management Configuration
- 12-Configuration File Management Configuration
- 13-File System Management Configuration
- 14-Cluster Management Configuration
- 15-System Maintenance and Debugging Configuration
- 16-Information Center Configuration
- 17-PoE Configuration
- 18-Clock Module Configuration
- 19-ACSEI Server Configuration
- 20-OAP Module Configuration
- Related Documents
-
| Title | Size | Download |
|---|---|---|
| 08-RMON Configuration | 67.15 KB |
Table of Contents
1.2.1 Adding/Deleting an Entry to/from the Event Table
1.2.2 Adding/Deleting an Entry to/from the Alarm Table
1.2.3 Adding/Deleting an Entry to/from the Extended RMON Alarm Table
1.2.4 Adding/Deleting an Entry to/from the History Control Table
1.2.5 Adding/Deleting an Entry to/from the Statistics Table
1.3 Displaying and Maintaining RMON
1.4 RMON Configuration Example
Chapter 1 RMON Configuration
When configuring RMON, go to these sections for information you are interested in:
l Displaying and Maintaining RMON
1.1 RMON Overview
Remote Monitoring (RMON) is a type of Internet Engineering Task Force (IETF)-defined MIB. It is the most important enhancement to the MIB II standard. It mainly used for monitoring the data traffic on a segment and even on a whole network. It is one of the widely used Network Management standards by far.
RMON is implemented fully based on the SNMP architecture (which is one of its outstanding advantages) and compatible with the existing SNMP framework, and therefore it is unnecessary to adjust the protocol. RMON includes NMS and the Agent running on the network devices. On the network monitor or detector, RMON Agent tracks and accounts different traffic information on the segment connected to its port, such as the total number of packets on a segment in a certain period of time or that of the correct packets sent to a host. RMON helps the SNMP monitor the remote network device more actively and effectively, which provides a highly efficient means for the monitoring of the subnet operations. RMON can reduce the communication traffic between the NMS and the agent, thus facilitates an effective management over the large interconnected networks.
RMON allows multiple monitors. It can collect data in two ways.
l One is to collect data with a special RMON probe. NMS directly obtains the management information from the RMON probe and controls the network resource. In this way, it can obtain all the information of RMON MIB
l Another way is to implant the RMON Agent directly into the network devices (for example router, switch and HUB), so that the devices become network facilities with RMON probe function. RMON NMS uses the basic SNMP commands to exchange data information with SNMP Agent and collect NM information. However, limited by the device resources, normally, not all the data of RMON MIB can be obtained with this method. In most cases, only four groups of information can be collected. The four groups include alarm information, event information, history information and statistics information.
The switch implements RMON in the second method by far. With the RMON-supported SNMP Agent running on the network monitor, NMS can obtain such information as the overall traffic of the segment connected to the managed network device port, the error statistics and performance statistics, thereby implementing the management (generally remote management) over the network.
1.2 Configuring RMON
& Note:
Before configuring RMON, you must ensure that the SNMP agent is properly configured. See SNMP Configuration in the System Volume for the SNMP agent configuration.
The following sections describe the RMON configuration tasks.
l Adding/Deleting an Entry to/from the Event Table
l Adding/Deleting an Entry to/from the Alarm Table
l Adding/Deleting an Entry to/from the Extended RMON Alarm Table
l Adding/Deleting an Entry to/from the History Control Table
l Adding/Deleting an Entry to/from the Statistics Table
1.2.1 Adding/Deleting an Entry to/from the Event Table
RMON event management defines the event ID and the handling of the event.
You can handle the event in the following ways:
l Keeping logs
l Sending the trap messages to NMS
l Keeping logs and sending the trap messages to NMS
Perform the following configuration to add/delete an entry to/from the event table:
|
To do… |
Use the command… |
Remarks |
|
Add an entry to the event table |
rmon event event-entry [ description string ] { log | trap trap-community | log-trap log-trapcommunity | none } [ owner rmon-station ] |
Available in system view |
|
Delete an entry from the event table |
undo rmon event event-entry |
Available in system view |
1.2.2 Adding/Deleting an Entry to/from the Alarm Table
RMON alarm management can monitor the specified alarm variables such as the statistics on a port. When a value of the monitored data exceeds the defined threshold, an alarm event will be generated. And then the events are handled according to the definition, which is decided in the event management.
& Note:
Before adding an entry to the alarm table, you need to define the event referenced in the alarm table by using the rmon event command.
Perform the following configuration to add/delete an entry to/from the alarm table:
|
To do… |
Use the command… |
Remarks |
|
Add an entry to the alarm table |
rmon alarm entry-number alarm-variable sampling-time { delta | absolute } rising-threshold threshold-value1 event-entry1 falling-threshold threshold-value2 event-entry2 [ owner text ] |
Available in system view |
|
Delete an entry from the alarm table |
undo rmon alarm entry-number |
Available in system view |
After you defined the alarm entry, the system then processes the entry in the following way:
1) Sampling the defined alarm-variable according to the time interval sampling-time that you have set
2) Comparing the sampled value with the configured threshold and handling them in the way described in the following table
Table 1-1 Handle the alarm entry
|
Case |
Processing |
|
The sampled value is greater than the configured upper limit threshold-value1 |
The defined event event-entry1 is triggered |
|
The sampled value is less than the configured lower limit threshold-value2 |
The defined event event-entry2 is triggered |
1.2.3 Adding/Deleting an Entry to/from the Extended RMON Alarm Table
You can use the command to add/delete an entry to/from the extended RMON alarm table. The extended alarm entry performs mathematical operation to the sampled value of the alarm variable, and then the result will be compared with the configured threshold to implementing the alarm function.
& Note:
Before adding extended alarm entry, you need to define the referenced event in the extended alarm entry by using the rmon event command.
You can define up to 50 prialarm entries.
Perform the following configuration to add/delete an entry to/from the extended RMON alarm table:
|
To do… |
Use the command… |
Remarks |
|
Add an entry to the extended RMON alarm table |
rmon prialarm entry-number alarm-var [ alarm-des ] sampling-timer { delta | absolute | changeratio } rising-threshold threshold-value1 event-entry1 falling-threshold threshold-value2 event-entry2 entrytype { forever | cycle cycle-period } [ owner text ] |
Available in system view |
|
Delete an entry from the extended RMON alarm table |
undo rmon prialarm entry-number |
Available in system view |
After you define the extended alarm entry, the system processes the entry in the following way:
1) Sampling the defined prialarm-formula according to the time interval sampling-time that you have set
2) Performing the operation to the sampled value according to the defined formula prialarm-formula
3) Comparing the result with the configured threshold and handling them in the way described in the following table
Table 1-2 Handle the extended alarm entry
|
Case |
Processing |
|
The result is greater than the configured upper limit threshold-value1 |
The defined event event-entry1 is triggered |
|
The result is less than the configured lower limit threshold-value2 |
The defined event event-entry2 is triggered |
1.2.4 Adding/Deleting an Entry to/from the History Control Table
The history data management helps you set the history data collection, periodical data collection and storage of the specified ports. The sampling information includes the utilization ratio, error counts and total number of packets.
You can use the following commands to add/delete an entry to/from the history control table.
Perform the following configuration to add/delete an entry to/from the history control table:
|
To do… |
Use the command… |
Remarks |
|
Add an entry to the history control table. |
rmon history entry-number buckets number interval sampling-interval [ owner text-string ] |
Available in Ethernet port view |
|
Delete an entry from the history control table. |
undo rmon history entry-number |
Available in Ethernet port view |
History control entry calculates various data at the sampling time interval. You can use the display rmon history command to view the information of the history control entry.
1.2.5 Adding/Deleting an Entry to/from the Statistics Table
The RMON statistics management concerns the port usage monitoring and error statistics when using the ports. The statistics include collision, CRC and queuing, undersize packets or oversize packets, timeout transmission, fragments, broadcast, multicast and unicast messages and the usage ratio of bandwidth.
You can use the following commands to add/delete an entry to/from the statistics table.
Perform the following configuration to add/delete an entry to/from the statistics table:
|
To do… |
Use the command… |
Remarks |
|
Add an entry to the statistics table |
rmon statistics entry-number [ owner text-string ] |
Available in Ethernet port view |
|
Delete an entry from the statistics table |
undo rmon statistics entry-number |
Available in Ethernet port view |
1.3 Displaying and Maintaining RMON
|
To do… |
Use the command… |
Remarks |
|
Display the RMON statistics |
display rmon statistics [ port-num ] |
Available in any view |
|
Display the history information of RMON |
display rmon history [ port-num ] |
Available in any view |
|
Display the alarm information of RMON |
display rmon alarm [ alarm-table-entry ] |
Available in any view |
|
Display the extended alarm information of RMON |
display rmon prialarm [ prialarm-table-entry ] |
Available in any view |
|
Display the RMON event |
display rmon event [ event-table-entry ] |
Available in any view |
|
Display the event log of RMON |
display rmon eventlog [ event-number ] |
Available in any view |
1.4 RMON Configuration Example
I. Network requirements
Set an entry in RMON Ethernet statistics table for the Ethernet port performance, which is convenient for network administrators’ query.
II. Network diagram
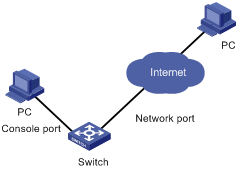
Figure 1-1 Network diagram for RMON configuration
III. Configuration procedure
# Configure RMON.
<H3C> system-view
System View: return to User View with Ctrl+Z.
[H3C] interface Ethernet 3/1/1
[H3C-Ethernet3/1/1] rmon statistics 1 owner test-rmon
# View the configurations in user view.
<H3C> display rmon statistics Ethernet 3/1/1
Statistics entry 1 owned by test-rmon is VALID.
Interface : Ethernet3/1/1<ifIndex.201326602>
etherStatsOctets : 0 , etherStatsPkts : 0
etherStatsBroadcastPkts : 0 , etherStatsMulticastPkts : 0
etherStatsUndersizePkts : 0 , etherStatsOversizePkts : 0
etherStatsFragments : 0 , etherStatsJabbers : 0
etherStatsCRCAlignErrors : 0 , etherStatsCollisions : 0
etherStatsDropEvents (insufficient resources): 0
Packets received according to length (etherStatsPktsXXXtoYYYOctets):
64 : 0 , 65-127 : 0 , 128-255 : 0
256-511: 0 , 512-1023: 0 , 1024-max : 0
# Configure an event before configuring alarm and prialarm.
[H3C]rmon event 1 log owner test-rmon
[H3C]display rmon event 1
Event table 1 owned by test-rmon is VALID.
Description: null.
Will cause log when triggered, last triggered at 1days 01h:42m:09s.
#Configure an alarm group.
[H3C]rmon alarm 1 1.3.6.1.2.1.16.1.1.1.4.1 10 delta rising_threshold 1000 1 falling_threshold 100 1 owner test-rmon
[H3C]dis rmon alarm 1
Alarm table 1 owned by test-rmon is VALID.
Samples type : delta
Variable formula : 1.3.6.1.2.1.16.1.1.1.4.1<etherStatsOctets.1>
Description : Ethernet2/1/1
Sampling interval : 10(sec)
Rising threshold : 1000(linked with event 1)
Falling threshold : 100(linked with event 1)
When startup enables : risingOrFallingAlarm
Latest value : 0
# Configure an extended alarm group.
[H3C]rmon prialarm 1 ((.1.3.6.1.4.1.2011.6.1.2.1.1.2.0-.1.3.6.1.4.1.2011.
6.1.2.1.1.3.0)*100/.1.3.6.1.4.1.2011.6.1.2.1.1.2.0) prialarm1 10 delta risi
ng_threshold 70 1 falling_threshold 50 1 entrytype forever
[H3C]display rmon prialarm 1
Prialarm table 1 owned by null is VALID.
Samples type : delta
Variable formula : ((.1.3.6.1.4.1.2011.6.1.2.1.1.2.0-.1.3.6.1.4.1.2011.6.1.2.1.1.
3.0)*100/.1.3.6.1.4.1.2011.6.1.2.1.1.2.0)
Description : prialarm1
Sampling interval : 10(sec)
Rising threshold : 70(linked with event 1)
Falling threshold : 50(linked with event 1)
When startup enables : risingOrFallingAlarm
This entry will exist : forever.
Latest value : 0
Note: The “0” in black means the memory of slot 0 is queried.
