- Table of Contents
-
- 13-Network Management and Monitoring Configuration Guides
- 00-Preface
- 01-System maintenance and debugging configuration
- 02-NQA configuration
- 03-iNQA configuration
- 04-NTP configuration
- 05-PTP configuration
- 06-Network synchronization configuration
- 07-SNMP configuration
- 08-RMON configuration
- 09-NETCONF configuration
- 10-EAA configuration
- 11-Process monitoring and maintenance configuration
- 12-Sampler configuration
- 13-Mirroring configuration
- 14-NetStream configuration
- 15-IPv6 NetStream configuration
- 16-sFlow configuration
- 17-Information center configuration
- 18-GOLD configuration
- 19-Packet capture configuration
- 20-VCF fabric configuration
- 21-CWMP configuration
- 22-SmartMC configuration
- 23-SQA configuration
- 24-eMDI configuration
- 25-Performance management configuration
- 26-Ansible configuration
- 27-Event MIB configuration
- 28-EPS agent configuration
- 29-Cloud connection configuration
- 30-EPA configuration
- 31-Packet trace configuration
- 32-KPI data collection configuration
- Related Documents
-
| Title | Size | Download |
|---|---|---|
| 31-Packet trace configuration | 137.75 KB |
Hardware compatibility with packet trace
Packet trace configuration restrictions and guidelines
Configuring a TCP or UDP packet profile for packet trace
Configuring an ICMP packet profile for packet trace
Configuring a raw packet profile for packet trace
Executing a packet trace operation
Displaying and maintaining packet trace
Packet trace configuration examples
Packet trace operation execution example (TCP packet profile)
Packet trace operation execution example (ICMP packet profile)
Packet trace operation execution example (raw packet profile)
Configuring packet trace
Overview
Packet trace uses a packet profile to construct traced packets, injects the packets to the device from an ingress interface, simulates the packet forwarding process, and traces the forwarding process. This feature can identify whether the device can forward packets correctly and whether packet loss has occurred during the forwarding process. If packets are lost, the feature can assist in locating the packet loss cause.
Application scenario
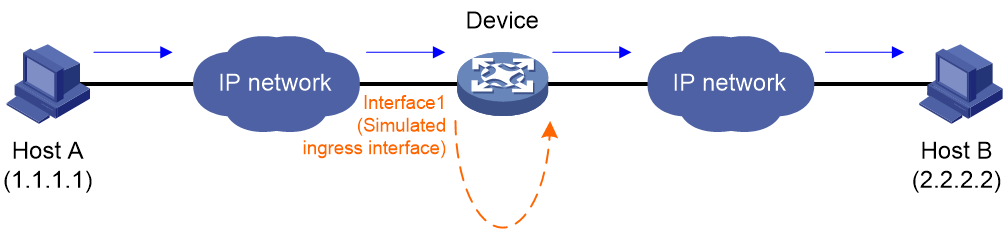
As shown in Figure 1, you can use packet trace as follows:
1. Capture a packet sent from Host A to Host B on Interface 1 of the device.
2. Configure a packet profile on the device according to the field values in the captured packet.
3. Execute a packet trace operation. In the operation, specify the profile to construct traced packets and injects the packets to the device from Interface 1. The device simulates the packet forwarding process and traces the entire packet forwarding process, including the packets are injected, processed by software and hardware, and sent out of the device.
4. View the packet trace operation result, obtain the forwarding process of the packets, identify whether packets are lost, and locate the packet drop reason.
Packet profiles
A packet profile contains a set of parameters used to construct traced packets. You can configure the parameters based on the characteristic parameters of service packets.
The following types of packet profiles are available:
· Protocol packet profile—In this type of profiles, you can simulate ICMP, TCP, or UDP protocol packets by defining values for the required fields of the protocol packets. The device automatically pads values for fields that are not defined. The configuration is simple.
· Raw packet profile—In this type of profiles, the entire content of traced packets is user configured. The protocol type of traced packets and all field values are user defined. You must first use a packet capture tool to capture a packet in hexadecimal notation and copy the entire packet to the raw packet view of a raw packet profile.
Hardware compatibility with packet trace
Packet trace is supported only on SH modules.
Packet trace configuration restrictions and guidelines
In order to truly present the processing process of service packets within the device, construct traced packets based on the corresponding field values in real service packets. Make sure the traced packets are the same as the real service packets. A violation might bring in inaccurate packet trace operation result because the simulated packet processing process might be different from the real packet processing process.
Configuring a TCP or UDP packet profile for packet trace
|
Step |
Command |
Remarks |
|
1. Enter system view. |
system-view |
N/A |
|
2. Create a TCP or UDP packet profile for packet trace and enter its view. |
packet-trace profile profile-name type { tcp | udp } |
N/A |
|
3. Configure Layer 2 parameters for traced packets. |
source-mac src-mac destination-mac dest-mac [ vlan vlan-id [ dot1p dot1p-value ] | service-vlan vlan-id [ service-dot1p dot1p-value ] customer-vlan vlan-id [ customer-dot1p dot1p-value ] ] |
By default, no Layer 2 parameters are configured for traced packets in a packet profile. |
|
4. Configure Layer 3 parameters for traced packets. |
source-ip src-ip destination-ip dest-ip [ dscp dscp-value ] [ ttl ttl-value ] |
By default, no Layer 3 parameters are configured for traced packets in a packet profile. |
|
5. Configure the source and destination port numbers of traced packets. |
source-port src-port destination-port dest-port |
By default, no source or destination port number is configured for traced packets in a packet profile. |
|
6. Enter TCP or UDP packet profile payload view and configure the payload of traced packets. |
payload |
In TCP or UDP packet profile payload view, you can input a string of hexadecimal characters. The string must contain an even number of hexadecimal characters. The length of the string varies by packet profile type. For more information, see the command reference. If you input the hexadecimal characters with spaces in multiple lines, the device automatically removes the line breakers and spaces from the string in the input order when saving the payload. |
|
7. Exit TCP or UDP packet profile payload view. |
· Save the configuration in TCP or UDP
packet profile payload view and exit the view. · Exit TCP or UDP packet profile payload view
without saving the configuration in the view. |
N/A |
Configuring an ICMP packet profile for packet trace
|
Step |
Command |
Remarks |
|
1. Enter system view. |
system-view |
N/A |
|
2. Create an ICMP packet profile for packet trace and enter its view. |
packet-trace profile profile-name type icmp |
N/A |
|
3. Configure Layer 2 parameters for traced packets. |
source-mac src-mac destination-mac dest-mac [ vlan vlan-id [ dot1p dot1p-value ] | service-vlan vlan-id [ service-dot1p dot1p-value ] customer-vlan vlan-id [ customer-dot1p dot1p-value ] ] |
By default, no Layer 2 parameters are configured for traced packets in a packet profile. |
|
4. Configure Layer 3 parameters for traced packets. |
source-ip src-ip destination-ip dest-ip [ dscp dscp-value ] [ ttl ttl-value ] |
By default, no Layer 3 parameters are configured for traced packets in a packet profile. |
|
5. Configure the ICMP message type and message code for traced packets. |
icmp-type icmp-type icmp-code icmp-code |
By default, no ICMP message type or message code is configured for traced packets in a packet profile. |
|
6. Enter ICMP packet profile payload view and configure the payload of traced packets. |
payload |
In ICMP packet profile payload view, you can input a string of hexadecimal characters. The string must contain an even number of hexadecimal characters. For information about the length of the string, see the command reference. If you input the hexadecimal characters with spaces in multiple lines, the device automatically removes the line breakers and spaces from the string in the input order when saving the payload. |
|
7. Exit ICMP packet profile payload view. |
· Save the configuration in ICMP packet
profile payload view and exit the view. · Exit ICMP packet profile payload view without
saving the configuration in the view. |
N/A |
Configuring a raw packet profile for packet trace
|
Step |
Command |
Remarks |
|
1. Enter system view. |
system-view |
N/A |
|
2. Create a raw packet profile for packet trace and enter its view. |
packet-trace profile profile-name [ type raw ] |
N/A |
|
3. Enter raw packet profile raw packet view and configure the content of traced raw packets. |
raw-packet |
In raw packet profile raw packet view, you can input a string of 128 to 3036 hexadecimal characters. The string must contain an even number of hexadecimal characters. If you input the hexadecimal characters with spaces in multiple lines, the device automatically removes the line breakers and spaces from the string in the input order when saving the content. You can use a packet capture tool (for example, Wireshark) to capture a packet in string format and copy the packet to the raw packet profile raw packet view. |
|
4. Exit raw packet profile raw packet view. |
· Save the configuration in raw packet
profile raw packet view and exit the view. · Exit raw packet profile raw packet view
without saving the configuration in the view. |
N/A |
Executing a packet trace operation
This task constructs traced packets based on a packet profile, injects the packets to the device from an ingress interface, simulates the packet forwarding process, and traces the forwarding process.
To ensure that the packet trace operation can succeed, the specified ingress interface must be up.
You can use only Ethernet interfaces as ingress interfaces.
To execute a packet trace operation:
|
Step |
Command |
|
1. Enter system view. |
system-view |
|
2. Execute a packet trace operation. |
packet-trace execute profile profile-name interface interface-type interface-number |
Displaying and maintaining packet trace
Execute display commands in any view and reset commands in user view.
|
Task |
Command |
|
Display information about packet profiles. |
display packet-trace profile [ profile-name ] |
|
Display history packet trace operation results. |
display packet-trace history profile profile-name [ interface interface-type interface-number ] |
|
Clear history packet trace operation results. |
reset packet-trace history profile profile-name [ interface interface-type interface-number ] |
Packet trace configuration examples
Packet trace operation execution example (TCP packet profile)
Network requirements
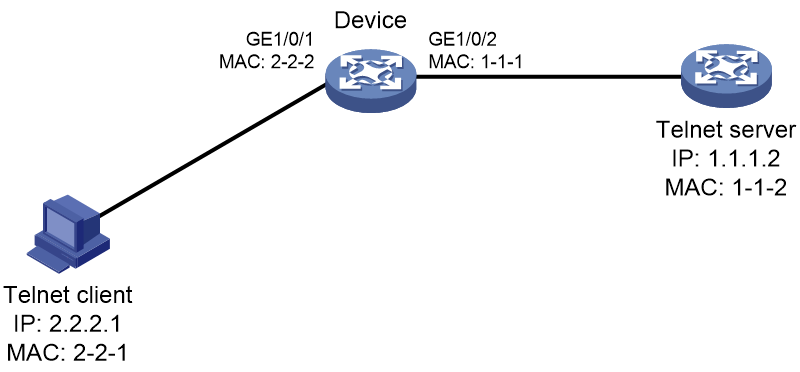
As shown in Figure 2, the Telnet client Telnets to the Telnet server. The Telnet connection is flapping.
Use the packet trace feature to identify whether Telnet packets are dropped when the packets pass through the device. If the packets are dropped on the device, locate the packet drop reason.
Configuration prerequisites
# Configure IP addresses for interfaces. (Details not shown.)
# Configure static routes or a dynamic routing protocol to make sure the client, device, and server have routes to reach one another. (Details not shown.)
Configuration procedure
# Configure a TCP packet profile.
<Sysname> system-view
[Sysname] packet-trace profile t1 type tcp
# Configure Layer 2 parameters for traced TCP packets. The source MAC address and destination MAC address are 2-2-1 and 2-2-2, respectively.
[Sysname-packet-trace-t1-tcp] source-mac 2-2-1 destination-mac 2-2-2
# Configure Layer 3 parameters for traced TCP packets. The source IP address, destination IP address, DSCP value, and TTL value are 2.2.2.1, 1.1.1.2, 10, and 100, respectively.
[Sysname-packet-trace-t1-tcp] source-ip 2.2.2.1 destination-ip 1.1.1.2 dscp 10 ttl 100
# Configure the source and destination port numbers of traced TCP packets as 1000 and 23, respectively.
[Sysname-packet-trace-t1-tcp] source-port 1000 destination-port 23
[Sysname-packet-trace-t1-tcp] quit
# Execute a packet trace operation.
[Sysname] packet-trace execute profile t1 interface gigabitethernet 1/0/1
Packet Trace Result:
Forwarding path:
ForwardingVlanValid
L2DstHit
L3SrcHostHit
L3DestHostHit
L3DestRouteHit
L2SrcMiss
MystationHit
Packet resolution:
KnownL3UcPkt
Source port STP state: Forward
Egress interface info:
Destination mod:40 port:0
l3 egress intf show 100001
Packet drop reason:
NoDrop
Verifying the configuration
# Display results about packet trace operations that use packet profile t1.
[Sysname] display packet-trace history profile t1
Ingress interface: GigabitEthernet1/0/1
Packet trace result 1:
Forwarding path:
ForwardingVlanValid
L2DstHit
L3SrcHostHit
L3DestHostHit
L3DestRouteHit
L2SrcMiss
MystationHit
Packet resolution:
KnownL3UcPkt
Source port STP state: Forward
Egress interface info:
Destination mod:40 port:0
l3 egress intf show 100001
Packet drop reason:
NoDrop
The output shows that the device can correctly forward the Telnet packets sent from the Telnet client to the Telnet server without packet loss. Packet loss occurred at other locations.
Packet trace operation execution example (ICMP packet profile)
Network requirements
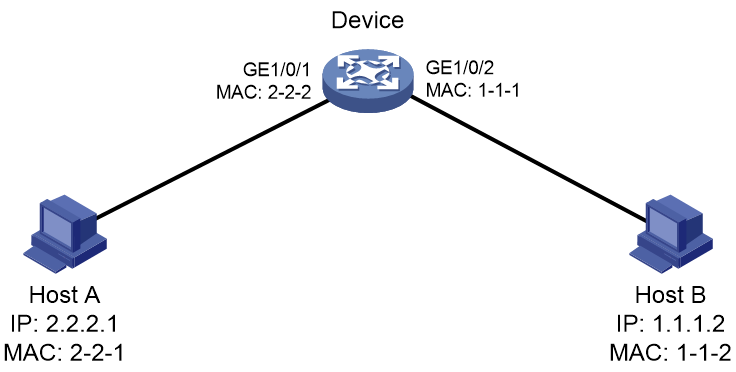
As shown in Figure 3, when Host A pings Host B, packets are lost. Use the packet trace feature to identify whether ping packets are dropped when the packets pass through the device. If the packets are dropped on the device, locate the packet drop reason.
Configuration prerequisites
# Configure IP addresses for interfaces. (Details not shown.)
# Configure static routes or a dynamic routing protocol to make sure the hosts and device have routes to reach one another. (Details not shown.)
Configuration procedure
# Configure an ICMP packet profile for packet trace.
<Sysname> system-view
[Sysname] packet-trace profile testicmp type icmp
# Configure Layer 2 parameters for traced ICMP packets. The source MAC address and destination MAC address are 2-2-1 and 2-2-2, respectively.
[Sysname-packet-trace-testicmp-icmp] source-mac 2-2-1 destination-mac 2-2-2
# Configure Layer 3 parameters for traced ICMP packets. The source IP address, destination IP address, DSCP value, and TTL value are 2.2.2.1, 1.1.1.2, 10, and 100, respectively.
[Sysname-packet-trace-testicmp-icmp] source-ip 2.2.2.1 destination-ip 1.1.1.2 dscp 10 ttl 100
# Configure the ICMP message type and code of traced ICMP packets as 1 and 255, respectively.
[Sysname-packet-trace-testicmp-icmp] icmp-type 1 icmp-code 255
# Execute a packet trace operation.
[Sysname] packet-trace execute profile testicmp interface gigabitethernet 1/0/1
Packet Trace Result:
Forwarding path:
ForwardingVlanValid
L2DstHit
L3SrcHostHit
L3DestHostHit
L3DestRouteHit
L2SrcMiss
MystationHit
Packet resolution:
KnownL3UcPkt
Source port STP state: Forward
Egress interface info:
Destination mod:40 port:0
l3 egress intf show 100001
Packet drop reason:
NoDrop
Verifying the configuration
# Display results about packet trace operations that use packet profile testicmp.
[Sysname] display packet-trace history profile testicmp
Ingress interface: GigabitEthernet1/0/1
Packet trace result 1:
Forwarding path:
ForwardingVlanValid
L2DstHit
L3SrcHostHit
L3DestHostHit
L3DestRouteHit
L2SrcMiss
MystationHit
Packet resolution:
KnownL3UcPkt
Source port STP state: Forward
Egress interface info:
Destination mod:40 port:0
l3 egress intf show 100001
Packet drop reason:
NoDrop
The output shows that the device can correctly forward the ping packets sent from Host A to Host B without packet loss. Packet loss occurred at other locations.
Packet trace operation execution example (raw packet profile)
Network requirements
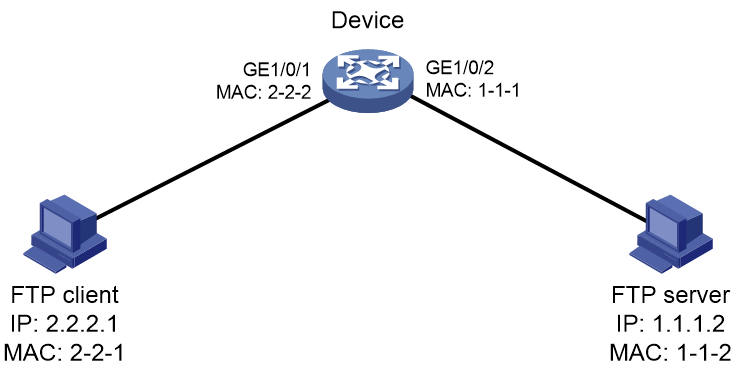
As shown in Figure 4, the FTP client downloads files from the FTP server. Data packets are lost.
Use the packet trace feature to identify whether data packets are dropped when the packets pass through the device. If the packets are dropped on the device, locate the packet drop reason.
Configuration prerequisites
# Configure IP addresses for interfaces. (Details not shown.)
# Configure static routes or a dynamic routing protocol to make sure the client, device, and server have routes to reach one another. (Details not shown.)
Configuration procedure
# Configure a raw packet profile.
<Sysname> system-view
[Sysname] packet-trace profile r1 type raw
# Configure the content of traced raw packets.
[Sysname-packet-trace-r1-raw] raw-packet
[Sysname-packet-trace-r1-raw-packet] 90e7106017f800465900a03208004500002800004000ff0677cb0101010201010101271027100000001500000000500000005dab000000000000000000000000
[Sysname-packet-trace-r1-raw-packet] raw-packet-end
[Sysname-packet-trace-r1-raw] quit
# Execute a packet trace operation.
[Sysname] packet-trace execute profile r1 interface gigabitethernet 1/0/1
Packet Trace Result:
Forwarding path:
ForwardingVlanValid
L2DstHit
L3SrcHostHit
L3DestHostHit
L3DestRouteHit
L2SrcMiss
MystationHit
Packet resolution:
KnownL3UcPkt
Source port STP state: Forward
Egress interface info:
Destination mod:40 port:0
l3 egress intf show 100001
Packet drop reason:
NoDrop
Verifying the configuration
# Display results about packet trace operations that use packet profile r1.
[Sysname] display packet-trace history profile r1
Ingress interface: GigabitEthernet1/0/1
Packet trace result 1:
Forwarding path:
ForwardingVlanValid
L2DstHit
L3SrcHostHit
L3DestHostHit
L3DestRouteHit
L2SrcMiss
MystationHit
Packet resolution:
KnownL3UcPkt
Source port STP state: Forward
Egress interface info:
Destination mod:40 port:0
l3 egress intf show 100001
Packet drop reason:
NoDrop
The output shows that the device can correctly forward the data packets sent between the FTP client and the FTP server without packet loss. Packet loss occurred at other locations.