- Table of Contents
-
- 13-Network Management and Monitoring Configuration Guides
- 00-Preface
- 01-System maintenance and debugging configuration
- 02-NQA configuration
- 03-iNQA configuration
- 04-NTP configuration
- 05-PTP configuration
- 06-Network synchronization configuration
- 07-SNMP configuration
- 08-RMON configuration
- 09-NETCONF configuration
- 10-EAA configuration
- 11-Process monitoring and maintenance configuration
- 12-Sampler configuration
- 13-Mirroring configuration
- 14-NetStream configuration
- 15-IPv6 NetStream configuration
- 16-sFlow configuration
- 17-Information center configuration
- 18-GOLD configuration
- 19-Packet capture configuration
- 20-VCF fabric configuration
- 21-CWMP configuration
- 22-SmartMC configuration
- 23-SQA configuration
- 24-eMDI configuration
- 25-Performance management configuration
- 26-Ansible configuration
- 27-Event MIB configuration
- 28-EPS agent configuration
- 29-Cloud connection configuration
- 30-EPA configuration
- 31-Packet trace configuration
- 32-KPI data collection configuration
- Related Documents
-
| Title | Size | Download |
|---|---|---|
| 25-Performance management configuration | 127.24 KB |
Contents
Performance management restrictions and guidelines
Performance management tasks at a glance
Configuring performance statistics tasks
Enabling performance statistics
Display and maintenance commands for performance management configuration
Performance management configuration examples
Example: Configuring performance management (gRPC)
Example: Configuring performance management (NETCONF)
Managing device performance
About performance management
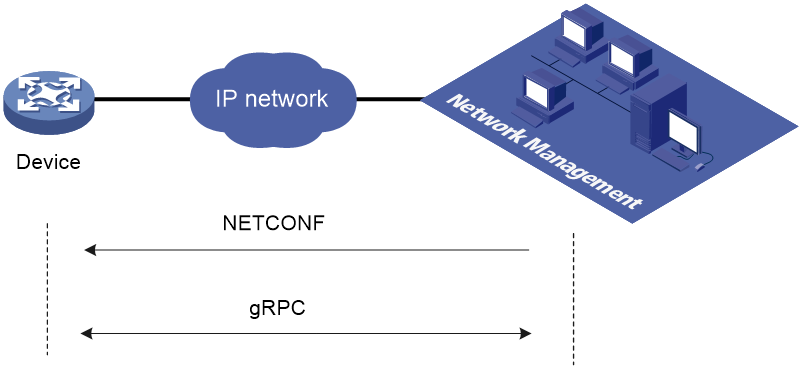
The performance management feature samples device performance and collects performance statistics, such as packet drop statistics in the inbound and outbound directions on an interface. You can use commands on the device to display the statistics or configure the device to transfer the statistics to a network management server through gRPC or NETCONF.
For more information about gRPC, see gRPC configuration in Telemetry Configuration Guide.
Figure 1 Performance management diagram
Performance management restrictions and guidelines
This feature supports collecting only statistics for traffic on interfaces in the current software version.
Performance management tasks at a glance
To manage device performance, perform the following tasks:
1. Configuring performance statistics tasks
2. Enabling performance statistics
Configuring performance statistics tasks
About this task
A performance statistics task periodically samples performance and collects performance statistics.
A performance statistics task contains the following parameters:
· Instance—Object for which you want to collect performance statistics. The current software version supports only physical interfaces and tunnel interfaces.
· Performance sampling interval—Intervals at which the device samples performance data.
· Performance statistics interval—Intervals at which the device collects performance statistics, including the peak values, valley values, and average values.
Restrictions and guidelines
Changing the sampling interval or statistics interval for a performance statistics task deletes all performance statistics for the task and recollects the performance statistics.
Changing the statistics interval also changes the sampling interval to the default corresponding to the new statistics interval.
Deleting a performance statistics task terminates the task and deletes all performance statistics for the task.
Procedure
|
Step |
Command |
Remarks |
|
1. Enter system view. |
system-view |
N/A |
|
2. Enter performance management view. |
performance-management |
N/A |
|
3. Create a performance statistics task and enter its view. |
statistics task task-name |
By default, no performance statistics tasks exist in the system. The device supports a maximum of 16 performance statistics task. |
|
4. Bind a performance management instance to the performance statistics task. |
binding instance-type instance-type { all { physical | tunnel } | instance { instance-name } &<1-8> } |
By default, no performance management instances are bound to a performance statistics task. |
|
5. Set the performance statistics interval. |
statistics interval interval |
The default statistics interval is 15 minutes. |
|
6. Set the performance sampling interval. |
sample interval interval |
By default, the performance sampling interval varies by statistics interval: · When the statistics interval is 5 minutes, the sampling interval is 5 seconds. · When the statistics interval is 10 minutes, the sampling interval is 5 seconds. · When the statistics interval is 15 minutes, the sampling interval is 5 seconds. · When the statistics interval is 30 minutes, the sampling interval is 60 seconds. · When the statistics interval is 60 minutes, the sampling interval is 300 seconds. · When the statistics interval is 1440 minutes, the sampling interval is 900 seconds. |
Enabling performance statistics
|
Step |
Command |
Remarks |
|
1. Enter system view. |
system-view |
N/A |
|
2. Enter performance management view. |
performance-management |
N/A |
|
3. Enable performance statistics. |
statistics enable |
By default, performance statistics is disabled. |
Display and maintenance commands for performance management configuration
Execute display commands in any view.
|
Task |
Command |
|
Display the performance statistics for a performance statistics task. |
display performance-management statistics task-name data index [ instance-type instance-type-name [ measure measure-name | instance { instance-name } &<1-8> ] * ] |
|
Display performance statistics task information. |
display performance-management task [ task-name ] |
Performance management configuration examples
Example: Configuring performance management (gRPC)
Network configuration
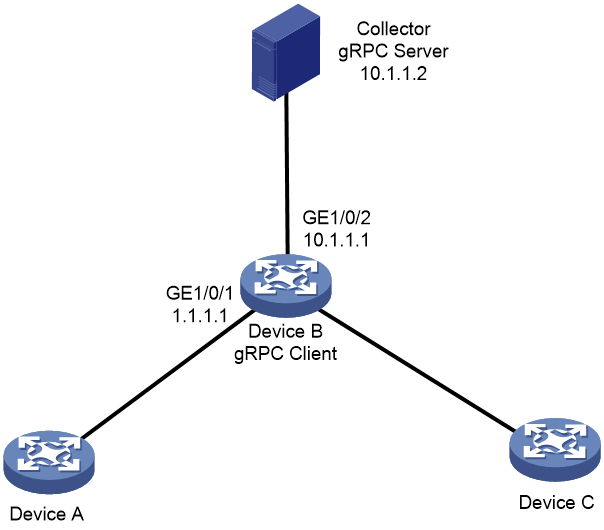
As shown in Figure 2, configure Device B as a gRPC client to report performance statistics for GigabitEthernet1/0/1 to the gRPC server. Set the sampling interval to 5 seconds and the statistics interval to 15 minutes.
Procedure
1. Assign IP addresses to interfaces on Device B and the collector. Make sure Device B and the collector are reachable to each other. (Details not shown.)
2. Configure Device B as a gRPC client:
# Enable the gRPC service.
<DeviceB> system-view
[DeviceB] grpc enable
# Create a sensor group named test, and add sensor path ifmgr/devicecapabilities/.
[DeviceB] telemetry
[DeviceB-telemetry] sensor-group test
[DeviceB-telemetry-sensor-group-test] sensor path ifmgr/devicecapabilities
[DeviceB-telemetry-sensor-group-test] quit
# Create a destination group named collector1. Specify a collector that uses IPv4 address 10.1.1.2 and port number 50050.
[DeviceB-telemetry] destination-group collector1
[DeviceB-telemetry-destination-group-collector1] ipv4-address 10.1.1.2 port 50050
[DeviceB-telemetry-destination-group-collector1] quit
# Configure a subscription named A to bind sensor group test with destination group collector1. Set the sampling interval to 900 seconds.
[DeviceB-telemetry] subscription A
[DeviceB-telemetry-subscription-A] sensor-group test sample-interval 900
[DeviceB-telemetry-subscription-A] destination-group collector1
[DeviceB-telemetry-subscription-A] quit
[DeviceB-telemetry] quit
3. Configure performance management for interface GigabitEthernet1/0/1.
# Enter performance management view.
<DeviceB> system-view
[DeviceB] performance-management
# Create a performance statistics task named task1 and enter its view.
[DeviceB-pm] statistics task task1
# Bind instance GigabitEthernet1/0/1 to the task.
[DeviceB-pm-task-task1] binding instance-type interface instance gigabitethernet 1/0/1
# Set the statistics interval to 15 minutes.
[DeviceB-pm-task-task1] statistics interval 15
# Set the sampling interval to 5 seconds.
[DeviceB-pm-task-task1] sample interval 5
[DeviceB-pm-task-task1] quit
# Enable performance statistics.
[DeviceB-pm] statistics enable
Verifying the configuration
# Verify that the gRPC server receives performance statistics for GigabitEthernet 1/0/1 from Device B at 900-second intervals. (Details not shown.)
Example: Configuring performance management (NETCONF)
Network configuration
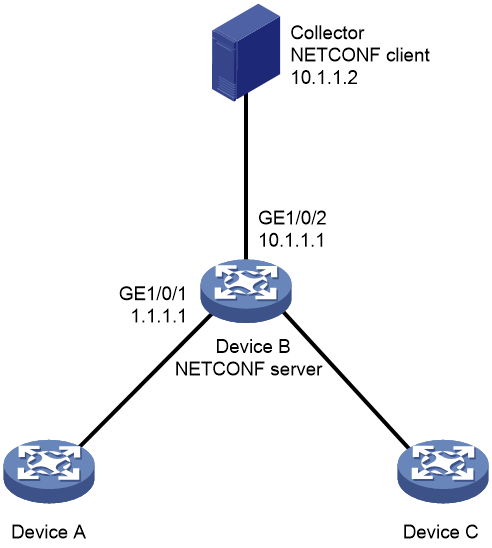
As shown in Figure 3, configure Device B as a NETCONF server to report performance statistics for GigabitEthernet1/0/1 to the NETCONF client. Set the sampling interval to 5 seconds and the statistics interval to 15 minutes.
Procedure
1. Assign IP addresses to Device B and collector. Make sure Device B and the collector are reachable to each other. (Details not shown.)
2. Configure performance management for interface GigabitEthernet1/0/1.
# Enter performance management view.
<DeviceB> system-view
[DeviceB] performance-management
# Create a performance statistics task named task1 and enter its view.
[DeviceB-pm] statistics task task1
# Bind instance GigabitEthernet1/0/1 to the task.
[DeviceB-pm-task-task1] binding instance-type interface instance gigabitethernet 1/0/1
# Set the statistics interval to 15 minutes.
[DeviceB-pm-task-task1] statistics interval 15
# Set the sampling interval to 5 seconds.
[DeviceB-pm-task-task1] sample interval 5
[DeviceB-pm-task-task1] quit
# Enable performance statistics.
[DeviceB-pm] statistics enable
3. Configure the NETCONF settings on Device B. (Details not shown.) For more information, see "Configuring NETCONF."
<DeviceB> system-view
Verifying the configuration
# Verify that the NETCONF client receives performance statistics for GigabitEthernet 1/0/1 from Device B at intervals. (Details not shown.)