| Title | Size | Downloads |
|---|---|---|
| H3C Servers Troubleshooting Guide-6W101-book.pdf | 14.79 MB |
- Table of Contents
- Related Documents
-
H3C Servers Troubleshooting Guide
Document version: 6W101-20211231
Copyright © 2021 New H3C Technologies Co., Ltd. All rights reserved.
No part of this manual may be reproduced or transmitted in any form or by any means without prior written consent of New H3C Technologies Co., Ltd.
Except for the trademarks of New H3C Technologies Co., Ltd., any trademarks that may be mentioned in this document are the property of their respective owners.
The information in this document is subject to change without notice.
Collecting symptom information
Breaking server down to the minimum hardware configuration
Collecting operating system logs
Collecting HDM screen recording information
Collecting storage controller configuration through the operating system
Collecting configuration for a PMC storage controller
Collecting configuration for an LSI storage controller
Collecting storage controller configuration through HDM or BIOS
Collecting storage controller configuration through HDM
Collecting configuration for a PMC storage controller through BIOS
Collecting configuration for an LSI storage controller through BIOS
Collecting storage controller logs
Collecting logs for a PMC storage controller
Collecting logs for an LSI storage controller
Diagnosing and locating faults
General troubleshooting workflow
Locating faults by examining LEDs
Locating faults by examining the LEDs on the server
Locating faults by examining the diagnostic panel
Locating faults by examining the LEDs on the intelligent security bezel
Storage controller issues flowchart
Storage controller supercapacitor issues flowchart
Physical drive issues flowchart
Logical drive issues flowchart
Network adapter issues flowchart
Troubleshooting hardware issues
Loose component or cable connection
Flashing health LED due to fan failures
Steady amber or flashing amber of power supply LED
Server boot failure with flashing green power supply LED
Loud noise of fan in the power supply
Occurrence of the lost power redundancy log
Occurrence of the mismatch vendor log
System stuck at Early POST stage (not applicable to Hygon processors)
Information displayed in red at POST stage
Storage controller stuck during POST
Screen error or error information during PXE startup and failure to enter PXE environment
System installation issues in PXE environment
Drive Fault or Offline alarms of hard drives in HDM
Failure to identify any drives on the HDM storage management page
Hard drive error reported in OS logs
Hard drive identification failure of the OS
Steady or flashing amber status for the Fault/UID LED of the hard drive
Failure to identify SSDs by PCH
Abnormal NVMe drive status in HDM
Failure to identify the newly installed NVMe drive
Inaccessible data of the hard drive
Restrictions and guidelines for storage controller replacement
Cache write policy of the logical drive changed from Write Back to Write Through
Not be Available status of the logical drive built by a PMC storage controller
Failure to identify P460/H460 series storage controller by the ARCCONF tool
Incorrect display of the P460/H460 series storage controller model
Storage controller stuck during initialization in Legacy BIOS mode
No driver found during manual update of the LSI storage controller driver in Windows
Logical drive rebuilding failure after member drive replacement
Original drive data unavailable after storage controller replacement
Logical drive data loss in PCH embedded RAID
Failure of OS to identify logical drive created by PCH embedded RAID
Storage controller supercapacitor issues
A supercapacitor battery is exhausted if it has not been used for a long time
Supercapacitor configuration error
A supercapacitor caused write policy change
Fan and heat dissipation issues
Multiple fans make loud noises when they are operating at a high speed
One or multiple fans make loud noises when operating at a low speed
A fan rotates almost at full speed
New fan failure after fan replacement
Automatic server shutdown caused by overtemperature
DIMM installation position error
POST detected no available memory (applicable to servers that use Intel processors)
POST detected a DIMM initialization error
POST detected a Training error
DIMM compatibility error in POST
A correctable memory error occurred
An uncorrectable DIMM error occurred
The memory capacity is smaller than the total capacity of DIMMs installed on the server
PMem DIMM issues (Intel processors)
PMem DIMM installation guidelines
A PMem DIMM is not displayed in the operating system
Configuration error (Intel processors)
MCA alarm (AMD and Hygon processors)
Server startup process stuck at the UPI initializing stage (Intel processors)
High processor load factor when the system has the minimum load
TPM/TCM faulty or not recognized
Power insufficient or exhausted
Multifunctional rack mount ears issues
A device connected to the multifunctional rack mount ears is not recognized
Operating system fails to boot from the SD card
Operating system fails to boot from a USB drive
SATA optical disk driver is not recognized
SATA optical disk driver is not recognized (AMD and Hygon processors)
Graphs not displayed as expected
GPU UCE error reported by HDM in a virtualization scenario
Self-procured GPU module not recognized
Screen blank for more than 60 seconds after the server powers up
Screen blank when the server powers up
Screen blank when the server is operating correctly
Screen jitters, screen image rolls or is distorted
Slow-moving horizontal lines displayed on the monitor
Mouse or keyboard not recognized
Newly installed network adapter does not work
An interface on a network adapter is not available
A port on the network adapter is not reachable
Packet loss or error on a port
mLOM network adapter is recognized but not reachable
Port WWPN on an FC HBA is not recognized by the storage device
Some of the multiple LUN links fail
Low LUN read and write performance
PCIe module not recognized by the BIOS
PCIe module negotiated rate or bandwidth decreases
Multiple drives numbered sequentially report failure
Troubleshooting software issues
OS compatibility with the server
Hard disk identification issues during OS installation
Hard disk capacity identification issue
Anomalies after application program or OS patch installation
OS error after software configuration change
OS error after installation of a new application program
BIOS alarm information (Intel processors)
BIOS alarm information (AMD processors)
BIOS alarm information (Hygon processors)
Firmware image file upload failure
Failure to access HDM web pages
Configuration file import failure
Slow or failed OS installation on H5 KVM
Device information error during server diagnosis
Failure to diagnose hard disk issues
Component driver and firmware issues
Companion documents for upgrade
Companion documents for upgrading HDM and BIOS
Companion documents for upgrading the firmware and driver of components
Contents of the companion documents
Software and configuration utilities
Relationship among software and configuration utilities
Starting UEFI Shell in BIOS Setup
Remote maintenance through HDM
Product installation resources
Product configuration resources
Information query utility resources
Driver and firmware download resources
Safety information
Safety sign conventions
To avoid bodily injury or damage to the server or its components, make sure you are familiar with the safety signs on the server chassis or its components.
|
Sign |
Description |
|
|
Circuit or electricity hazards are present. Only H3C authorized or professional server engineers are allowed to service, repair, or upgrade the server.
To avoid bodily injury or damage to circuits, do not open any components marked with the electrical hazard sign unless you have authorization to do so. |
|
|
Electrical hazards are present. Field servicing or repair is not allowed.
To avoid bodily injury, do not open any components with the field-servicing forbidden sign in any circumstances. |
|
|
The RJ-45 ports on the server can be used only for Ethernet connections.
To avoid electrical shocks, fire, or damage to the equipment, do not connect an RJ-45 port to a telephone. |
|
|
The surface or component might be hot and present burn hazards.
To avoid being burnt, allow hot surfaces or components to cool before touching them. |
|
|
The server or component is heavy and requires more than one people to carry or move.
To avoid bodily injury or damage to hardware, do not move a heavy component alone. In addition, observe local occupational health and safety requirements and guidelines for manual material handling. |
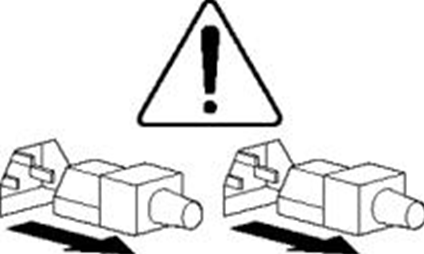
|
|
The server is powered by multiple power supplies.
To avoid bodily injury from electrical shocks, make sure you disconnect all power supplies if you are performing offline servicing. |
Safety information
Familiarize yourself with the safety information in the following sections before troubleshooting the server.
General operating safety
To avoid bodily injury or damage to the server, follow these guidelines when you operate the server:
· Only H3C authorized or professional server engineers are allowed to install, service, repair, operate, or upgrade the server.
· Place the server on a clean, stable table or floor for servicing.
· Make sure all cables are correctly connected before you power on the server.
To ensure good ventilation and proper airflow, follow these guidelines:
· Install blanks if the following module slots are empty:
¡ Drive bays.
¡ Fan bays.
¡ PCIe slots.
¡ Power supply slots.
· Do not block the ventilation openings in the server chassis.
· To avoid thermal damage to the server, do not operate the server for long periods in any of the following conditions:
¡ Access panel open or uninstalled.
¡ Air baffles uninstalled.
¡ PCIe slots, drive bays, fan bays, or power supply slots empty.
· To avoid being burnt, allow the server and its internal modules to cool before touching them.
Electrical safety
|
|
WARNING! If you put the server in standby mode (system power LED in amber) with the power on/standby button on the front panel, the power supplies continue to supply power to some circuits in the server. To remove all power for servicing safety, you must first press the button, wait for the system to enter standby mode, and then remove the power cords from the server. |
To avoid bodily injury or damage to the server, follow these guidelines:
· Always use the power cords that came with the server.
· Do not use the power cords that came with the server for any other devices.
· Power off the server when installing or removing any components that are not hot swappable.
Battery safety
The server's system board contains a system battery, which is designed with a lifespan of 3 to 5 years.
If the server no longer automatically displays the correct date and time, you might need to replace the battery. When you replace the battery, follow these safety guidelines:
· Do not attempt to recharge the battery.
· Do not expose the battery to a temperature higher than 60°C (140°F).
· Do not disassemble, crush, puncture, short external contacts, or dispose of the battery in fire or water.
· Dispose of the battery at a designated facility. Do not throw the battery away together with other wastes.
Power source recommendations
Power instability or outage might cause data loss, service disruption, or damage to the server in the worst case.
To protect the server from unstable power or power outage, use uninterrupted power supplies (UPSs) to provide power for the server.
Rack mounting recommendations
To avoid bodily injury or damage to the equipment, follow these guidelines when you rack mount a server:
· Mount the server in a standard 19-inch rack.
· Make sure the leveling jacks are extended to the floor and the full weight of the rack rests on the leveling jacks.
· Couple the racks together in multi-rack installations.
· Load the rack from the bottom to the top, with the heaviest hardware unit at the bottom of the rack.
· Get help to lift and stabilize the server during installation or removal, especially when the server is not fastened to the rails. As a best practice, a minimum of four people are required to safely load or unload a rack. A five person might be required to help align the server if the server is installed higher than check level.
· For rack stability, make sure only one unit is extended at a time. A rack might get unstable if more than one server unit is extended.
· Make sure the rack is stable when you operate a server in the rack.
· To maintain correct airflow and avoid thermal damage to the server, use blank panels to fill empty rack units.
ESD prevention
Preventing electrostatic discharge
To prevent electrostatic damage, follow these guidelines:
· Transport or store the server with the components in antistatic bags.
· Keep the electrostatic-sensitive components in separate antistatic bags until they arrive at an ESD-protected area.
· Place the components on a grounded surface before removing them from their antistatic bags.
· Avoid touching pins, leads, or circuitry.
Grounding methods to prevent electrostatic discharge
The following are grounding methods that you can use to prevent electrostatic discharge:
· Wear an ESD wrist strap and make sure it makes good skin contact and is reliably grounded.
· Take adequate personal grounding measures, including wearing antistatic clothing and static dissipative shoes.
· Use conductive field service tools.
· Use a portable field service kit with a folding static-dissipating work mat.
Applicable products
This documentation is intended for:
· Field technical support and servicing engineers.
· Network administrators working with the server.
This documentation is applicable to the following servers:
· H3C UniServer R4300 G5
· H3C UniServer R4330 G5
· H3C UniServer R4700 G5
· H3C UniServer R4900 G5
· H3C UniServer R4930 G5
· H3C UniServer R4950 G5
· H3C UniServer R6900 G5
· H3C UniServer R2700 G3
· H3C UniServer R2900 G3
· H3C UniServer R4300 G3
· H3C UniServer R4700 G3
· H3C UniServer R4900 G3
· H3C UniServer R6700 G3
· H3C UniServer R6900 G3
· H3C UniServer R8900 G3
· H3C UniServer R5300 G3
· H3C UniServer R5300 G5
· H3C UniServer R5500 G5
Troubleshooting flowchart
The webpages in this document depend on the software version, and are subject to change over time.
This documentation provides addresses for downloading third-party documentation or utilities. If you cannot obtain the resources, contact Technical Support.
Figure 1 describes the troubleshooting flowchart.
Figure 1 Troubleshooting flowchart
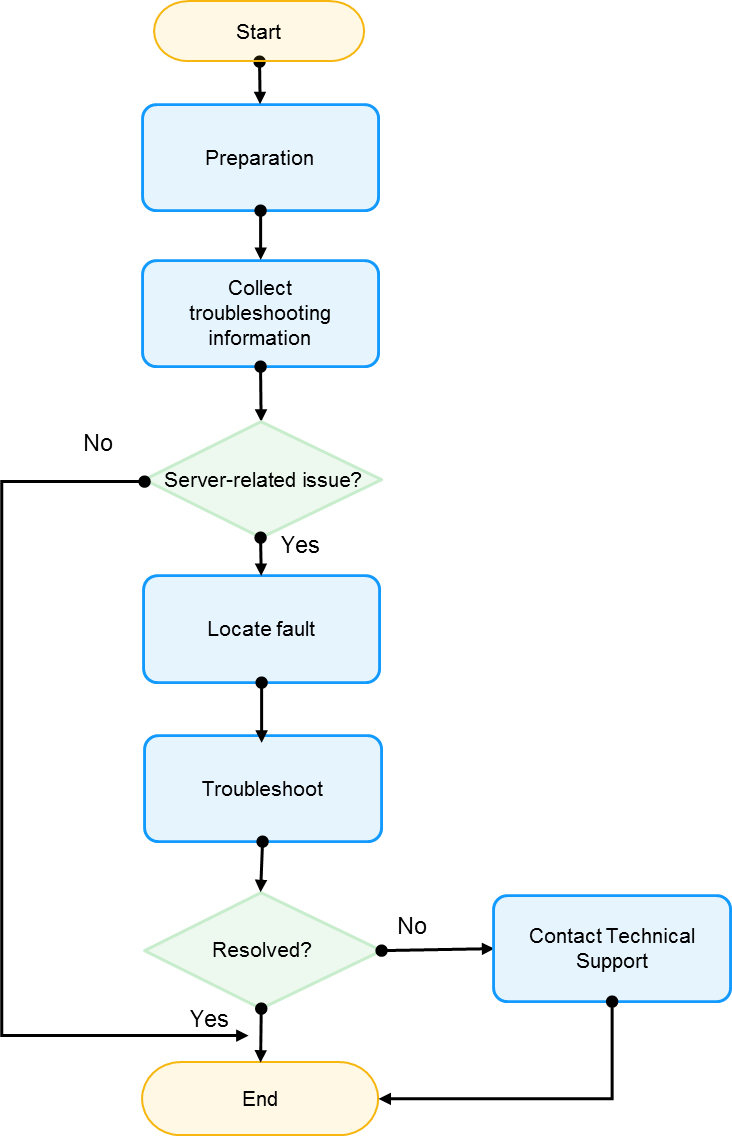
Table 2 Troubleshooting flowchart description
|
Step |
Description |
|
Troubleshooting preparation |
Prepare software and hardware utilities and documentations required for troubleshooting. For more information, see "Troubleshooting preparation." |
|
Collect troubleshooting information |
· Collect troubleshooting information, for example, symptom, device module, OS, and operations that have been performed. You can contact Technical Support to determine which information you need to collect. · Collect log information that helps troubleshooting. For more information, see "Collecting fault information." |
|
Identify whether the issue is a server-related issue |
Identify whether the issue is a server-related issue. · If the issue is a server-related issue, locate the issue. · If the issue is not a server-related issue, for example, an upper layer software failure or OS failure, contact the vendor first. |
|
Locate issues |
Locate the issues based on the collected troubleshooting information. For more information, see "Diagnosing and locating faults." |
|
Troubleshoot issues |
For more information, see "Troubleshooting hardware issues" or "Troubleshooting software issues." |
|
Contact Technical Support |
If any issue persists after you troubleshoot the issues by following the guidelines in this document, contact Technical Support for help. |
|
Resources for troubleshooting |
You might need diagnosis utilities or a software upgrade during the troubleshooting process, and you can obtain the following resources: · See "Version upgrade" for software upgrade. · See "Software and configuration utilities" for software and configuration utilities. · See "Resources for troubleshooting" for related resources. |
Troubleshooting preparation
Familiar yourself with the following information:
Product information
· Server information from the related documentation, for example, user guide
· Safety signs
· Hardware structure
· LEDs on the front and rear panels
· Operating system running on the server
· Physical environment requirements for running the server
· Hardware operations such as powering on and off the server and replacing components
· Software operations such as log collection and firmware update
· Procedure for maintaining the server
· Operating system and component compatibility
Preparing software utilities
Remote maintenance utilities
Table 3 Remote maintenance utilities
|
Name |
Description |
How to obtain utility |
|
HDM |
H3C Device Management (HDM) is a remote server management system that provides abundant features. HDM provides a browser-based Web management interface for end users and it complies with IPMI, SNMP, and Redfish standards and provides various remote maintenance functions. |
HDM is shipped with the server. To update HDM, access the H3C website at https://www.h3c.com/en/Support/Resource_Center/Software_Download/Servers/ |
|
FIST |
Fast Intelligent Scalable Toolkit (FIST) is server management software for resource monitoring, alarm monitoring, modular configuration, and bulk application, firmware, and driver update. |
FIST is shipped with the AE module. To deploy FIST in other environments or update FIST, access the H3C website at https://www.h3c.com/en/Support/Resource_Center/Software_Download/Servers/ |
|
iFIST |
The integrated Fast Intelligent Scalable Toolkit (iFIST) is a single-server management tool embedded in H3C servers. iFIST enables you to configure RAID arrays, install operating systems, and diagnose key server components. |
iFIST is shipped with the server. To update iFIST, access the H3C website at https://www.h3c.com/en/Support/Resource_Center/Software_Download/Servers/ |
|
REPO |
A REPO is a collection of firmware and driver installation packages, through which you can install or update a component as needed. |
You can customize a REPO or download a REPO. · To download a REPO, access https://www.h3c.com/en/Support/Resource_Center/Software_Download/Servers/. · To customize a REPO, access http://supportrepo.h3c.com/repo.htm. |
|
PuTTY |
PuTTY is an SSH and Telnet client. It is typically used for remote access to the operating system and displaying serial port information. |
Obtain this utility yourself, for example, from the Internet. |
|
IPMItool |
IPMItool provides a simple command-line interface, which can be used to manage the server through the IPMI interface provided by the server HDM. It can manage the hardware components of the system, monitor the running status of the system, and monitor and manage the system environment independently of the operating system. |
Obtain this utility yourself, for example, from the Internet. |
Diagnosis utilities
Table 4 Array diagnosis utilities
|
Name |
Supported storage controllers |
Description |
How to obtain utility |
|
HDM |
All storage controllers except for PCH onboard RAID supported by H3C servers |
Obtains storage controller and drive information through out-of-band management. |
Click the link below to find servers with storage controllers installed, and download the firmware package: http://www.h3c.com/cn/Service/Document_Software/Software_Download/Server/ |
|
Arcconf |
All PMC storage controllers supported by H3C servers* |
Command line utility, which allows you to obtain storage controller information, create and delete logical drives, back up drives, scale up, and collect logs. |
Click the link below to find the target storage controller. The utility is included in its firmware package: http://www.h3c.com/cn/Service/Document_Software/Software_Download/Server/ |
|
Storcli64 |
· Supported storage controllers: · RAID-LSI-9361-8i(1G)-A1-X · RAID-LSI-9361-8i(2G)-1-X · RAID-LSI-9460-8i(2G) · RAID-LSI-9460-8i(4G) · RAID-LSI-9460-16i(4G) · HBA-LSI-9440-8i · RAID-L460-M4 |
LSI storage controller*command-link utility Command line utility, which allows you to obtain storage controller information, create and delete logical drives, back up drives, scale up, and collect logs. |
Click the link below to find the target storage controller. The utility is included in its firmware package: http://www.h3c.com/cn/Service/Document_Software/Software_Download/Server/ |
|
PMC storage controller/LSI storage controller*: To obtain the vendor of storage controller, access Server and component compatibility query tool. |
|||
Preparing hardware utilities
|
View |
Tool |
Description |
|
|
Screwdriver |
Installs or removes screws or replaces system batteries. · T25 Torx screwdriver · T30 Torx screwdriver · T15 Torx screwdriver · T10 Torx screwdriver · Flat-head screwdriver · Phillips screwdriver |
|
|
Cage nut insertion/extraction tool |
Inserts or extracts the cage nuts in rack posts. |
|
|
Diagonal pliers |
Clips insulating sleeves or cable ties. |
|
|
Tape measure |
Measures distance. |
|
|
Multimeter |
Measures resistance and voltage. |
|
|
ESD wrist strap |
Prevents ESD when you operate the server. |
|
|
Antistatic gloves |
|
|
|
Antistatic clothing |
|
|
|
Ladder |
Supports high-place operations. |
|
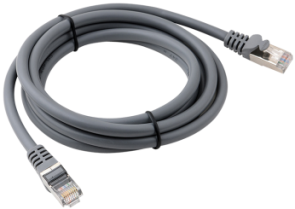
|
Interface cable (such as an Ethernet cable or optical fiber) |
Connects the server to an external network. |
|
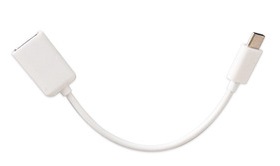
|
USB Type C cable and USB Wi-Fi adapter (Xiaomi) |
Connects to a third-party USB Wi-Fi adapter to provide a Wi-Fi hotspot. NOTE: Support for the USB Wi-Fi adapter depends on the server model. |
|
|
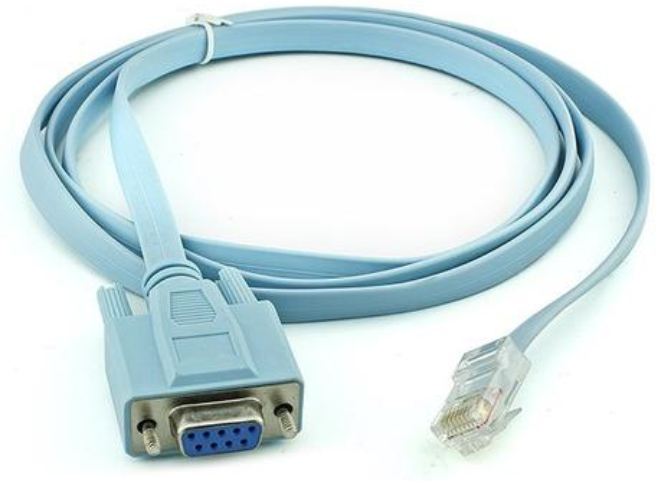
Serial console cable |
Connects the serial connector on the server to a monitor for troubleshooting. |
|
|
Monitor |
Displays the output from the server. |
|
|
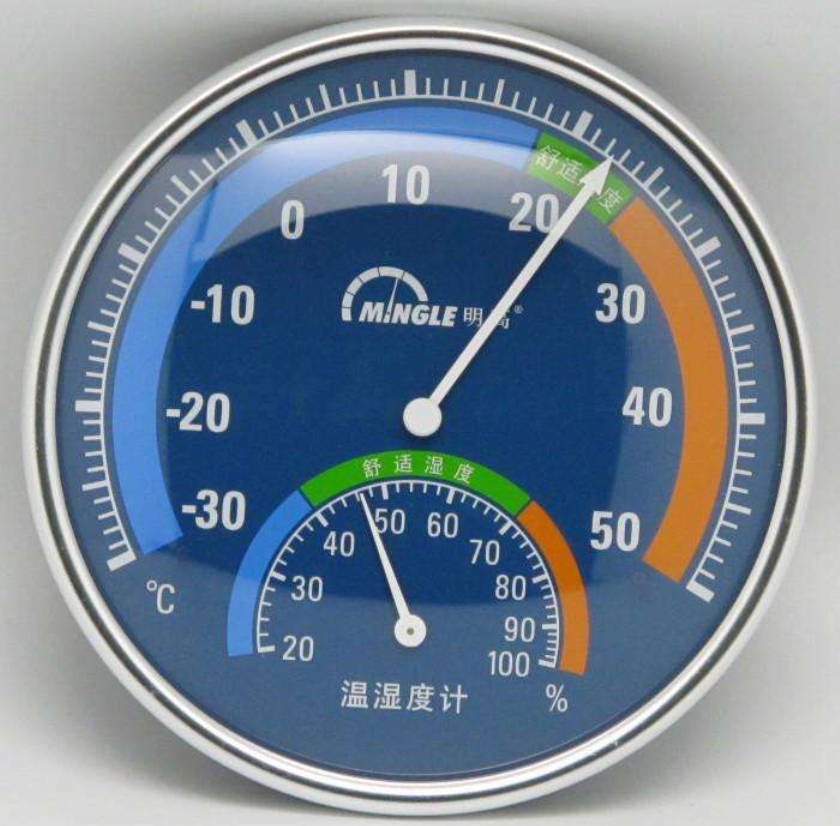
Temperature humidity meter |
Displays current temperature and humidity. |
|
|
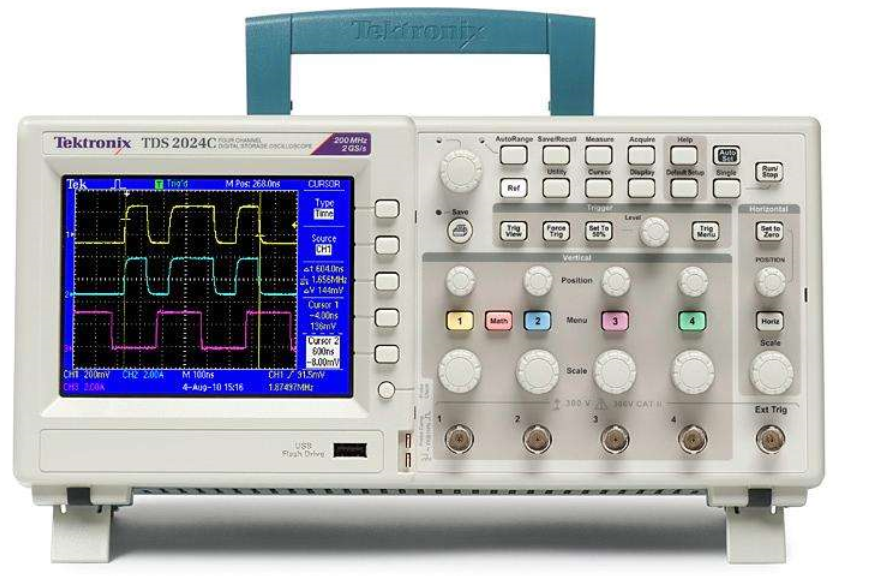
Oscilloscope |
Displays the variation of voltage over time in waveforms. |


Collecting symptom information
Collecting basic information
Use Table 6 to collect basic information.
Table 6 Basic server information
|
Item |
Description |
|
Model |
For example, H3C UniServer R4300 G3. |
|
SN |
For example, 210235A3THH19A000123. |
|
Hardware settings |
If you have changed the processor, memory, drive, or storage controller configuration, make that clear. |
|
OS and application software versions |
Determine whether to collect OS and application software versions as needed. |
|
HDM and BIOS versions |
For example, HDM-1.30.23 and BIOS-2.00.45. |
|
Issue occurrence time |
For example, 14:31:57 Tue Feb 10 2021 |
|
Symptom |
For example, black screen. |
|
Operation before an issue occurs |
For example, edit BIOS or HDM network parameters. |
|
Operation before an issue occurs and the result |
For example: the issue still exists after all memory modules are removed. |
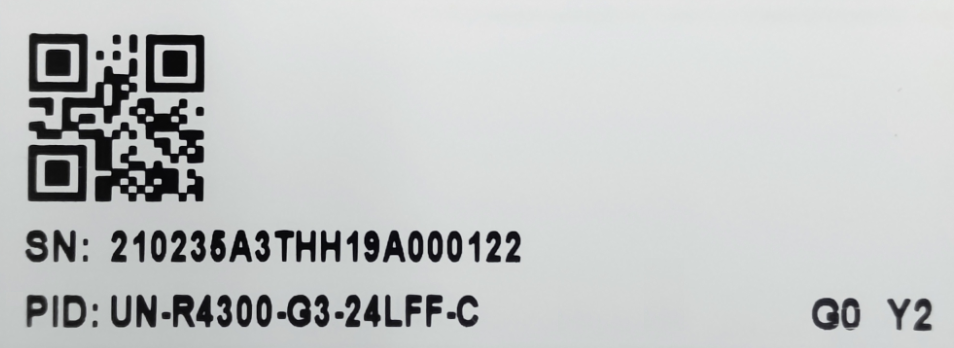
SN
An SN uniquely identifies a server, and it can be used to get technical support. An SN starts with "SN", as shown in the following figure.
Obtaining an SN
To obtain an SN, use the following methods:
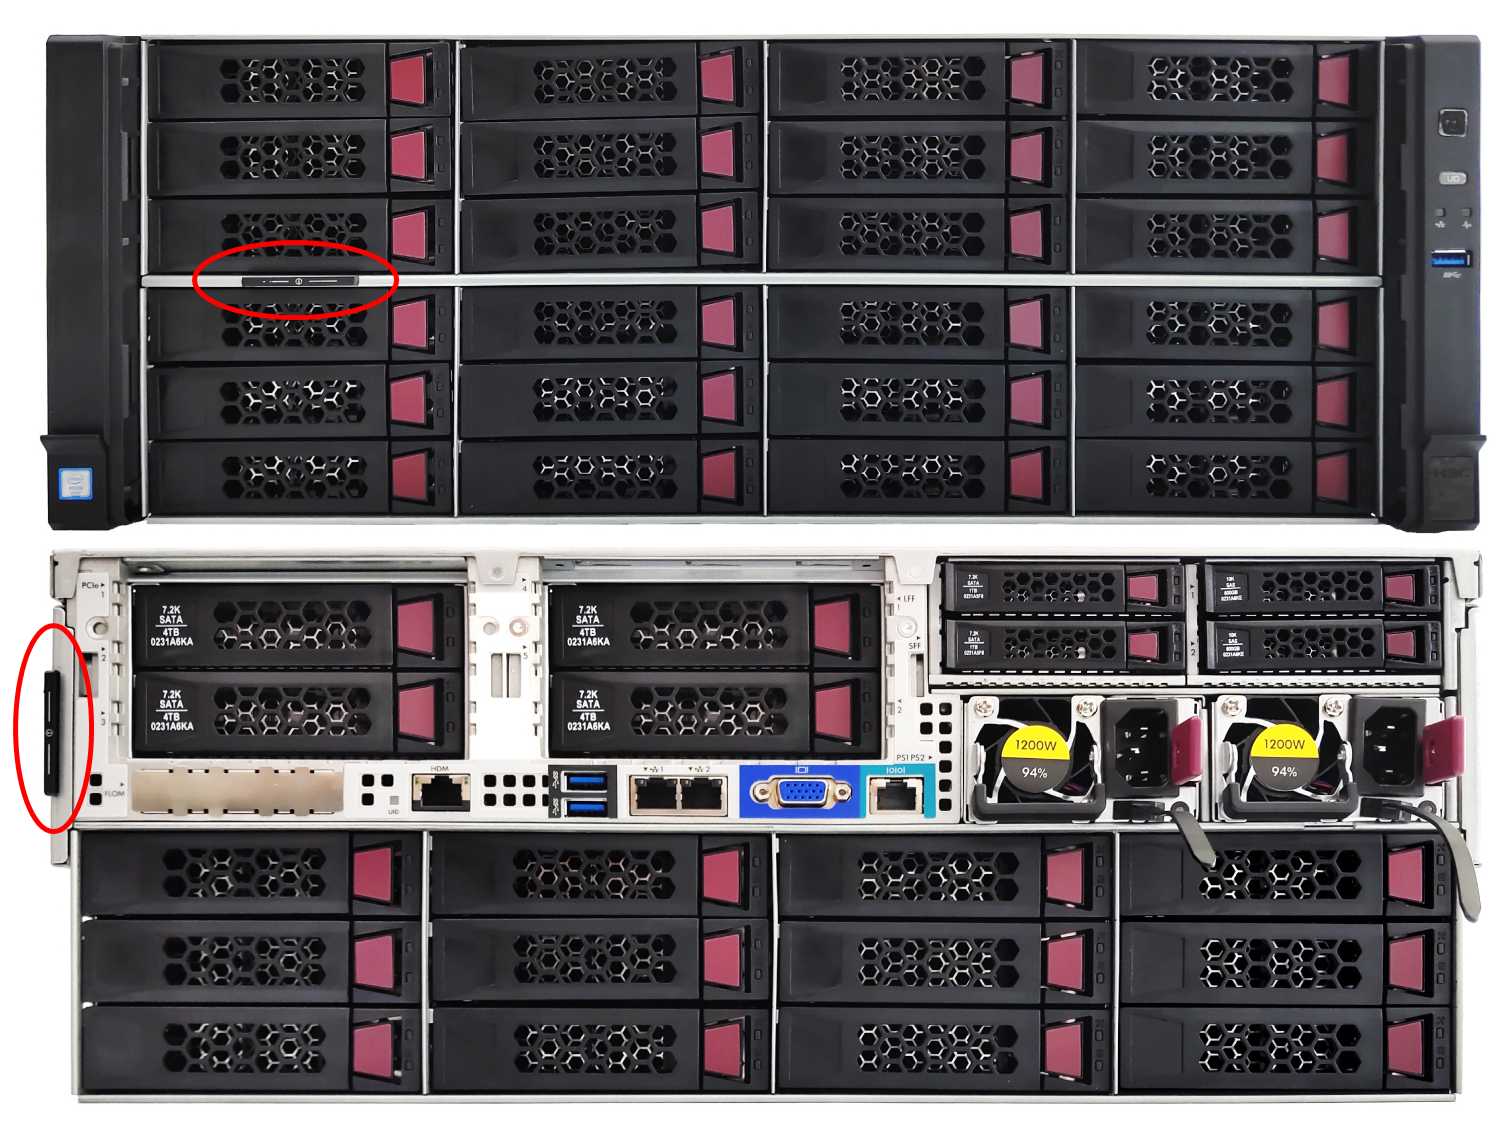
· Method 1: Obtain an SN from the serial label pull tab
The product SN is located on top of the chassis front panel or on the serial label pull tab. To see the product SN, pull the tab out. For the location of a serial label pull tab, see the user guide for your server.
Figure 3 Location of a serial label pull tab
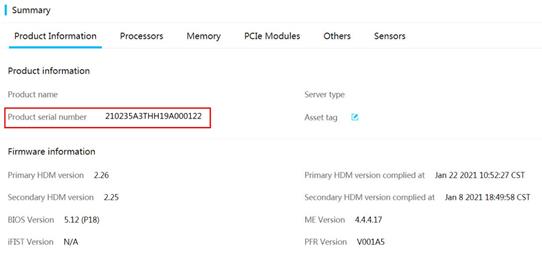
· Method 2: Obtain an SN from HDM
Log in to HDM to view the SN on the basic info page or product info page.
Figure 4 Displaying the SN on the basic info page
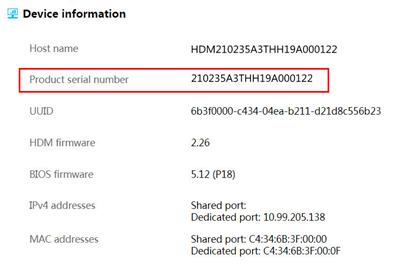
Figure 5 Displaying the SN on the product info page
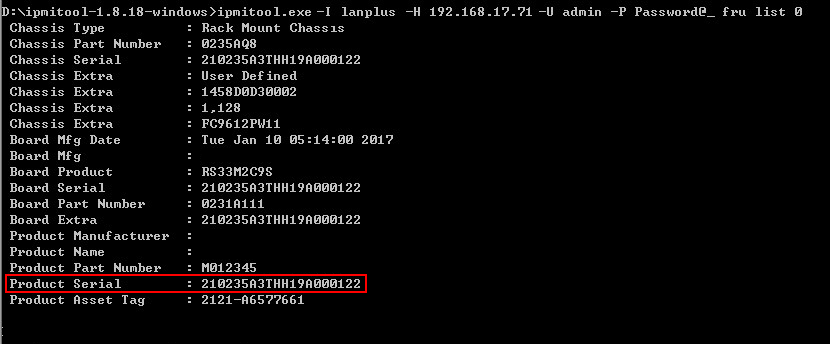
· Method 3: Obtain an SN by using the IPMI command-line tool
a. Obtain the IPMI command-line tool from the Internet.
b. Execute the ipmitool.exe -I lanplus -H ip -U username -P password fru list fruid command to obtain the SN of the server.
- ip—IP address of HDM.
- username—Username used for logging in to HDM.
- password—Password used for logging in to HDM.
- fruid—FRU ID for the target system board.
Figure 6 Obtaining an SN by using the IPMI command-line tool
Symptom information checklist
Before troubleshooting a server issue, collect the following information:
Table 7 Symptom information checklist
|
Symptom information checklist |
Result |
|
Does the server power on? If not, what is the status of the Health LED, power-on/standby LED, and system power LED on the front panel? |
|
|
Can you log in to the server from HDM? Does the system collect HDM SDS log? |
|
|
Does the HDM Web KVM console output any information after the server is powered on? Is there any output after the server connects to a monitor? |
|
|
Does the server complete POST? If the servers hangs or restarts, in which phase did that issue occur? Does a red screen occur? Is the server installed with components |
|
|
Does the server successfully boot an operating system? If not, does the server display any of the following symptoms? System boot options not found on the BIOS after you press F7 after BIOS POST finishes Whether network adapter boot options are available and whether the system can enter the PXE environment after POST finishes in PXE boot mode GRUB boot failure No partitions found A system hang or restart or abnormal output Black screen or no response from keyboard or mouse Stop error or blue screen (Windows) Purple diagnostic screen (Linux) No response from keyboard or mouse Whether the server reported a machine check architecture (MCA) alarm in the HDM event. Typically a log entry that starts with MSMI/CATERR IERR/CATERR MCERR indicates an MCA alarm. |
|
|
Did the issue occur after an OS was installed? |
|
|
What events preceded the failure? After which steps does the issue occur? |
|
|
Did you recently add or remove hardware or software? |
|
Breaking server down to the minimum hardware configuration
During the troubleshooting process, you might be asked to break the server down to the minimum hardware configuration. A minimum configuration contains only the components required to boot the server and successfully complete POST. Table 8 shows the minimum hardware configuration.
Table 8 Breaking the server down to the minimum hardware configuration
|
Server model |
Minimum hardware configuration |
Remarks |
|
H3C UniServer R4300 G5 |
· Processor—1, in slot 1. · Memory—1, in slot A0 of processor 1. · Fan—4, full configuration. · Power supply—1, in any slot. |
N/A |
|
H3C UniServer R4700 G5 |
· Processor—1, in slot 1. · Memory—1, in slot A0 of processor 1. · Fan—7, full configuration. · Power supply—1, in any slot. |
N/A |
|
H3C UniServer R4900 G5 |
· Processor—1, in slot 1. · Memory—1, in slot A0 of processor 1. · Fan—6, full configuration. · Power supply—1, in any slot. |
N/A |
|
H3C UniServer R4950 G5 |
· Processor—1, in slot 1. · Memory—1, in slot D0 of processor 1. · Fan—6, full configuration. · Power supply—1, in any slot. |
N/A |
|
H3C UniServer R6900 G5 |
· Processor—1, in slot 1. · Memory—1, in slot A0 of processor 1. · Fan—3, in any of the three fan slots. · Power supply—1, in any slot. |
N/A |
|
H3C UniServer R2700 G3 |
· Processor—1, in slot 1. · Memory—1, in slot A0 of processor 1. · Fan—4, in slots Fan 3, Fan 5, Fan 6, and Fan 7. · Power supply—1, in any slot. |
N/A |
|
H3C UniServer R2900 G3 |
· Processor—1, in slot 1. · Memory—1, in slot A1 of processor 1. · Fan—4, in slots Fan 2, Fan 4, Fan 5, and Fan 6. · Power supply—1, in any slot. |
N/A |
|
H3C UniServer R4300 G3 |
· Processor—1, in slot 1. · Memory—1, in slot A1 of processor 1. · Fan—4, in slots Fan 1, Fan 2, Fan 3, and Fan 4. · Power supply—1, in any slot. |
N/A |
|
H3C UniServer R4700 G3 |
· Processor—1, in slot 1. · Memory—1, in slot A1 of processor 1. · Fan—4, in slots Fan 4, Fan 5, Fan 6, and Fan 7. · Power supply—1, in any slot. |
N/A |
|
H3C UniServer R4900 G3 |
· Processor—1, in slot 1. · Memory—1, in slot A1 of processor 1. · Fan—4, in slots Fan 3, Fan 4, Fan 5, and Fan 6. · Power supply—1, in any slot. |
N/A |
|
H3C UniServer R6700 G3 |
· Processor—1, in slot 1. · Memory—1, in slot A1. · Fan—6, full configuration. · Power supply—1, in any power supply slot. |
N/A |
|
H3C UniServer R6900 G3 |
· Compute module—1, in compute module slot 1. · PDB—1, in the PDB slot. · Management module—1, in the management module slot. · Processor—1, in slot 1 of compute module 1. · Memory—1, in slot A1 of processor 1. · Fan—6, full configuration. · Power supply—1, in any power supply slot. |
N/A |
|
H3C UniServer R8900 G3 |
· Compute module—1, in compute module slot 1 or 3. · PDB—1, in the PDB slot. · Management module—1, in the management module slot. · Processor—1, in slot 1 on the compute module. · Memory—1, in slot A1. · Processor—3, in the fan slots on the compute module. · Power supply—1, in any power supply slot on the PDB. |
When compute module 1 is present, make sure both management module 1 and PDB 1 are present. When compute module 3 is present, make sure both management module 2 and PDB 2 are present. |
|
H3C UniServer R4930 G5 |
· Processor—1, in slot 1. · Memory—1, in any white slot. · Fan—4, in any four fan slots. · Power supply—1, in any power supply slot. |
N/A |
|
H3C UniServer R4330 G5 |
· Processor—1, in slot 1. · Memory—1, in any white slot. · Fan—6, full configuration. · Power supply—1, in any power supply slot. |
N/A |
|
H3C UniServer R5300 G3 |
· Processor—2. · Memory—2, in the A0 slots of the two processors. · Fan—full configuration. · Power supply—2, in any power supply slot. |
N/A |
|
H3C UniServer R5300 G5 |
· Processor—2. · Memory—2, in the A0 slots of the two processors. · Fan—Full configuration. · Power supply—2, in any slot. |
N/A |
|
H3C UniServer R5500 G5 |
· Processor—2. · Memory—2, in the A0 slots of the two processors. · Fan—Full configuration. · Power supply of the compute node—1, in any slot. |
N/A |
|
For the positions of the slots, see the user guide for your server. If you need to install additional components, see the user guide for your server for the installation guidelines. |
||
Collecting fault information
Collecting operating system logs
|
|
IMPORTANT: · Obtain a written consent from the customer before collecting operating system logs. · The collected operating system logs are only used for hardware troubleshooting. For operating system issues, contact the operating system manufacturer. |
|
|
NOTE: For how to collect logs for other types of operating systems, contact Technical Support. |
Collecting logs for a Windows operating system
· If no blue screen fault occurs, perform the following tasks:
a. Open the Computer Management window.
b. Select System Tools > Event Viewer.
c. Select Windows Logs > System > Save All Events As to export the logs to a file.
· If a blue screen fault occurs, perform the following tasks:
a. Take a screenshot or photo of the blue screen fault information.
b. Restart the operating system, and then collect all files in path C:\WINDOWS\Minidump\.
Collecting logs for a Linux operating system
· If the Linux system has the sosreport tool, perform the following tasks:
a. Log in to the Linux CLI as the root user.
b. Execute the sosreport command to collect all Linux logs, which might cost several minutes.
The logs will be saved to log file sosreport-localhost-ID-YYYY-MM-DD@HH-MM-SS.tar.xz in directory /var/tmp.
· If the Linux system does not have the sosreport tool, collect all files in directory \var\log and directory /var/crash.
Collecting logs for a VMware operating system
· If no purple screen fault occurs, perform either of the following tasks:
¡ Select Host > Monitor > Logs on vSphere Web Client, and then search for and export the system logs.
¡ Log in to the ESXi Server Console CLI as the root user, and then execute the vm-support command to collect all VMware logs, which might cost several minutes.
The logs will be saved to log file esxsupport-YYYY-MM-DD@HH-MM-SS.tgz in directory /var/tmp.
· If a purple screen fault occurs and a warm reboot has been performed, perform the following tasks:
a. Log in to the ESXi Server Console CLI as the root user.
b. Execute the vm-support command to collect all VMware logs, which might cost several minutes.
The logs will be saved to log file esxsupport-YYYY-MM-DD@HH-MM-SS.tgz in directory /var/tmp.
· If a purple screen fault occurs and the fault information is retained, perform the following tasks:
a. Take a screenshot or photo of the purple screen fault information.
b. Press Alt and F12 simultaneously to display the VMkernel log, and then take screenshots or photos of the logs generated when the fault occurred.
You can press Alt and PageUp or Alt and PageDown simultaneously to scroll the screen and view more logs.
c. Perform a warm reboot on the operating system.
d. Execute the vm-support command to collect all VMware logs, which might cost several minutes.
The logs will be saved to log file esxsupport-YYYY-MM-DD@HH-MM-SS.tgz in directory /var/tmp.
Collecting HDM SDS logs
Smart Diagnose System (SDS) logs include server logs (such as event logs, operation logs, and internal logs), hardware information, and fault diagnosis information. You can learn about the server running state through SDS logs.
Restrictions and guidelines
· Simultaneous log downloading by multiple users is not supported.
· An .sds file saves log entries in UTC, but HDM uses the date and time synchronized from an NTP server. If you download log entries for a specific period, HDM converts the specified start time and end time into UTC, which might introduce time differences.
Procedure
1. Log in to HDM. For more information, see HDM User Guide.
2. Open the log collection page.
3. Download the entire log or log entries for a period:
¡ To download the entire log, click Download entire log.
¡ To download the log entries for a period, specify the start time and end time in the Download specified log area.
4. (Optional.) Add contact information, including the name, phone number, and email address.
5. Click Download log to download the log.
6. Save the .sds file to the local disk.
7. To parse SDS logs, contact Technical Support.
Collecting HDM screen recording information
HDM records the server status upon occurrence of severe operating system events, including crash, restart, and shutdown. You can replay these videos to analyze or troubleshoot the recorded events. On the video replay page, you can play and download the recorded videos.
Restrictions and guidelines
If the operating system was in sleep state when the event occurred, HDM displays a no signal message in place of the video.
Procedure
1. Log in to HDM. For more information, see HDM User Guide.
2. Open the Screenshots & Videos page.
3. To play a video, click the video in the Video files section.
4. To download a video, click Download after the video is loaded.
Collecting storage controller configuration through the operating system
To obtain the manufacturer of a storage controller, contact Technical Support.
Collecting configuration for a PMC storage controller
You can collect configuration information for a PMC storage controller by using the arcconf tool provided by PMC.
For information about how to install the arcconf tool, see the arcconf user guide on the official website of PMC. The installation procedure for the arcconf tool varies by operating system.
By default, the arcconf tool is started in a non-Windows operating system.
To start the arcconf tool in a Windows operating system, perform the following tasks:
1. Press WIN and R on the keyboard simultaneously.
2. On the Run window that opens, enter cmd, and then click OK.
3. On the CLI that opens, execute the arcconf command.
For information about the arcconf command lines, see the arcconf user guide on the official website of PMC.
This section uses the P430 storage controller with the Linux operating system to illustrate how to collect storage controller configuration.
Viewing state, slot, and mode information about a storage controller
Syntax
arcconf list
Example
[root@localhost ~]# ./arcconf list
Controllers found: 1
----------------------------------------------------------------------
Controller information
----------------------------------------------------------------------
Controller ID : Status, Slot, Mode, Name, SerialNumber, WWN
----------------------------------------------------------------------
Controller 1 : Optimal, Slot 10, RAID (Expose RAW), PM8060-RAID , 70532000, 5D461FE170532000
Viewing detailed information about a storage controller, including state, mode, firmware version, and driver version
Syntax
arcconf getconfig controller_id AD
Parameters
controller_id: ID of the storage controller.
Example
[root@localhost ~]# ./arcconf getconfig 1 AD
Controllers found: 1
----------------------------------------------------------------------
Controller information
----------------------------------------------------------------------
Controller Status : Optimal
Controller Mode : RAID (Expose RAW)
Channel description : SAS/SATA
Controller Model : PM8060-RAID
Controller Serial Number : 70532000
Controller World Wide Name : 5D461FE170532000
Controller Alarm : Enabled
Temperature : 71 C/ 159 F (Normal)
Installed memory : 2048 MB
......
BIOS : 7.16-0 (33456)
Firmware : 7.16-0 (33456)
Driver : 1.2-1 (41066)
Boot Flash : 7.16-0 (33456)
Viewing information about all physical drives managed by a storage controller
Syntax
arcconf getconfig controller_id PD disk_id
Parameters
· controller_id: ID of the storage controller.
· disk_id: ID of the physical drive. This argument is optional. Specify it when you need information about a specific physical drive.
Example
[root@localhost ~]# ./arcconf getconfig 1 PD
Controllers found: 1
----------------------------------------------------------------------
Physical Device information
----------------------------------------------------------------------
Device #0
Device is a Hard drive
State : Online
Block Size : 512 Bytes
Supported : Yes
Programmed Max Speed : SAS 12.0 Gb/s
Transfer Speed : SAS 12.0 Gb/s
Reported Channel,Device(T:L) : 0,10(10:0)
Reported Location : Enclosure 0, Slot 2(Connector 0, Connector 1)
Reported ESD(T:L) : 2,0(0:0)
Vendor : HGST
Model : HUC101860CSS200
Firmware : AA01
Serial number : 0BG4667F
......
Hardware Error Count : 0
Medium Error Count : 0
Parity Error Count : 0
Link Failure Count : 0
Aborted Command Count : 0
SMART Warning Count : 0
Viewing information about all logical drives managed by a storage controller
Syntax
arcconf getconfig controller_id LD LD_id
Parameters
· controller_id: ID of the storage controller.
· LD_id: ID of the logical drive. This argument is optional. Specify it when you need information about a specific logical drive.
Example
[root@localhost ~]# ./arcconf getconfig 1 LD
Controllers found: 1
----------------------------------------------------------------------
Logical device information
----------------------------------------------------------------------
Logical Device number 0
Logical Device name : LogicalDrv 0
Block Size of member drives : 512 Bytes
RAID level : 10
Unique Identifier : 45D14933
Status of Logical Device : Optimal
Additional details : Initialized with Build/Clear
Size : 1014 MB
Parity space : 1024 MB
Stripe-unit size : 256 KB
Interface Type : SAS/SATA
Device Type : HDD
Read-cache setting : Enabled
Read-cache status : On
Write-cache setting : Enabled
Write-cache status : On
Partitioned : No
Protected by Hot-Spare : No
Bootable : Yes
Failed stripes : No
Power settings : Disabled
--------------------------------------------------------
Logical Device segment information
--------------------------------------------------------
Group 0, Segment 0 : Present (572325MB, SAS, HDD, Enclosure:0, Slot:2) 0BG4667F
Group 0, Segment 1 : Present (1716957MB, SAS, HDD, Enclosure:0, Slot:5) 29L0A016FMCF
Group 1, Segment 0 : Present (3815447MB, SATA, HDD, Enclosure:0, Slot:7) WJG00YXP
Group 1, Segment 1 : Present (3815447MB, SATA, HDD, Enclosure:0, Slot:8) WJG00Z35
Viewing all running tasks (including rebuilding and scrubbing) on a storage controller
Syntax
arcconf getstatus 1
Example
[root@localhost ~]# ./arcconf getstatus 1
Controllers found: 1
Logical Device Task:
Logical Device : 0
Task ID : 107
Current operation : Rebuild
Status : In Progress
Priority : High
Percentage complete : 0
Command completed successfully.
Collecting configuration for an LSI storage controller
You can collect configuration information for an LSI storage controller by using the StorCLI tool provided by LSI.
For information about how to install the StorCLI tool, see the StorCLI user guide on the official website of LSI. The installation procedure for the StorCLI tool varies by operating system.
By default, the StorCLI tool is started in a non-Windows operating system.
To start the StorCLI tool in a Windows operating system, perform the following tasks:
1. Press WIN and R on the keyboard simultaneously.
2. On the Run window that opens, enter cmd, and then click OK.
3. On the CLI that opens, execute the storcli command.
For information about the StorCLI command lines, see the StorCLI user guide on the official website of LSI.
This section uses the LSI 9460 storage controller with the Linux operating system to illustrate how to collect storage controller configuration.
Viewing storage controller, system kernel, and host name information
Syntax
storcli64 show
Example
[root@localhost /]# /opt/MegaRAID/storcli/storcli64 show
CLI Version = 007.1017.0000.0000 May 10, 2019
Operating system = Linux 3.10.0-957.el7.x86_64
Status Code = 0
Status = Success
Description = None
Number of Controllers = 1
Host Name = localhost.localdomain
Operating System = Linux 3.10.0-957.el7.x86_64
System Overview :
===============
--------------------------------------------------------------------
Ctl Model Ports PDs DGs DNOpt VDs VNOpt BBU sPR DS EHS ASOs Hlth
--------------------------------------------------------------------
0 SAS3108 8 2 1 0 1 0 N/A On 1&2 Y 3 Opt
Viewing detailed storage controller, physical drive, and logical drive information
Syntax
storcli64 /controller_id show
Parameters
controller_id: ID of the storage controller.
Example
[root@localhost /]# /opt/MegaRAID/storcli/storcli64 /c0 show
CLI Version = 007.1017.0000.0000 May 10, 2019
Operating system = Linux 3.10.0-957.el7.x86_64
Controller = 0
Status = Success
Description = None
Product Name = SAS3108
…
FW Version = 4.660.00-8313
Driver Name = megaraid_sas
Driver Version = 07.705.02.00-rh1
Current Personality = RAID-Mode
Vendor Id = 0x1000
Device Id = 0x5D
SubVendor Id = 0x19E5
SubDevice Id = 0xD207
Host Interface = PCI-E
Device Interface = SAS-12G
…
Virtual Drives = 1
VD LIST :
=======
---------------------------------------------------------------
DG/VD TYPE State Access Consist Cache Cac sCC Size Name
---------------------------------------------------------------
0/0 RAID1 Optl RW Yes RWTD - ON 110.827 GB
---------------------------------------------------------------
Physical Drives = 2
PD LIST :
=======
---------------------------------------------------------------------------------
EID:Slt DID State DG Size Intf Med SED PI SeSz Model Sp Type
---------------------------------------------------------------------------------
252:1 7 Onln 0 110.827 GB SATA SSD N N 512B INTEL SSDSC2BB120G6 U -
252:3 9 Onln 0 222.585 GB SATA SSD N N 512B INTEL SSDSC2KB240G7 U -
Viewing state, level, and parameter information about all logical drives
Syntax
storcli64 /controller_id/vall show all
Parameters
controller_id: ID of the storage controller.
Example
[root@localhost /]# /opt/MegaRAID/storcli/storcli64 /c0/vall show all
CLI Version = 007.1017.0000.0000 May 10, 2019
Operating system = Linux 3.10.0-957.el7.x86_64
Controller = 0
Status = Success
Description = None
Virtual Drives :
==============
---------------------------------------------------------------
DG/VD TYPE State Access Consist Cache Cac sCC Size Name
---------------------------------------------------------------
0/0 RAID1 Optl RW Yes RWTD - ON 110.827 GB
…
PDs for VD 0 :
============
---------------------------------------------------------------------------------
EID:Slt DID State DG Size Intf Med SED PI SeSz Model Sp Type
---------------------------------------------------------------------------------
252:1 7 Onln 0 110.827 GB SATA SSD N N 512B INTEL SSDSC2BB120G6 U -
252:3 9 Onln 0 222.585 GB SATA SSD N N 512B INTEL SSDSC2KB240G7 U -
---------------------------------------------------------------------------------
VD0 Properties :
==============
Strip Size = 256 KB
Number of Blocks = 232421376
VD has Emulated PD = Yes
Span Depth = 1
Number of Drives Per Span = 2
Write Cache(initial setting) = WriteBack
Disk Cache Policy = Disk's Default
Encryption = None
Data Protection = Disabled
Active Operations = None
Exposed to OS = Yes
OS Drive Name = /dev/sda
Creation Date = 21-10-2020
Creation Time = 08:00:42 AM
Emulation type = default
Cachebypass size = Cachebypass-64k
Cachebypass Mode = Cachebypass Intelligent
Is LD Ready for OS Requests = Yes
SCSI NAA Id = 6c0079045c1759aa2722a72a08c76c57
Viewing state, slot, and capacity information about all physical drives
Syntax
storcli64 /controller_id/eall/sall show
Parameters
controller_id: ID of the storage controller.
Example
[root@localhost /]# /opt/MegaRAID/storcli/storcli64 /c0/eall/sall show
CLI Version = 007.1017.0000.0000 May 10, 2019
Operating system = Linux 3.10.0-957.el7.x86_64
Controller = 0
Status = Success
Description = Show Drive Information Succeeded.
Drive Information :
=================
---------------------------------------------------------------------------------
EID:Slt DID State DG Size Intf Med SED PI SeSz Model Sp Type
---------------------------------------------------------------------------------
252:1 7 Onln 0 110.827 GB SATA SSD N N 512B INTEL SSDSC2BB120G6 U -
252:3 9 Onln 0 222.585 GB SATA SSD N N 512B INTEL SSDSC2KB240G7 U -
---------------------------------------------------------------------------------
Collecting storage controller configuration through HDM or BIOS
To obtain the manufacturer of a storage controller, contact Technical Support.
Collecting storage controller configuration through HDM
1. Log in to HDM, and then navigate to the RAID view tab on the storage management page.
2. Select the target storage controller.
The page will display information for the storage controller, including its model, supported RAID RAID levels, and supercapacitor state.
Collecting configuration for a PMC storage controller through BIOS
UEFI boot mode
|
|
NOTE: This section uses the H460 storage controller to illustrate how to collect configuration information for a PMC storage controller through UEFI BIOS. |
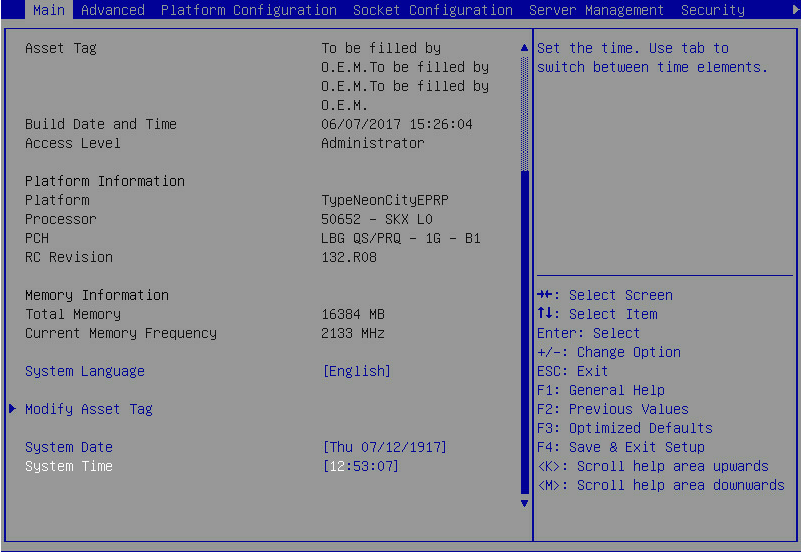
1. Start the server.
2. On the BIOS interface, press Delete or Esc (Delete or F2 for some servers) to open the BIOS Setup page.
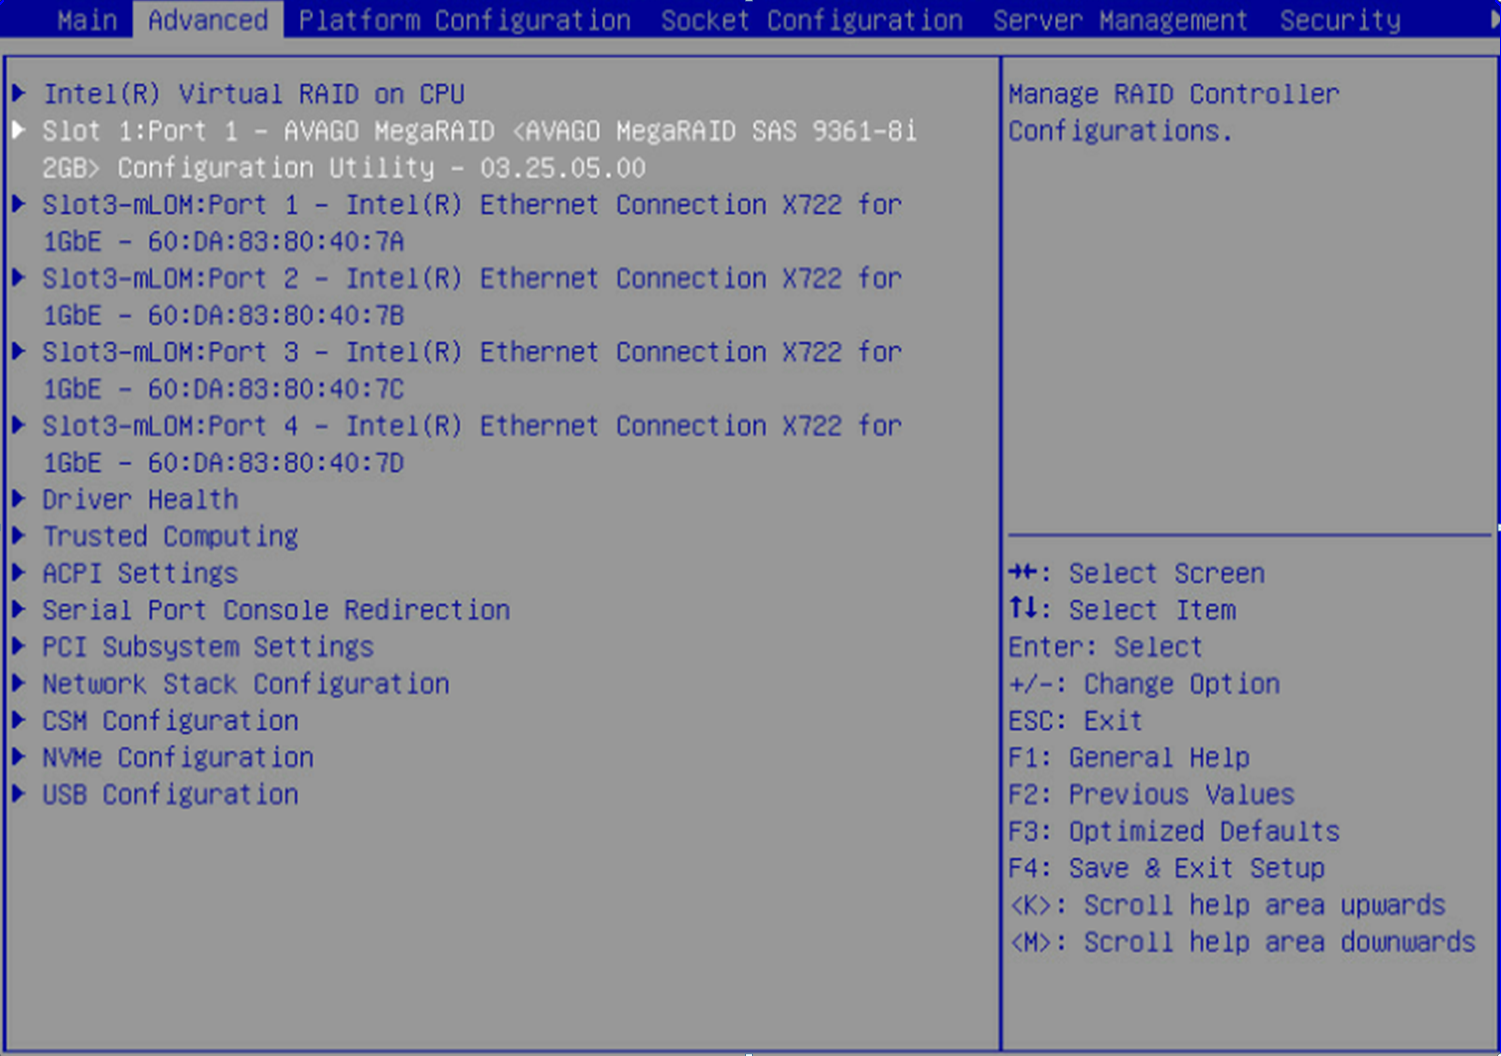
Figure 7 BIOS Setup page
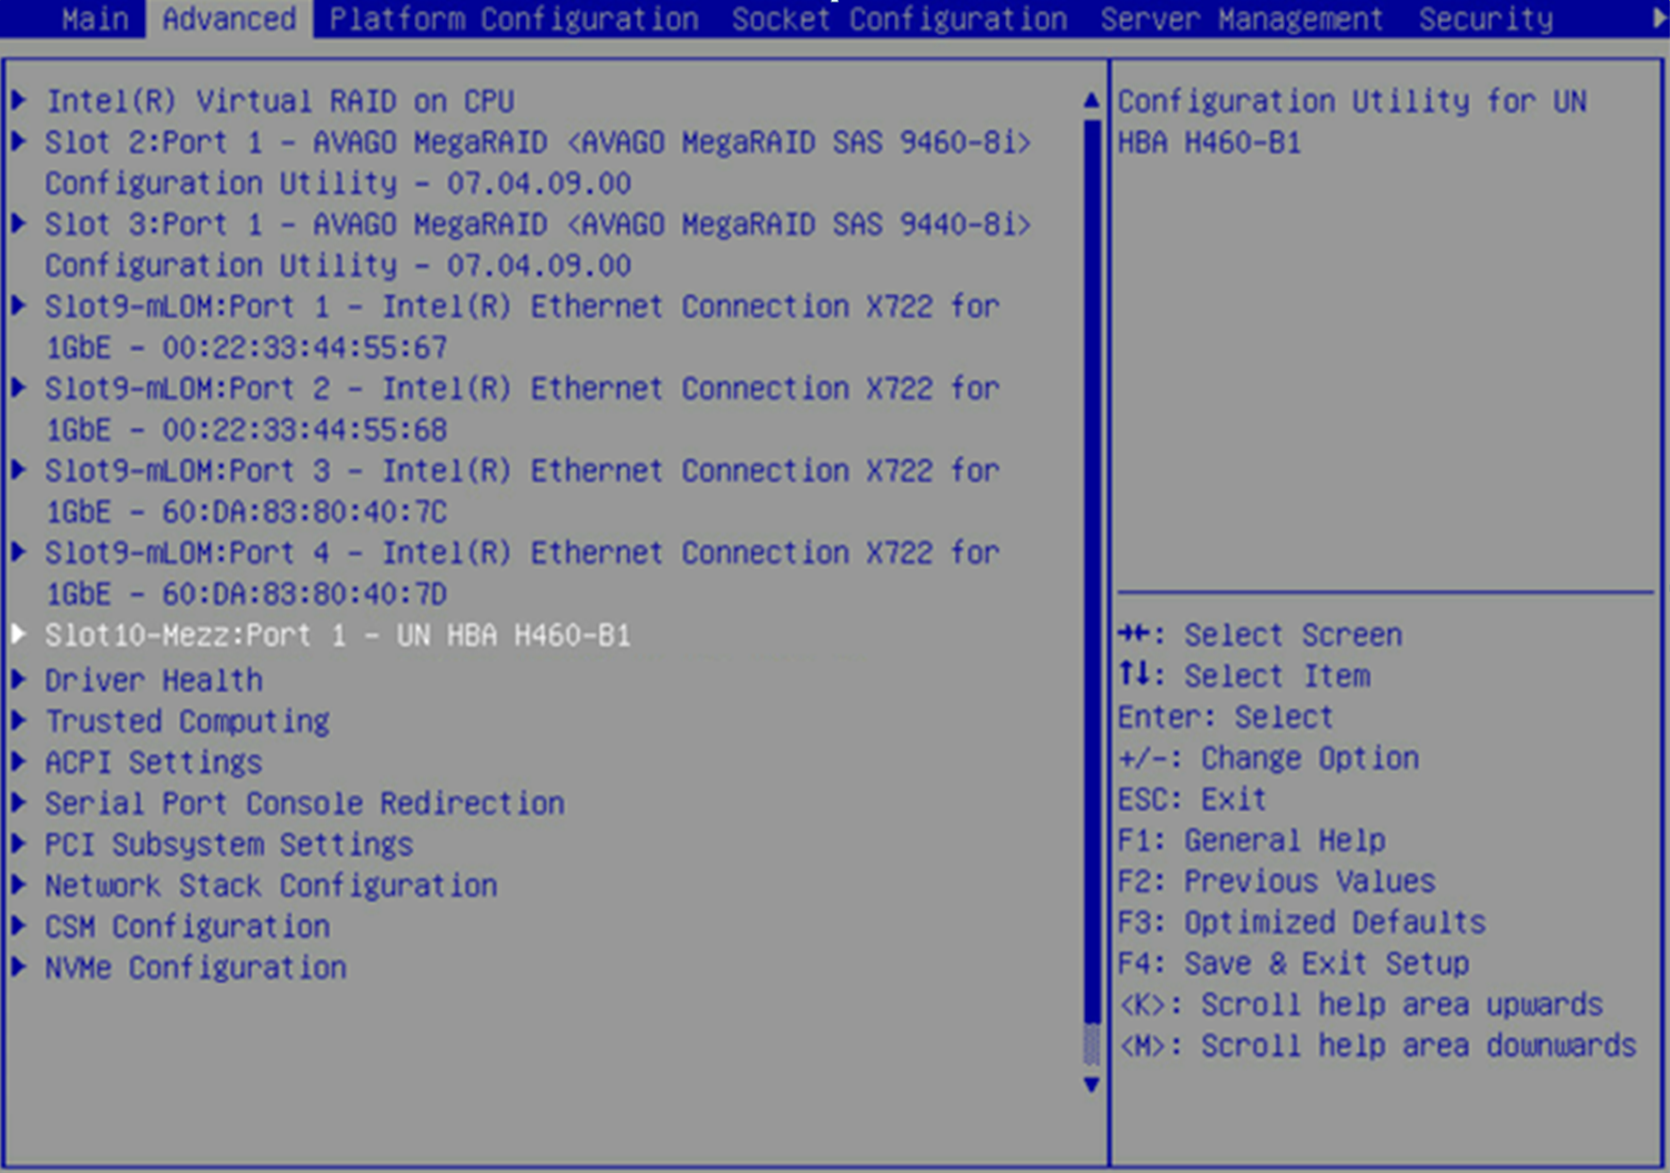
3. Click the Advanced tab, select a storage controller such as UN HBA H460-B1, and then press Enter.
Figure 8 Selecting storage controller
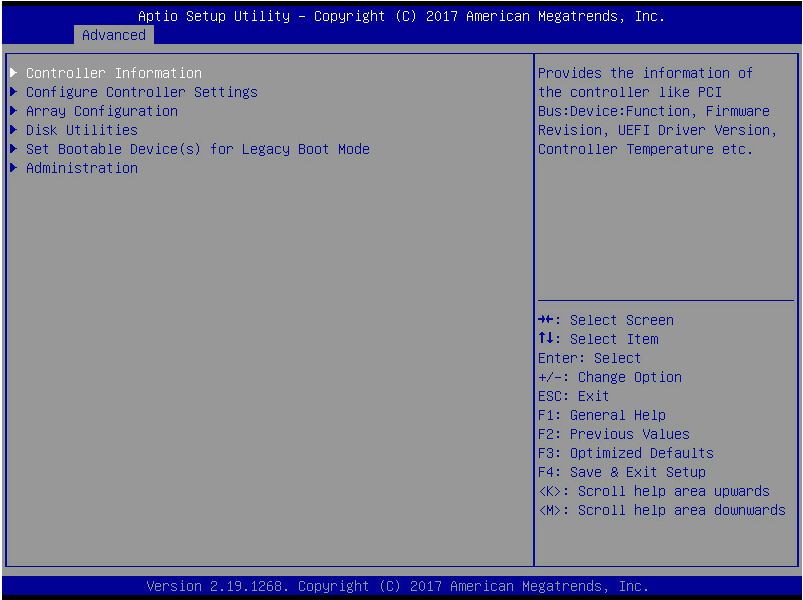
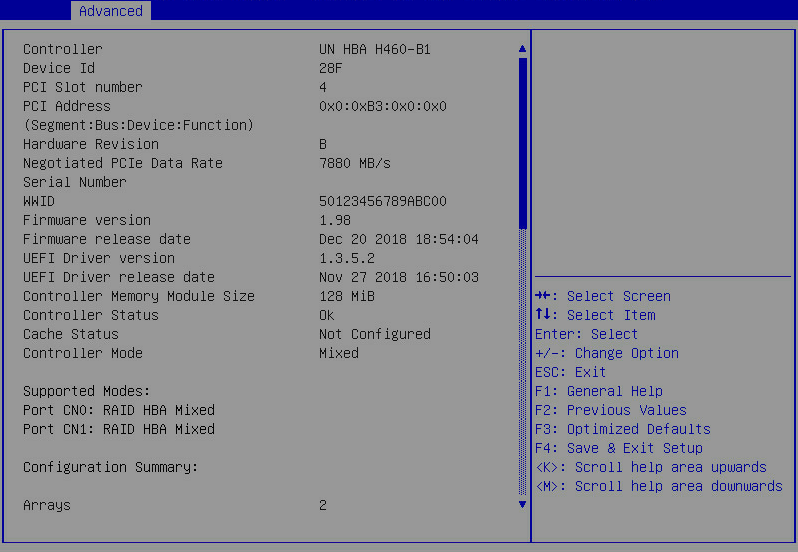
4. Select Controller Information, and then press Enter.
Figure 9 Storage controller configuration page
5. View basic information about the storage controller.
Figure 10 Basic storage controller information
Legacy boot mode
|
|
NOTE: This section uses the P430 storage controller to illustrate how to collect configuration information for a PMC storage controller through Legacy BIOS. |
1. Start the server.
2. When the page as shown in Figure 11 opens, press Ctrl and A simultaneously.
Figure 11 Pressing Ctrl and A simultaneously when this page opens
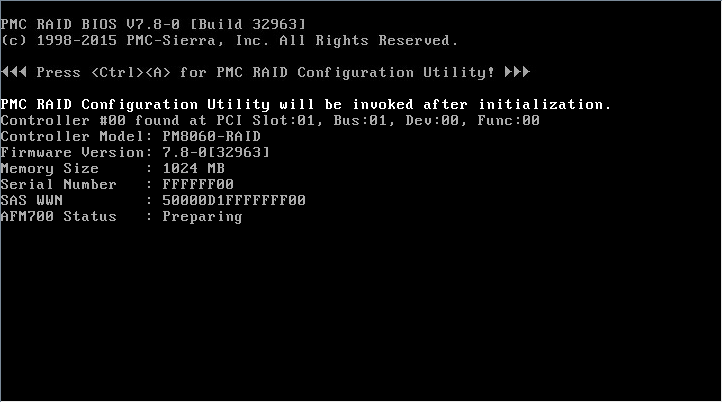
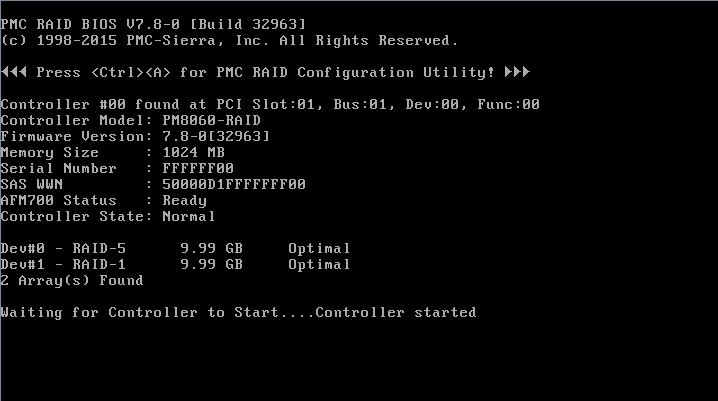
3. On the loading page that opens, you can view the version and state of the storage controller.
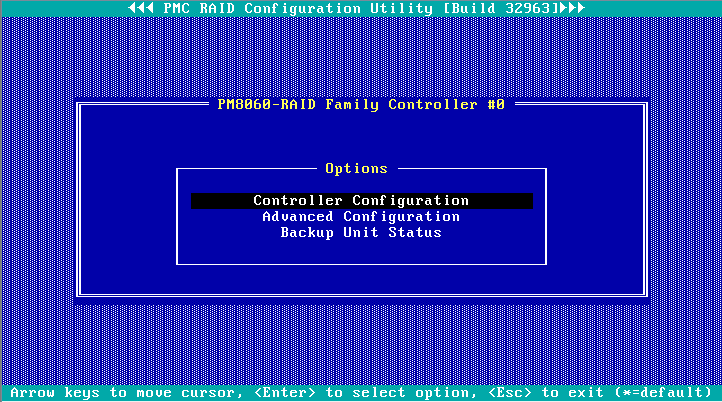
4. On the PMC RAID management interface that opens, select Controller Settings, and then press Enter.
Figure 13 PMC RAID management interface
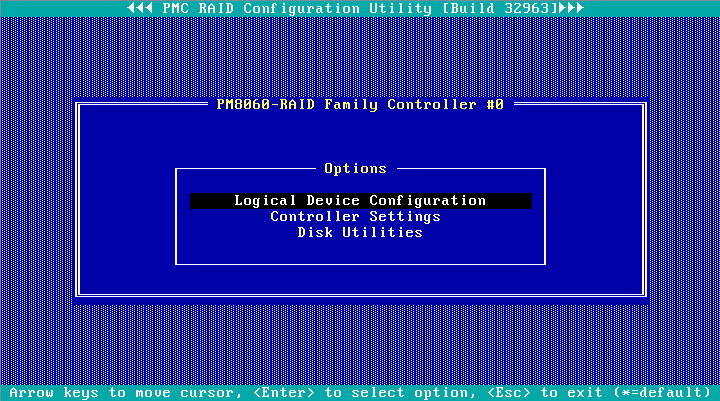
Table 9 PMC RAID management interface options
|
Option |
Description |
|
Logical Device Configuration |
Select this option to manage or create arrays, initialize or de- initialize drives, clear drive data, or configure boot options. |
|
Controller Settings |
Select this option to configure storage controllers, for example, edit the operating mode or restore the default. |
|
Disk Utilities |
Select this option to format or locate drives. |
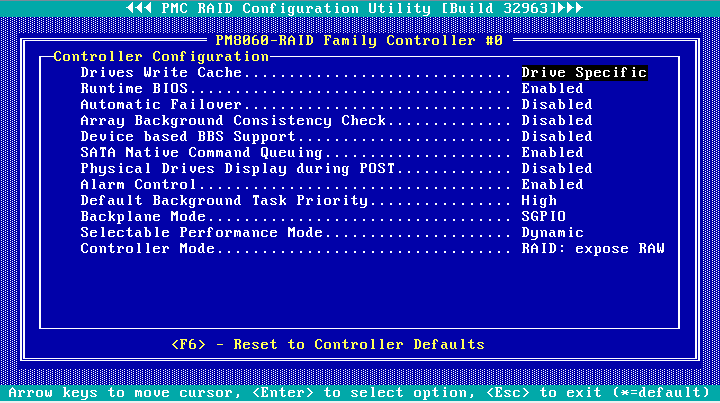
5. Select Controller Configuration, and then press Enter.
Figure 14 Controller Settings page
6. View configuration information about the storage controller.
Figure 15 Controller Configuration page
Collecting configuration for an LSI storage controller through BIOS
UEFI boot mode
|
|
NOTE: This section uses the RAID-LSI-9361-8i storage controller to illustrate how to collect configuration information for an LSI storage controller through UEFI BIOS. |
1. Start the server.
2. On the BIOS interface, press Delete or Esc (Delete or F2 for some servers) to open the BIOS Setup page. Some servers will open the Front page. In this scenario, select Device Management to open the device management page.
The bottom right of the page displays the operation instructions.
Figure 16 BIOS Setup page

3. On the storage controller management interface, click the Advanced tab, select a storage controller such as AVAGO MegaRAID<AVAGO MegaRAID SAS 9361-8i>, and then press Enter.
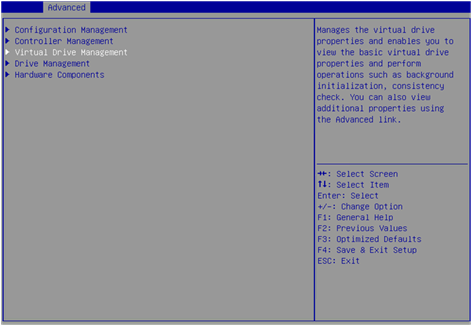
4. Select Main Menu, and then press Enter.
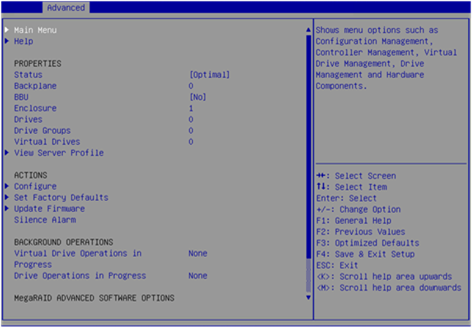
5. Select Virtual Drive Management, and then press Enter.
Figure 19 Storage controller configuration page
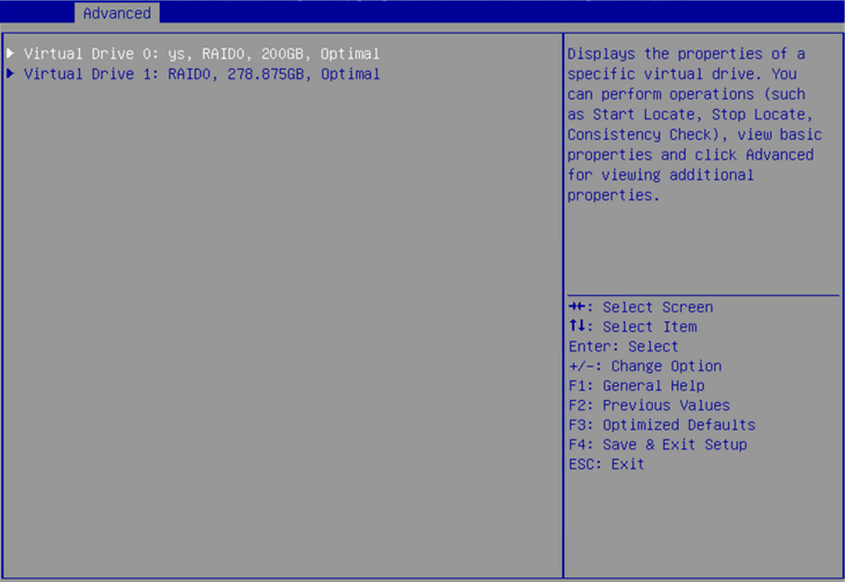
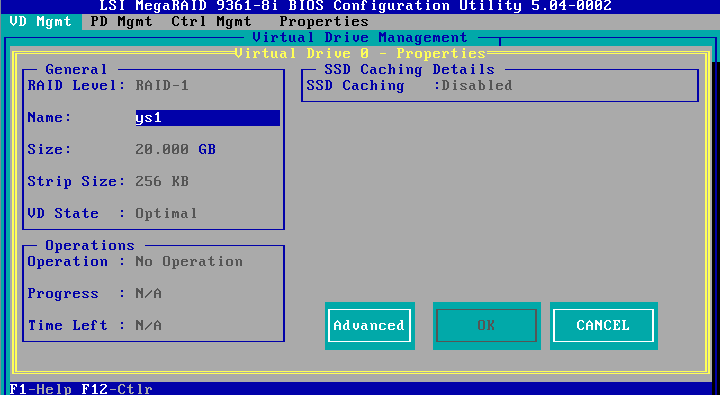
6. Select the target RAID, and then press Enter.
Figure 20 Virtual Drive Management page
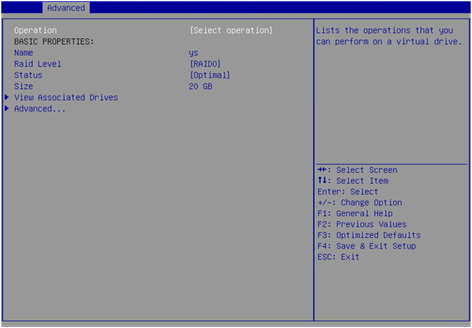
7. Select View Associated Drives, and then press Enter.
The page will display detailed RAID information including RAID name, level, and drives.
Figure 21 Selecting View Associated Drives
Legacy boot mode
|
|
NOTE: This section uses the LSI-9361 storage controller to illustrate how to collect configuration information for an LSI storage controller through Legacy BIOS. |
1. Start the server.
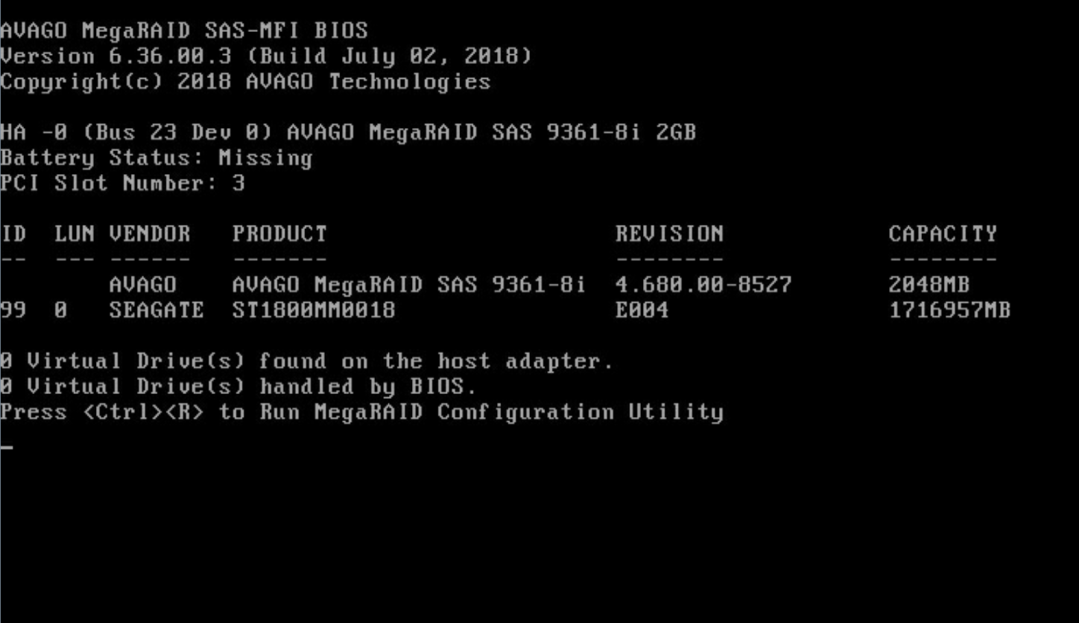
2. When the page as shown in Figure 22 opens, press Ctrl and R simultaneously.
Figure 22 Pressing Ctrl and R simultaneously when this page opens
3. On the VD Mgmt tab, select the target logical drive, and then press Enter.
Figure 23 Selecting a logical drive
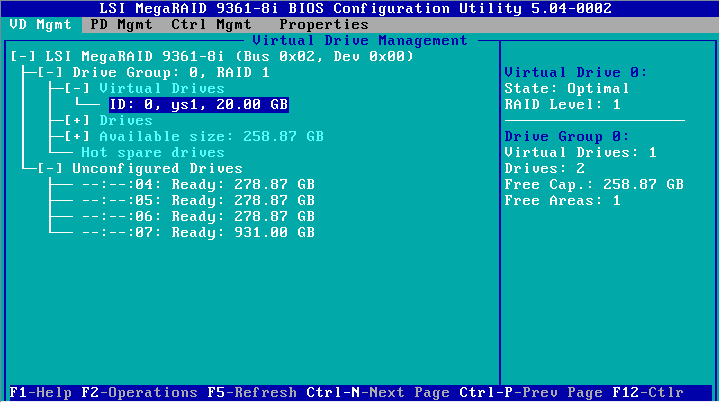
4. View detailed RAID information including RAID name, level, and drives.
Figure 24 RAID information
Collecting storage controller logs
To obtain the manufacturer of a storage controller, contact Technical Support.
Storage controller logs can be collected only through the storage controller management tool in the operating system. Use the arcconf tool for a PMC storage controller and the StorCLI tool for an LSI storage controller.
Collecting logs for a PMC storage controller
You can collect logs for a PMC storage controller by using the arcconf tool provided by PMC.
For information about how to install the arcconf tool, see the arcconf user guide on the official website of PMC. The installation procedure for the arcconf tool varies by operating system.
By default, the arcconf tool is started in a non-Windows operating system.
To start the arcconf tool in a Windows operating system, perform the following tasks:
1. Press WIN and R on the keyboard simultaneously.
2. On the Run window that opens, enter cmd, and then click OK.
3. On the CLI that opens, execute the arcconf command.
For information about the arcconf command lines, see the arcconf user guide on the official website of PMC.
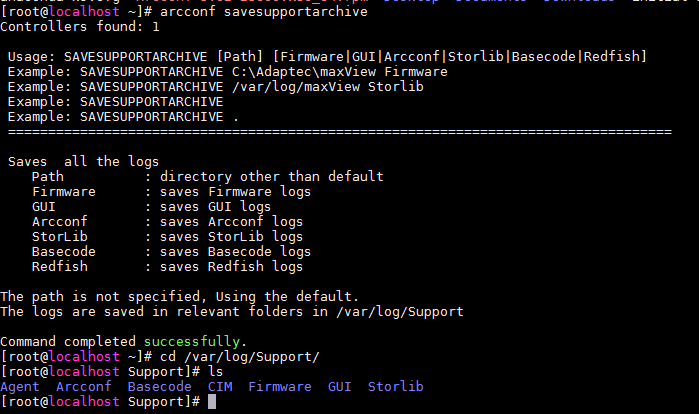
To collect logs for a PMC storage controller:
1. Start the arcconf tool.
2. Execute the arcconf savesupportarchive command to collect the logs, which might cost several minutes.
The logs will be saved to path /var/log/Support.
Figure 25 Collecting logs for a PMC storage controller
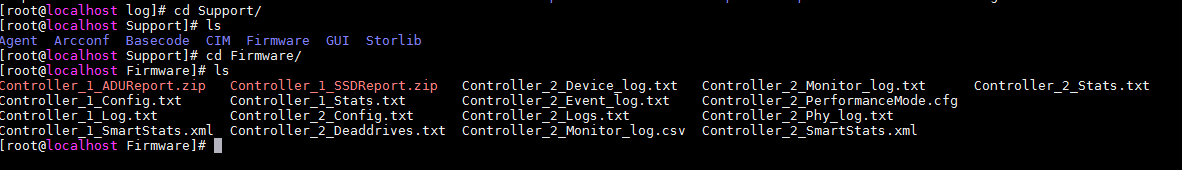
As shown in Figure 26, if the server has multiple PMC storage controllers, the system will create a log file prefixed with the storage controller ID for each storage controller.
Figure 26 Saving logs for multiple PMC storage controllers
Collecting logs for an LSI storage controller
You can collect logs for an LSI storage controller by using the StorCLI tool provided by LSI.
For information about how to install the StorCLI tool, see the StorCLI user guide on the official website of LSI. The installation procedure for the StorCLI tool varies by operating system.
By default, the StorCLI tool is started in a non-Windows operating system.
To start the StorCLI tool in a Windows operating system, perform the following tasks:
1. Press WIN and R on the keyboard simultaneously.
2. On the Run window that opens, enter cmd, and then click OK.
3. On the CLI that opens, execute the storcli command.
For information about the StorCLI command lines, see the StorCLI user guide on the official website of LSI.
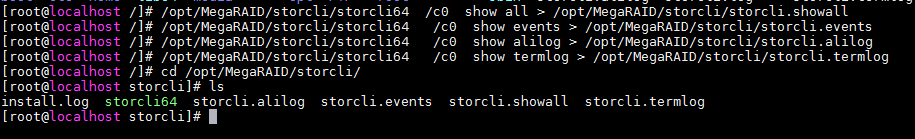
To collect array logs for an LSI storage controller:
1. Start the StorCLI tool.
2. To obtain and save log information about the storage controller and drives, execute the /opt/MegaRAID/storcli/storcli64 /c0 show all > storcli.showall command.
The log information will be saved to path /opt/MegaRAID/storcli/.
3. To obtain and save the important event logs that were generated in the lifecycle of the storage controller, execute the /opt/MegaRAID/storcli/storcli64 /c0 show events > storcli.events command.
The log information will be saved to path /opt/MegaRAID/storcli/.
4. To obtain and save the logs that were generated during operating system boot, execute the /opt/MegaRAID/storcli/storcli64 /c0 show termlog > storcli.showall command.
The log information will be saved to path /opt/MegaRAID/storcli/.
These logs provide storage controller configuration information, physical drive information, and logical drive information. After the operating system reboots, logs for this boot will overwrite those for the previous boot.
5. To obtain and save all logs, execute the /opt/MegaRAID/storcli/storcli64 /c0 show alilog > storcli.alilog command.
The log information will be saved to path /opt/MegaRAID/storcli/.
Figure 27 Collecting logs for an LSI storage controller
Collecting FC HBA logs
Collecting QLogic FC HBA logs
This section introduces how to collect logs for the following QLogic FC HBAs:
· FC-HBA-QLE2560-8Gb-1P-1
· FC-HBA-QLE2562-8Gb-2P-1
· FC-HBA-QLE2690-16Gb-1P-1
· FC-HBA-QLE2692-16Gb-2P-1
· FC-HBA-QLE2740-32Gb-1P
· FC-HBA-QLE2742-32Gb-2P
When a QLogic FC HBA fails, you can collect its logs for troubleshooting or fault analysis.
Log collecting tool
Table 10 shows the tools for collecting QLogic FC HBA logs in different operating systems. The log collecting tools will not collect any user information or affect services.
Table 10 QLogic FC HBA log collecting tool
|
Operating system type |
Log collecting tool |
Download link |
|
Windows |
qInfoHD_Windows---[date].exe |
https://mymarvell.force.com/marvellknowledgebase/s/article/3131 |
|
Linux |
qla_linux-info.sh |
https://mymarvell.force.com/marvellknowledgebase/s/article/1502 |
|
VMware |
qMwareHD--[date].exe |
https://mymarvell.force.com/marvellknowledgebase/s/article/2861 |
Log collecting procedure (Windows operating system)
|
|
NOTE: This section introduces the brief procedure for collecting QLogic FC HBA logs through a script tool. For detailed information about how to obtain the script tool and collect logs, access https://mymarvell.force.com/marvellknowledgebase/s/article/3131. |
1. Download the qInfoHD_Windows--[date].exe script tool from the official website of Marvell.
2. Right-click on the script tool, and then select Run as administrator to collect logs.
3. Save the log information.
The collected logs include the following information:
· Server information:
¡ Server manufacturer and server model.
· Operating system information:
¡ Operating system name and version.
¡ Running services.
¡ Installed management tools.
¡ Network information.
¡ Operating system logs and application event logs.
¡ VMware vCenter information, if any.
· FC HBA information:
¡ Installed adapters:
- FC adapter.
- FabricCache adapter.
- Converged network adapter.
- Intelligent Ethernet adapter.
- iSCSI adapter.
- LiquidSecurity hardware security module adapter.
¡ Installed drivers and their versions.
· Complete SupportSave log information for the Brocade switch, if any.
Log collecting procedure (Linux operating system)
|
|
NOTE: · This section introduces the brief procedure for collecting QLogic FC HBA logs through a script tool. For detailed information about how to obtain the script tool and collect logs, access https://mymarvell.force.com/marvellknowledgebase/s/article/1502. · To obtain debug information, access https://mymarvell.force.com/marvellknowledgebase/s/article/5933. |
1. Download the qla_linux_info.sh script from the official website of Marvell.
2. Upload the script to the operating system of the server, and then execute the following commands:
# chmod +x qla_linux_info.sh
# ./qla_linux_info.sh
3. Save the log information.
The collected logs include the following information:
· Server information:
¡ Manufacturer and model.
¡ Processor type and quantity.
¡ BIOS version and release date.
· Operating system information:
¡ Operating system name and version.
¡ IP address information.
¡ Operating system logs.
¡ Running processes.
· FC HBA information:
¡ SCSI information.
¡ QLE10000 FCA information.
¡ FC information.
¡ iSCSI information.
¡ Installed drivers and their versions.
¡ QLogic module information.
¡ QLogic subsystem vendor ID.
Log collecting procedure (VMware operating system)
|
|
NOTE: This section introduces the brief procedure for collecting QLogic FC HBA logs through a script tool. For detailed information about how to obtain the script tool and collect logs, access https://mymarvell.force.com/marvellknowledgebase/s/article/2861. |
1. Download the qMwareHD--[date].exe script tool from the official website of Marvell.
2. Right-click on the script tool, select Run as administrator, and then select VMware Support Dump file (.tgz) to allow the tool to obtain and parse dump files in the VMware system.
The system will generate a log file and save the file to the directory where the dump files are saved.
Collecting Emulex FC HBA logs
|
|
CAUTION: Performing a full capture by using the OneCapture tool on an Emulex FC HBA affects services on the FC HBA. Therefore, make sure services have been switched to other links or have been stopped before performing a full capture. |
When an Emulex FC HBA fails, you can collect its logs for troubleshooting or fault analysis.
Log collecting tool
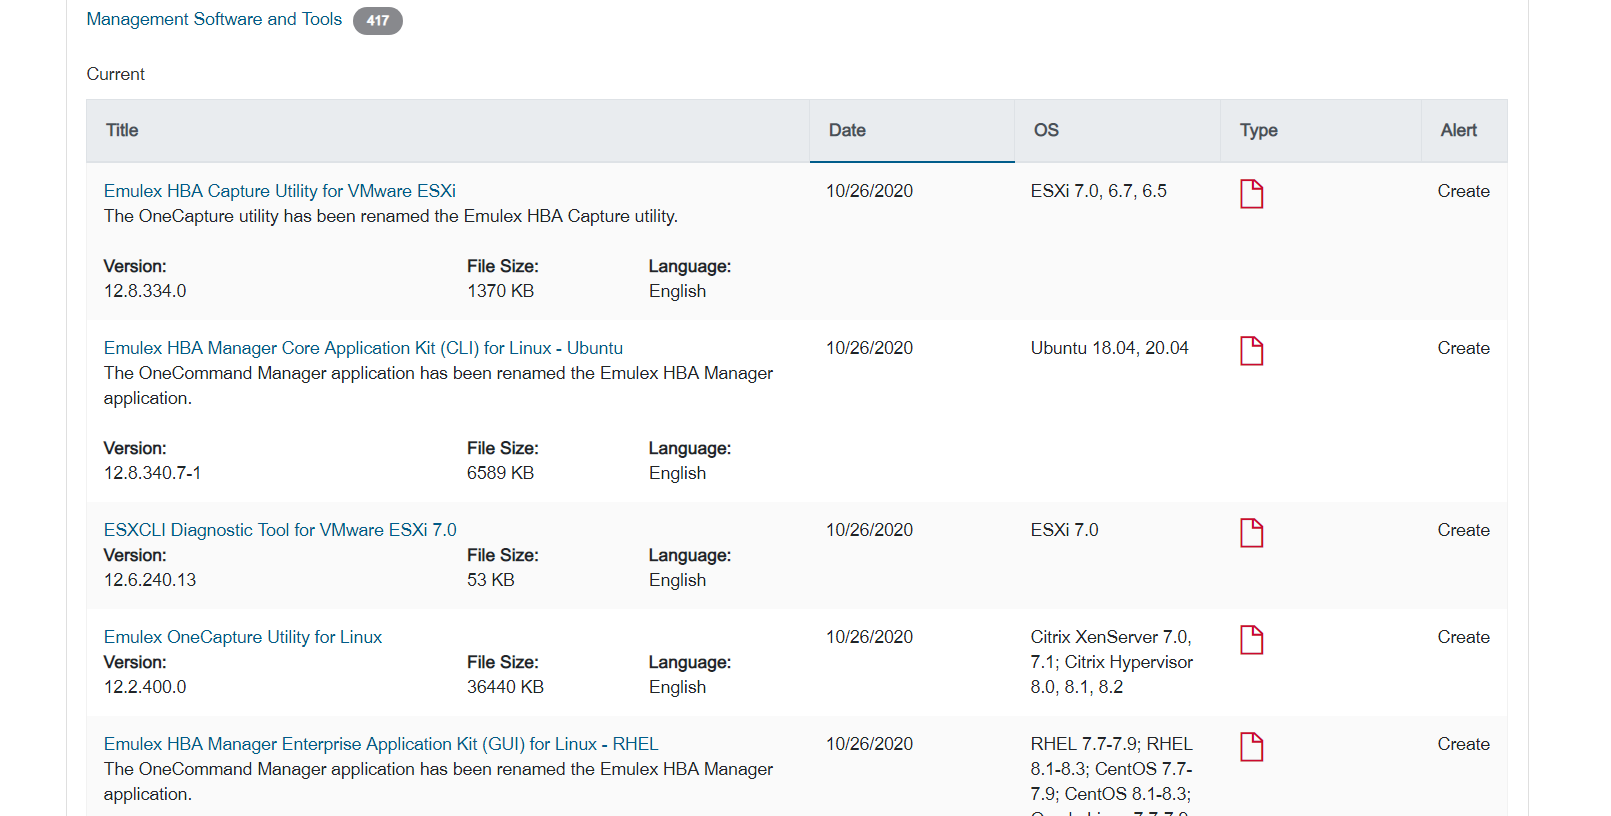
Emulex FC HBA logs are collected through the OneCapture tool, which can be downloaded from the official website of Broadcom. Table 11 shows different versions of the OneCapture tool for different types of operating systems.
Table 11 Emulex FC HBA log collecting tool
|
Operating system type |
Log collecting tool |
Download link |
|
Linux |
OneCapture_Linux_<version>.tgz |
https://www.broadcom.com/products/storage/fibre-channel-host-bus-adapters |
|
Windows |
OneCapture_<version>.zip |
|
|
VMware |
OneCapture_ESX_<version>.tgz |
Figure 28 OneCapture downloading page
Supported FC HBAs
· HBA-8Gb-LPe12000-1P-1
· HBA-8Gb-LPe12002-2P-1
· HBA-16Gb-LPe31000-1P-1
· HBA-16Gb-LPe31002-2P-1
· FC-HBA-LPe32000-32Gb-1P
· FC-HBA-LPe32002-32Gb-2P
Introduction to the Capture tool
Emulex HBA Capture (also known as OneCapture) is an Emulex device driver that collects operating system, Emulex software, and Emulex adapter information. You can learn about the driver state through this information. The Emulex HBA Capture tool provides the basic, full, safe, minimal, and custom capture types. You can select one capture type as needed. Both the log collecting procedure and log information collected vary by capture mode. For more information, access https://docs.broadcom.com/doc/12399041.
Collecting GPU logs
Table 12 displays methods for collecting GPU fault information, including logs.
Table 12 Procedures to collect GPU fault information
|
Item |
Collection method |
Collection content |
|
Fault symptom |
Take photos or screenshots to record the symptom. |
Photos or screenshots recording the symptom. |
|
SDS log |
· Collect from the HDM Web interface. · Collect all logs from Unitool. |
Log files in .sds or .tar.gz format. |
|
delta FPGA log |
· Log in to the server through a serial port and record i2c-test output. · Use ipmitool to collect logs from HDM2.70 or later. |
· i2c-test output in a .txt file. · ipmi output. |
|
System log |
· Execute the sosreport command. · Access directory /var/log, and copy all files and folders whose names contain the messages or dmesg string. |
· Sosreport. · Files and folders whose names contain the messages or dmesg string. |
|
nvidia-bug-report |
Execute the nvidia-bug-report.sh command in the operating system. |
nvidia-bug-report.log.gz |
|
nvidia-smi log |
Execute the following commands in the operating system: · nvidia-smi > nvidia_smi.log · nvidia-smi -a >nvidia_smi_a.log |
· nvidia_smi.log · nvidia_smi_a.log |
|
FM operating status, version, and service log |
· systemctl status nvidia-fabricmanager.service > FMstatus.log · journaltcl -u nvidia-fabricmanager >FMprocess.log · rpm -qa | grep –I nvidia |
· FMstatus.log · FMprocess.log · List of installed software packages. |
|
lspci log |
· lspci -tv >> lspci.log · lspci -nnvvv >> lspci.log · lspci -xxxx >> lspci.log |
lspci.log (containing logs collected from multiple dimensions) |
Diagnosing and locating faults
Restrictions and guidelines
Before you operate devices on the site, contact the customer for permission.
Before you operate storage media, notify the customer to contact H3C Technical Support to migrate or back up service data.
Follow these guidelines when you troubleshoot and locate faults:
· Check for external faults prior to internal faults. For example, check the power supply, network cables, power cords, peer device status, and server location before you check the hardware status and OS operation status.
· Evaluate the overall status of the server on HDM and observe the server health LED before you check specific hardware or software components based on the symptom and logs. For unrecognized hardware, bandwidth decrease, or CRC errors, list all possible failure points on the topology and then determine the troubleshooting scheme.
· Resolve issues in descending order of severity.
· Acknowledge alarms in descending order of severity.
· Analyze hardware log and OS log in combination.
· Minimize the test scope and use cross validation to resolve frequently occurred faults such as power-on failure:
¡ Install components one by one according to "Breaking server down to the minimum hardware configuration" to locate faulty hardware.
¡ Replace components of a failed server one by one to locate a faulty component.
General troubleshooting workflow
1. Make preparations:
a. Verify that the server has stable power supply and in an environment that can ensure correct operation of the server. Make sure the environment meets the space, ventilation, temperature, humidity, hygiene, rack height, and grounding requirements in the server usage manual.
b. Remove peripherals from the server, such as optical drives, USB flash drives, and external hard drives.
c. Prepare tools and software for troubleshooting as described in "Preparing software utilities" and "Preparing hardware utilities."
2. Collect logs as described in "Collecting fault information" and record the time, frequency, and alarm screenshot for the fault.
3. Log in to HDM and check the overall operation status of the server.
4. Check the status of each subsystem as instructed to locate the fault.
5. Check HDM event log to identify the faulty hardware.
6. If the faulty hardware cannot be located, shut down the server, disconnect the power cord, and verify that all components are correctly installed and connected inside the chassis.
7. Troubleshoot the fault as described in "Troubleshooting hardware issues" and "Troubleshooting software issues."
8. If the issue persists, collect HDM SDS log as described in "Collecting HDM SDS," record the time, frequency, and alarm screenshot for the fault, and contact Technical Support.
Locating faults by examining LEDs
Locating faults by examining the LEDs on the server
You can examine the LEDs on the server to locate faults, such as the system power LED, health LED, UID LED, power module LED, Ethernet port LED, and drive LED. For more information about LED locations, see the front panel and back panel descriptions in the server usage manual.
Flowchart
Figure 29 Flowchart for locating faults by examining the LEDs
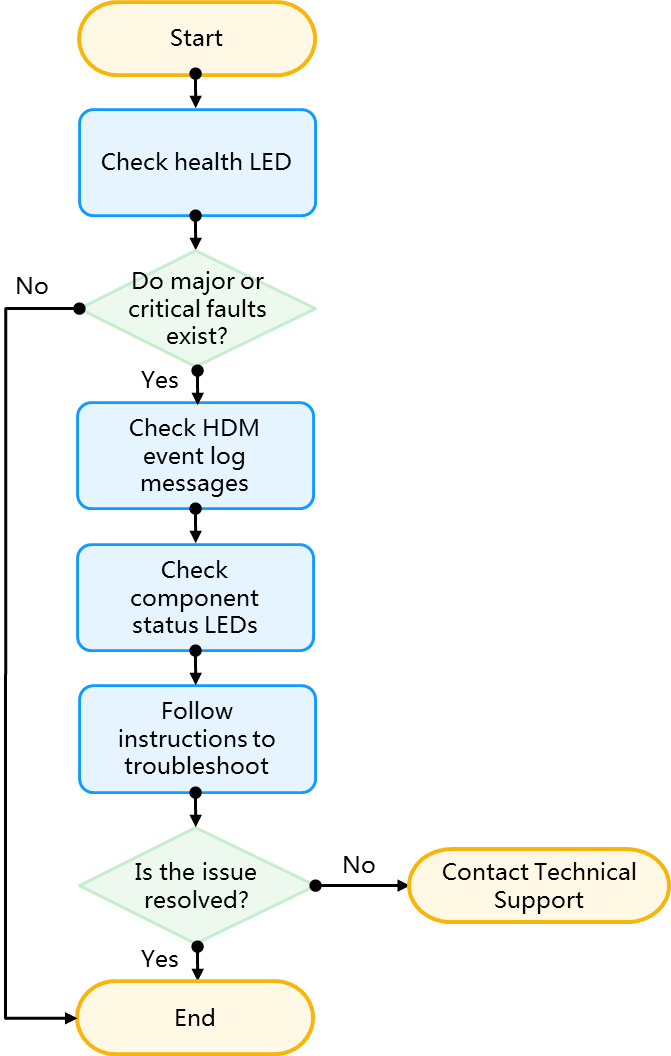
Procedure
1. Check the health LED to locate the fault. Table 13 lists the typical health LED definitions. For more information about the health LED, see the server usage manual.
Table 13 Health LED definitions
|
Health status |
Definition |
|
Solid green |
The server is operating correctly or has minor faults. The health status of the server is |
|
Flashing green (4 Hz) |
HDM is initializing. The health status of the server is |
|
Flashing amber (1 Hz) |
The server has major faults. The health status of the server is |
|
Flashing red (1 Hz) |
The server has critical faults. The health status of the server is |
2. If the server has major or critical faults, check event log on HDM to locate the faults.
3. Examine the LEDs to locate the faults based on Table 14.
Table 14 LED behaviors and fault handling for system faults
|
Faulty object |
LED behavior |
Definition |
Actions |
|
Processor |
Health LED: Flashing red (1 Hz) System power LED: Solid amber |
The processor is in critical state. |
1. Verify that the processer is installed properly. 2. Log in to HDM to check even log for CPU errors, and handle the errors as described in "Processor issues." 3. If the issue persists, contact Technical Support. |
|
Memory |
Health LED: Solid green System power LED: Solid green |
One or multiple DIMMs are faulty. |
4. Verify that all DIMMs are properly seated. 5. Verify that the installation sequence of DIMMs meets the requirements in the installation guide. 6. Log in to HDM to check even log for memory errors, and handle the errors as described in "DRAM DIMM issues." 7. If the issue persists, contact Technical Support. |
|
Health LED: Flashing amber (1 Hz) System power LED: Solid green |
One or multiple DIMMs are faulty. |
||
|
System temperature |
Health LED: Solid green System power LED: Solid green |
The temperature is high. |
8. Verify that the environment temperature is below the alarm threshold. 9. Verify that the air inlet and outlet are not blocked. 10. Verify that the number of fans meets the minimum requirements and the fans are operating correctly. 11. If the issue persists, contact Technical Support. |
|
Health LED: Flashing amber (1 Hz) System power LED: Solid green |
The system over temperature condition has significantly degraded server performance. |
||
|
Health LED: Flashing red (1 Hz) System power LED: Solid amber |
The server might shut down alternatively to avoid component damage, because the system over temperature condition is critical. |
||
|
Fan |
Health LED: Solid green System power LED: Solid green |
A fan has failed or been removed. |
12. Verify that the fans are installed properly. 13. Verify that the installation sequence of the fans meets the requirements in the installation guide. 14. Verify that the fans are operating correctly. If a fan is abnormal, replace it. 15. If the issue persists, contact Technical Support. |
|
Health LED: Flashing red (1 Hz) System power LED: Solid amber |
Two or more fans have failed or been removed. |
||
|
Power supply |
Health LED: Flashing red (1 Hz) System power LED: Solid amber |
One of the following conditions exists: · A power module has failed. · A power module is powered off because the system board has faults. |
16. Determine the symptom and handle the issue as described in "Power supply failures." 17. If the issue persists, contact Technical Support. |
|
Health LED: Flashing amber (1 Hz) System power LED: Solid green |
One of the following conditions exists: · The backup power module is properly installed but is not operating. · The backup power module is not powered on. · The backup power module has failed. |
||
|
Health LED: Flashing red (1 Hz) System power LED: Solid green |
· The power modules are of different models. · The server is incompatible with the power modules. |
||
|
SAS/SATA drive |
Health LED: Solid green Drive fault/UID LED (amber/blue): Flashing amber (0.5 Hz) Drive present/active LED (green): Solid or flashing (4 Hz) |
The drive has a potential error. |
Replace the drive. |
|
Health LED: Solid green Drive fault/UID LED: Off Drive Present/Active LED: Off |
The drive cannot be recognized. |
18. Verify that the drive is installed properly. 19. Troubleshoot the issue by following the workflow in "Physical drive issues flowchart." 20. If the issue persists, contact Technical Support. |
|
|
Health LED: Flashing amber (1 Hz) Drive fault/UID LED (amber/blue): Solid amber Drive present/active LED (green): Solid or flashing (4 Hz) |
The drive has failed. |
Replace the drive immediately. |
|
|
NVMe drive |
Health LED: Flashing amber (1 Hz) Drive fault/UID LED (amber/blue): Solid amber Drive present/active LED (green): Solid or flashing (4 Hz) |
The drive has failed. |
Replace the drive immediately. |
|
Health LED: Solid green Drive fault/UID LED: Off Drive present/active LED: Off |
The drive cannot be recognized. |
21. Verify that the drive is installed properly. 22. Troubleshoot the issue by following the workflow in "Physical drive issues flowchart." 23. If the issue persists, contact Technical Support. |
|
|
OCP network adapter |
Health LED: Solid green ATTN button LED: Solid amber OCP network adapter power LED: Off |
One of the following conditions exists: · The OCP network adapter is not installed properly. · The hot-swapped OCP network adapter is not powered on after the ATTN button is pressed. · The system does not respond in 10 seconds after the ATTN button is pressed for hot removing the OCP network adapter. |
24. Verify that the OCP network adapter is properly installed. 25. Close the software that has high CPU or memory usage, and then press the ATTN button. 26. Replace the OCP network adapter. 27. Reboot the operating system. 28. If the issue persists, contact Technical Support. |
Front panel LED power fault codes
When a power fault occurs, the following front panel LEDs flash simultaneously:
· Health LED
· System power LED
· UID LED
· Ethernet port LED (for an Ethernet port on the server panel or the OCP network adapter).
The number of flashes in each sequence corresponds to the subsystem impacted by the power fault. Table 15 and Table 16 provide a list of power fault codes, and the subsystems that are affected.
Table 15 Front panel LED power fault codes for G3 servers
|
Subsystem |
LED behavior |
|
System board |
1 flash |
|
Processor |
2 flashes |
|
Memory |
3 flashes |
|
Riser board PCIe slots |
4 flashes |
|
FlexibleLOM |
5 flashes |
|
RAID controller/HBA controller |
6 flashes |
|
PCIe standard controller |
7 flashes |
|
Drive back plane |
8 flashes |
|
Power supply |
9 flashes |
Table 16 Front panel LED power fault codes for G5 servers
|
Subsystem |
LED behavior |
|
System board |
1 flash |
|
Processor |
2 flashes |
|
Memory |
3 flashes |
|
Riser board PCIe slots |
5 flashes |
|
Drive back plane |
10 flashes |
|
Power supply |
11 flashes |
Locating faults by examining the diagnostic panel
To fast locate a fault that has occurred on a component and resolve the fault, you can examine the diagnostic panel and check the event log on HDM. For more information about the fault codes and fault LEDs on the diagnostic panel, see the diagnostic panel introduction in the server usage manual.
Support for the diagnostic panel depends on the device model.
The diagnostic panel displays fault information about one component at a time. If multiple components fail, the diagnostic panel displays fault information about each component in turn at an interval of four seconds.
Figure 30 Diagnostic panel
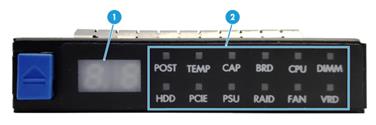
|
(1) Fault code |
(2) Fault LED |
Locating faults by examining the LEDs on the intelligent security bezel
The intelligent security bezel provides LEDs to indicate the server running and health status, which facilitates onsite inspection and fault location. For more information about the LEDs on the intelligent security bezel, see the intelligent security bezel introduction in the server usage manual.
If the LEDs on the intelligent security bezel indicate an alarm, check for the alarm on HDM. For more information about HDM alarms, see H3C HDM System Log Messages Reference.
Support for the intelligent security bezel depends on the device model.
Figure 31 intelligent security bezel
Troubleshooting flowcharts
Some information provided in the flowcharts can be further explained in conjunction with information provided in other sections of this document.
The available flowcharts include:
· Storage controller issues flowchart
· Storage controller supercapacitor issues flowchart
· Physical drive issues flowchart
· Logical drive issues flowchart
· Network adapter issues flowchart
General diagnosis flowchart
Use this flowchart when the symptom or fault cause cannot be identified.
Flowchart
Figure 32 General troubleshooting flowchart
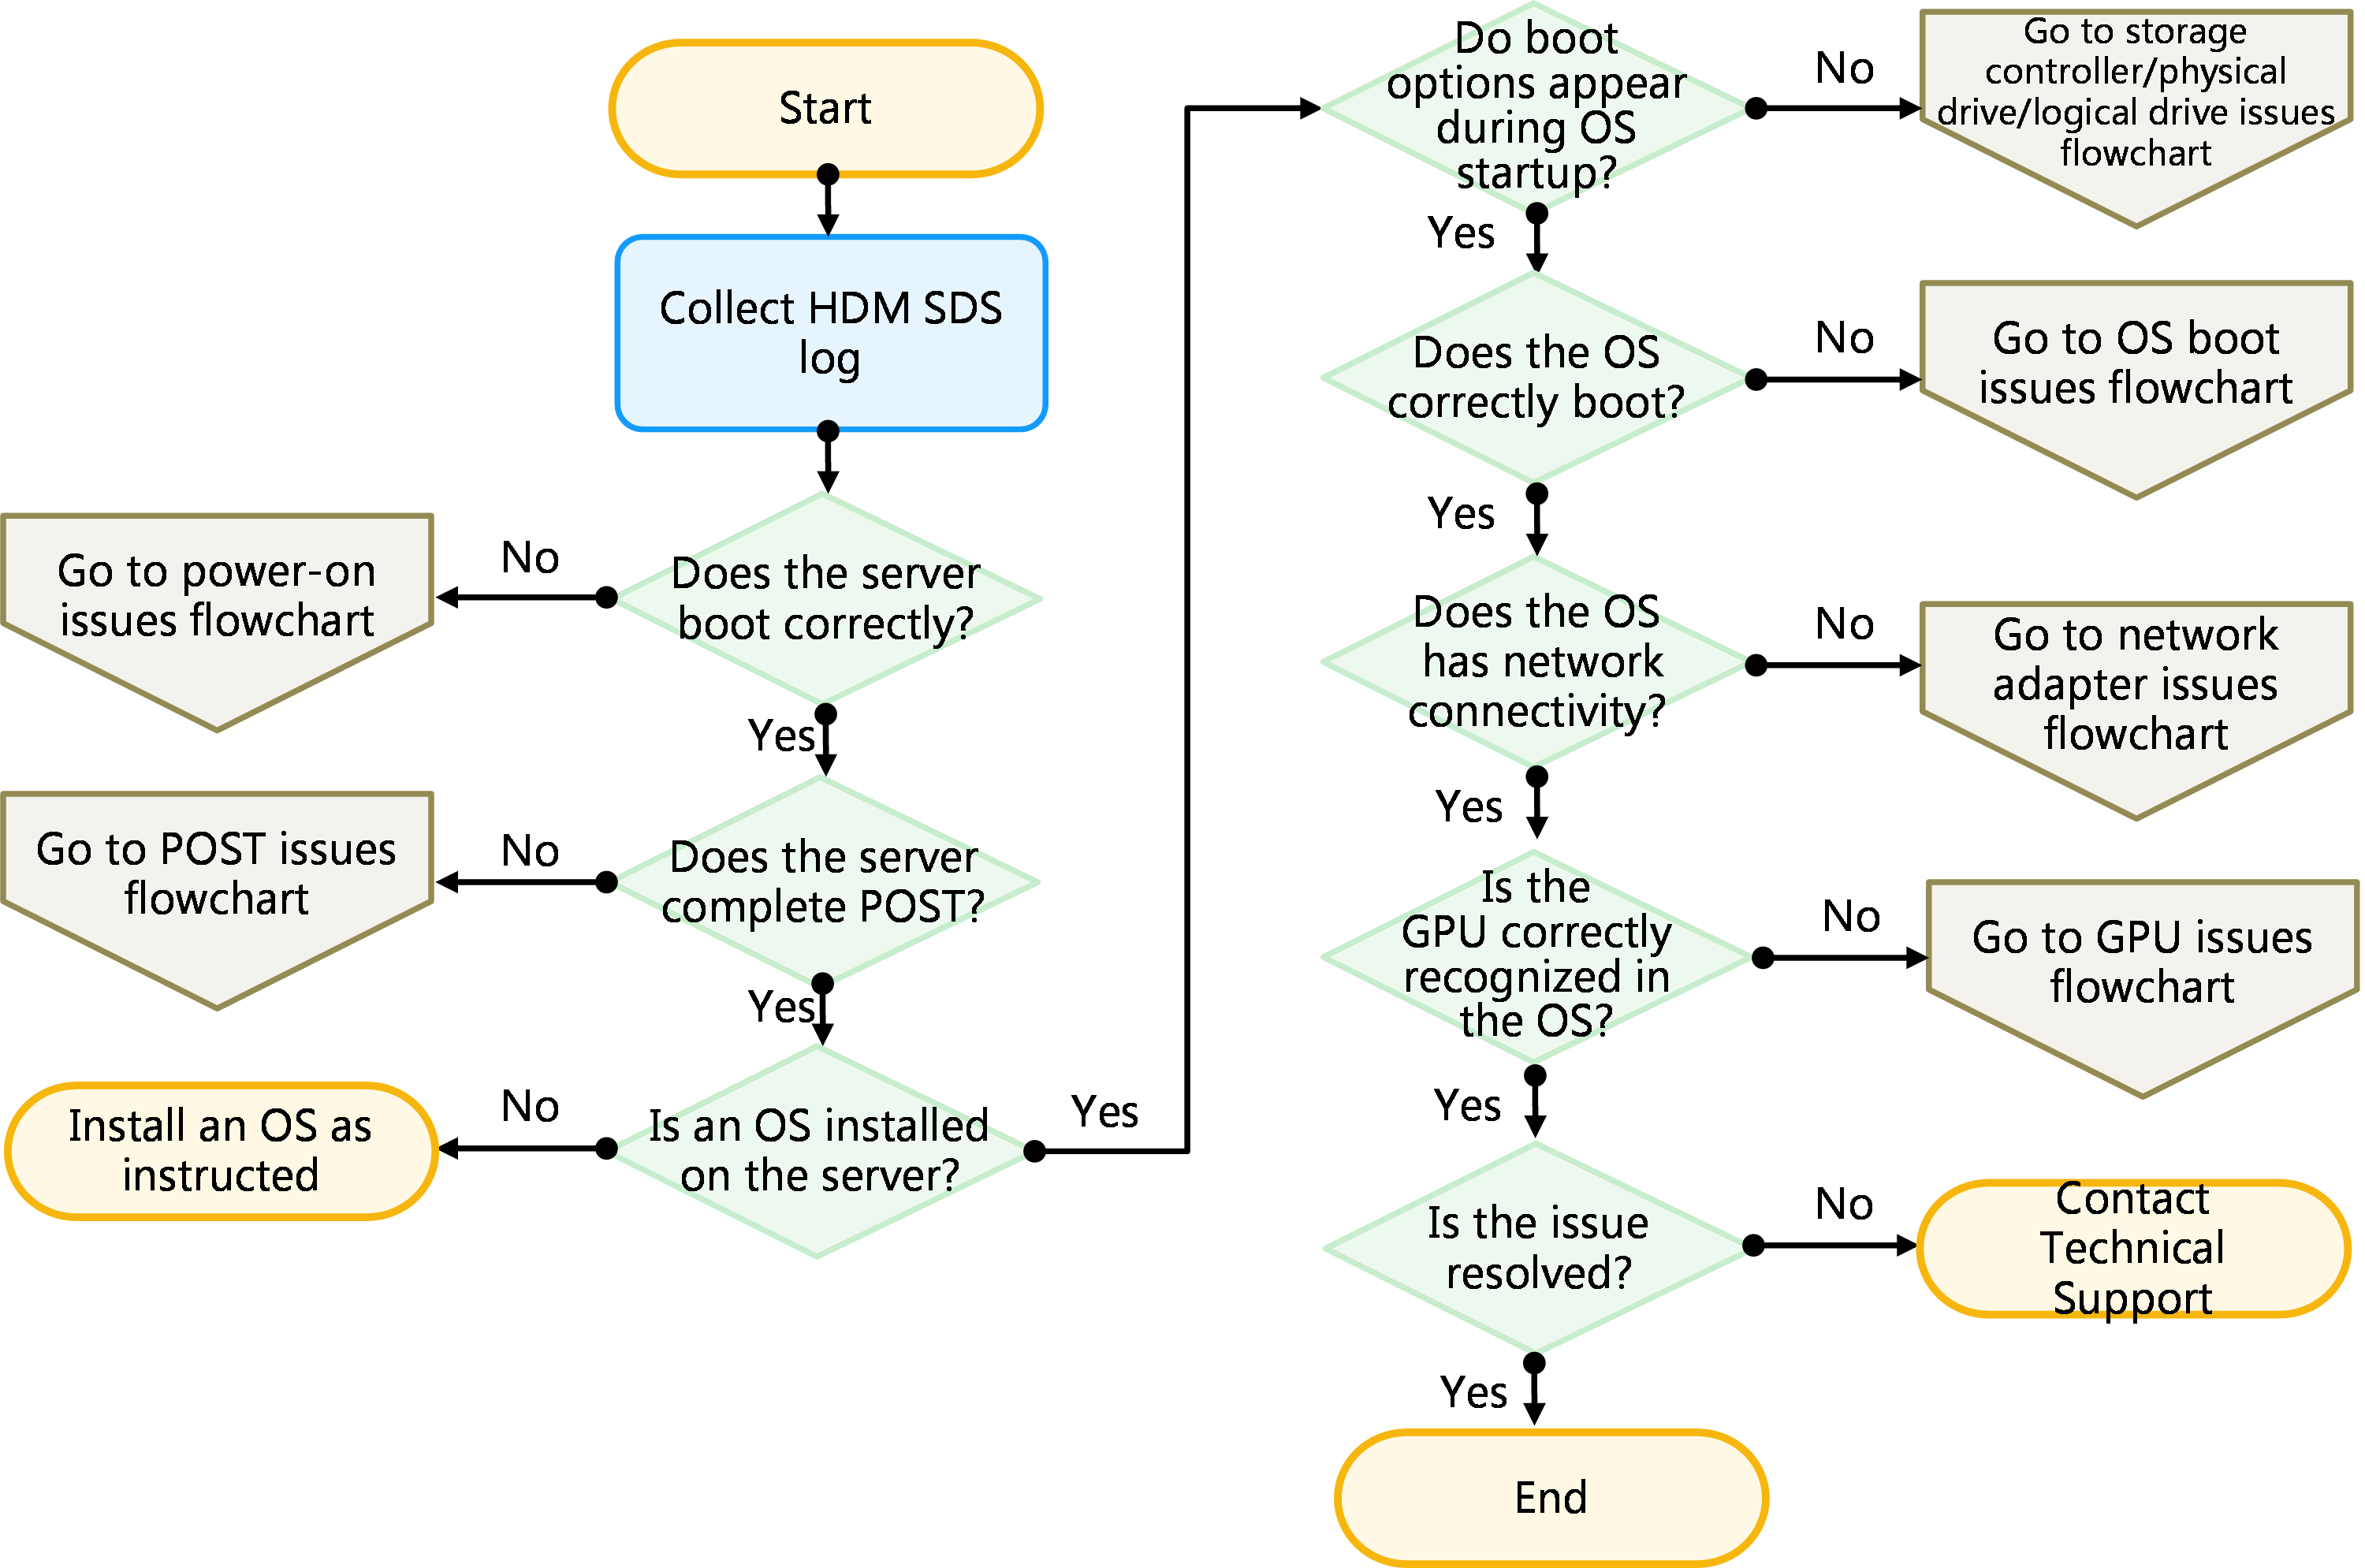
Related flowcharts
· Storage controller issues flowchart
· Physical drive issues flowchart
· Logical drive issues flowchart
· Network adapter issues flowchart
Fault indications flowchart
Symptom
· The server boots, but a fault event is reported on HDM.
· The server boots, but the system health LED is flashing red or amber.
Cause
· Improperly seated or faulty internal or external component.
· Redundancy failure, such as fan or power module failure.
· System over temperature condition.
Prerequisites
Before you troubleshoot the issue, perform the following tasks:
· Collect HDM SDS log as described in "Collecting HDM SDS logs."
· Verify that all components are supported by the server by using the server compatibility search tool provided on the H3C official website.
Restrictions and guidelines
To obtain maintenance tools, see "Preparing software utilities."
Replace or reseat a component by following the restrictions and guidelines in the server usage manual.
For more information about component status LEDs, see the server usage manual.
Flowchart
To resolve the issue, follow the steps in the flowchart.
Figure 33 Server hardware troubleshooting flowchart
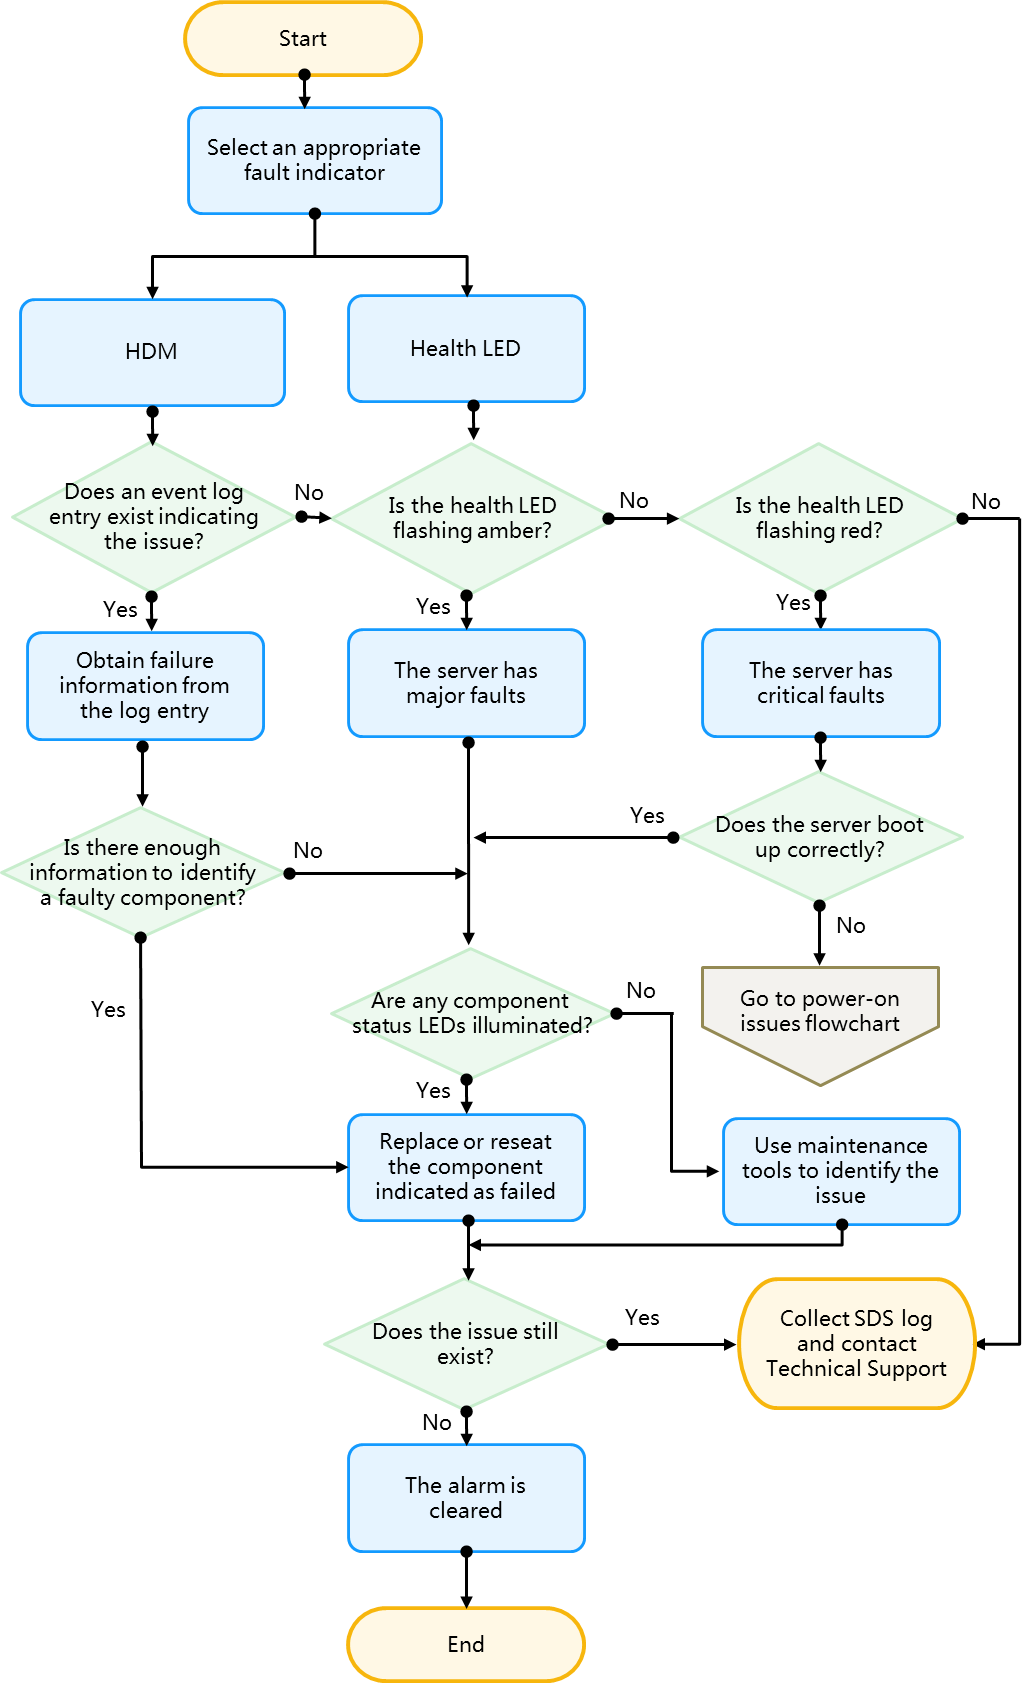
Related flowcharts
Remote diagnosis flowchart
Figure 34 Remote diagnosis flowchart
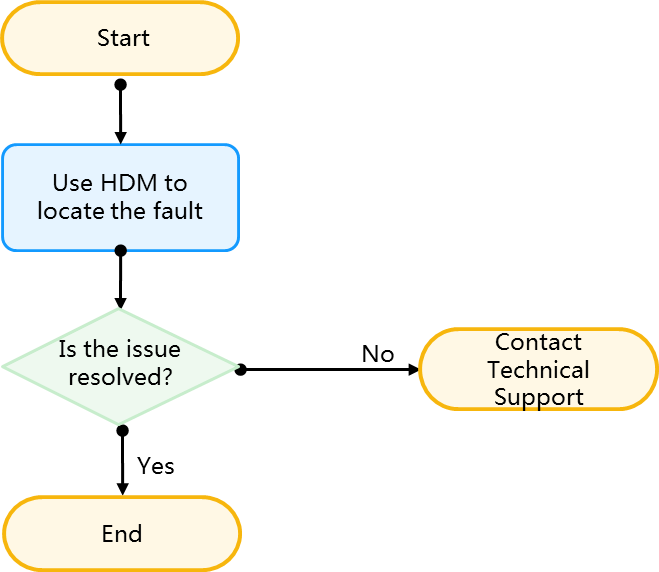
Power-on issues flowchart
Figure 35 Power-on issues flowchart
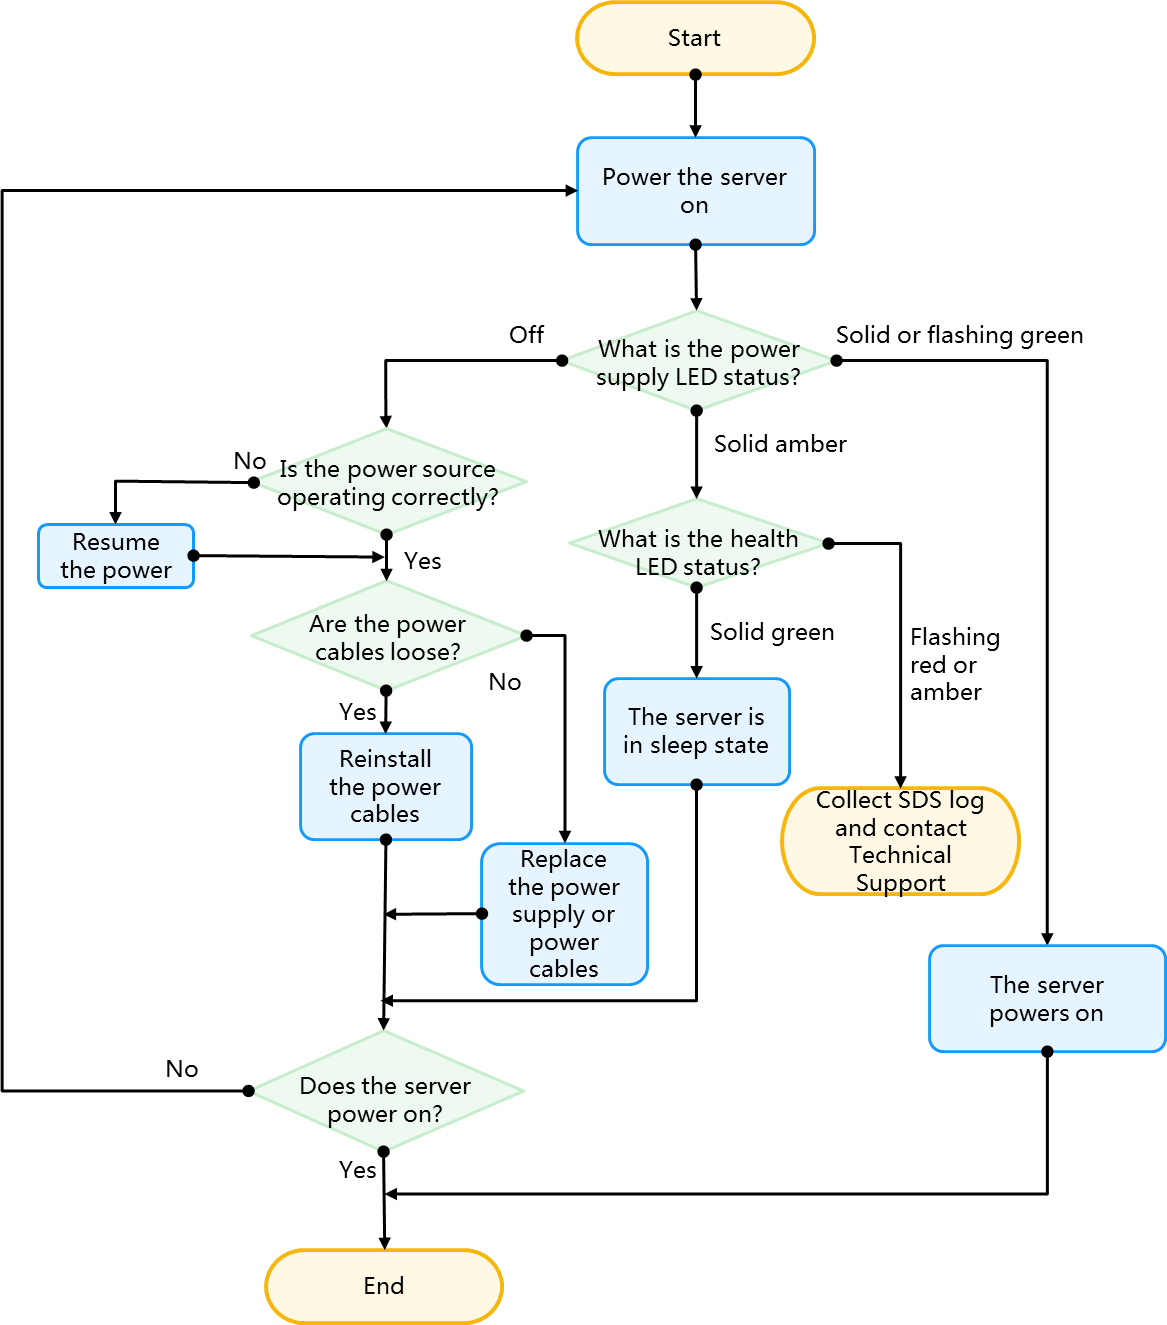
POST issues flowchart
Symptom
· The server does not complete POST.
· The server completes POST with errors.
|
|
NOTE: · The server boots after completing POST. · Servers using Hygon processors do not have Early POST. |
Flowchart
Figure 36 POST issues flowchart
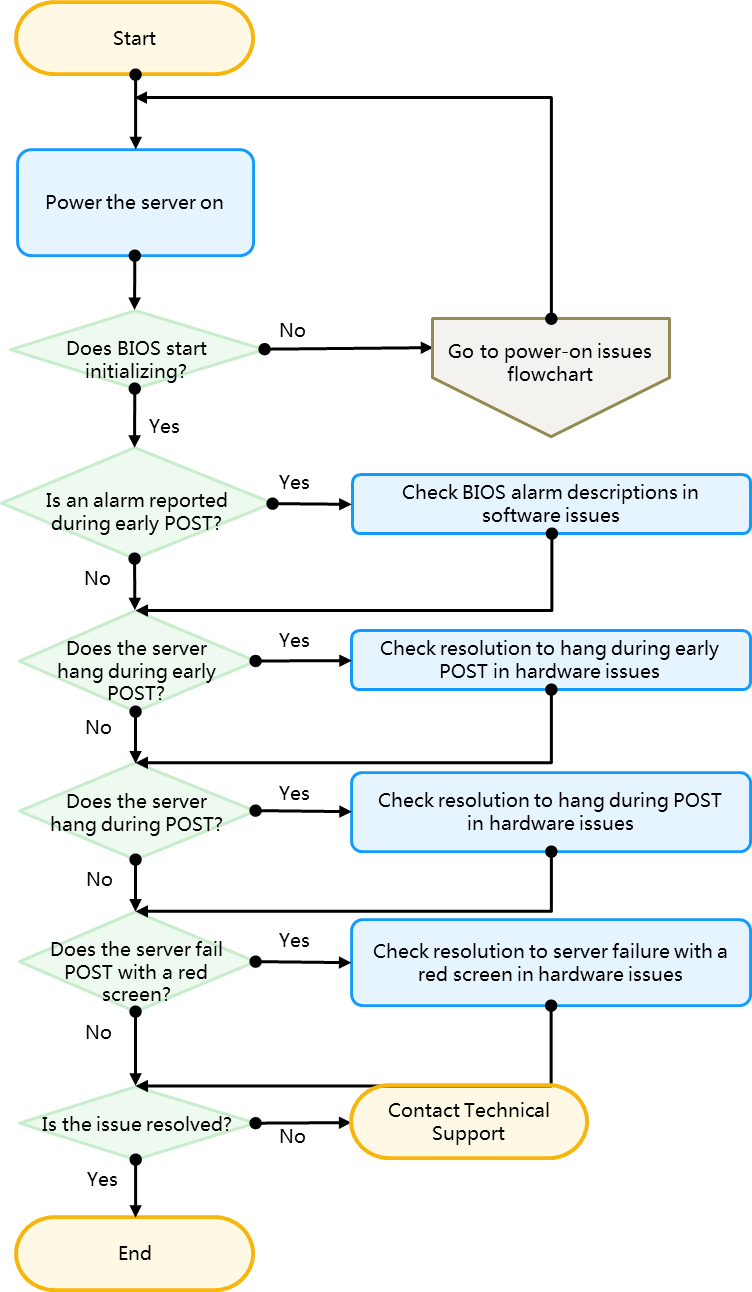
Related flowcharts
OS boot issues flowchart
Symptom
The server does not boot a previously installed OS.
Cause
· BIOS boot mode change.
· Issue with the boot order.
· OS data damage.
· Storage medium issue.
Restrictions and guidelines
Before you delete or write data on storage medium, notify customers of the impacts of your operation and back up data.
Flowchart
Figure 37 OS boot issues flowchart
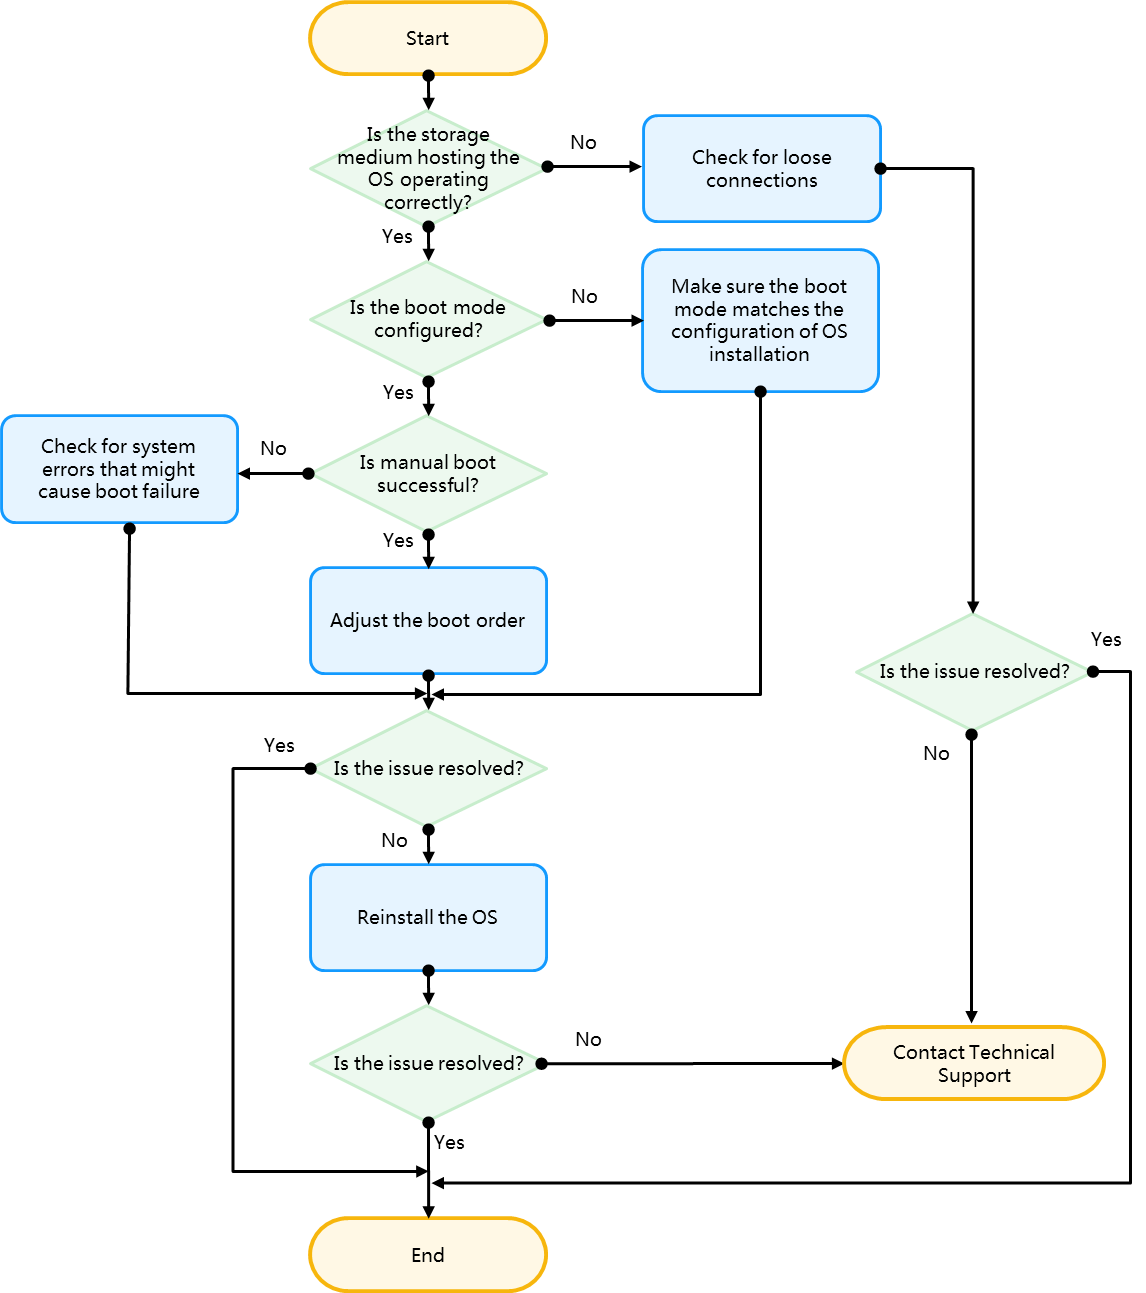
iFIST issues flowchart
Restrictions and guidelines
To obtain the BIOS version number, log in to HDM or check the BIOS POST output. For information about BIOS and iFIST compatibility, see iFIST release notes.
Flowchart
Figure 38 iFIST issues flowchart
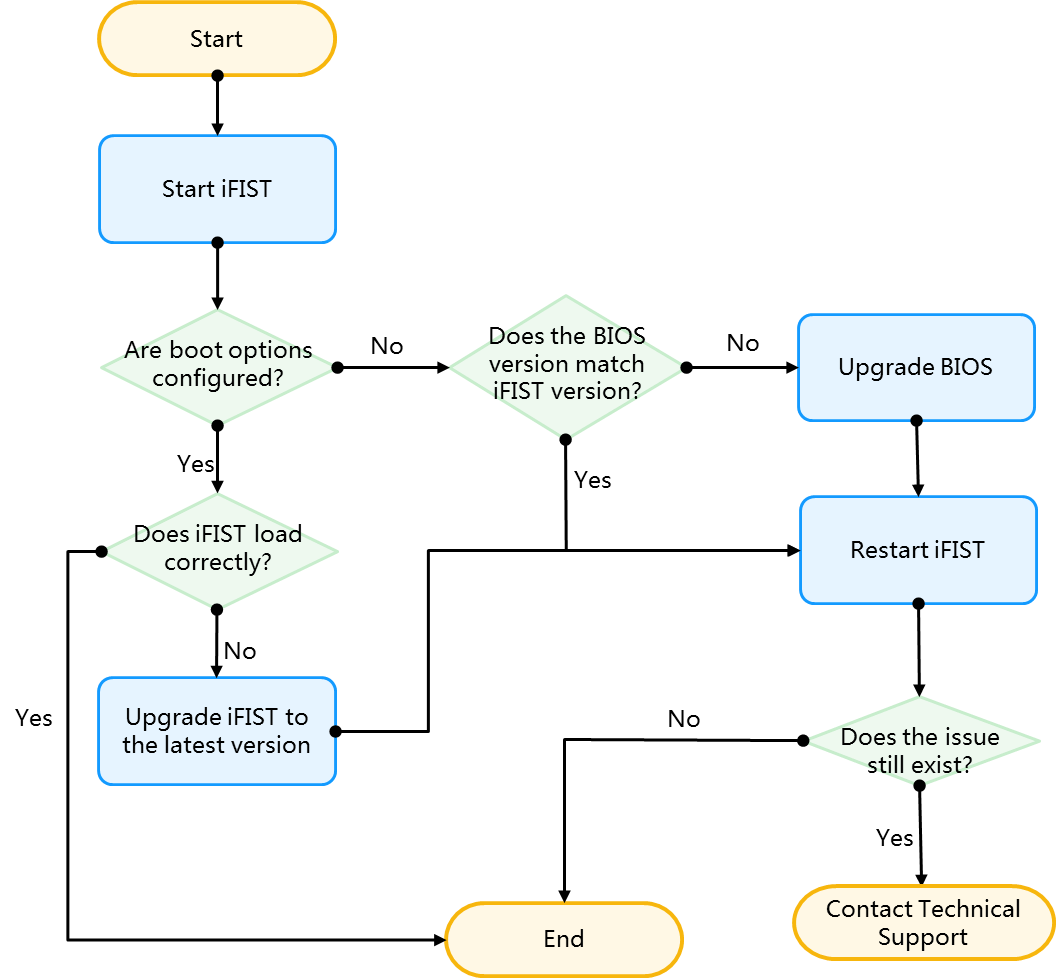
Storage controller issues flowchart
Figure 39 Storage controller issues flowchart
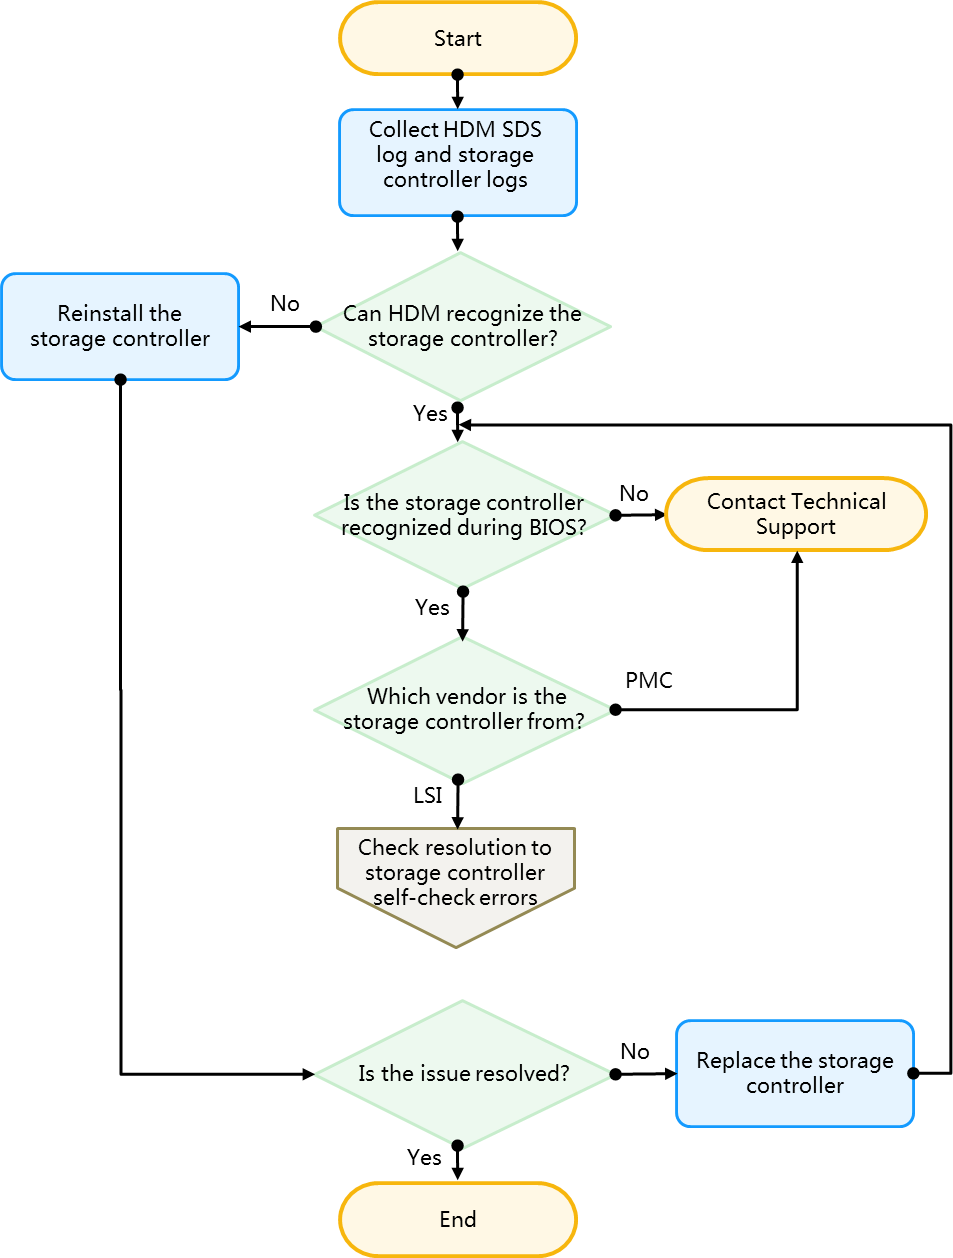
Figure 40 Storage controller self-check errors flowchart
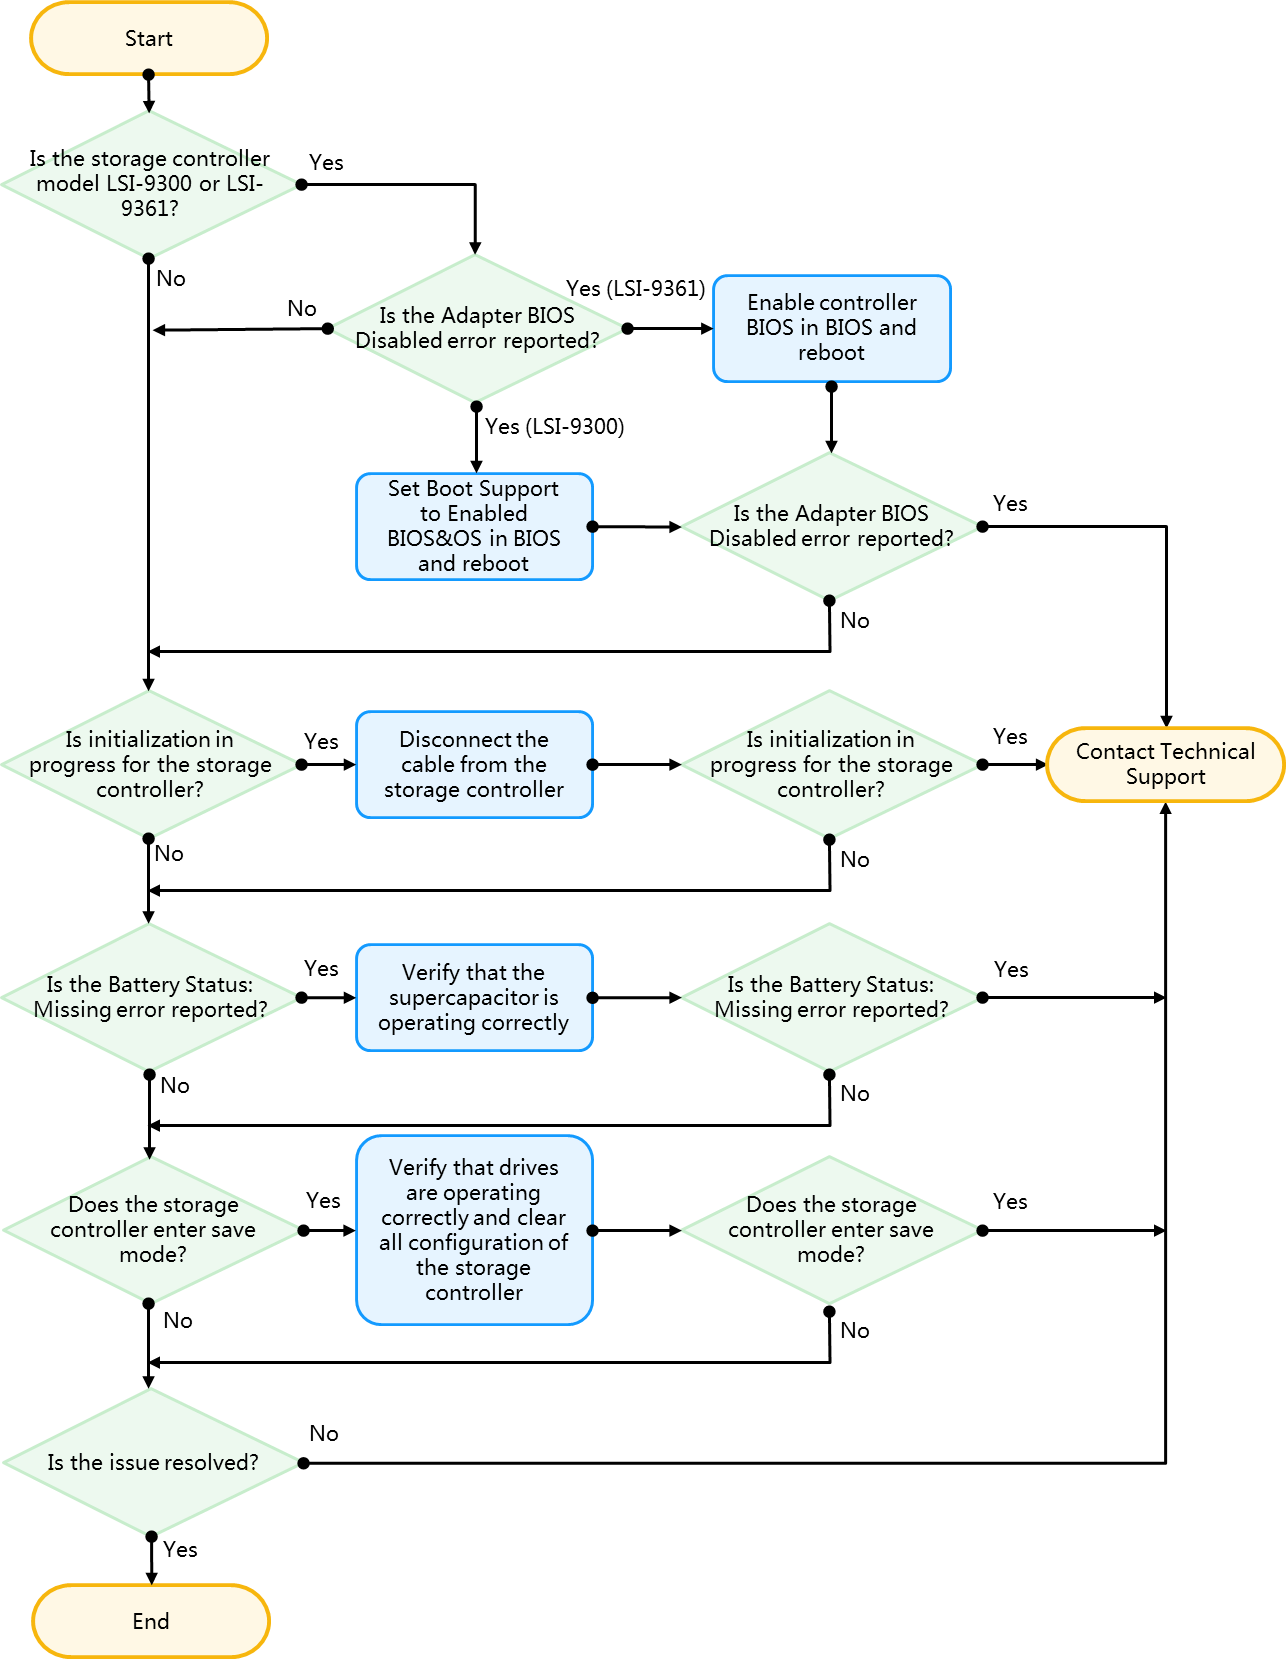
Storage controller supercapacitor issues flowchart
Figure 41 Storage controller supercapacitor issues flowchart
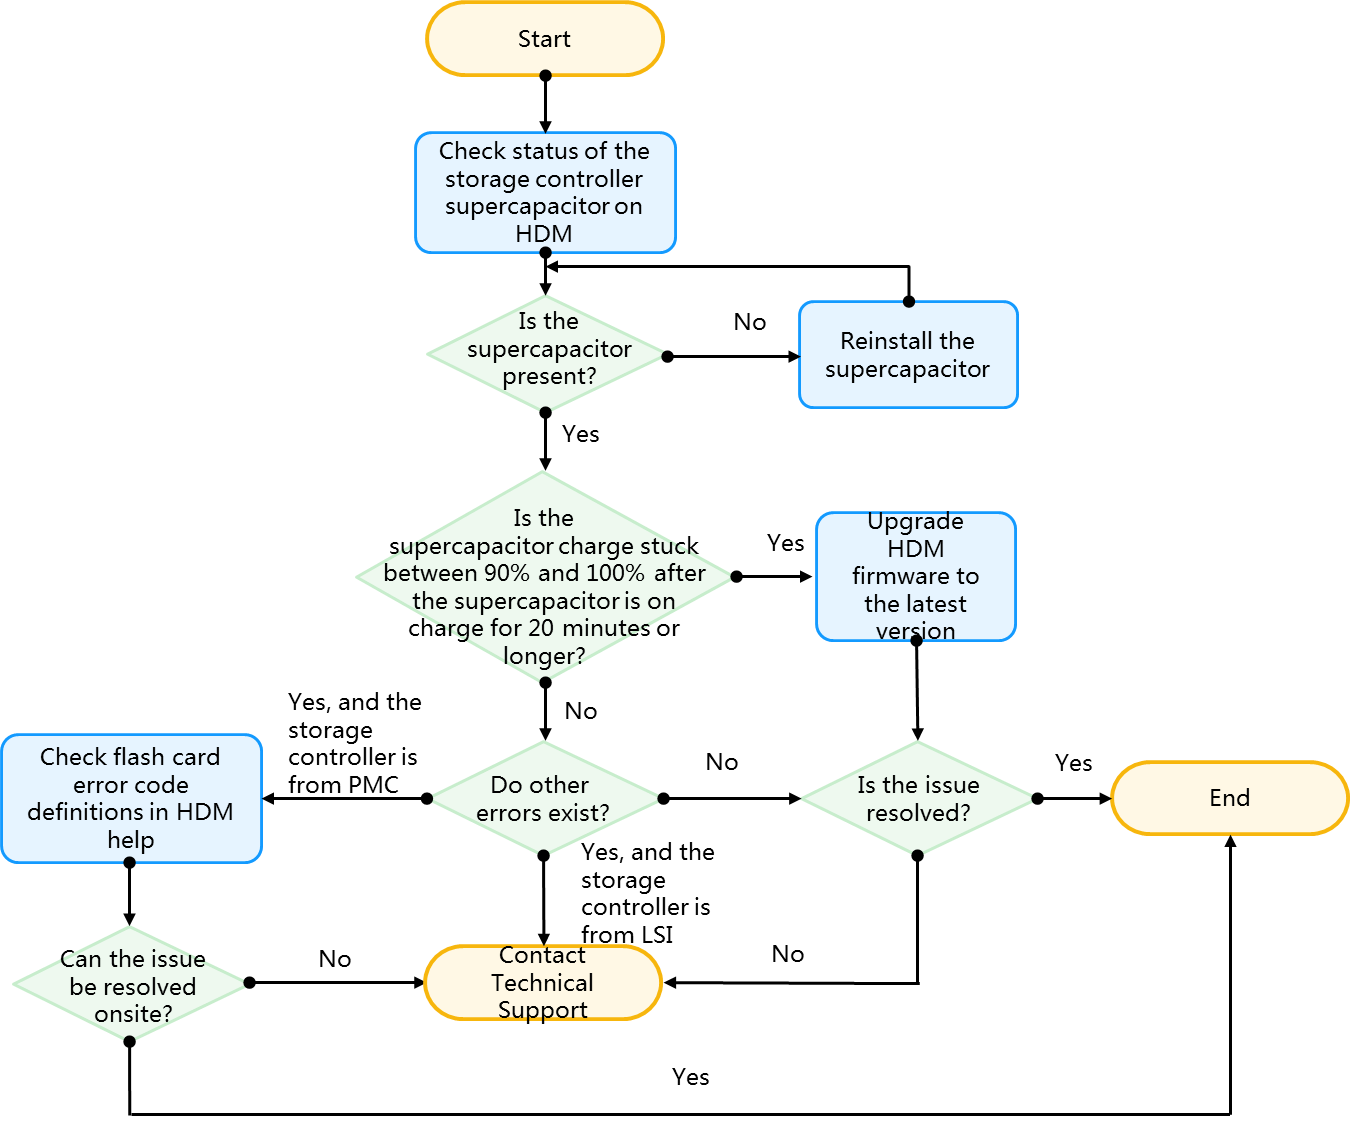
Physical drive issues flowchart
Symptom
· A drive is not available.
· Drive errors are recorded in event log on HDM.
Cause
· The firmware is outdated.
· The drive back plane or storage controller has loose connections.
· The drive is faulty or not properly seated.
Restrictions and guidelines
Before you troubleshoot physical drive issues, make sure the physical drives, drive back planes, storage controllers, and cables are compatible with the server. To obtain hardware compatibility information, use the server compatibility search tool provided on the H3C official website.
To obtain the latest firmware for a physical drive, go to the official website of the vendor.
To collect HDM SDS log, see "Collecting HDM SDS logs." To collect OS log, see "Collecting operating system logs." To collect drive log, contact Technical Support.
The following is the LED behaviors for physical drive faults.
Table 17 LED behaviors for physical drive faults
|
Fault |
Drive type |
Drive fault/UID LED (amber/blue) |
Drive present/active LED (green) |
|
Fault 1 |
SAS/SATA |
Flashing amber (0.5Hz) |
Solid/Flashing (4Hz) |
|
Fault 2 |
SAS/SATA/NVMe |
Solid amber |
Solid/Flashing (4Hz) |
|
Fault 3 |
SAS/SATA/NVMe |
Off |
Off |
Flowchart
Figure 42 Physical drive issues flowchart
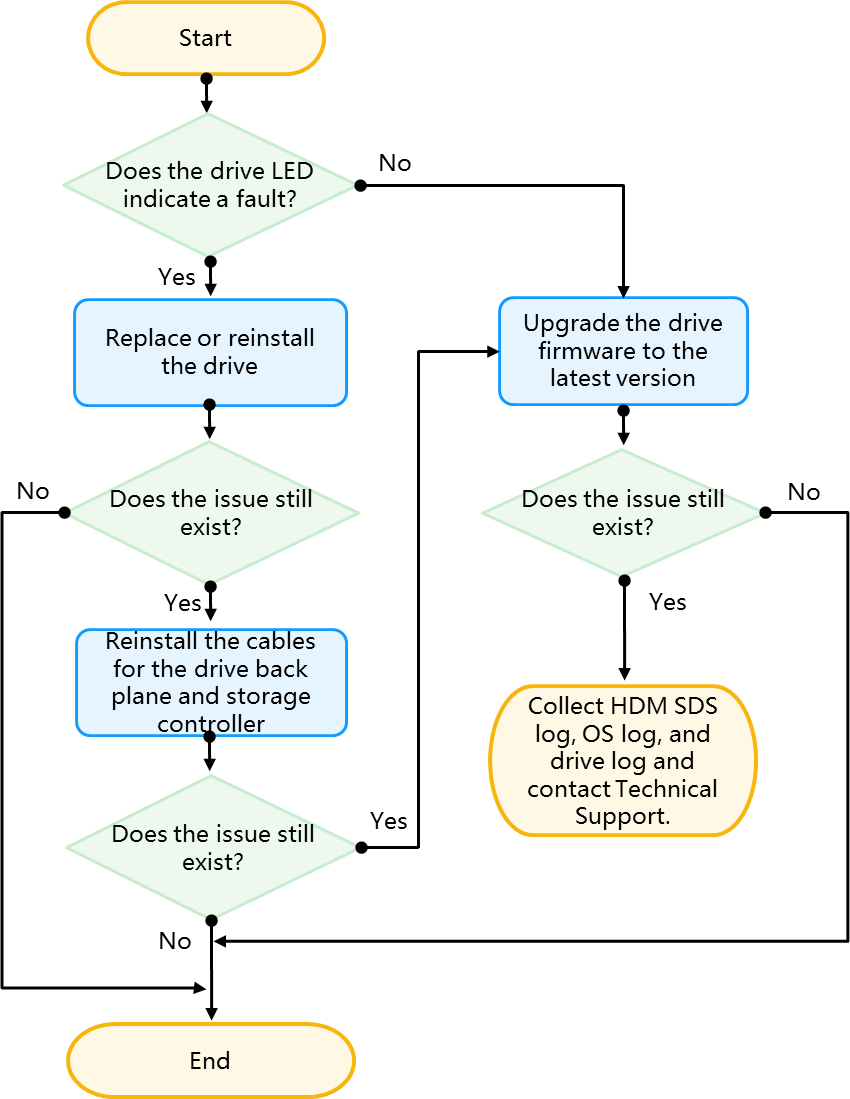
Logical drive issues flowchart
Figure 43 Logical drive issues flowchart
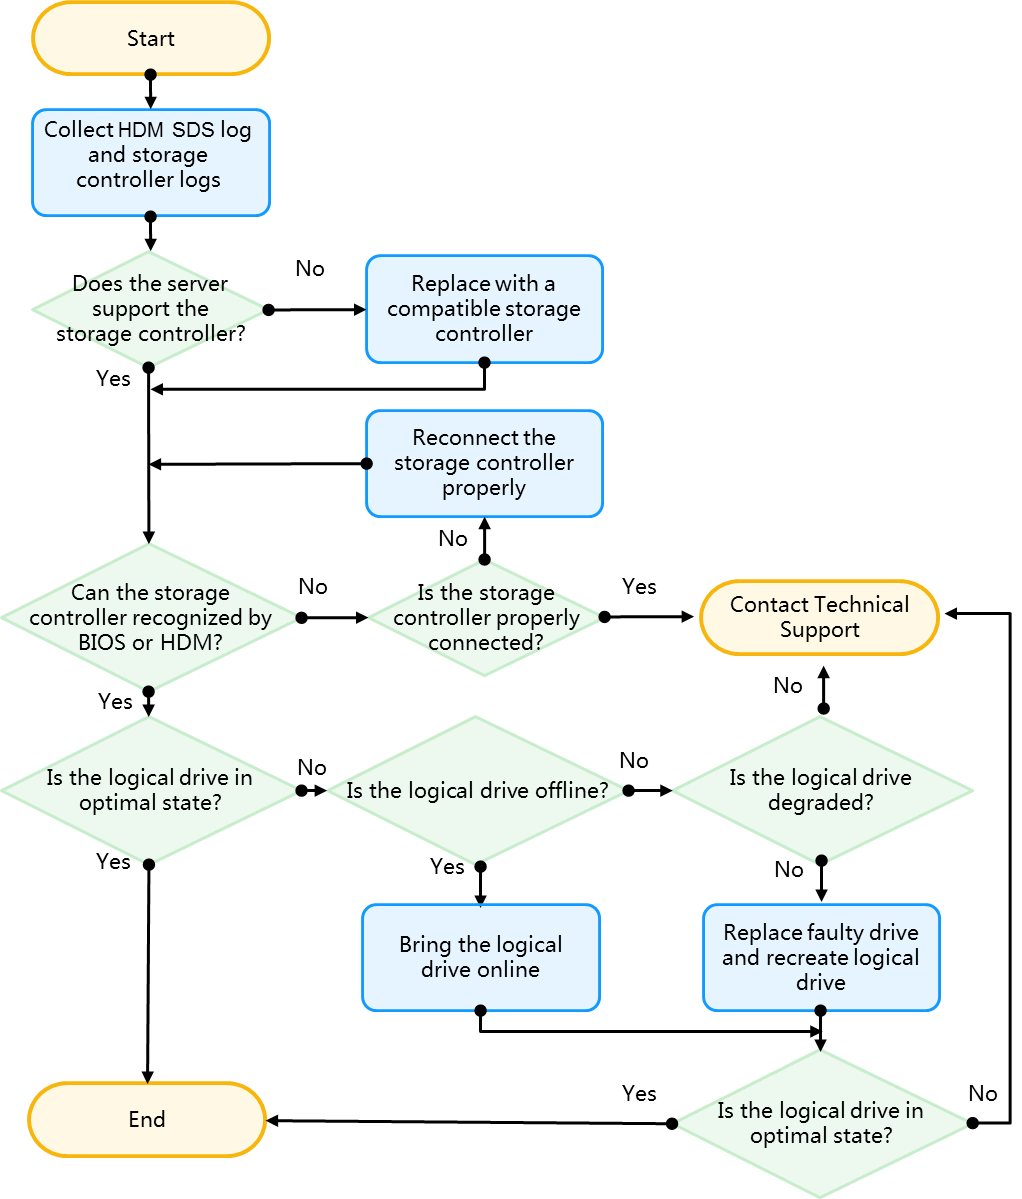
Network adapter issues flowchart
Figure 44 Network adapter issues flowchart 1
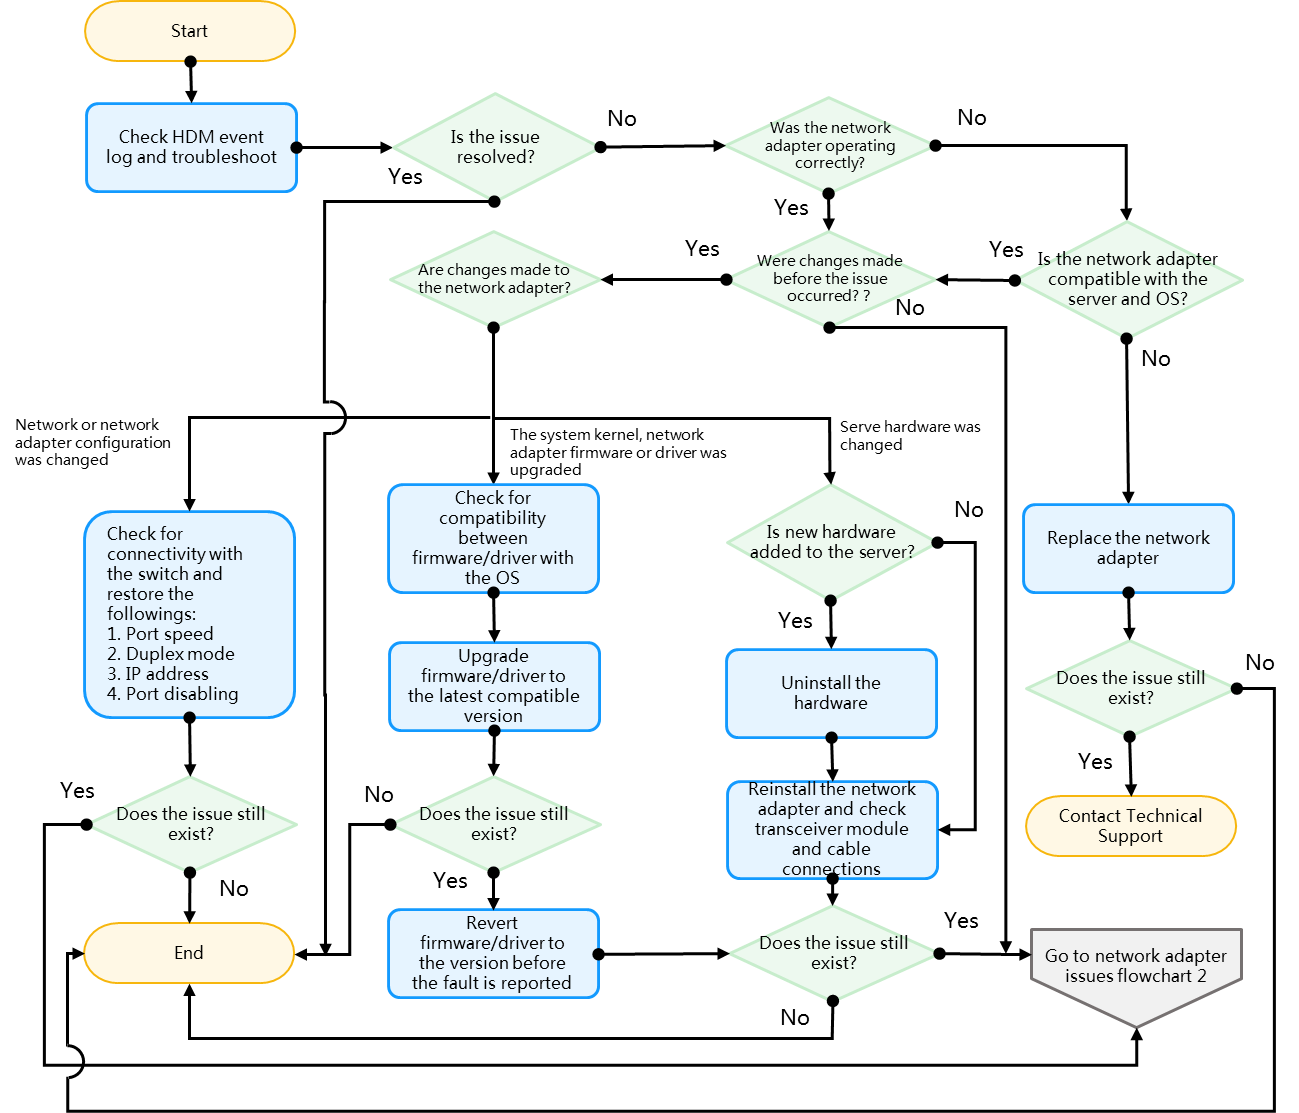
Figure 45 Network adapter issues flowchart 2
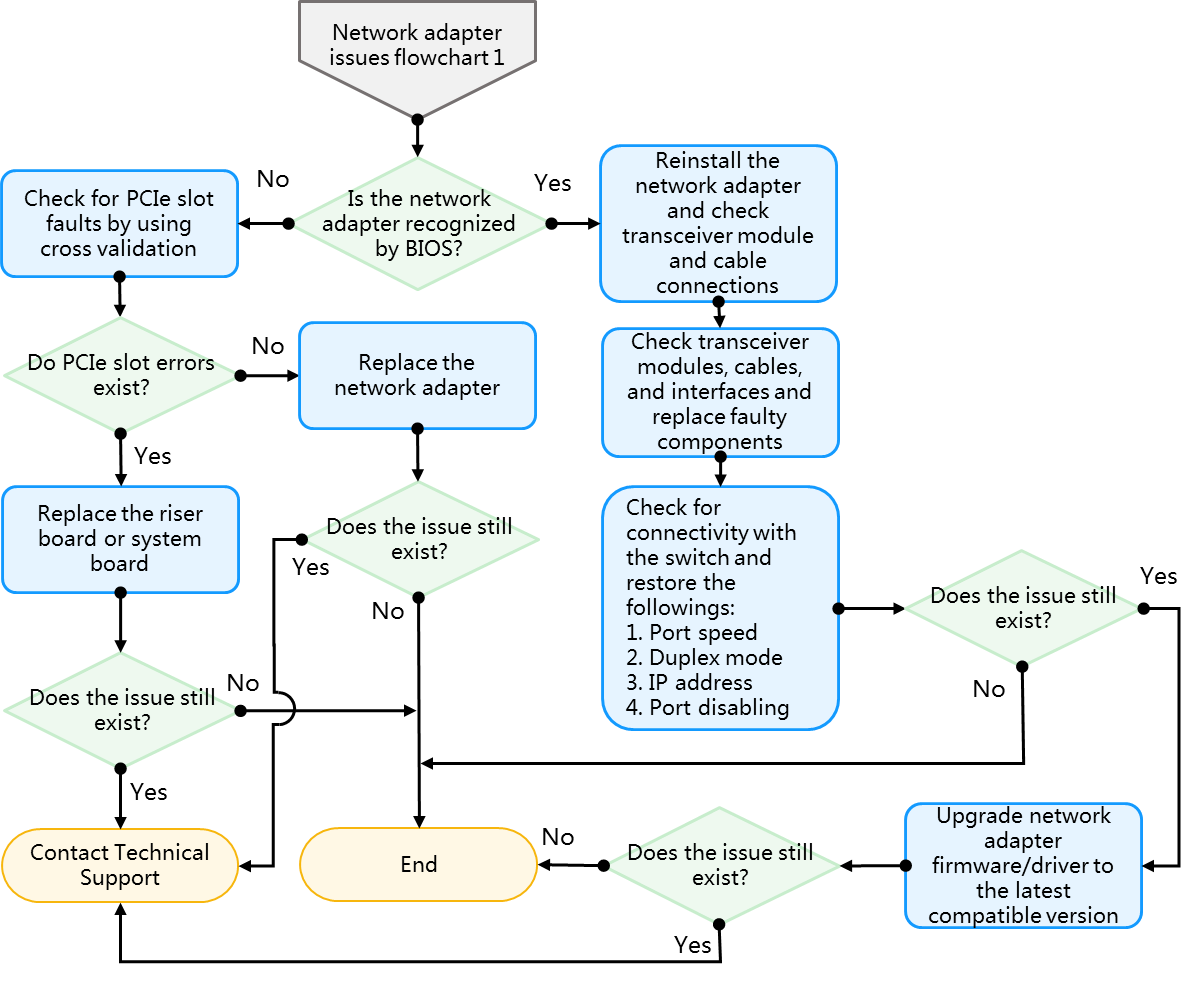
GPU issues flowchart
Figure 46 GPU issues flowchart
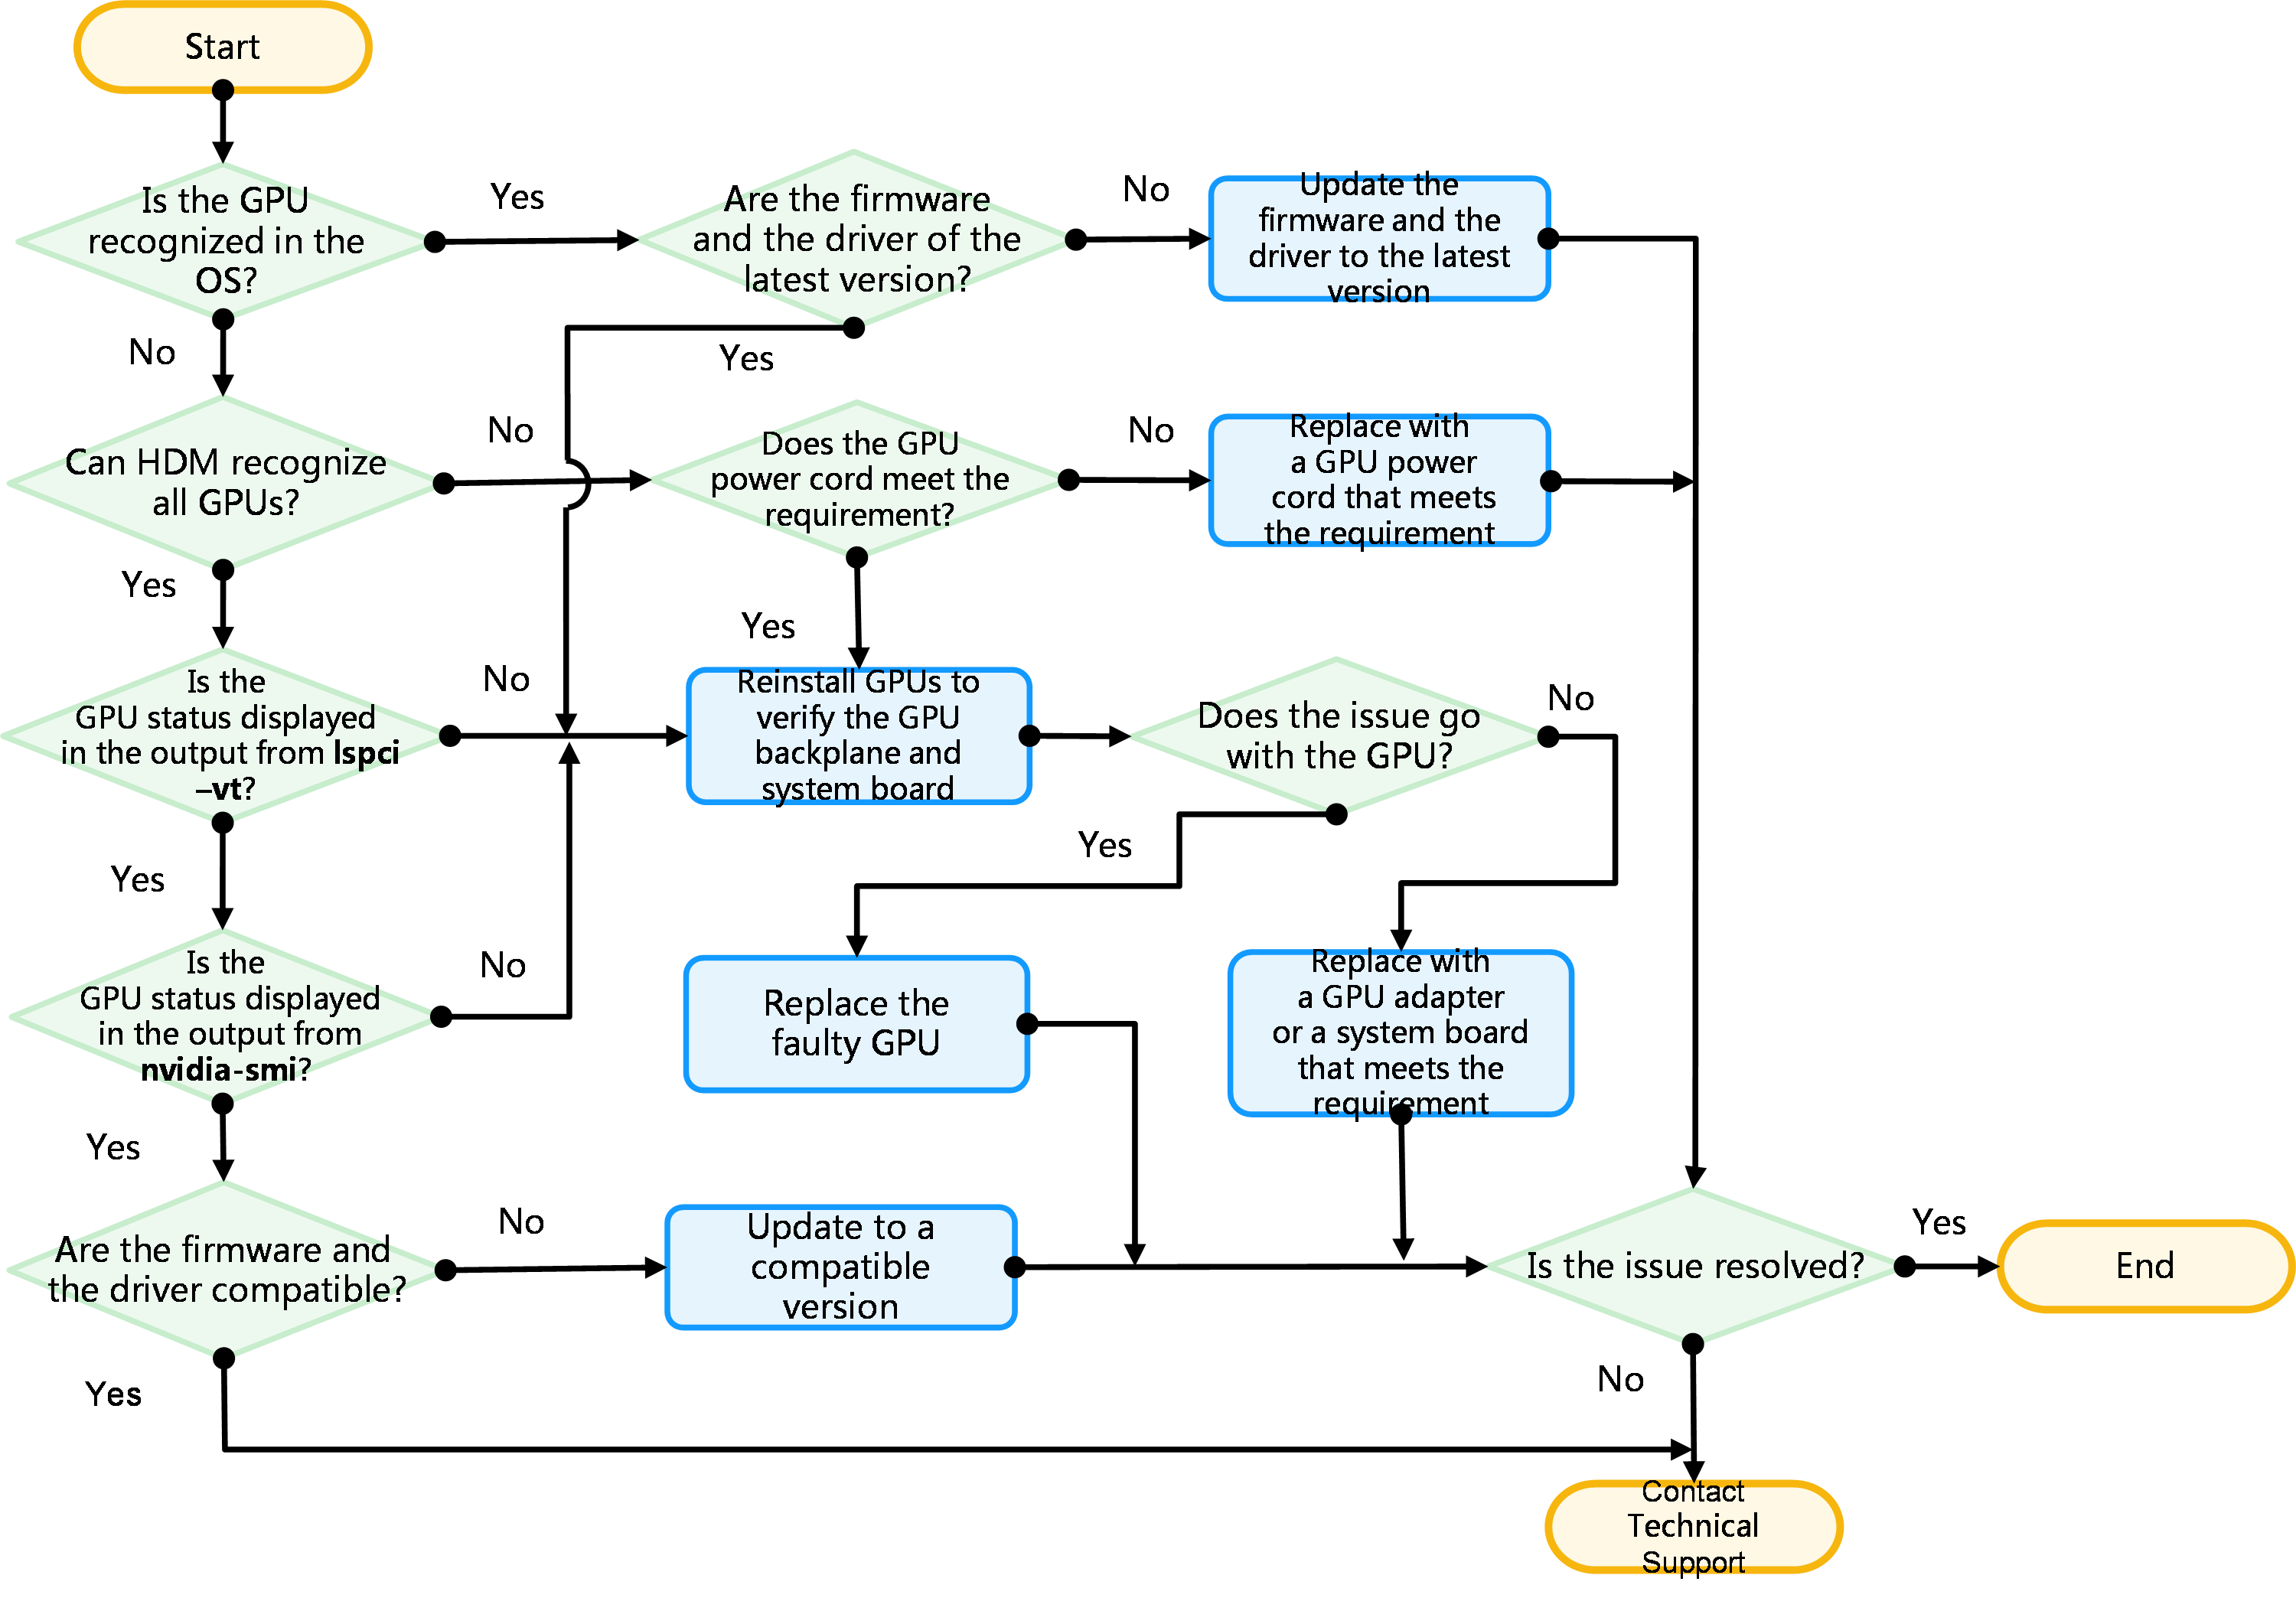
Troubleshooting hardware issues
General hardware issues
New component issues
Symptom
After you install a new component or use a new component to replace the old component, the server fails to start up or the installed component cannot operate normally.
Possible causes
· The server is not compatible with the component.
· The component is not installed in place.
· The firmware or driver version of the component is too low.
· The component is faulty.
Solution
To resolve the issue:
1. Use the OS compatibility query tool available from Query tool for server and component compatibility to verify that the server is compatible with the component.
2. Verify that the component is installed in place and the cables are connected correctly and securely.
3. Update the firmware and driver of the component to the latest version and verify that the system can identify the component.
4. Install the component to other servers that are operating normally to check whether the component is faulty.
5. If the server cannot start up, use the minimum hardware configuration in the server. After the server starts up normally, install the component in the server to check whether the component is faulty. If the server fails to start up, replace the component. If the server can starts up normally, the component is normal. For information about minimum hardware configuration, see "Breaking server down to the minimum hardware configuration."
6. If the issue persists, contact Technical Support.
Third-party component failure
Symptom
The server cannot identify the third-party component or the third-party component cannot operate normally.
|
|
NOTE: A third-party component is a component that is purchased from other companies than H3C or a component that is purchased from H3C but not compatible with the server. For compatibility between the server and component, use the query tool available from Query tool for server and component compatibility. |
Possible causes
The causes cannot be determined.
Solution
If the component is purchased from other companies than H3C, contact the component vendor.
Loose component or cable connection
Symptom
· A memory error occurs in the BIOS POST screen, as shown in Figure 47.
Figure 47 Memory error in the BIOS POST screen
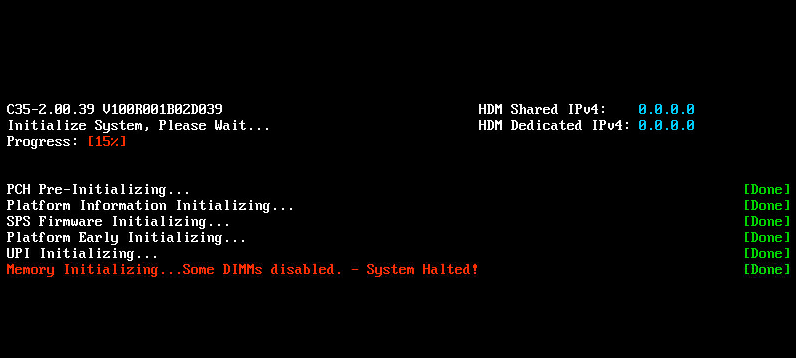
· An error occurs in the operating system boot screen, as shown in Figure 48.
Figure 48 Error in the operating system boot screen
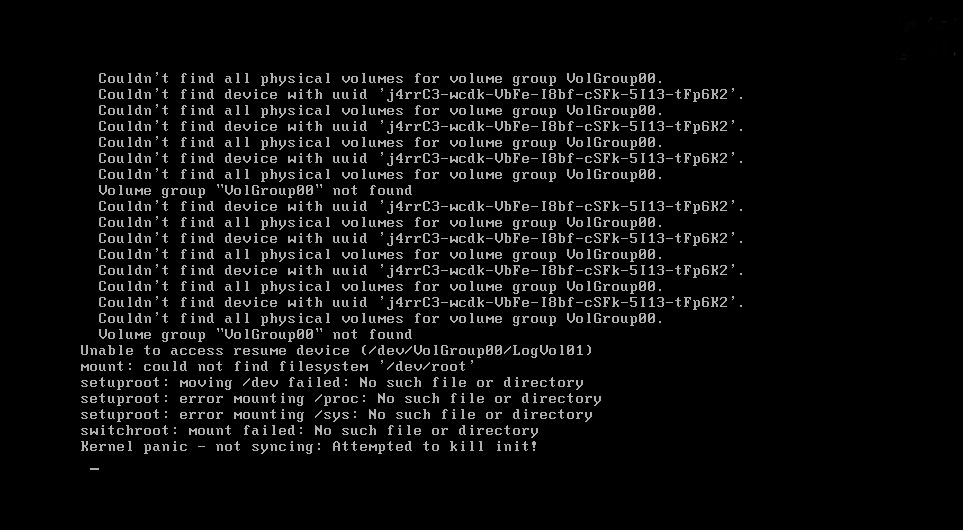
· The component information is not displayed in HDM.
· The component information is not displayed in the operating system.
¡ The Linux operating system identifies the NVMe drive, as shown in Figure 49.
¡ The NVMe drive is not identified in the Linux operating system, as shown in Figure 50.
Figure 49 Identified NVMe drive in the Linux operating system
![]()
Figure 50 Unidentified NVMe drive in the Linux operating system
![]()
Possible causes
· The component or cable connection is loose.
· The golden plating of the component is oxidized.
Solution
|
|
IMPORTANT: You can take the following procedures to resolve the issue caused by reasons listed in "Possible causes." If the issue persists, you need to check the BIOS version, component firmware, component driver, and other possible causes. For the latest version of BIOS, component firmware, and component driver, access the H3C official website. |
To resolve the issue:
1. According to the prompted errors, verify that the component and cable connection are intact and not damaged.
2. Verify that the golden plating of the component is not oxidized. If oxidative contamination exists on the golden plating, rub the golden plating with alcohol.
3. Remove and install the component to verify that the component is installed in place. Disconnect and connect the cables to verify that the cables are connected correctly and securely.
4. If the issue persists, contact Technical Support.
Server auto shutdown
Symptom
The server automatically shuts down during normal operation.
Possible causes
· The power source of the server is abnormal.
· The shutdown operation is executed on the server.
· The temperature of components in the server is too high.
· The ambient temperature outside the server is too high.
· The smart chassis ears of the server are abnormal.
· Hardware malfunction.
· Abnormal software.
Solution
To resolve the issue:
1. Check the event logs in HDM. If the log recording Power Supply input lost (AC/DC) is displayed and no other logs are displayed, examine whether the power supply of the server is normal.
2. If the log recording Power Button pressed is displayed in HDM, the server shutdown has triggered. You can check the causes of the server shutdown, as shown in Table 18.
|
Log |
Description |
|
Power Button pressed ---Physical button ---Button pressed |
The server is shut down by pressing the power switch. |
|
Power Button pressed ---Virtual button ---Power cycle command |
The server shuts down and then powers on again. |
|
Power Button pressed ---Virtual button ---Power off command |
The server shuts down forcibly. |
|
Power Button pressed ---Virtual button---Soft off command |
The server shuts down normally. |
|
Reset Button pressed ---Virtual button ---Reset command |
The server restarts. |
3. Check the event logs whether a log recording the component overtemperature exists. If the server shuts down because of the component overtemperature, take the actions described in H3C HDM System Log Messages Reference.
4. If no component overtemperature exists, check whether the temperature of the equipment room meets the requirements of the server operating temperature. For information about the server operating temperature, see the user guide for the device.
5. Check whether the smart chassis ears are damaged. If they are damaged, replace them.
6. Collect the operating system logs and analyze the logs.
¡ Check whether hardware error logs are displayed. If such log is displayed, troubleshoot the corresponding hardware.
¡ Check whether an alarm message about the operating system or service is displayed. If such message is displayed, contact the related vendor.
7. Check whether the server auto shutdown is caused by a batch shutdown operation. If yes, use the query tool available from Query tool for server and OS compatibility to check the compatibility between the operating system, update firmware and driver of storage controllers, network adapters, GPU modules, and FC HBAs to the latest version.
8. If the issue persists, contact Technical Support.
LED failures
LEDs off
Symptom
The following LEDs on the server are off and the server cannot be managed in HDM.
· Health LED.
· System power LED.
· UID LED.
· Ethernet port LED.
· Drive LEDs.
· Power supply LED.
· Fan LED.
Possible causes
· The power source of the server is abnormal.
· The power cord connection is loose.
· A power supply is not installed in place.
· A power supply is faulty.
· The system board of the server is faulty.
· The fan module is not installed in place.
Solution
To resolve the issue:
1. Verify that the power source is normal.
2. Verify that the fan module is installed in place.
3. Disconnect and connect the power cord to make sure the power cord is connected correctly and securely. For the R5500 G5 server, you must also examine if the cables connecting the system board to the PCIe switch module are connected correctly and securely.
4. Remove and install the power supply.
5. Use a power supply of the same model that can operate normally to replace the old power supply.
¡ If the issue is resolved, the old power supply is faulty. Replace the old power supply.
¡ If the issue persists, the system board is faulty. Contact Technical Support.
Flashing health LED
Symptom
The power supply LED is steady green but the health LED is flashing amber or flashing red. The logs about one or multiple components occur in HDM.
|
|
IMPORTANT: The description for the health LED is as follows: · Steady green—The system is operating correctly or a minor alarm is present. · Flashing green at 4 Hz—HDM is initializing. · Flashing amber at 1 Hz—A major alarm is present. · Flashing red at 1 Hz—A critical alarm is present. |
Possible causes
One or multiple components in the server are abnormal.
Solution
To resolve the issue:
1. Locate the faulty component and the failure reason according to the event logs. For more information, see H3C HDM System Log Messages Reference.
2. If the issue persists, collect HDM SDS logs and contact Technical Support.
Flashing health LED due to fan failures
Symptom
The health LED is flashing amber and the log about fan errors is displayed in HDM.
Possible causes
· The fan module connectors on the system board are abnormal.
· The fan module connectors are abnormal.
· The fan module is not installed in place.
· The fan module is faulty.
Solution
To resolve the issue:
1. Verify that the fan module connectors are intact and not damaged.
2. Remove and install the fan module to verify that the fan module is installed in place.
3. Use a fan module of the same model that can operate normally to replace the old fan module.
¡ If the issue is resolved, the old fan module is faulty. Replace the old fan module.
¡ If the issue persists, the fan module connectors on the system board are faulty. Contact Technical Support.
Flashing fan LED
Symptom
For some server models, for example, R5500 G5, fan modules come with LEDs. When the LED on a fan module flashes amber, it means that the module is faulty or a connection error is present on the module.
Possible causes
· The fan module connector is abnormal.
· The fan module is not installed in place.
· The fan module is faulty.
Solution
To resolve the issue:
1. Verify that the fan module connector is intact and not damaged.
2. Remove and install the fan module to make sure the fan module is installed in place.
3. Use a fan module of the same model that can operate normally to replace the old fan module.
¡ If the issue is resolved, the old fan module is faulty. Replace the old fan module.
¡ If the issue persists, the fan module connector on the system board is faulty. For R5500 G5 server, verify that the cables connecting the system board and the PCIe switch board are connected correctly and securely. If the issue persists, contact Technical Support.
Power supply failures
Table 19 Power supply LED
|
LED |
Status |
|
Power supply LED |
· Steady green—The power supply is operating correctly. · Flashing green (1 Hz)—Power is being input correctly but the system is not powered on. · Flashing green (0.33 Hz)—The power supply is in standby state and does not output power. · Flashing green (2 Hz)—The power supply is updating its firmware. · Steady amber—Either of the following conditions exists: ¡ The power supply is faulty. ¡ The power supply does not have power input, but another power supply has correct power input. · Flashing amber (1 Hz)—An alarm has occurred on the power supply. · Off—No power supplies have power input, which can be caused by an incorrect power cord connection or power source shutdown. |
Power supply LED off
Symptom
The power supply LED is off.
Possible causes
· The power source is abnormal, such as external circuit failure, power cord damage, or voltage exceeding the limit.
· The power cord is not installed in place.
· The power supply is faulty.
Solution
To resolve the issue:
1. Verify that the power source is normal.
2. Disconnect and connect the power cord to make sure it is connected correctly and securely. If the power cord is faulty, replace it.
3. Remove and install the power supply.
4. If the issue persists, contact Technical Support to check the system board.
Steady amber or flashing amber of power supply LED
Symptom
The power supply LED is steady amber or flashing amber.
Possible causes
· The power source is abnormal, such as external circuit failure, power cord damage, or voltage exceeding the limit.
· The power cord is not installed in place.
· The temperature of the power supply is too high.
· The input power of the power supply exceeds the upper limit.
· The power supply is faulty.
· The system board is faulty.
Solution
To resolve the issue:
1. Verify that the power source is normal.
2. Disconnect and connect the power cord to make sure it is connected correctly and securely. If the power cord is faulty, replace it.
3. Log in to HDM to check whether the temperature of the power supply sensor exceeds the minor alarm threshold. If yes, take the following actions to lower down the temperature and then check the operation of the power supply.
a. In HDM, adjust the fan speed mode to improve the server heat dissipation performance.
b. Examine whether abnormal noise of the fan in the power supply exists. If yes, replace the faulty power supply or clear the object blocks the fan and then check the operation of the power supply.
4. In HDM, check whether the current total power of the power supply exceeds the power alarm threshold. If yes, reduce the server power consumption or use a power supply with larger power to replace the current power supply.
5. If the issue persists, contact Technical Support to check the system board.
Server boot failure with flashing green power supply LED
Symptom
The power supply LED is flashing green at 1 Hz and the health LED is normal, but the server cannot be started up.
Possible causes
· The power supply is faulty.
· The system board is faulty.
Solution
To resolve the issue:
1. Shut down the server and then power on the server again to check whether the server can start up normally.
2. Replace the power supply and restart the server.
3. If the issue persists, contact Technical Support to check the system board.
Loud noise of fan in the power supply
Symptom
After the server is powered on for a period of time, the fan in the power supply operates in fast speed
Possible causes
· The power supply is faulty.
· The power consumption of the server is too high.
· The system board is faulty.
Solution
To resolve the issue:
1. Verify that the operating temperature of the power supply meets the requirements described in the user guide for the server.
2. Shut down the server, reinstall the power supply, and check whether the fan in the power supply operates in normal speed.
3. Replace the power supply and restart the server.
4. If the issue persists, contact Technical Support.
Power input and output errors
Symptom
The power supply is present but the power supply LED is off. In HDM, you can see a log recording the power input and output errors.
Possible causes
· The power source is abnormal, such as external circuit failure, power cord damage, or voltage exceeding the limit.
· The power cord is not installed in place.
· The power supply is faulty.
· The power supply slot is faulty.
Solution
To resolve the issue:
1. Verify that the power source is normal.
2. Disconnect and connect the power cord to make sure it is connected correctly and securely. If the power cord is faulty, replace it.
3. Remove and install the power supply.
4. Log in to HDM to view the logs. If the following alarm message is displayed, replace the corresponding power supply:
¡ Error message Presence detected Power Supply input lost (AC/DC) is displayed in the HDM power supply sensor page.
¡ The following logs occur in HDM:
- Power supply input lost (AC/DC)
- Power supply input out-of-range - but present
- Power supply predictive Failure
5. If the issue persists, contact Technical Support to check the system board.
Power output error
Symptom
· In HDM, the log recording that the power input is normal but the power output is faulty is displayed.
· In the HDM power supply sensor page, the message indicating the power supply failure with a severity of major is displayed.
Possible causes
· The temperature of the power supply is too high.
· The power supply is faulty.
· The input power of the power supply exceeds the upper limit.
Solution
To resolve the issue:
1. Log in to HDM to check whether the temperature of the power supply sensor exceeds the minor alarm threshold. If yes, take the following actions to lower down the temperature and then check the operation of the power supply.
a. In HDM, adjust the fan speed mode to improve the server heat dissipation performance.
b. Examine whether abnormal noise of the fan in the power supply exists. If yes, replace the faulty power supply or clear the object blocks the fan and then check the operation of the power supply.
2. In HDM, check whether the current total power of the power supply exceeds the power alarm threshold. If yes, reduce the server power consumption or use a power supply with larger power to replace the current power supply.
3. Replace the power supply.
4. If the issue persists, contact Technical Support.
Occurrence of the lost power redundancy log
Symptom
In the power supply sensor page, the PSU redundancy state is major and message Power Redundancy Lost is displayed.
Possible causes
· The power source is abnormal, such as external circuit failure or power cord damage.
· The power supply is not installed correctly.
· The power supply is faulty.
· The HDM firmware version is too low or the HDM firmware configuration is abnormal.
· The power supply slot is faulty.
Solution
To resolve the issue:
1. Examine the power supply LED. If the power supply LED is steady amber or flashing amber, verify that the power source is normal, and then disconnect and connect the power cord.
2. Verify that the power supply is installed correctly. If the power supply is not installed correctly, reinstall the power supply.
3. Check the power supply full configuration. If the power supply full configuration is not used, update HDM firmware to the latest version.
4. Replace the power supply.
5. If the issue persists, contact Technical Support to check the system board.
Occurrence of the mismatch vendor log
Symptom
· In HDM, the two power supplies have normal input and normal output but the power supply models are inconsistent.
· In the HDM power supply sensor page, the power supply state is minor and message Presence detected Configuration error is displayed. The two power supplies operate normally and the power supply LEDs are steady green.
· The following event logs are displayed in HDM:
¡ Configuration error---Vendor mismatch
¡ Configuration error---Power supply rating mismatch
Possible causes
The power supply models are inconsistent.
Solution
To resolve the issue:
1. Check whether the power supply models are consistent. If they are inconsistent, replace one power supply to make sure the present power supplies are of the same model and then refresh the HDM Web interface.
2. If the issue persists, contact Technical Support.
Failures at the POST stage
No signal
Symptom
The VGA monitor screen is black and no signal is displayed on the KVM.
Figure 51 No signal on the KVM

Possible causes
· The server hardware is faulty.
· The BIOS firmware is damaged.
Solution
To resolve this issue:
1. Log in to HDM to check the event logs whether a log recording the hardware error exists. If hardware error occurs, troubleshoot the hardware failure. For more information, see H3C HDM System Log Messages Reference.
2. Disconnect the power supply from the server to power off the server. Remove the button battery from the system board, wait for three minutes to clear CMOS and then reinstall the button battery on the system board. Power on the server to check whether the issue is resolved.
After CMOS is cleared, BIOS restores to the default configuration.
3. Update the BIOS and HDM versions.
4. Perform a minimal hardware test. If the server can be powered on normally, connect external components in sequence to find the faulty component.
For information about minimal server configuration, see "Breaking server down to the minimum hardware configuration."
5. If the issue persists, contact Technical Support.
System stuck at Early POST stage (not applicable to Hygon processors)
Symptom
As shown in Figure 52, the system gets stuck at the Early POST stage. The system displays no information or repeatedly reboots, and you cannot enter the startup or BIOS setup interface.
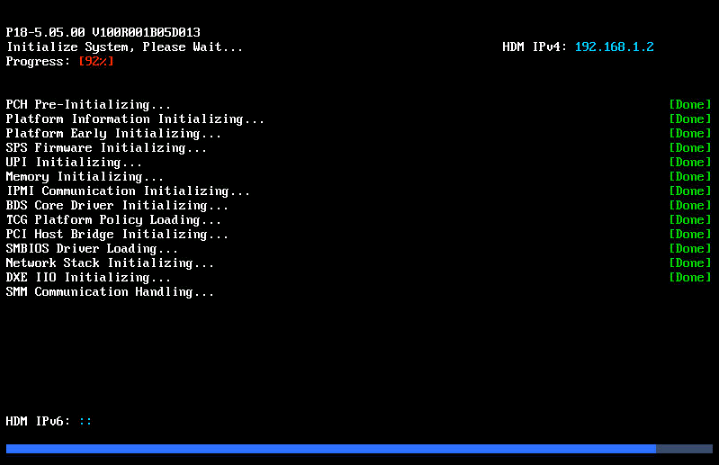
Possible causes
Locate the issue based on the startup stage:
· If the issue occurs in the UPI Initializing stage in BIOS, a CPU might have been incorrectly installed on the system board. As a result, the link signal is unstable between multiple processors.
· If the issue occurs in the Memory Initializing stage in BIOS, the memory module might have been incorrectly installed.
· If the issue occurs in the PCI Device Enumerating stage in BIOS, required memory or interrupt resources might not have been assigned to a specific PCIe card.
Solution
To resolve the issue:
1. After the issue occurs, record the issue progress information.
2. Log in to HDM, and check event logs for issue-associated information. If abnormal event logs or sensor information exist, troubleshoot the device issue according to the log information.
3. Identify the stage of the issue according to the last line printed on the Early POST interface.
¡ If the system gets stuck at the SPS Firmware Initializing stage or an earlier stage, perform the following operations:
- Remove the power supply. After removing the CMOS battery, power on to verify that the system can start up correctly.
- If the system cannot start up correctly, forcibly overwrite the configuration and upgrade the BIOS, and then try again.
¡ If the system gets stuck at the UPI Initializing stage, perform the following operations:
- Remove CPU2, CPU3, and CPU4 (if they exist) to verify that the system can start up correctly. If the system fails to start up when only CPU1 is present, replace CPU1 and then start up the system again to make sure the CPU is operating correctly.
- When removing CPUs, make sure the CPU slots are clean and the pins are not damaged.
- Replace the system board to check whether the issue can be resolved.
¡ If the system gets stuck at the Memory Initializing stage, you can see the location of the faulty memory and fault reason on the event logs page of HDM. Troubleshoot memory issues according to the associated recommendations. If the issue persists, contact Technical Support.
¡ If the system gets stuck at the PCIe Initializing stage, remove the PCIe device or NVMe drive to locate the fault on the PCIe device.
4. If the issue persists or the system repeatedly reboots or gets stuck at other stages, contact Technical Support.
System stuck at POST stage
Symptom
After power-on, the system gets stuck on the BIOS POST interface, and you cannot enter the startup or BIOS setup interface.
Possible causes
· Initialization failure of the CPU, memory, PCIe card, hard drive, or USB device.
· BIOS configuration.
· BIOS version update in unstable state.
Solution
To resolve the issue:
1. Log in to HDM to check the sensor for device failure messages. If a failure message is prompted, troubleshoot the issue according to the associated recommendations.
2. If no fault is reported by the sensor, disconnect all power cables of the server to shut down the AC power. Remove the battery from the system board, and the wait for three minutes to clear the CMOS. After that, install the battery back, and power on the server. If the issue persists, proceed to the next step.
3. Upgrade BIOS and BMC versions. If the issue persists, proceed to the next step.
4. If a USB device is installed, remove the USB device from the server.
5. If SATA/SAS drives are installed, remove the drives, and then reboot the server. Locate the faulty drive and troubleshoot the fault.
6. Perform a minimal hardware test. For more information, see "Breaking server down to the minimum hardware configuration." If the server can be powered on correctly, connect external components in sequence to locate the faulty component.
7. If the issue persists, contact Technical Support.
Information displayed in red at POST stage
Symptom
The screen displays information in red at the POST stage, as shown in Figure 53.
Figure 53 Abnormal display of information in red
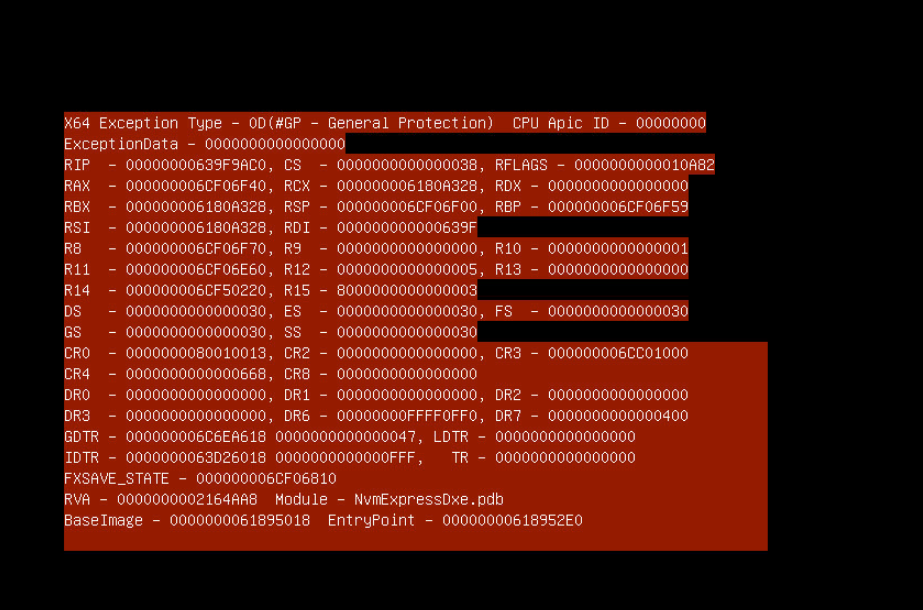
Possible causes
· Software failure, for example, call failure during execution stage of the PCIe Option ROM.
· Hardware device connection fault, for example, NVMe hard drive connection fault that causes the call and execution failure of the NVMe UEFI drive at the POST stage.
Solution
To resolve the issue:
1. Verify that NVMe or other PCIe devices have been firmly installed in the system.
2. If a storage controller is installed, remove the storage controller, and then reboot the server.
3. If the issue persists, contact Technical Support.
Storage controller stuck during POST
Symptom
The storage controller gets stuck at the POST stage. On the POST code page in HDM, as shown in Figure 54, the code is displayed as 92.

Possible causes
A typically reason is because the storage controller gets stuck during execution of the Option ROM.
Solution
To resolve the issue:
1. If you have upgraded the storage controller firmware before the issue occurs, verify that the storage controller version matches the BIOS version. If you cannot verify that, contact Technical Support. If a hard drive expander module is installed, verify that the drive expander module matches the storage controller firmware. If the issue persists, proceed to the next step.
4. Verify that the logical drive is in normal status. If the logical drive is not in normal status, check for RAID member drive faults, and replace faulty drives. If no RAID member drive faults exist, verify that the logical drive is in Offline state. Bring the drive online, and then reboot the server.
5. Replace the storage controller.
6. If the issue persists, contact Technical Support.
PXE startup issues
PXE startup failure
Symptom
As shown in Figure 55, PXE startup failed, and a message is displayed that no DHCP service exists or the service is abnormal.
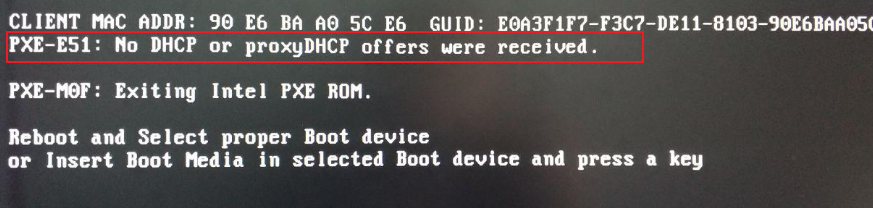
Possible causes
NIC failure or service PXE environment anomaly.
Solution
To resolve the issue:
1. Enter the Driver Health page of the BIOS setup interface to verify that the NIC drive is in healthy status.
2. Check the DHCP server settings in the PXE environment, for example, whether the DHCP service is enabled and whether the IP address is on the same network as the PXE server. If the settings are incorrect, edit the DHCP server settings and the restart PXE. If the settings are correct, proceed to the next step.
4. If the issue persists, contact Technical Support.
Screen error or error information during PXE startup and failure to enter PXE environment
Symptom
As shown in Figure 56, a screen display error occurs (black screen) or error information is displayed during PXE startup, and you cannot enter the PXE environment.
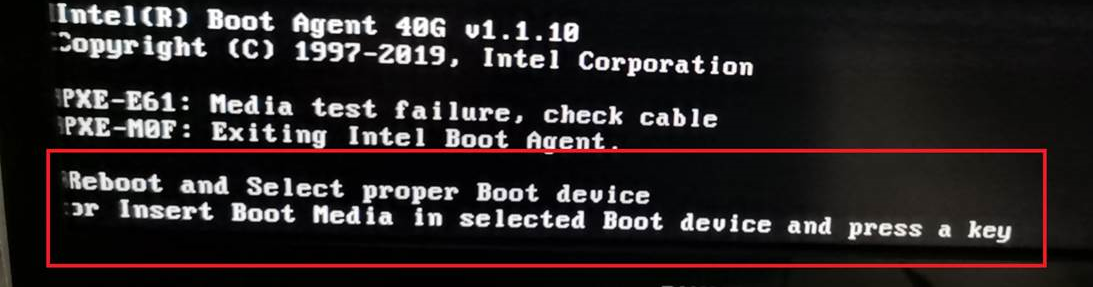
Possible causes
· The NIC does not support the PXE Boot function.
· PXE is disabled on the BIOS setup interface or for network interfaces.
· The Boot Protocol of the network interface is not set to PXE. The server cannot boot from PXE.
· In Legacy mode, certain NICs are unavailable because of unsupported address space mappings of 4 GB or above. You need to set the Above 4GB Decoding option to Disabled in Legacy mode.
· The PXE device or PXE device link is in abnormal state, causing PXE access failure.
Solution
To resolve the issue:
1. View the NIC datasheet on the official website to verify that the NIC supports PXE Boot. If not, replace a NIC that supports PXE Boot.
2. Enter the BIOS Setup interface to verify that PXE-associated functions are enabled.
a. On the Advanced tab, as shown in Figure 57, access the Network Stack Configuration and Network PXE Control pages to verify that PXE is enabled.
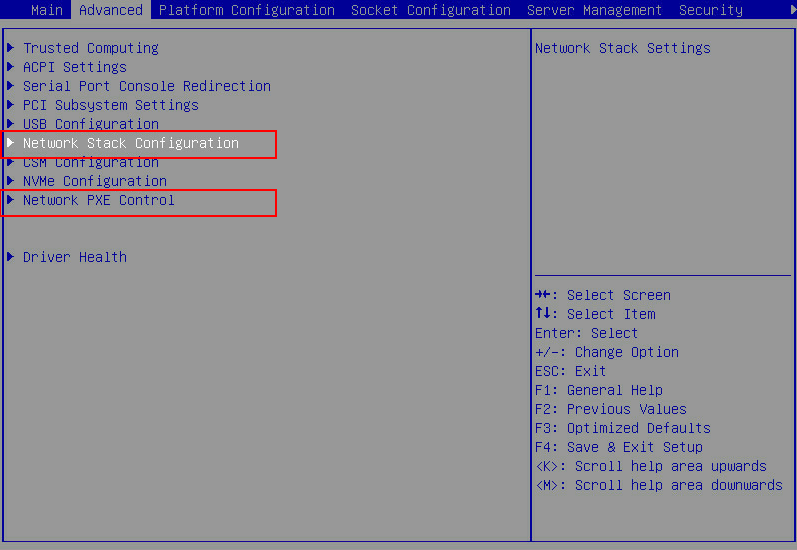
a. On the Network Stack Configuration page, verify that the IPv4 PXE Support and IPv6 PXE Support (if IPv6 is required) options are enabled, as shown in Figure 58.
Figure 58 Network Stack Configuration page
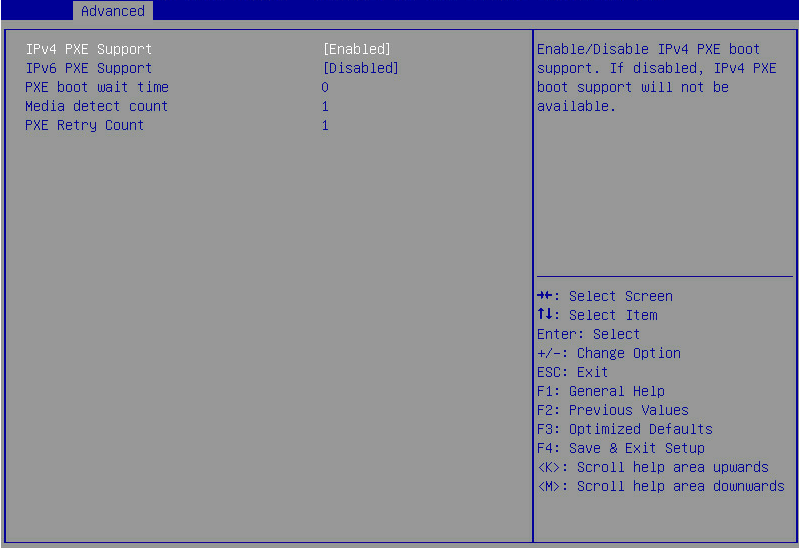
a. On the Network PXE Control page, verify that PXE is enabled for the network interfaces, as shown in Figure 59. If not, set the options to Enabled.
Figure 59 Network PXE Control page
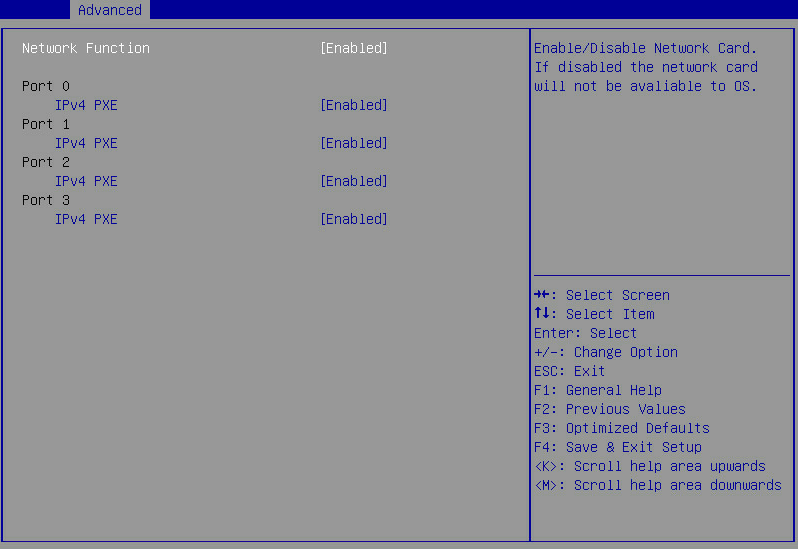
3. If BIOS settings have been edited, press F4 to save the modification and reboot the server to make the settings take effect.
4. During server startup and the POST process of the NIC, press Ctrl+S to enter the NIC parameter settings page and make sure that the Boot Protocol setting is PXE.
a. Enter the Option ROM configuration page of the NIC, as shown in Figure 60.
Figure 60 Option ROM configuration page of the NIC
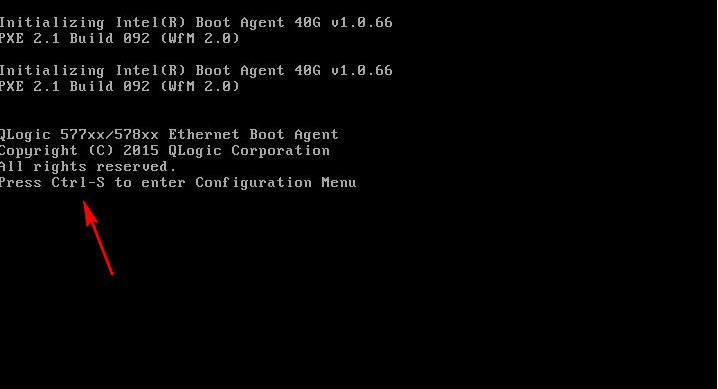
a. Select a network interface by MAC address, as shown in Figure 61.
Figure 61 Selecting a network interface
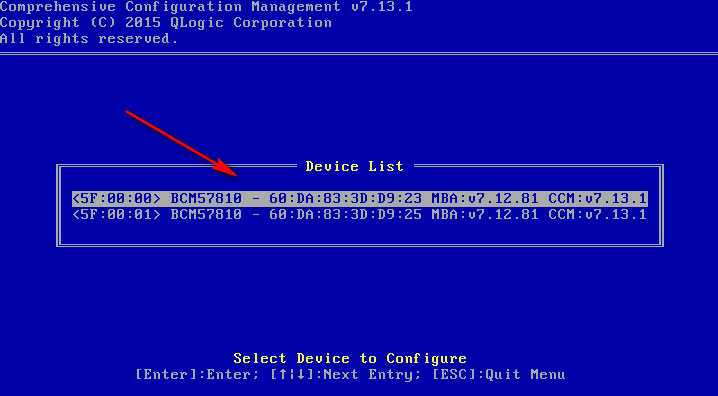
a. Select MBA Configuration, as shown in Figure 62.
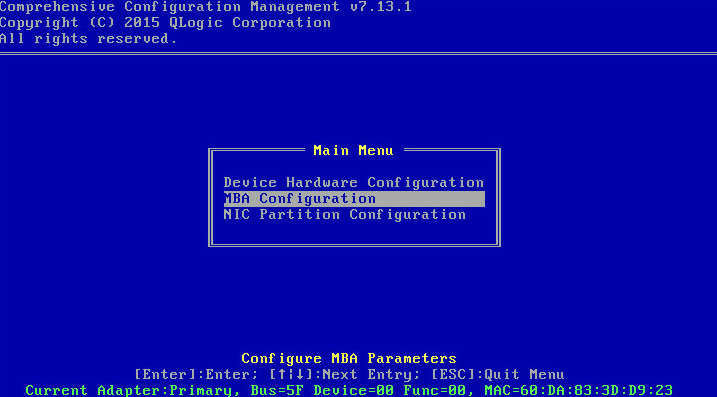
a. Set the Boot Protocol to PXE for the network interface, as shown in Figure 63.
Figure 63 Setting the Boot Protocol
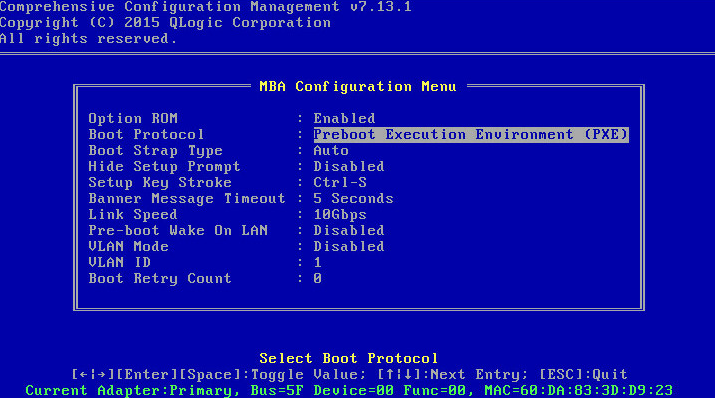
5. In Legacy mode, on the Advanced tab of the BIOS setup interface, select PCI Subsystem Settings, as shown in Figure 64.
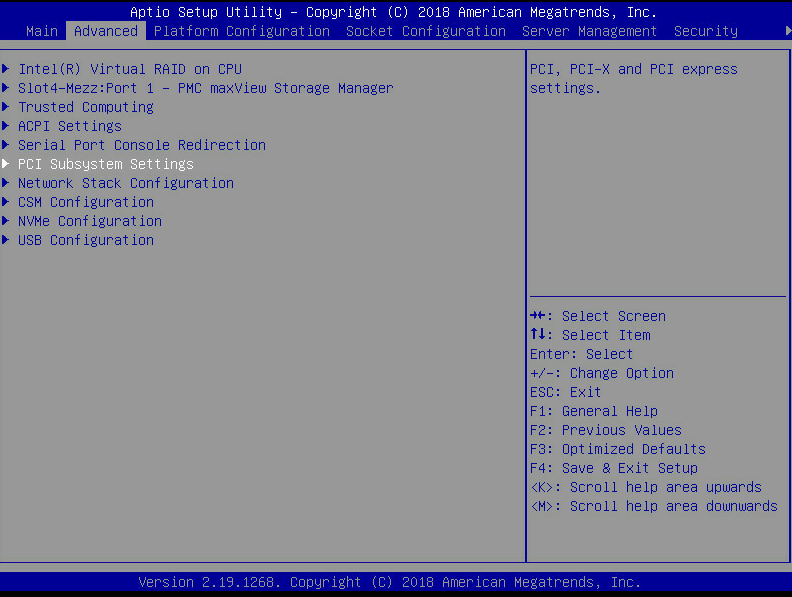
6. Set Above 4GB Decoding to Disabled, as shown in Figure 65.
Figure 65 PCI Subsystem Settings page
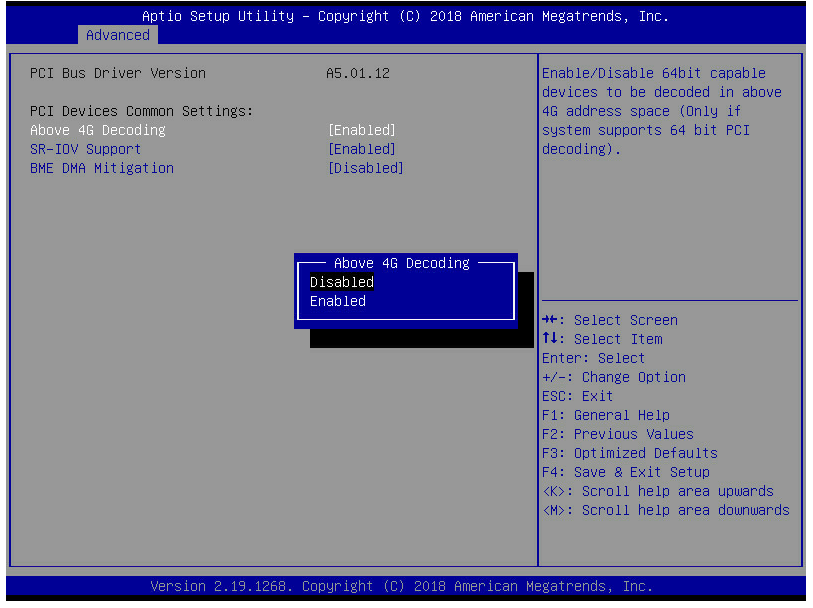
7. If the issue persists, contact Technical Support.
System installation issues in PXE environment
Symptom
In the PXE environment, the system cannot be installed, or errors are reported during installation.
Figure 66 Reported errors during installation
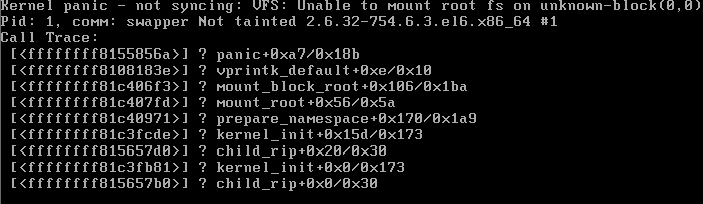
Solution
To resolve the issue:
1. Verify that the network environment is in normal. Network interruption might result in system image file upload failure.
2. Check whether the source image is damaged by mounting the source image of the PXE server locally. A damaged source image will cause system installation failure.
3. If the installation is interrupted at the OS partition stage, residual RAID information exists on the hard drive. Initialize the hard drive through the storage controller, and then perform de-initialization. For more information, see the storage controller user guide.
4. If the issue persists, contact Technical Support.
Hard drive issues
Table 20 and Table 21 show the description of hard drive LEDs.
Table 20 SAS/SATA hard drive LEDs
|
Fault/UID LED (amber/blue) |
Present/Active (green) |
Description |
|
Flashing amber (0.5 Hz) |
Steady on/Flashing (4Hz) |
A failure is predicted. Please replace the hard drive before it fails. |
|
Steady amber |
Steady on/Flashing (4Hz) |
The hard drive is faulty. Please replace the hard drive immediately. |
|
Steady blue |
Steady on/Flashing (4Hz) |
The hard drive is operating correctly, and is selected by the array management tool. |
|
Off |
Flashing (4Hz) |
The hard drive is present. A data read or write operation or RAID migration/rebuilding is in progress. |
|
Off |
Steady on |
The hard drive is present. No data read or write operation is performed. |
|
Off |
Off |
The hard drive is not installed in position. |
|
Fault/UID LED (amber/blue) |
Present/Active (green) |
Description |
|
Flashing orange (0.5 Hz) |
Off |
The hard drive has completed the managed hot removal process, and allows to be removed. |
|
Flashing amber (4Hz) |
Off |
The hard drive is in the hot plug-in process. |
|
Steady amber |
Steady on/Flashing (4Hz) |
The hard drive is faulty. Please replace the hard drive immediately. |
|
Steady blue |
Steady on/Flashing (4Hz) |
The hard drive is operating correctly, and is selected by the array management tool. |
|
Off |
Flashing (4Hz) |
The hard drive is present. A data read or write operation or array migration/rebuild operation is in progress. |
|
Off |
Steady on |
The hard drive is present. No data read or write operation is performed. |
|
Off |
Off |
The hard drive is not installed in position. |
|
BIOS does not support displaying LED status for NVMe hard drives. |
||
Drive Fault or Offline alarms of hard drives in HDM
Symptom
In HDM, Drive Fault or Offline alarms of hard drives are displayed in event logs.
In HDM, the RAID view page shows faulty drives in storage controller information.
Possible causes
· The HDM or BIOS version is too low.
· The hard drive goes offline.
· The hard drive is faulty.
· The cable, storage controller, drive backplane, or drive expander module is not correctly installed or faulty.
Solution
To resolve the issue:
1. Verify that the drive can be identified under the OS or BIOS. If the drive under either the OS or BIOS can be identified, update the HDM and BIOS to the latest version provided on the H3C official website, and then check the hard drive status. If the drive can be identified, proceed to step 4. If the drive cannot be identified, proceed to step 2.
¡ If the faulty drive is a pass-through drive, reinsert the drive. If the issue persists, replace the drive.
¡ If the faulty drive is in a RAID group, perform one of the following operations based on the logical drive status:
- Fail—Data cannot be read from the logical drive. You need to delete the logical drive and create a new logical drive.
- Degraded—For a PMC storage controller, reinsert the hard drive. For an LSI storage controller, you can change the physical drive status from Unconfigured BAD to Unconfigured Good in BIOS. If the issue persists, replace the faulty drive and rebuild the logical drive after data backup.
- Offline—Forcibly bring the logical drive online through HDM.
3. Troubleshoot hard drive cable, hard drive backplane, and hard drive expander module through cross-validation.
4. If the issue persists, contact Technical Support.
Failure to identify any drives on the HDM storage management page
Symptom
In HDM, no drives can be identified in the storage controller information.
Possible causes
· The HDM or BIOS software version is too low.
· The hard drive firmware version is too low.
· The hard drive expander module firmware version is too low.
· The storage controller, hard drive, hard drive backplane, hard drive expander module, or the associated cables are not correctly installed or faulty.
Solution
To resolve the issue:
1. Verify that the drive can be identified under the OS or BIOS. If the drive under either the OS or BIOS can be identified, update the HDM and BIOS to the latest version provided on the H3C official website. If the drive cannot be identified, proceed to step 2.
3. Troubleshoot the storage controller, hard drive, hard drive backplane, hard drive expander module, and associated cables through cross-validation. If a faulty component is located, replace the component.
4. If the issue persists, contact Technical Support.
Hard drive error reported in OS logs
Symptom
The OS logs display hard drive errors, for example, I/O error, Hardware Error, and Medium Error, as follows:
[3296734.898693] sd 0:0:67:0: [sde] tag#46 FAILED Result: hostbyte=DID_ABORT driverbyte=DRIVER_OK
[3296734.898695] sd 0:0:67:0: [sde] tag#0 FAILED Result: hostbyte=DID_ABORT driverbyte=DRIVER_OK
[3296734.898701] sd 0:0:67:0: [sde] tag#0 CDB: Write(16) 8a 00 00 00 00 01 5d 46 ce d8 00 00 00 28 00 00
[3296734.898708] sd 0:0:67:0: [sde] tag#46 CDB: Write(16) 8a 00 00 00 00 00 00 00 08 00 00 00 00 08 00 00
[3296734.898711] blk_update_request: I/O error, dev sde, sector 5859888856
Mar 8 15:49:31 A07-R18-I9-5-5002500 kernel: sd 0:0:0:0: [sda] FAILED Result: hostbyte=DID_OK driverbyte=DRIVER_SENSE
Mar 8 15:49:31 A07-R18-I9-5-5002500 kernel: sd 0:0:0:0: [sda] Sense Key : Hardware Error [current]
Mar 8 15:49:31 A07-R18-I9-5-5002500 kernel: sd 0:0:0:0: [sda] Add. Sense: Internal target failure
Mar 8 15:49:31 A07-R18-I9-5-5002500 kernel: sd 0:0:0:0: [sda] CDB: Write(10) 2a 00 02 16 68 e0 00 00 10 00
Mar 8 15:49:31 A07-R18-I9-5-5002500 kernel: blk_update_request: critical target error, dev sda, sector 35023072
[206109.776549] blk_update_request: critical medium error, dev sdl, sector 10234104120
[206112.336004] sd 0:0:74:0: [sdl] tag#2 FAILED Result: hostbyte=DID_OK driverbyte=DRIVER_SENSE
[206112.336009] sd 0:0:74:0: [sdl] tag#2 Sense Key : Medium Error [current] [descriptor]
[206112.336011] sd 0:0:74:0: [sdl] tag#2 Add. Sense: Unrecovered read error
[206112.336013] sd 0:0:74:0: [sdl] tag#2 CDB: Read(16) 88 00 00 00 00 02 62 00 0d 00 00 00 00 08 00 00
Possible causes
· Damaged tracks on the hard drive.
· Data read or write operation cannot be performed because the link between the storage controller and hard drive is faulty.
Solution
To resolve the issue:
1. Collect hard drive smart information. Obtain the slot number of the hard drive from the serial number in smart information and the hard drive serial number on the HDM storage page.
Figure 67 Obtaining the hard drive smart information
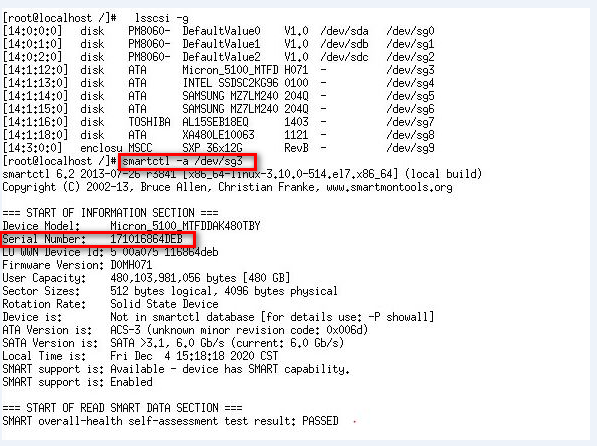
2. Collect storage controller array logs and HDM SDS logs. Based on the logs together with the collected hard drive smart information, contact Technical Support to confirm whether hard drive replacement is necessary.
Hard drive identification failure of the OS
Symptom
The OS cannot identify a hard drive.
Possible causes
· Power supply to the hard drive backplane is abnormal.
· The hard drive is not installed in position.
· The hard drive is faulty.
· No RAID is configured for the hard drive under the storage controller, or the hard drive is configured as a pass-through drive.
· No driver is installed for the storage controller, or the driver version is too low.
· No driver is installed for the NVMe driver.
Solution
To resolve the issue:
1. Verify that the hard drive is installed in position.
2. Check the Present/Active LED. If the LED is steady on or flashing, the power supply is normal on the drive backplane. If not, check the drive backplane and hard drive power cable through cross-validation for anomalies.
3. Verify that the hard drive can be identified by the storage controller on the storage controller management page of HDM or BIOS. If the hard drive cannot be identified, proceed to step 4. If the hard drive can be identified, proceed to step 5.
6. If the issue persists, contact Technical Support.
Steady or flashing amber status for the Fault/UID LED of the hard drive
Symptom
The hard drive LED is steady or flashing amber on the server.
Possible causes
For description of the hard drive Fault/UID LED, see Table 20 and Table 21.
Solution
To resolve the issue:
1. Locate the slot number of the faulty hard drive by its Fault/UID LED.
2. Identify the hard drive type and troubleshoot the issue (if the issue persists, proceed to step 3):
¡ For a SAS/SATA drive, reinstall the hard drive.
¡ For an NVMe drive, check its LED status:
- If the Fault/UID LED is flashing amber, no action is required.
- If the Fault/UID LED is steady amber, reinstall the hard drive.
3. Back up service data, and then replace the faulty hard drive.
4. If the issue persists, contact Technical Support.
SSD reaching its lifetime
Symptom
On the HDM web page, an SSD alarm message is displayed that the remaining lifetime of the SSD is less than 10%.
Possible causes
The SSD has been used for a long time and is about to reach its lifetime. You need to replace it.
Solution
1. Back up service data, and replace the SSD.
2. If the issue persists, contact Technical Support.
Failure to identify SSDs by PCH
Symptom
The PCH embedded RAID cannot identify SSDs (including M.2 SSDs).
Possible causes
· The SSD is faulty.
· The SSD cable is damaged or incorrectly connected.
· The drive backplane or slot is faulty.
· The connection of the SATA M.2 SSD expander module and system board is faulty.
Solution
1. If the SSD cable is not installed in position, plug in the cable again.
2. If the SSD cable is damaged or abnormal, replace the cable.
3. Install the SSD to different slots to verify that the drive backplane is operating correctly.
4. Verify that the connection of the SATA M.2 SSD expander module and system board is normal.
5. Replace the SSD.
6. If the issue persists, contact Technical Support.
Abnormal NVMe drive status in HDM
Symptom
On the HDM web page, the hardware information displays abnormal NVMe drive status, for example, backup space lower than threshold, subsystem degradation, and faulty cache module.
Possible causes
· Heat dissipation is abnormal for the hard drive, resulting in temperature alarm.
· The hard drive is faulty.
· The hard drive has reached its lifetime.
Solution
To resolve the issue:
1. Enter the hardware information page. Click the NVMe tab to view NVMe drive information.
¡ When the NVMe drive is in abnormal status, for example, backup space lower than threshold, subsystem degradation, and faulty cache module, you can locate the faulty drive by it slot. After backing up service data, replace the faulty drive.
¡ When the temperature is abnormal, check heat dissipation of the server. If no temperature alarm exists and the fans are operating correctly, check the environment temperature. If a temperature alarm exists on the server, take associated actions as described in "Fan and heat dissipation issues."
¡ When the drive reaches or exceeds its lifetime, back up service data immediately, and replace the drive.
2. If the issue persists, contact Technical Support.
Failure to identify the newly installed NVMe drive
Symptom
During normal operation of the server, install a new NVMe drive. The system fails to identify the drive.
Possible causes
· The NVMe drive is not installed in position, or installed in a slot that does not support NVMe drives.
· The power or data cable for the NVMe drive is damaged or incorrectly connected.
· The NVMe SSD expander module is not installed to the correct riser card.
· Link failure caused by incorrectly connecting the data cable of the NVMe drive to the NVMe SSD expander module.
· The PCI-E Port status is not set to Enabled or Auto on the BIOS setup page.
· The drive backplane is faulty.
· The drive backplane CPLD firmware version is too low.
Solution
To resolve the issue:
1. Verify that the NVMe drive slot supports installing NVMe drives. For more information, see the product user guide.
2. Verify that the power or data cable for the NVMe drive is not damaged and is correctly connected. When connecting the data cable, make sure the label on it matches the marks on the drive backplane and NVMe SSD expander module. Incorrect connection can cause link failure. For more information, see the product user guide.
3. Make sure the NVMe SSD expander module is installed in the riser card x16 slot.
4. On the BIOS Setup page, select Socket Configuration > IIO Configuration > Processor $1 Configuration > Processor $1 $2. Make sure the PCI-E Port status is set to Enabled or Auto.
Figure 68 PCI-E Port setting
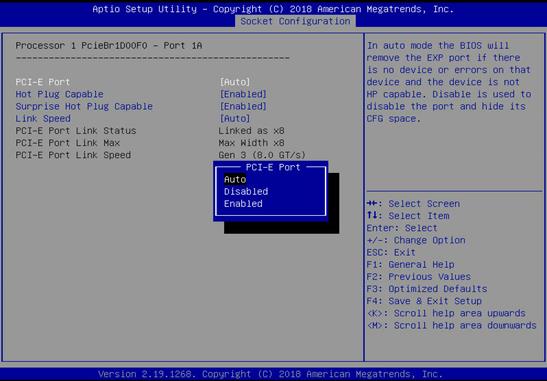
5. Update the drive backplane CPLD firmware to the latest version provided on the H3C official website.
6. Check for faults on the drive backplane through cross-validation. If a fault exists, replace the drive backplane.
7. If the issue persists, contact Technical Support.
|
|
CAUTION: Follow these guidelines when you install or remove an NVMe drive: · The NVMe drive supports hot insertion. Use even force to insert the NVMe drive without pauses. Otherwise, the OS might get stuck or reboot. · Support of the NVMe drive for hot removal and managed hot removal varies by OS. For more information, click OS compatibility query tool. · You cannot hot swap multiple NVMe drives at a time. As a best practice, hot swap the drives at 30-second intervals. After the OS identifies the information of the first drive, hot insert or remove the second drive. If you insert multiple NVMe drives at the same time, the OS might not identify the drives. |
NVMe drive failure
Symptom
Data write or read operation fails on the NVMe drive.
Possible causes
· The NVMe drive is faulty.
· The NVMe SSD expander module is faulty.
· The NVMe drive backplane is faulty.
· The NVMe drive cable is damaged or incorrectly connected.
Solution
To resolve the issue:
1. Check the LED status of the NVMe drive.
¡ If the Fault/UID is flashing amber, the drive is faulty and needs to be replaced.
¡ If both the Fault/UID and Present/Active are off, the drive is not installed in position. Reinstall the drive.
2. Verify the BIOS can identify the NVMe drive. If the drive can be identified, proceed to step 4. If the drive cannot be identified, proceed to step 3.
Figure 69 Identifying the NVMe drive in BIOS
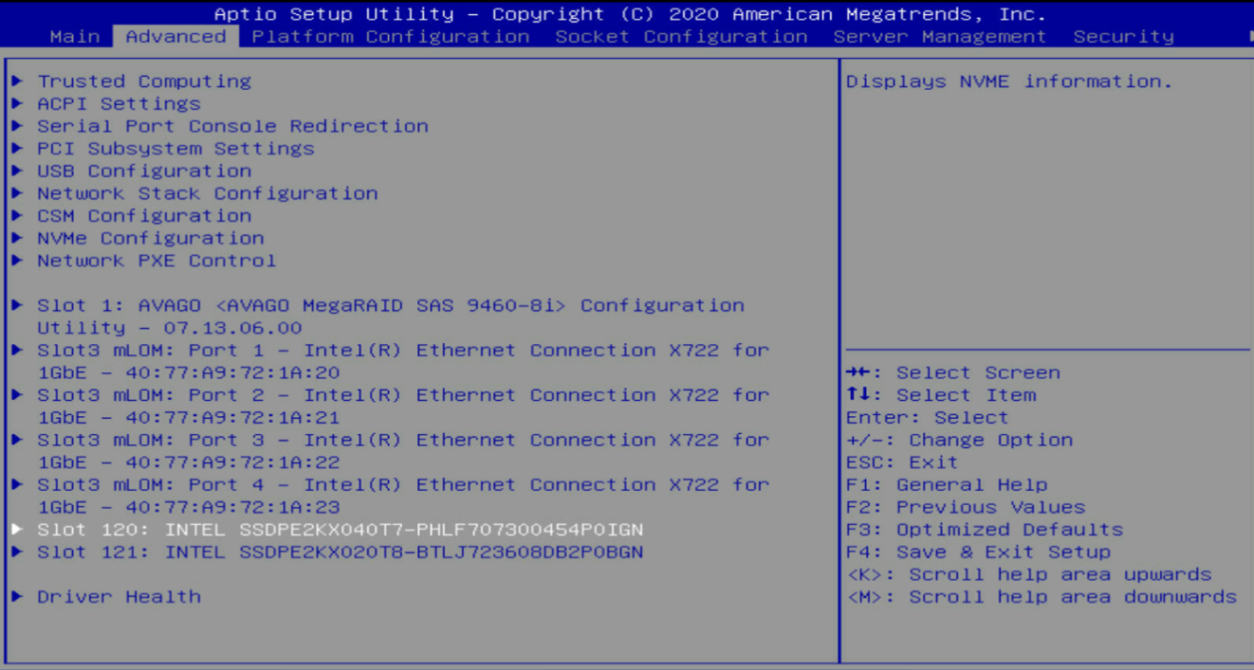
3. Verify that the power or data cable for the NVMe drive is not damaged and is correctly connected.
4. Verify that the NVMe SSD expander module is faulty. As shown in Figure 70, if one of the three LEDs is off, the drive expander module is faulty.
Figure 70 NVMe SSD expander module LED status
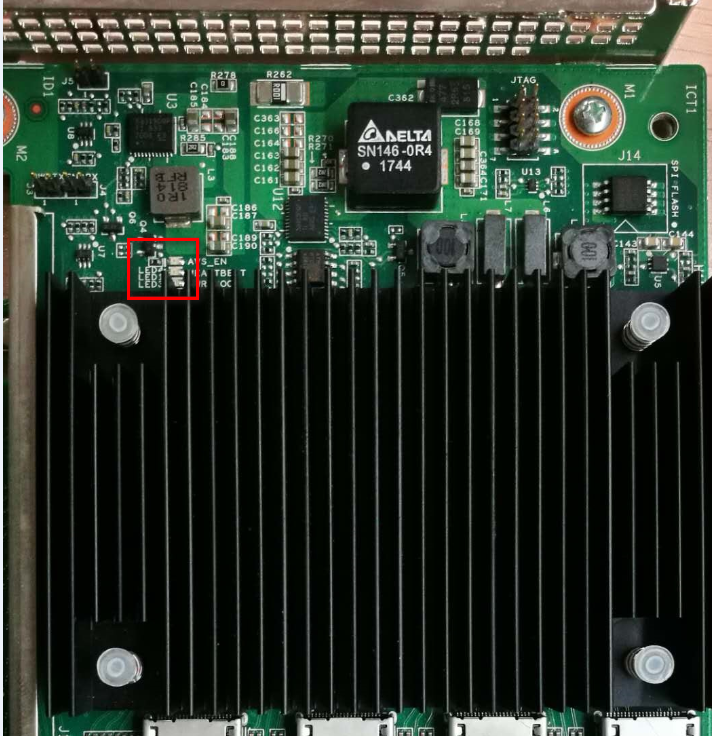
5. Troubleshoot the drive backplane and NVMe SSD expander module in sequence by using cross-validation, and replace the faulty component.
6. If the issue persists, contact Technical Support.
Inaccessible data of the hard drive
Symptom
As shown in Figure 71, the hard drive data in the OS cannot be accessed.
Figure 71 Inaccessible data of the hard drive
Possible causes
· File system error due to sudden power outage or unexpected shutdown.
· The hard drive is faulty.
Solution
To resolve the issue:
1. Back up the service data on the hard drive, and repair the file system if it is faulty.
2. Collect OS logs and storage controller logs. If a fault is located in the logs, replace the faulty drive.
3. If the issue persists, contact Technical Support.
Storage controller issues
Restrictions and guidelines for storage controller replacement
To avoid unexpected failures, make sure the following settings are consistent between new storage controller and the original storage controller.
· Storage controller model.
· BIOS startup mode.
· Storage controller firmware version.
· Storage controller driver version.
· Storage controller operating mode.
· First boot option in Legacy BIOS mode.
Cache write policy of the logical drive changed from Write Back to Write Through
Symptom
The cache write policy of the logical drive (built by a supercapacitor-connected storage controller) is set to Write Back, but is then changed to Write Through automatically.
Possible causes
· The connection between the supercapacitor and storage controller is abnormal.
· The supercapacitor has not completed charging.
· The supercapacitor is faulty.
When any of the previous issues exist, the supercapacitor power fail-safe function does not take effect. To prevent cached data loss, the storage controller changes the cache write policy from Write Back to Write Through.
Solution
To resolve the issue:
1. Check the supercapacitor status. On the HDM storage controller management page, select the target storage controller to view the supercapacitor status.
2. Based on the supercapacitor status, troubleshoot the associated issues:
¡ If the supercapacitor status is Absent, the system fails to identify the supercapacitor.
- If the supercapacitor is actually in position, reinstall the supercapacitor and its cable. Make sure the cable is securely connected. If the supercapacitor is still absent, it might be faulty and needs to be replaced.
- If the supercapacitor is actually absent, install a supercapacitor into position.
¡ If the supercapacitor status is Charging, no action is required. Wait until its status becomes Charging Completed.
¡ If the supercapacitor status is Fatal, Overtemperature, Calibration failure, or Abnormal, the supercapacitor is faulty and needs to be replaced.
3. After the supercapacitor status becomes Charging Completed, the cache write policy of the logical drive will be automatically changed from Write Through to Write Back.
4. If the issue persists, contact Technical Support.
Not be Available status of the logical drive built by a PMC storage controller
Symptom
A critical fault (such as Offline and Degraded) occurs on the logical drive built by a PMC storage controller. Other logical drives of the storage controller enter the Not be Available state. You cannot operate on any of the logical drives or assign drive letters to them in the OS.
Possible causes
The critical fault (such as Offline and Degraded) on the logical drive built by the PMC storage controller can result in abnormal operating status of the storage controller. Other logical drives will enter the Not be Available state.
Solution
To resolve the issue:
1. Log in to HDM, and enter the system management page.
2. Locate the faulty drive, and delete the associated logical drive. This operation can restore the Not be Available state of other logical drives.
3. If the issue persists, contact Technical Support.
Failure to identify P460/H460 series storage controller by the ARCCONF tool
Symptom
A P460/H460 series storage controller is installed on the server. As shown in Figure 72, use the ARCCONF tool to execute the ./arcconf list command to view the storage controller status. The Controllers found: 0 state is returned, Indicating no storage controllers are found. In fact, however, the storage controller is operating correctly.
Figure 72 No storage controllers found
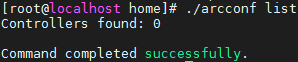
Possible causes
· The version of the ARCCONF tool is too low to be compatible with the new storage controller firmware.
· The driver version for the storage controller is too low to be compatible with the new storage controller firmware.
Solution
To resolve the issue:
1. Obtain the ARCCONF tool in the latest firmware package of the storage controller from the H3C official website.
2. Update the driver and firmware of the storage controller to the latest version as provided on the H3C official website.
Incorrect display of the P460/H460 series storage controller model
Symptom
The model displayed on the BIOS or OS interface is inconsistent with the actual model of the P460/H460 series storage controller. As shown in Figure 73, the storage controller model is displayed as SmartROC 3154-8i.
Figure 73 Incorrect display of the storage controller model
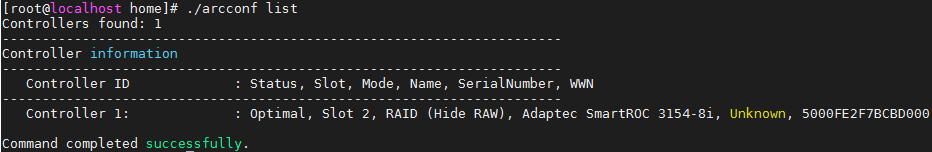
Possible causes
The SEEPROM version for the storage controller is too low. Early SEEPROM versions use the default models of third-party storage controllers. With modifications, subsequent SEEPROM versions use normal models such as P460 or H460.
Solution
To resolve the issue, contact Technical Support to update the SEEPROM version for the storage controller.
Alternate flashing blue and flashing amber LED status of the member logical drive for the P430 series storage controller
Symptom
The P430 series storage controller is directly connected to the drive backplane (without using the drive expander module). When the logical drive is faulty, rebuilding, or initializing, the Fault/UID LED status for all member drives is alternate flashing blue and flashing amber.
Possible causes
· Some member drives are faulty.
· The logical drive is rebuilding.
· The logical drive is initializing.
Solution
To resolve the issue:
· If some member drives are faulty:
a. Enter the storage management page in HDM, and select the RAID view tab to enter the RAID view page.
b. Select the target logical drive under the specified storage controller to view its status. If the status is Degraded, some member drives are faulty. In this case, the LED status is alternate flashing blue and flashing amber, which indicates the drives are normal. If the LED status is not alternate flashing blue and flashing amber, some drives are faulty, and you need to replace all drives.
· If the logical drive is rebuilding:
a. Enter the storage management page in HDM, and select the RAID view tab to enter the RAID view page.
b. Select the target logical drive under the specified storage controller to view its status. If the logical drive status is Rebuilding, the logical drive is rebuilding. In this case, the LED status is alternate flashing blue and flashing amber, and no actions is required. The status will be restored to normal after the rebuilding is complete.
· If the logical drive is initializing:
a. Enter the storage management page in HDM, and select the RAID view tab to enter the RAID view page.
b. Select the target logical drive under the specified storage controller to view its status. If the logical drive status is Zeroing, the logical drive is initializing. In this case, the LED status is alternate flashing blue and flashing amber, and no actions is required. The status will be restored to normal after the initialization is complete.
Storage controller stuck during initialization in Legacy BIOS mode
Symptom
After the server is powered on, during initialization of the LSI-9300 or LSI-9311 series storage controller, the cursor is flickering on the BIOS startup page (in Legacy BIOS mode), but the page gets stuck and is not responsive, as shown in Figure 74.
Figure 74 Unresponsive page with flickering cursor

Possible causes
The BIOS version is too low. As a result, the storage controller firmware is incompatible with BIOS.
Solution
To resolve the issue:
1. Log in to HDM, and set the next startup mode to UEFI.
2. Reboot the server. Then update the driver and firmware of the storage controller to the latest version as provided on the H3C official website in UEFI BIOS mode.
Failure to identify hard drive during OS installation with LSI storage controller changed to JBOD mode
Symptom
After you change the operating mode for the LSI storage controller to JBOD, the hard drive cannot be identified during OS installation, as shown in Figure 75.
Figure 75 Hard disk identification failure
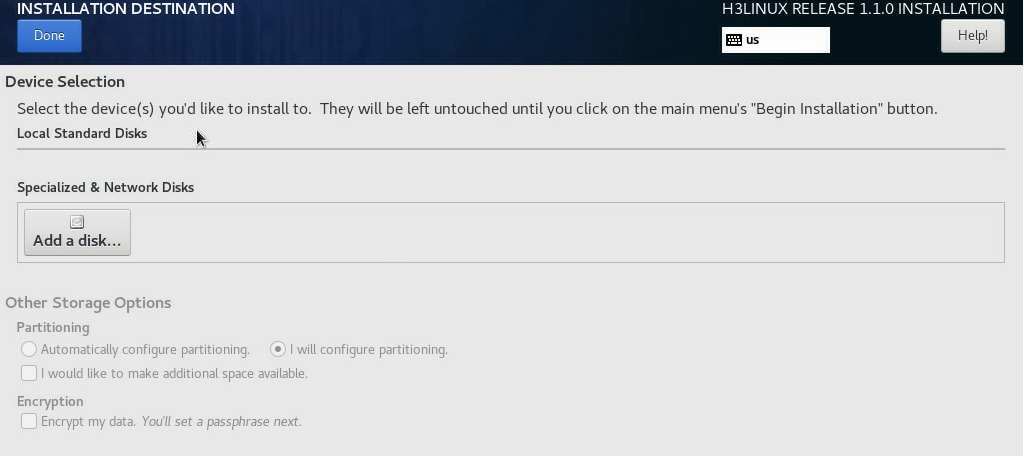
Possible causes
The driver version for the LSI storage controller is too low to support the JBOD operating mode.
Solution
To resolve the issue, download the latest firmware version and the associated software driver version for the storage controller on the H3C official website, and the update the firmware and software driver.
No driver found during manual update of the LSI storage controller driver in Windows
Symptom
Windows OS is installed on the server where the LSI storage controller resides. When you manually update the storage controller driver, an error message is displayed that no driver is found, as shown in Figure 76.
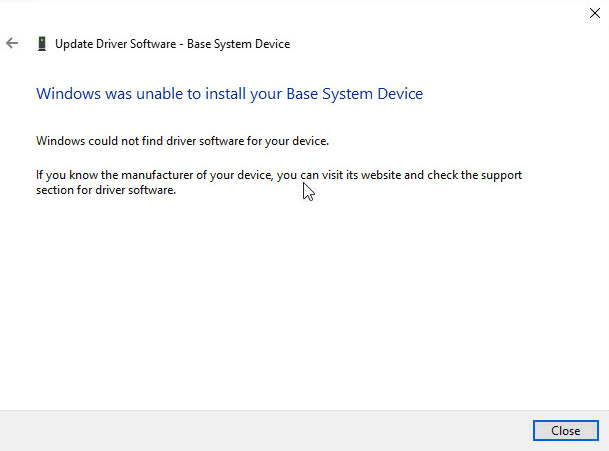
Possible causes
Early LSI storage controller driver versions (for Windows OS) include RAID Mode and JBOD Mode. Make sure the Windows OS version matches the LSI storage controller driver version. If they do not match, Windows cannot identify the software driver.
Solution
To resolve the issue, update the driver and firmware of the storage controller to the latest version as provided on the H3C official website.
Logical drive rebuilding failure after member drive replacement
Symptom
After you replace a member drive for a degraded logical drive, the logical drive rebuilding fails.
Possible causes
The new member drive is faulty.
Solution
To resolve the issue:
1. Verify that the capacity of the new member drive is not less than the faulty member drive. If the capacity of the new member drive is less than the faulty member drive, the logical drive rebuilding will fail.
2. Verify that the storage controller cable is correctly and securely connected.
3. Verify that the new member drive can be correctly identified by the storage controller:
¡ PMC storage controller: As shown in Figure 77, view the hard drive by navigating to BIOS Setup > Advanced > storage controller model > Disk Utilities.
Figure 77 Verifying that the new member drive can be identified by the PMC storage controller
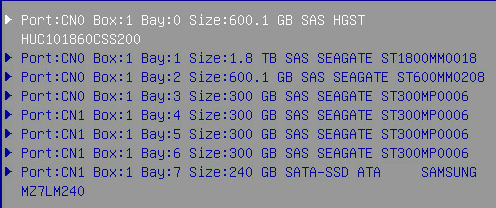
¡ LSI storage controller: As shown in Figure 78, view the hard drive by navigating to BIOS Setup > Advanced > storage controller model > Main Menu > Drive Management.
Figure 78 Verifying that the new member drive can be identified by the LSI storage controller
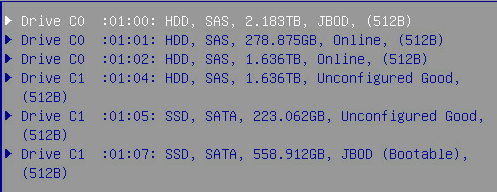
4. If the new member drive cannot be identified, replace the drive.
5. If the new member drive can be identified, verify that its status is normal (not in Failed, Unconfigured Bad, or other status). If the status is not normal, replace the drive. If the status is normal (such as Optimal or Online), start rebuilding the logical drive.
6. If the issue persists, contact Technical Support.
Original drive data unavailable after storage controller replacement
Symptom
After you replace the storage controller of the same model, data in the RAID built by the previous storage controller cannot be identified or used.
Possible causes
The operating mode of the new storage controller is not RAID. The drives containing RAID data cannot be identified or used.
Solution
To resolve the issue:
1. Change the operating mode of the new storage controller to RAID, save the configuration, and then reboot the server.
2. If the issue persists, contact Technical Support.
Logical drive data loss in PCH embedded RAID
Symptom
If you upgrade the BIOS firmware through configuration overwrite or forcible overwrite in HDM, data loss occurs in the logical drive built by the PCH embedded RAID.
Possible causes
The default mode is AHCI for the PCH embedded RAID. If you upgrade the BIOS firmware through configuration overwrite or forcible overwrite, the PCH restores to the default mode (that is, the PCH embedded RAID mode is restored to AHCI). In this mode, logical drives cannot be identified, resulting in data loss.
Solution
To resolve the issue:
1. Manually change the PCH embedded RAID mode to RAID mode, save the configuration, and then reboot the server.
2. If RAID cannot be identified after reboot, data cannot be restored. You need to configure RAID settings again.
Failure of OS to identify logical drive created by PCH embedded RAID
Symptom
During OS installation, the OS fails to identify logical drive created by PCH embedded RAID, and cannot partition the logical drive as a result.
Possible causes
· The OS is incompatible with the PCH embedded RAID.
· Residual data exists in the member drive of the logical drive.
Solution
To resolve the issue:
1. Verify that the OS is incompatible with the PCH embedded RAID through OS compatibility query tool.
2. Press Ctrl+Alt+F2 on the OS installation window to enter the CLI window, as shown in Figure 79. Enter the dmsetup ls command to view the residual logical volume information on the member drive of the logical drive created by PCH embedded RAID. Record the complete name of the logical drive.
Figure 79 Residual logical volume information
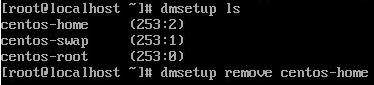
3. As shown in Figure 80, enter dmsetup remove <logical volume information> to delete the residual information, enter reboot to reboot the server, and then reinstall the OS.
Figure 80 Deleting residual logical volume information
![]()
4. If the issue persists, contact Technical Support.
Degraded logical drive
Symptom
In HDM, the status of the logical drive in the RAID is Degraded, and the logical drive can be used normally.
Possible causes
The member drive of the logical drive is faulty.
Solution
To resolve the issue:
1. Locate the slot of the faulty member drive. The method used to locate the slot varies by storage controller vendor.
¡ PMC storage controller
As shown in Figure 81, enter ./arcconf getconfig controller_id LD. The output shows that Device 2 is faulty, which means slot 2 is the slot where the faulty member drive resides.
Figure 81 Locating the faulty member drive slot with PMC storage controller
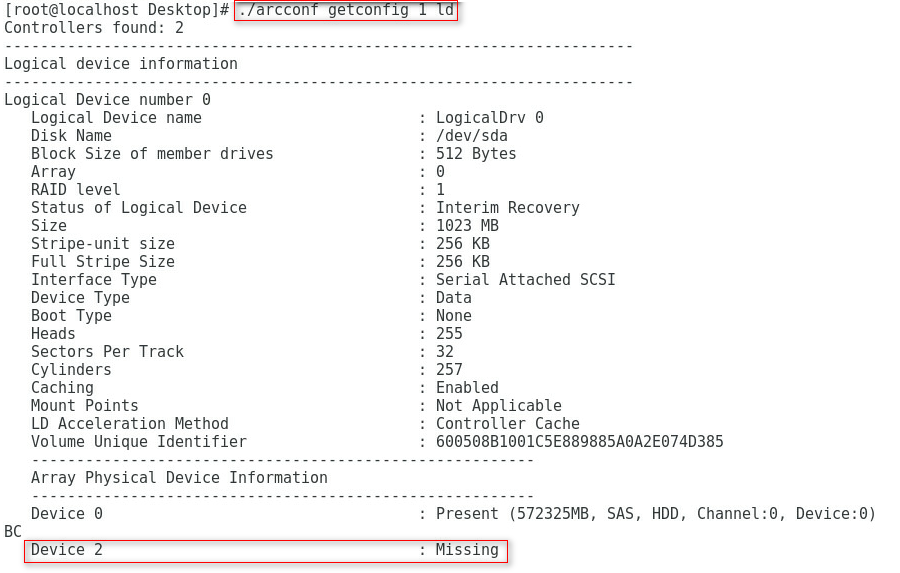
¡ LSI storage controller
As shown in Figure 82, enter ./storcli64 /c0 show events. The output shows that s1 is faulty, which means slot 1 is the slot where the faulty member drive resides.
Figure 82 Locating the faulty member drive slot with LSI storage controller
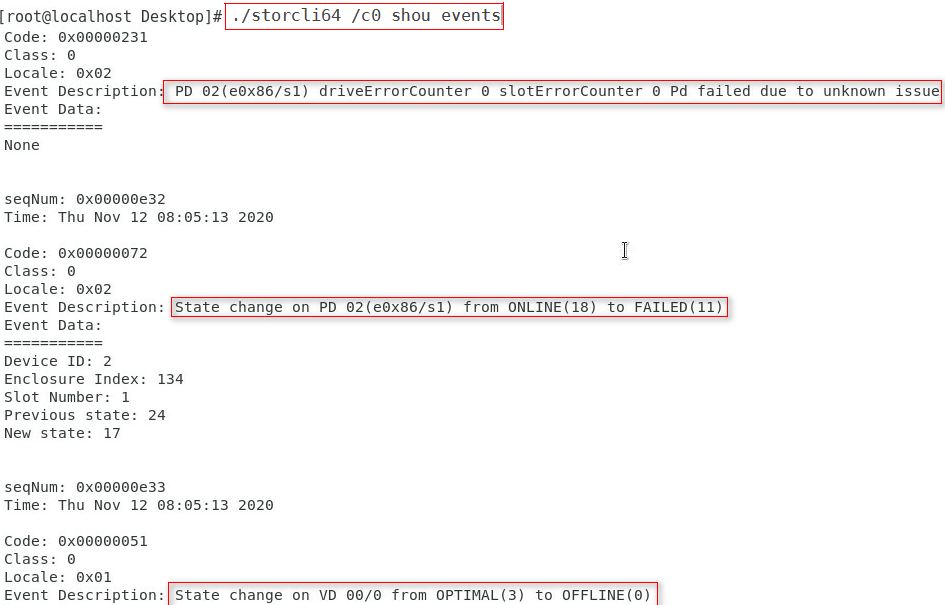
2. Replace the faulty member drive. The logical drive will automatically rebuild after the replacement.
Logical drive fault
Symptom
The logical drive status in Offline on the HDM management page, which means the logical drive is faulty and cannot be used.
Possible causes
· For RAID 0, any member drive fault in the logical drive.
· For other RAID levels, the number of member drive faults in the logical drive exceeds the limit that the RAID level can tolerate.
Solution
To resolve the issue:
1. You cannot restore data for the logical drive. Log in to HDM, and locate the member drive in Failed or Offline status and replace it.
2. Delete the logical drive where the member drive resides, and rebuild the logical drive.
3. If the issue persists, contact Technical Support.
Storage controller supercapacitor issues
A supercapacitor battery is exhausted if it has not been used for a long time
Symptom
If a supercapacitor that has not been used for a long time is installed to the server and the server is powered on, the RAID view on the Dashboard > Storage page from HDM displays that the supercapacitor is being charged or is abnormal.
Possible causes
· The supercapacitor has reached the end of its usable life. A supercapacitor has a lifespan of 3 to 5 years. If the lifespan of a supercapacitor expires, a supercapacitor exception might occur. For the power fail safeguard module to take effect, replace the supercapacitor before its lifespan expires.
· A supercapacitor that has not been used for a long time discharges slowly. This is normal. The server will automatically charge the supercapacitor after it is attached to the server.
Solution
To resolve the issue:
1. If the system displays that the supercapacitor is being charged automatically on HDM, you do not need to take any action.
2. If the system displays that the supercapacitor is abnormal, the supercapacitor has reached the end of its usable life. Replace the supercapacitor.
3. If the issue persists, contact Technical Support.
Supercapacitor configuration error
Symptom
The RAID view on the Dashboard > Storage page from HDM displays that a supercapacitor is absent.
Possible causes
The supercapacitor model is incompatible with the storage controller model. For example, the supercapacitor model is LSI and the storage controller model is PMC.
Solution
To resolve this issue:
1. Make sure the supercapacitor model matches the storage controller model. For more information, see the user guide.
2. If the issue persists, see "Storage controller supercapacitor issues flowchart."
A supercapacitor caused write policy change
Symptom
The storage controller cannot identify the supercapacitor. The write policy for the logical disk automatically switches from Write Back to Write Through.
Figure 83 Write policy on BIOS
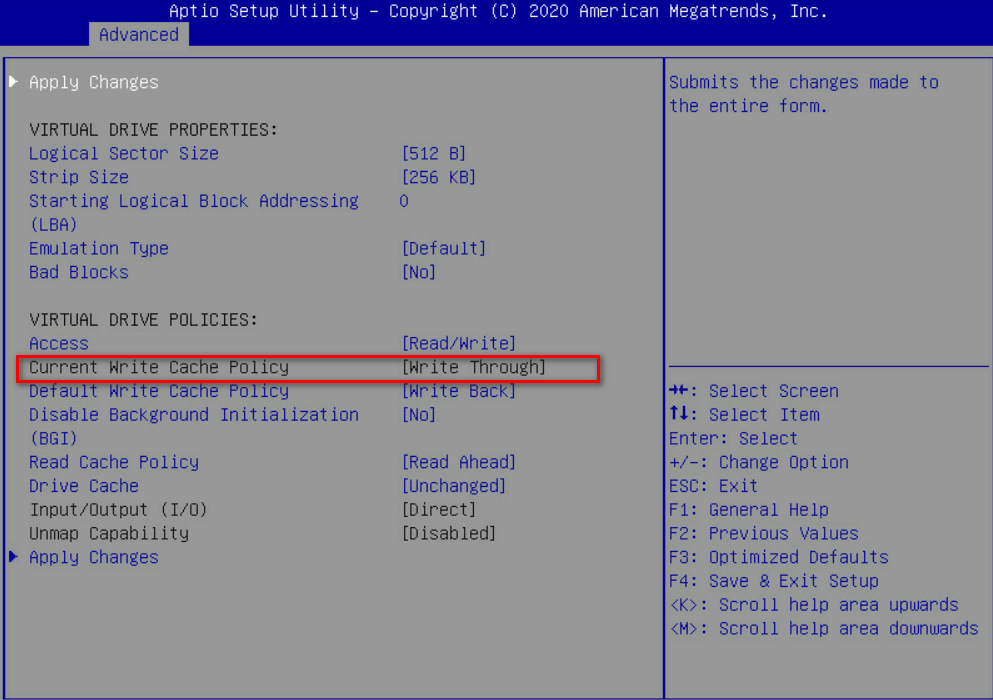
Possible causes
An error occurs on the supercapacitor, which causes the data safeguard function to become unavailable. To avoid data loss, the storage controller automatically changes the write policy for the logical disk.
Solution
To resolve the issue, see "Storage controller supercapacitor issues flowchart."
Fan and heat dissipation issues
Multiple fans make loud noises when they are operating at a high speed
Symptom
Multiple fans make loud noises when they are operating at a high speed.
Possible causes
· The fan speed adjustment mode is incorrect.
· The power consumption of the server is too high.
· The firmware version for HDM, BIOS, or system board CPLD is too low.
· Fans are not installed by following the installation guidelines.
· Other fans are not installed securely. The Dashboard > Sensors > Fans page displays that the fans are not in position.
· The ambient temperature is too high.
· The server has poor ventilation.
· Fans or the chassis has foreign objects.
· Fans are faulty.
Solution
To resolve the issue:
1. Verify that the ambient temperature for the server is as required. For more information, see the user guide for the server.
2. Ensure good ventilation of the server, and make sure the ventilation openings in the server chassis are not blocked.
3. Verify that the server and fans do not contain any foreign objects, and the fan connectors are not damaged.
4. Re-install all fans, and make sure they are installed securely.
5. From HDM, select Fans > Adjust fan speed mode, and then select the following modes as needed:
¡ Optimal cooling—In this mode, fans run at the lowest speed with the lowest noise and can ensure heat dissipation for the server.
¡ Custom—In this mode, you decrease the fan speed to enhance the silence efficiency.
6. Select Power profile to view the power consumption of the server. If the power consumption of the server reaches or exceeds the threshold, stop some services to reduce power consumption and fan speed. If the issue persists, go to the next step 7.
7. Update the HDM, BIOS, and system board CPLD firmware to the latest versions.
8. Replace the fans with fans of the same model.
¡ If the issue is resolved, the fans are faulty. Replace the fans.
¡ If the issue persists, contact Technical Support.
One or multiple fans make loud noises when operating at a low speed
Symptom
One or multiple fans make loud noises when operating at a low speed.
Possible causes
· The fans are faulty.
· The chassis contains foreign objects.
· The fans contain foreign objects.
Solution
To resolve the issue:
1. Verify that the server and fans do not contain any foreign objects.
2. Replace the fans with fans of the same model.
¡ If the issue is resolved, the fans are faulty. Replace the fans.
¡ If the issue persists, contact Technical Support.
A fan rotates almost at full speed
Symptom
A fan rotates at full speed or nearly-full speed. On the Dashboard > Hardware Summary > Fans page of HDM, the fan speed ratio for a single fan is displayed as 100% or nearly 100%.
Possible causes
· The fan is abnormal.
· The fan connector on the system board is abnormal.
Solution
To resolve the issue:
1. Verify that the fan connector is not damaged.
2. Replace the fan with a fan of the same model.
¡ If the issue is resolved, the fan is faulty. Replace the fan.
¡ If the issue persists, contact Technical Support.
All fans rotate at full speed
Symptom
All fans rotate almost at full speed. On the Dashboard > Hardware Summary > Fans page of HDM, the fan speed ratio for all fans in position is displayed as 100% or nearly 100%.
Possible causes
· The fan speed adjustment mode is incorrect.
· The power consumption of the server is too high.
· The firmware versions for HDM, BIOS, and system board CPLD are too low.
· Fans are not installed by following the installation guidelines.
· The fans are not installed securely to the server.
· The fans are abnormal.
· The ambient temperature is too high.
· The server has poor ventilation.
· The chassis contains foreign objects.
Solution
To resolve the issue:
1. Verify that the server chassis does not contain any foreign objects, and the fan connectors are not damaged.
2. Re-install all fans, and make sure they are installed securely.
3. Ensure good ventilation of the server, and make sure the ventilation openings in the server chassis are not blocked.
4. Verify that the ambient temperature for the server is as required. For more information, see the user guide for the server.
5. From HDM, select Fans > Adjust fan speed mode, and then select the following modes as needed:
¡ Optimal cooling—In this mode, the fans run at the lowest speed and can ensure heat dissipation for the server.
¡ Custom—In this mode, you manually decrease the fan speed to enhance heat dissipation performance.
6. Select Power profile to view the power consumption of the server. If the power consumption of the server reaches or exceeds the threshold, stop some services to reduce power consumption and fan speed. If the issue persists, go to the next step.
7. Update the HDM, BIOS, and system board CPLD firmware to the latest versions.
8. Replace the fans with fans of the same model.
¡ If the issue is resolved, the fans are faulty. Replace the fans.
¡ If the issue persists, contact Technical Support.
New fan failure after fan replacement
Symptom
· The new fan is faulty after it is used to replace a fan operating correctly.
· A new fan is faulty after multiple fans are replaced.
Possible causes
· The fan is incompatible with the server.
· The fan is not installed securely to the server.
· The fan is faulty.
Solution
To resolve the issue:
1. For server and component compatibility, use the query tool available from Query tool for server and component compatibility.
2. Observe the fan LED to identify whether the fan is faulty:
¡ If the LED is steady on, replace the fan.
¡ If the LED is off, go to the next step.
3. Verify that the fan connector is not damaged.
4. Re-install all fans, and make sure they are installed securely.
5. From HDM, select Dashboard > Sensors > Fans to identify whether the fan can be identified.
¡ If the fan is identified but it still cannot work, replace the fan.
¡ If the fan cannot be identified, go to the next step.
6. Replace the fan with a fan of the same model.
¡ If the issue is resolved, the fan is faulty. Replace the fan.
¡ If the issue persists, contact Technical Support.
Automatic server shutdown caused by overtemperature
Symptom
The server automatically shut down because of overtemperature.
Possible causes
· The ambient temperature is too high.
· The server has poor ventilation.
· The chassis contains foreign objects.
· The fans are not installed securely to the server.
· The fans are faulty.
· Fans are not installed by following the installation guidelines.
· The temperature sensor on the right mounting ear is faulty.
Solution
To resolve the issue:
1. Verify that the server chassis does not contain any foreign objects, and the fan connectors are not damaged.
2. Verify that the ambient temperature for the server is as required. For more information, see the user guide for the server.
3. Ensure good ventilation of the server, and make sure the ventilation openings in the server chassis are not blocked.
4. Verify that the fans are installed by following the installation guidelines. For more information, see the user guide for the server.
5. From HDM, select Fans > Adjust fan speed mode, and then select the following modes as needed:
¡ Maximum cooling—In this mode, the fan has the highest heat dissipation performance.
¡ Custom—In this mode, you manually adjust the fan speed to enhance heat dissipation performance.
|
|
CAUTION: The custom mode is a temporary method for resolving this issue. To resolve the issue, perform the following steps or contact Technical Support. |
6. From HDM, select Sensors > Temperature to obtain temperature information for each component.
¡ If alarm information is displayed in the temperature sensor information, use the event log to locate and troubleshoot the issue. For more information, see H3C HDM System Log Messages Reference.
¡ If no alarm information is displayed in the temperature sensor information, go to the next step.
7. Replace the right mounting ear with a right mounting ear of the same model.
¡ If the issue is resolved, the right mounting ear is faulty. Replace the mounting ear.
¡ If the issue persists, contact Technical Support.
DRAM DIMM issues
Installation guidelines
· Wear antistatic clothing. Wear an ESD wrist strap and make sure it makes good skin contact and is reliably grounded. Do not wear any conductive objects, such as jewelry or watches.
· Examine the slot and connector for damages. Make sure the pins are not damaged (bent for example) and do not contain any foreign objects.
· To avoid damage to the DIMM, always hold the DIMM by its edges.
· Never touch the gold contacts on the DIMM bottom.
· Do not bend the DIMM.
· DIMMs are not hot swappable.
· Make sure the corresponding processors are present before powering on the server.
· Make sure all DRAM DIMMs have the same product code and all DCPMMs have the same product code.
· As a best practice to increase memory bandwidth, install DRAM and DCPMM DIMMs in different channels.
· For more information, see the user guide.
DIMM installation position error
Symptom
Some DIMMs have installation position error but the server is operating correctly. The system prompts "POST Error--- Memory Population Rule Error :Minor code:$1 Processor:$2 Channel:$3 DIMM:$4".
As shown in Figure 84, BIOS displays an error message when a DIMM installation position error occurs.
Figure 84 BIOS prompts DIMM installation position error
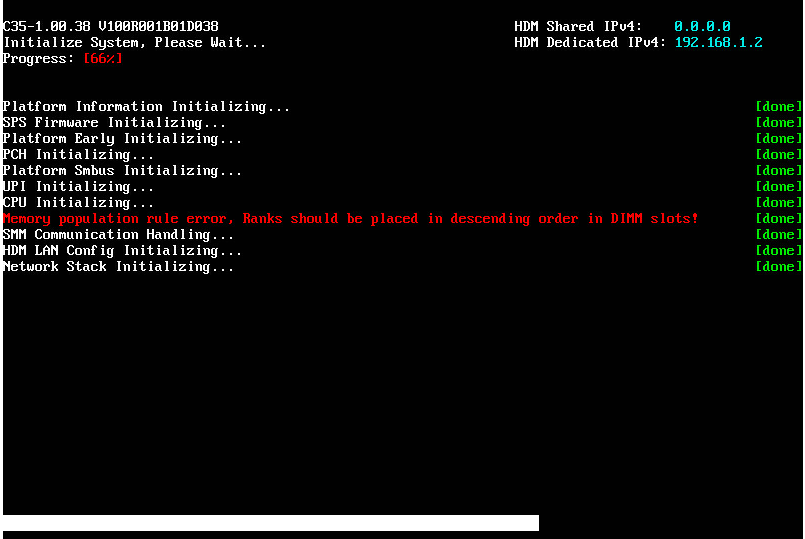
Possible causes
DIMM installation position error.
Solution
To resolve the issue:
1. Identify the slot where a DIMM installation position errors.
2. Re-install the DIMM by following the installation guidelines.
3. If the issue persists, contact Technical Support.
Memory mode degrade
Symptom
· In the HDM Web interface, the system prompts "POST Error---Memory Ras Mode Degrade: Minor Code:0x03 Mirror degrade to independent mode".
· As shown in Figure 85, the system prompts "Mirror degrade to independent mode!".
Figure 85 BIOS prompts memory mode degrade
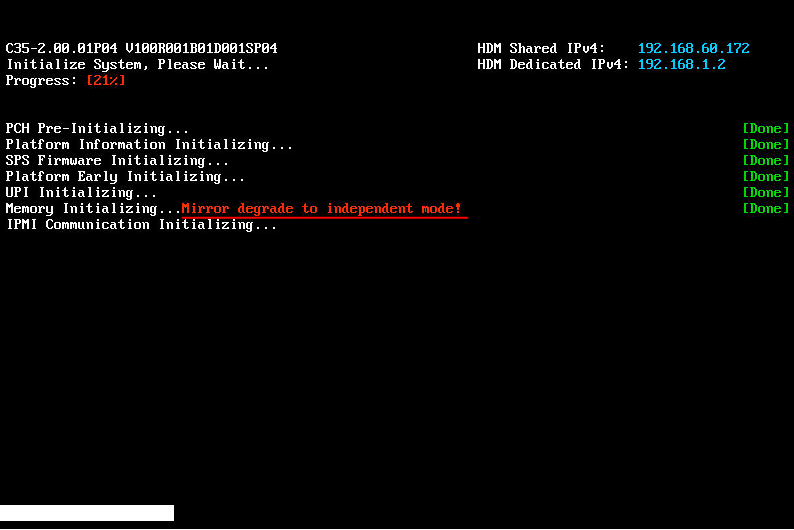
Possible causes
The DIMM configuration does not meet the requirements for the configured memory mode. The system automatically switches to the default memory mode (Independent mode).
Solution
To resolve the issue:
1. Make sure the DIMM is installed by following the installation guidelines. For more information, see the user guide for the server.
2. If the issue persists, contact Technical Support.
POST detected no available memory (applicable to servers that use Intel processors)
Symptom
· As shown in Figure 86, BIOS prompts no available memory and the system is stuck in this stage.
· In the HDM Web interface, the system prompts "POST Error--- No Memory Usable:Minor code:$1".
This symptom might occur when one DIMM or a small number of DIMMs are installed.
Figure 86 BIOS prompts not available memory
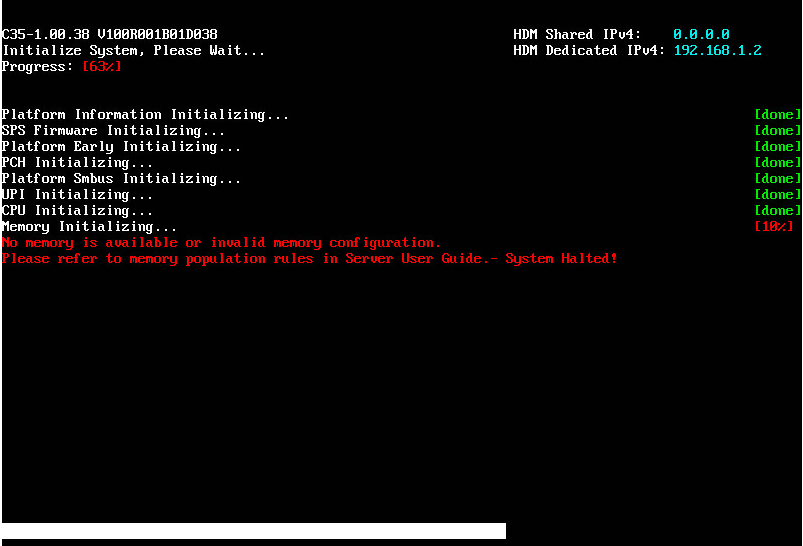
Possible causes
· The DIMM model is incompatible with the server model.
· Incorrect DIMM installation position. For example, if a white slot is not installed with a DIMM and a black slot is installed with a DIMM, all DIMMs in the channels will be disabled.
· Hardware issues, for example, DIMM poor contact or system board pin and connector damage.
· DIMM failure occurs during the startup process of the server.
· The BIOS version is incompatible with the processor model.
Solution
To resolve the issue:
1. For memory and processor compatibility with servers, use compatibility query tools.
2. For memory and processor compatibility with servers, use the query tool available from Query tool for server and component compatibility.
3. For memory and processor compatibility with server operating systems, use the query tool available from Query tool for operating system compatibility.
4. Verify that DIMMs are installed securely, gold contacts on them are not bent, and the slots do not contain foreign objects.
5. Verify that DIMMs are installed by following the installation guidelines, for example, processors corresponding to the DIMMs are in position, and no mixture of DIMMs of different models are installed. For more information about DIMM installation guidelines, see the user guide for the server.
6. Replace all DIMMs.
7. (Optional.) If the server model is R2700 G3, R2900 G3, R4700 G3, R4900 G3, or R6900 G3, verify that the BIOS version for the server is compatible with the processor model. BIOS-1.00.XX does not support CascadeLake processors.
8. Verify that the pins on the processors and system board and the DIMM slots are not damaged.
9. If the issue persists, contact Technical Support.
POST detected a DIMM initialization error
Symptom
· In the HDM Web interface, the system prompts "POST Error--- Memory Unrecognized Initialization Error: Minor code:$1, Major code:$2 Processor:$3 Channel:$4 DIMM:$5".
· In the HDM Web interface, the system prompts "Memory Device Disabled---Last boot error-Location:CPU:$1 MEM CTRL:$2 CH:$3 DIMM:$4".
Possible causes
· DIMM failure.
· The channel where the DIMM is installed is disabled in BIOS.
Solution
To resolve the issue:
1. Identify the model of the processor:
¡ As shown in Figure 87, if "Memory Device Disabled" is displayed, the channel for the memory is disabled. Intel processors: Access the BIOS, and then select Socket Configuration > Memory Configuration > IMC Configuration. Then, verify the DIMM channel state.
Figure 87 The channel where the DIMM is installed is disabled in BIOS.
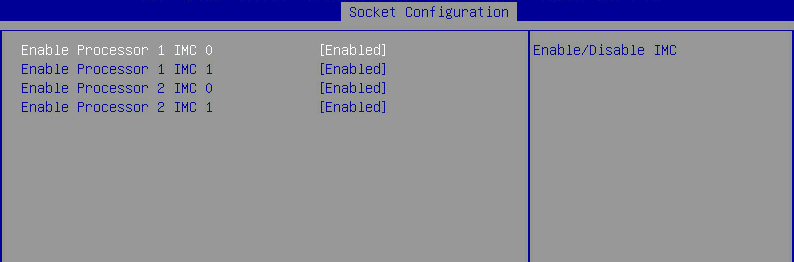
¡ AMD processors: Access the BIOS, and then select Chipset > Socket 1 Information (Socket 2 Information). Then, verify the DIMM state. As shown in Figure 88, if the DIMM state is Disabled, verify that the DIMM is installed securely and is not faulty.
Figure 88 Verifying the DIMM channel state
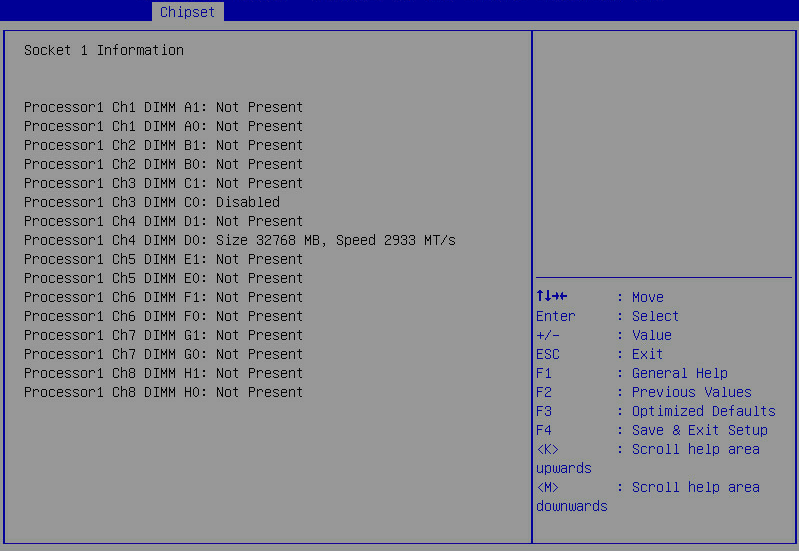
2. If the value of Minor code is 0x1C in the alarm information, the DIMM is faulty. Replace the DIMM.
3. If the issue persists, contact Technical Support.
POST detected a Training error
Symptom
· In the HDM Web interface, the system prompts "POST Error--- Memory Receive Enable training Error: Minor code:$1, Major code:$2 Processor:$3 Channel:$4 DIMM:$5".
· In the HDM Web interface, the system prompts "POST Error--- Memory Write Leveling training Error: Minor code:$1, Major code:$2 Processor:$3 Channel:$4 DIMM:$5".
· In the HDM Web interface, the system prompts "POST Error--- Memory Write DqDqs Training Error: Minor code:$1, Major code:$2 Processor:$3 Channel:$4 DIMM:$5".
· In the HDM Web interface, the system prompts "POST Error--- Memory Sense Amp training Error: Minor code:$1, Major code:$2 Processor:$3 Channel:$4 DIMM:$5".
· In the HDM Web interface, the system prompts "POST Error--- Warning Command Clock Training Error: Minor code:$1, Major code:$2 Processor:$3 Channel:$4 DIMM:$5".
Possible causes
· DIMMs are not installed by following the installation guidelines.
· The gold contacts are contaminated or have dust built up.
· DIMM failure.
· System board DIMM slot failure.
Solution
To resolve the issue:
1. Verify that the gold contacts on DIMMs are not oxidized and the DIMM slots do not contain foreign objects or dust. If any, clean the DIMMs and re-install them.
2. Verify that DIMMs are installed by following the installation guidelines, for example, processors corresponding to the DIMMs are in position, and no mixture of DIMMs of different models are installed. For more information, see the user guide for the server.
3. Replace the faulty DIMMs with new DIMMs. If the issue persists, replace the system board. If the issue is resolved, replace the DIMMs.
4. If the issue persists, contact Technical Support.
DIMM compatibility error in POST
Symptom
In the HDM Web interface, the system prompts "POST Error--- DIMM Compatible Error(0x01,0xED)".
As shown in Figure 89, BIOS displays an error message when an RDIMM and LRDIMM are installed on the same server.
Figure 89 RDIMM and LRDIMM mixture alarm
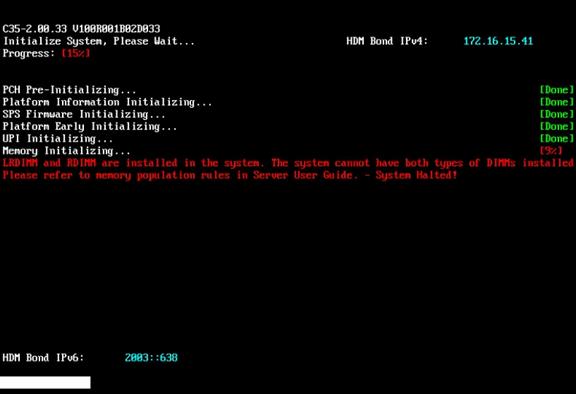
Possible causes
· An LRDIMM and RDIMM are installed on the same server.
· DIMM failure.
· DIMM compatibility.
Solution
To resolve the issue:
1. Identify the slot where the DIMM installation position error occurred.
2. For memory compatibility with servers, use compatibility query tools. If it is incompatible with the server, replace the DIMM.
For server and memory compatibility, use the query tool available from Query tool for server and component compatibility.
For memory compatibility with servers, use the query tool available from Query tool for server and component compatibility.
3. Re-install the DIMM by following the installation guidelines.
4. If the issue persists, contact Technical Support.
A correctable memory error occurred
Symptom
A correctable memory error occurred.
· A memory correctable training error occurred during the BIOS startup process. The server can correct the error and continue operation.
· A memory correctable training error occurred when the system was running. An alarm will be generated only when the number of correctable errors reaches the upper limit for one DIMM.
Possible causes
· A memory correctable error occurred during the memory initialization process.
· The number of correctable errors reached the upper limit for one DIMM.
Solution
This issue does not affect operation of the operating system. You do not need to handle this issue.
An uncorrectable DIMM error occurred
Symptom
An uncorrectable DIMM error occurred.
· A memory uncorrectable training error occurred during the BIOS startup process. The server disabled the channel where the DIMM resides and caused memory capacity decrease.
· A memory uncorrectable training error occurred when the system was running. The system handles this issue based on a specify policy, including system restart and suspend.
Possible causes
· DIMM failure.
· The processor corresponding to the DIMM or its socket is faulty.
· System board DIMM slot failure.
Solution
To resolve the issue:
1. Identify the slot where the faulty DIMM is located from the event logs on HDM.
2. Install the faulty DIMM on another channel. If the error occurs on the new slot where the faulty DIMM is located, replace the DIMM. If the error occurs on the original slot for the DIMM, examine the slot. If the slot has obvious damage, replace the system board.
3. Install a processor of the same model and identify whether the processor and its socket are faulty.
¡ If the error occurs on the new slot where the processor is located, replace the processor.
¡ If the error occurs on the system board, the pins on the socket are damaged. Replace the system board.
4. If the issue persists, contact Technical Support.
DIMM certification failure
Symptom
The system prompts "Memory is not certified ---$1-Location: CPU:$2 MEM CTRL:$3 CH:$4 DIMM:$5" on the HDM Web interface.
Possible causes
The DIMM is not certified.
Solution
To resolve the issue:
1. Replace the DIMM with a DIMM certified by H3C.
2. If the issue persists, contact Technical Support.
The memory capacity is smaller than the total capacity of DIMMs installed on the server
Symptom
· The total memory capacity displayed in the operating system is smaller than the total size of DIMMs installed on the server.
· The total memory capacity displayed in the HDM Web interface is smaller than the total size of DIMMs installed on the server.
Possible causes
· Memory failure caused the system to be unable to identify the memory.
· Gold contacts have poor contact and have dust built up.
· The memory model is incompatible with the server model.
· The DIMM is in Mirror or Memory Rank Sparing mode.
· DIMMs are not installed by following the installation guidelines.
· System board failure.
Solution
To resolve the issue:
1. Check the memory capacity:
¡ Using the operating system:
- In Windows, select Run in the Start menu, enter msinfo32, and verify the memory capacity of the DIMM.
- In Linux, execute the cat /proc/meminfo command to verify the memory capacity.
¡ Using HDM:
Log in to HDM and verify the memory capacity of the DIMM. For more information, see the HDM online help.
¡ Using BIOS:
- Intel processors: Access the BIOS, select Socket Configuration > Memory Configuration > Memory Topology, and press Enter. Then, verify the memory capacity of the DIMM.
- AMD processors: Access the BIOS, select Chipset > Socket 1 Information (Socket 2 Information). Then, verify the memory capacity of the DIMM.
2. Perform the following steps:
a. Compare the memory capacity displayed on HDM with the actual physical memory capacity to identify the position of the faulty DIMM.
b. Power off the server, remove and re-install the faulty DIMM and use alcohol to swipe the gold contacts.
c. Make sure the DIMM slot does not contain foreign objects.
d. For memory and processor compatibility with servers, use compatibility query tools.
- For server and component compatibility, use the query tool available from Query tool for server and component compatibility.
- For memory and processor compatibility with servers, use the query tool available from Query tool for server and component compatibility.
3. If the DIMM is in Mirror or Memory Rank Sparing mode, it is normal that the displayed capacity is smaller than the actual capacity.
Figure 90 Memory mode
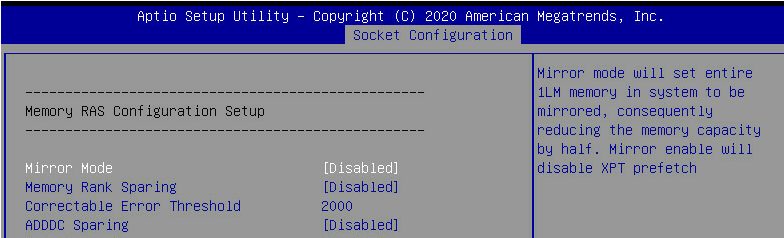
4. Verify that DIMMs are installed by following the installation guidelines, for example, processors corresponding to the DIMMs are in position, and no mixture of DIMMs of different models are installed. For more information, see the user guide for the server.
5. Identify whether a memory alarm is generated from HDM, and identify and troubleshoot the issues accordingly.
6. Contact Technical Support if required.
PMem DIMM issues (Intel processors)
PMem DIMMs include DCPMM DIMMs (PMem 100) and PMem 200 DIMMs.
PMem DIMM installation guidelines
· Wear antistatic clothing. Wear an ESD wrist strap and make sure it makes good skin contact and is reliably grounded. Do not wear any conductive objects, such as jewelry or watches.
· Examine the slot and connector for damages. Make sure the pins are not damaged (bent for example) and do not contain any foreign objects.
· To avoid damage to the DIMM, always hold the DIMM by its edges.
· Never touch the gold contacts on the DIMM bottom.
· Do not bend the DIMM.
· PMem DIMMs are not hot swappable.
· Make sure the corresponding processors are present.
· Make sure all DRAM DIMMs have the same product code and all PMem DIMMs have the same product code.
· As a best practice to increase memory bandwidth, install DRAM DIMMs and PMem DIMMs in different channels.
· For more information, see the user guide for the server.
PMem DIMM installation error
Symptom
· BIOS POST prompted an error message as shown in Figure 91.
Figure 91 PMem DIMM installation error
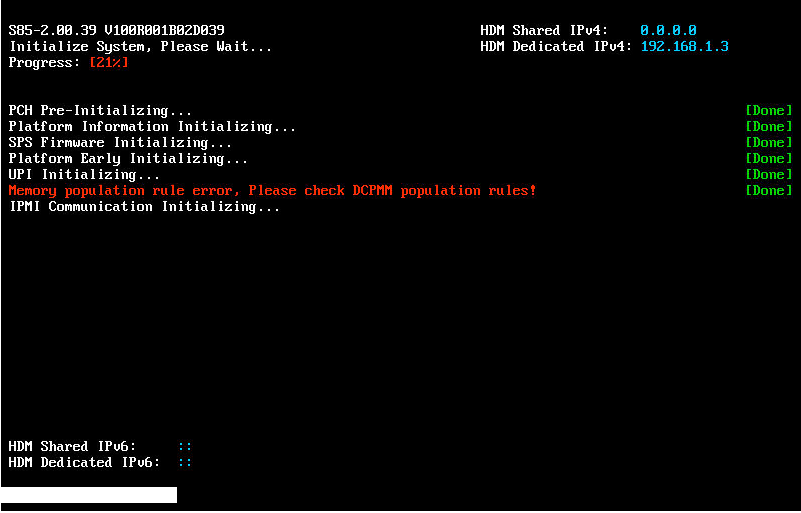
· HDM displays error information.
Figure 92 Displaying HDM health log
![]()
· System suspension or black screen occurred.
Possible causes
· The number of PMem DIMMs installed on the server is incorrect.
· DIMMs not supported are installed on the server.
· DIMMs of different types are installed on the server.
· PMem DRAM DIMMs are not installed by following the installation guidelines.
· Processor 1 is not installed with any DRAM DIMM.
Solution
To resolve the issue:
1. Verify that the PMem DIMMs are installed by following the installation guidelines.
2. Remove the PMem DIMMs that do not meet installation requirements and re-install them.
3. If the issue persists, contact Technical Support.
A PMem DIMM is disabled
Symptom
BIOS POST prompts a PMem DIMM is disabled.
Figure 93 PMem DIMM error
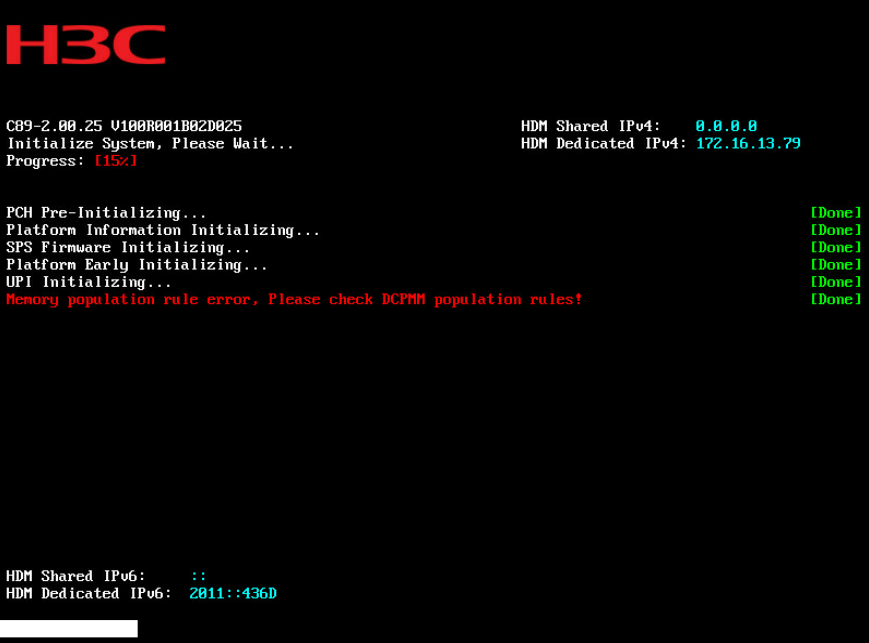
Possible causes
· Installation of the PMem DIMM is incorrect.
· A new PMem DIMM is available only after reconfiguration.
· PMem DIMM firmware versions are inconsistent.
Solution
To resolve the issue:
1. Verify that all PMem DIMMs are installed by following the installation guidelines. For more information, see the user guide for the server.
2. Back up all memory data on the old PMem and then create target configuration. The system deletes all namespaces, areas, and data on the PMem of the processor during the configuration creation process. Perform this operation with caution.
3. Identify whether all PMem DIMMs use the same firmware version. If they are not the same, update the firmware versions to the most recent version. If they are the same, go to the next step.
Figure 94 Displaying Mem DIMM firmware versions
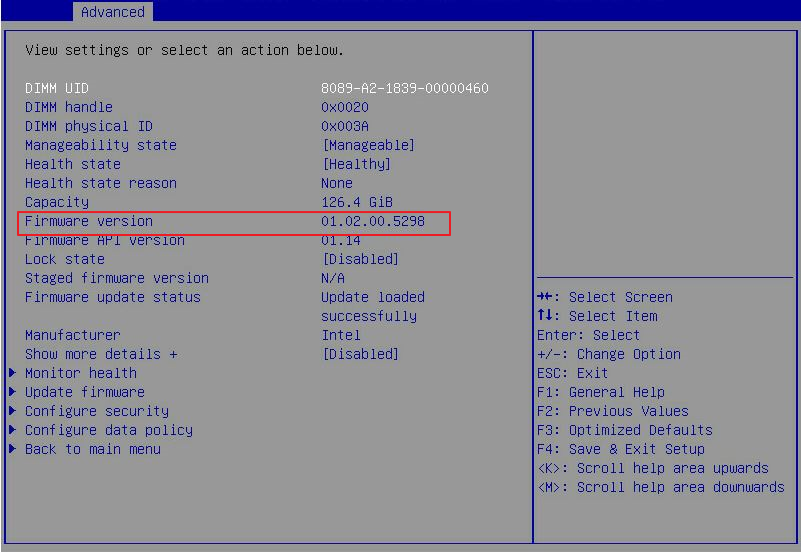
4. If the issue persists, contact Technical Support.
A PMem DIMM is not displayed in the operating system
Symptom
A PMem DIMM is not displayed in the operating system.
Possible causes
The PMem DIMM has uncorrectable errors.
Solution
To resolve this issue:
1. Replace the PMem DIMM, and update its firmware version to ensure that all PMem DIMMs have the same firmware version.
2. If the issue persists, contact Technical Support.
Processor issues
Troubleshooting guidelines
· To avoid damage to a processor or the system board, be sure that only H3C authorized or professional server engineers can install, replace, or remove a processor.
· Take the following ESD prevention measures:
¡ Wear antistatic clothing.
¡ Wear an ESD wrist strap and make sure it makes good skin contact and is reliably grounded.
¡ Do not wear any conductive objects, such as jewelry or watches.
· For the server to operate correctly, make sure processor 1 is in position.
· Make sure the processors on the server are the same model.
· To protect the pins in a process socket, install a protective cover if the processor socket is empty.
· The pins in the process socket are fragile and easily damaged. Never touch them. Be sure that the pins are not damaged and no foreign objects will intrude into the socket.
· When removing the protection cover from a process socket, be careful and make sure your ESD gloves will not touch the pins in the socket.
· An AMD process comes with a tray. You must use the tray to install the processor. Do not install the processor in the socket without using the tray.
Configuration error (Intel processors)
Symptom
A processor configuration error message is displayed on the HDM Web interface.
· Processor UPI error message, for example:
Configuration error ---CPU UPI errors ---Location: Processor:$1 UPI port number:$2
· VT-D error message, for example:
Configuration error ---Location: Processor:$1---IIO Stack number: $2 -- Current/Last Boot $3
· Processor error message, for example:
Configuration error ---CPU core errors --- ---Location: Processor:$1 core MCA bank: $2"
If the value of the ErrorType field is Fatal as shown in the following message, the error cannot be corrected and the server will be rebooted:
Configuration error---CPU core errors--ErrorType:Unknown--Fatal Error---Location: Processor:1 core MCA bank: integrated I/O controller
If the value of the ErrorType field is Corrected/Correctable or the ErrorType field is not displayed as shown in the following message, the error is correctable and the server will not be rebooted:
Configuration error---CPU core errors---Location: Processor:1 core MCA bank: integrated I/O controller
Possible causes
· The firmware or driver version of the network adapters is too low or is incompatible with the operating system.
· The HDM and BIOS versions are too low.
· To adapt to and ensure high-speed data processing, the processor corrects some parameters when the environment of the equipment room changes or the service load fluctuates, for which a message that indicates an uncorrectable error is displayed. This is a normal operation of the processor, and no action is required.
· The processor is faulty.
· The process fails to access data on a component such as memory, network adapter, GPU, or storage controller.
Solution
· VT-D error
To resolve the issue:
a. View the event logs to determine whether a network adapter error has reported.
b. If a network adapter is faulty, use the query tools available from Query tool for server and component compatibility and Query tool for server and component compatibility to verify the compatibility of the network adapter with the server and the OS.
c. If the OS is compatible with the OS and server, update the firmware and driver of the network adapter to the latest version.
· Other error than VT-D error
To resolve the issue:
View the event logs at the time when the issue occurred to determine whether an exception has occurred on the server.
¡ If an exception has occurred on the server, contact Technical Support.
¡ If no exception has occurred and the server has not rebooted, update HDM to 1.11.35P02 or later and update the BIOS to a compatible version simultaneously. For the compatible BIOS versions, see the HDM user guide.
MCA alarm (Intel processors)
Symptom
When an uncorrectable error occurs on any processor of the server, the system might restarts automatically.
A Machine Check Architecture (MCA) alarm message is displayed on the HDM Web interface.
· MCA error message, typically started with MSMI/CATERR IERR/MCERR.
· UPI error message, with the sensor state change to Fatal.
· MCA faulty message, with the sensor state changed to Emergency.
Possible causes
· Processor error
The instruction fetch unit (IFU), data cache unit (DCU), data translation look-aside buffer (DTLB), power control unit (PCU), integrated I/O controller (IIO), coherency and home agent (CHA), or ultra path interconnect (UPI) of the processor is faulty.
· Access failure of the processor to a hardware component such as memory, PCIe module, and system board because the component is faulty.
· Access failure of the processor to a software such as the driver of the network adapter or storage controller because the software is faulty.
Solution
To resolve the issue:
1. If the MCA alarm is reported accidentally, contact Technical Support.
2. If the MAC alarm is reported repeatedly, configure the server with the minimum configuration to reproduce the issue. For configuring the server with the minimum configuration, see "Breaking server down to the minimum hardware configuration."
¡ If the issue is produced, the process, memory, or system board is faulty, go to step 3.
¡ If the issue is not produced, the other component such as storage controller is faulty, contact Technical Support.
3. Swap the processor with another one of the same model.
¡ If the issue persists with the original processor, the processor is faulty. Replace the processor.
¡ If the issue does not go along with the original process, the process is good. Contact Technical Support to troubleshoot the memory and system board.
MCA alarm (AMD and Hygon processors)
Symptom
When an uncorrectable error occurs on any processor of the server, the system might restarts automatically.
A Machine Check Architecture (MCA) alarm message is displayed on the HDM Web interface.
· MCA error message, typically started with Machine Check Exception.
· XGMI error message, with the sensor state change to Emergency.
· MCA faulty message, with the sensor state changed to Emergency.
Possible causes
· Processor error. The LS, IF, L2, DE, EX, FP, or L3 of the processor is faulty.
· Access failure of the processor to a hardware component such as memory, PCIe module, and system board because the component is faulty.
· Access failure of the processor to a software such as the driver of the network adapter or storage controller because the software is faulty.
Solution
To resolve the issue:
1. If the MCA alarm is reported accidentally, contact Technical Support.
2. If the MAC alarm is reported repeatedly, configure the server with the minimum configuration to reproduce the issue. For configuring the server with the minimum configuration, see "Breaking server down to the minimum hardware configuration."
¡ If the issue is produced, the process, memory, or system board is faulty, go to step 3.
¡ If the issue is not produced, the other component such as storage controller is faulty, contact Technical Support.
3. Swap the processor with another known functional one of the same model.
¡ If the issue persists with the original processor, the processor is faulty. Replace the processor.
¡ If the issue does not go along with the original process, the process is good. Contact Technical Support to troubleshoot the memory and system board.
High temperature
Symptom
The temperature of a processor is too high and exceeds a threshold. A processor overtemperature alarm is reported on the HDM Web interface.
· Thermal trip alarm—Processor core high temperature alarm of emergency severity. The operating system will be shut down.
· CPU Critical Temperature alarm—Processor core high temperature alarm of emergency severity. The processor frequency will be reduced, or the operating system will be shut down.
· PROCHOT alarm—Processor high temperature alarm of critical severity. The processor frequency will be reduced.
· TCC Activation alarm—Processor temperature rising alarm of minor severity
Possible causes
· The fan module mode is set incorrectly on the HDM or the fan module fails, causing the server temperature to rise.
· The temperature of the operating environment exceeds the threshold.
· The service load of the processor is unstable, causing transient overtemperature.
· The processor or temperature sensor is faulty.
· The air inlets and outlets of the server are blocked.
Solution
To resolve the issue:
1. Access HDM and select Dashboard > Sensors > Fans to check the fan status. If the fan status is normal, go to step 2. If the fan status is faulty, remove and reinstall the fan, or replace the fan with a new one.
2. Change the fan settings and increase the mute level to increase the fan speed.
3. Check whether the service load of the system is too large, and stop non-emergency services to reduce business load.
4. Be sure that the operating environment temperature is within the acceptable range. For the operating environment requirements, see the user guide for the server.
5. Check whether the air inlets and outlets of the server are blocked. Remove the obstruction, if any.
6. Power off the server and check whether the processor heatsink is in poor contact. Reapply thermal grease on the heatsink and then reinstall the heatsink.
7. If the issue persists, contact Technical Support.
Server startup process stuck at the UPI initializing stage (Intel processors)
Symptom
· UPI mismatch, processor stepping mismatch, or processor frequency mismatch message is displayed in the BIOS.
· A mismatch alarm for a processor, for example, "Mismatch—UPI topology is detected." is reported on the HDM Web interface.
Possible causes
· The processor models on the server are not the same.
· The processor is faulty.
Solution
To resolve the issue:
1. Access the HDM Web interface and select Dashboard > Hardware Summary > Processors to check whether the processor models are the same. Be sure that the processors are the same model.
¡ If all processors are recognized, contact Technical Support.
¡ If a processor is not recognized, reinstall the processor. If the processor still cannot be recognized after reinstallation, contact Technical Support.
High processor load factor when the system has the minimum load
Symptom
The processor load factor is too high when the system has the minimum load. As shown in Figure 95, a server installed with the CentOS 7.3 operating system gets stuck when it has a minimum service load. The top command output shows that the wa (wait) value is too high.
Figure 95 Too high processor load factor
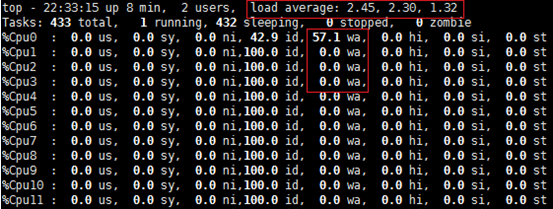
Possible causes
· The driver version of the PMC HBA-1000 storage controller is too low.
· Other unknown reasons.
Solution
If the server is installed with a PMC HBA-1000 storage controller, upload the storage controller driver to the latest version:
This example updates the PMC HBA-1000 storage controller in the CentOS 7.3 operating system.
1. Use the cat /sys/module/aacraid/versio or modinfo aacraid command to identify the driver version of the PMC HBA-1000 storage controller
2. Obtain the latest version of driver compatible with the PMC HBA storage controller from the H3C official website. As shown in Figure 96, execute the rpm command to install the driver for the PMC HBA storage controller and then reboot the operating system.
Figure 96 Using the rpm command to install the driver for the PMC HBA storage controller
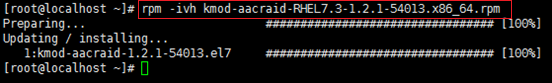
3. Review the load factor of the processor again to determine whether it restores to normal. If the issue persists, contact Technical Support.
Figure 97 Using the top command to view the load factor of the processor
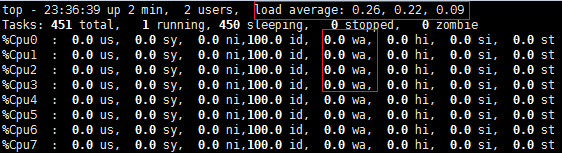
Security bug
Symptom
The vulnerability scanning tool detects vulnerability in the processor.
Possible causes
· Processor microcode defect.
· The server has been maliciously attacked.
· Other unknown reasons.
Solution
To resolve the issue:
1. Upload the BIOS to the latest version released from the H3C official website. Update processor microcode timely.
2. Install the latest patch for the operating system. To obtain the patch and its installation method, visit the official website of the operating system.
3. Upgrade the browser to the latest version.
4. If the issue persists, contact Technical Support.
Encryption module issues
TPM/TCM faulty or not recognized
Symptom
· The BIOS setup utility detects that the TPM is not in place or not usable .
· The operating system detects that the TPM is faulty or not usable.
Possible causes
· The TPM or TCM is faulty.
· The TPM is configured incorrectly in the BIOS setup utility.
· The BIOS startup mode is configured incorrectly. In legacy mode, only TPM 1.2 running mode is supported, and TPM 2.0 is not supported.
· No driver has been installed for the TCM module.
Solution
To resolve the issue:
1. Be sure that the TPM or TCM has been installed correctly and securely.
2. Start the server and enter the BIOS Setup utility to make sure the TPM has been enabled or the TCM is in active state.
3. If TPM 2.0 is installed, make sure the server is in UEFI boot mode.
4. Be sure that the TMP firmware has been updated to the latest version, as shown in Figure 98.
Figure 98 Viewing the TPM firmware version
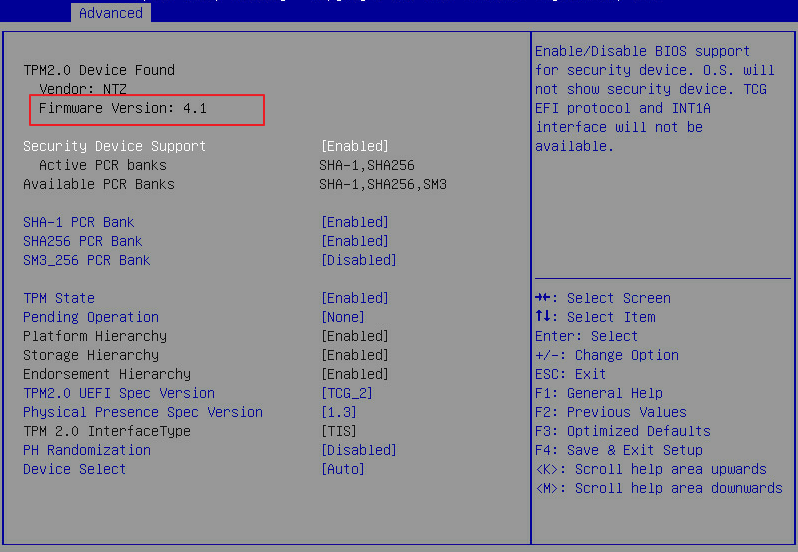
5. Reboot the operating system. Be sure that the TPM/TCM is configured correctly, matching the operating system release version.
6. If a TCM module is used, be sure that the driver for the TCM module functions correctly.
7. If a message "The TPM is available, but the function is missing" is displayed, the system might be reinstalled without clearing the TPM. Perform the following tasks:
|
|
CAUTION: Clearing the TPM resets it to an unowned state and might cause data loss. To avoid data loss, make sure you have a backup and recovery method for any data protected or encrypted by the TPM. |
a. Clear and initialize the TPM.
b. Be sure that the TPM settings are correct in the BIOS setup utility.
c. If the issue persists, clear the TPM again and reinstall the operating system.
System battery issues
Power insufficient or exhausted
Symptom
The sensor detects that the power of the system battery is insufficient or exhausted. An alarm of major severity is generated and an event log is reported on the HDM.
Possible causes
The power of the system battery is insufficient or exhausted.
Solution
To resolve the issue:
1. Power off the server safely.
2. Wear anti-static gloves to replace the system battery. For the replacement procedure and precautions, see the user guide for the server.
3. Power on the server safely. Then log in to the HDM Web interface and check whether the alarm log is cleared.
4. If the alarm persists, contact Techical Support.
System board issues
System board failure
Symptom
· The server has a failure, for example, a startup failure or stuck in initialization.
· A system board alarm event is reported on the HDM Web interface.
Possible causes
The system board is faulty.
Solution
To resolve the issue:
1. (Optional.) If the server fails to start up because a high-risk operation (such as hot swapping a PCIe modules that is not hot swappable and forcibly powering off the server) is performed during the normal operation of the server, perform the following tasks:
a. Power off the server and remove the system battery from the system board.
b. Wait for 1 minute.
c. Reinstall the system battery on the system board.
d. Power on the server.
If the issue exists, go to step 2.
¡ If such an alarm information exits, check whether the component is installed securely.
- If the component is not installed securely, reinstall the component and be sure that the cables for the component are correctly securely and correctly.
- If the component is installed securely, swap the component with one that functions correctly. If the issue goes with the original component, the component is faulty. If the issue does not go with the original component, the issue is not caused by the component. Go to step 3.
¡ If no such an alarm information exists, go to step 3.
3. Swap the system board with another one that functions correctly.
¡ If the issue is cleared, the original system board is faulty. Replace it.
¡ If the issue persists, collect HDM SDS logs and contact Technical Support.
Drive backplane issues
Drives not recognized
Symptom
· Some or all drives are not recognized by the BIOS.
· Information about some or all drives is not displayed in the HDM web interface.
· As shown in Figure 99, the power status LED on the drive backplane is off. The location of the power status LED varies by drive backplane.
Figure 99 Drive backplane LEDs
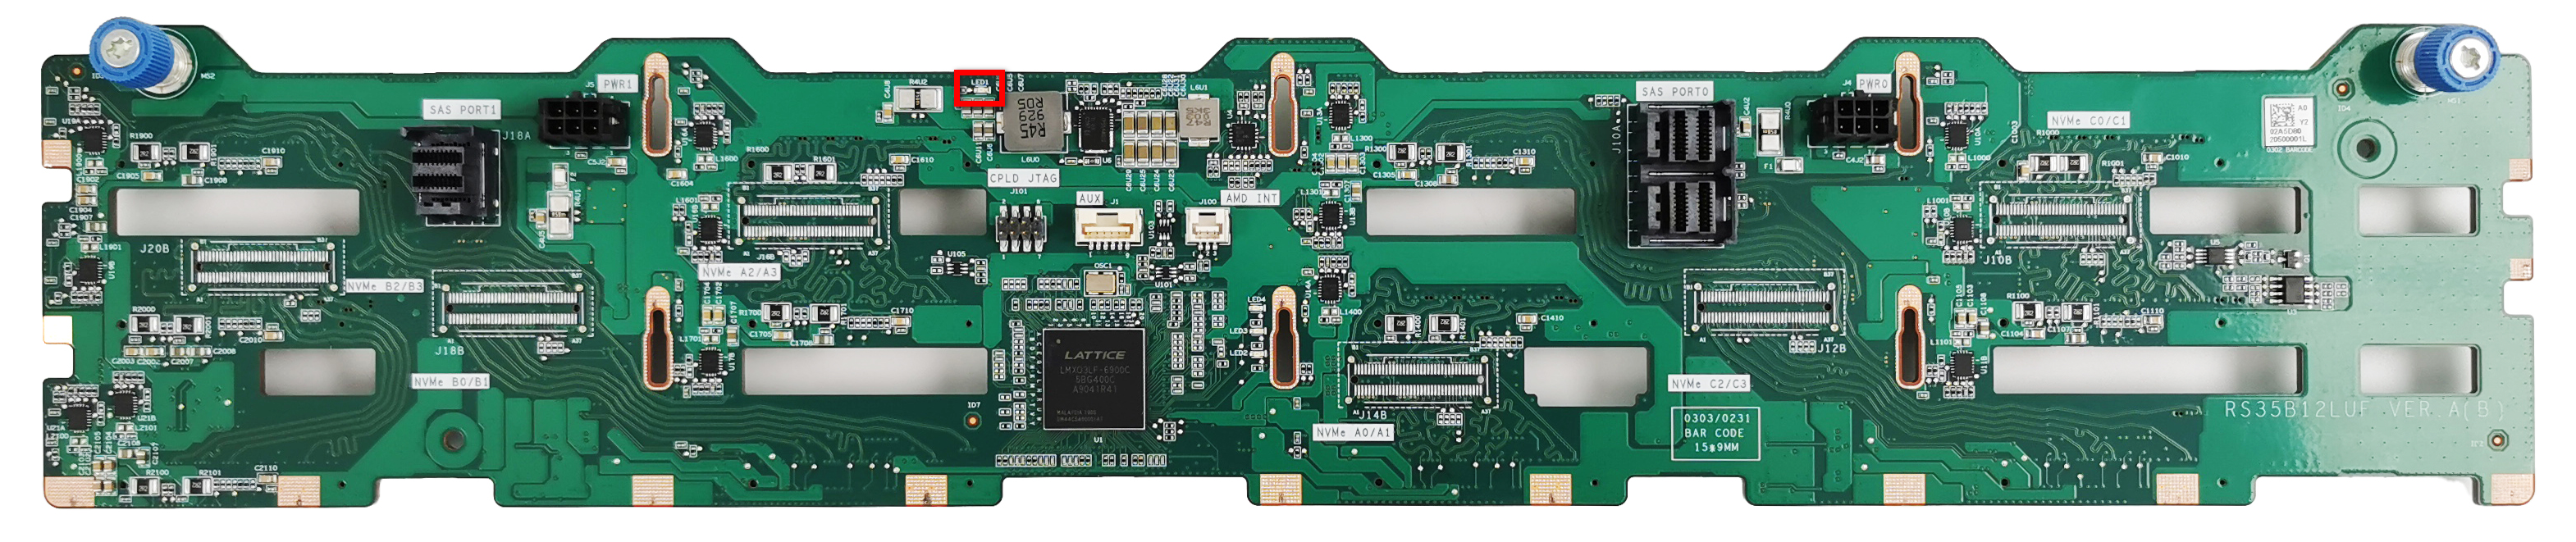
Possible causes
· The cables on the drive backplane are not connected correctly or securely.
· The drive backplane is not installed correctly.
· The drive backplane is faulty.
· The cables on the drive expander module are not connected correctly or securely.
· The drive expander module is not installed correctly.
· The drive expander module is faulty.
· The cables connection on the storage controller or NVMe SSD expander module is loose.
· The CPLD of the drive backplane is abnormal.
Solution
To resolve the issue:
1. (Optional) Update the CPLD version of the drive backplane from the HDM interface.
2. Be sure that the connectors on the drive backplane and peer connectors on the system board are intact and not damaged.
3. Be sure that the drive backplane is installed correctly in place and the cables are connected correctly and securely. For information about installing the drive backplane and connecting the cables for the drive backplane, see the user guide for the server.
4. (Optional.) If the drive backplane is used together with a drive expander module, perform the following tasks:
a. Be sure that the drive expander module is installed correctly in place and the cables are connected correctly and securely. For information about installing the drive expander module and connecting cables for the drive expander module, see the user guide for the server.
b. Be sure that the connectors on the drive expander module are intact and undamaged, and the connections between the drive expander module and the drive backplane are correct and secure.
c. Replace the drive expander module with a known functional drive expander module of the same model. If the issue is cleared, the original drive expander module is faulty. Replace it. If the issue persists, the issue is not caused by the drive expander module, go to step 5.
5. Replace the drive backplane with a known functional drive backplane of the same model.
¡ If the issue is cleared, the original drive backplane is faulty. Replace it.
¡ If the issue persists, contact Technical Support.
Multifunctional rack mount ears issues
A device connected to the multifunctional rack mount ears is not recognized
Symptom
· A device (such as a keyboard, mouse, or USB drive) connected to the USB port or the management port on the multifunctional rack mount ears is not recognized by the operating system.
· A device (such as a keyboard, mouse, or USB drive) connected to the USB port or the management port on the multifunctional rack mount ears is not recognized by the BIOS.
Possible causes
· The USB port function on the multifunctional rack mount ears is not enabled in the BIOS. Any device connected to the ears will be disabled.
· The external device is faulty.
· The mount ears cables are not correctly connected to the system board or the cable connection is loose.
· The I/O connector on the system board connected to multifunctional rack mount ears is faulty.
Solution
1. Enable the USB port function on the multifunctional rack mount ears in the BIOS.
The R4900 G3 server is used in this example.
a. Power on the server and press Del or Esc to enter the BIOS setup utility. Then select Platform Configuration > PCH Configuration > USB Configuration, and set the USB Per-connector Disable option to Enabled, as shown in Figure 100.

a. Set the following options to Enabled to enable all USB ports on the multifunctional rack mount ears, as shown in Figure 100.
- Front Left Top USB Port 2.0 Capability
- Front Right USB Port 2.0 Capability
- Front Right USB Port 3.0 Capability
b. Press F4 to save the configuration and reboot the server.
2. Replace the device with a known functional one.
¡ If the issue is cleared, the original device is faulty. Replace it.
¡ If the issue persists, go to step 3.
4. Check and make sure the pins of the connector on the system board are abnormal, not bent or damaged.
5. Replace the multifunctional rack mount ears with known functional ears.
¡ If the issue is cleared, the original multifunctional rack mount ear kit is faulty. Replace it.
¡ If the issue persists, contact Technical Support.
SD card issues
SD card not recognized
Symptom
An SD card is not recognized by the BIOS.
Possible causes
· The SD card extended module is not installed correctly and securely.
· Foreign objects exist on the SD card extended module.
· The SD card is not installed correctly and securely.
· The SD card is faulty.
· The SD card slot on the system board is faulty.
Solution
To resolve the issue:
1. Be sure that the SD card extended module is installed correctly. The SD card extended module will not be recognized if it is not installed correctly and securely and has a poor contact. In this case, remove the SD card extended module, clean it and ensure it is free of foreign objects, then reinstall it. Access the HDM Web interface to check whether the extended module is recognized.
¡ If the SD card extended module is present, go to step 2.
¡ If the SD card extended module is not present, it is still not recognized by the system. Replace the SD card extended module with a known functional SD card extended module of the same model.
- If the SD card slot status is present, the original SD card extended module is faulty. Replace it. Then go to step 2.
- If the SD card slot status is present, the SD card slot on the system board is faulty. Contact Technical Support.
|
|
NOTE: Skip this step for a server that uses AMD processors. |
2. Be sure that the SD card can be recognized by the BIOS.
a. Power on the server and press Del or Esc to enter the BIOS Setup utility.
b. Select Advanced > USB Configuration and check whether the SD card (CYP RAIDUSB RAID LUN in this example) is recognized. If the SD card is not recognized, go to step 3.
Figure 101 Checking whether the SD card is recognized

3. Replace the SD card with a known functional SD card.
¡ If the issue is cleared, the original SD card is faulty. Replace it.
¡ If the issue persists, contact Technical Support.
Operating system fails to boot from the SD card
Symptom
The operating system installed on the SD card fails to boot from the SD card after the server is powered up.
Possible causes
· The SD card is not set as the first boot option in the BIOS.
· The operating system on the SD card is damaged.
· The SD card is faulty.
· The SD card slot on the system board is faulty.
Solution
To resolve the issue:
1. Be sure that the SD card can be recognized. If it fails to be recognized, see "SD card not recognized."
2. Power on the server and press F7 to enter the boot menu. Check whether the SD card exists and is the first boot option.
As shown in Figure 102, the SD card, CYP RAIDUSB RAID LUN in this example, exists and is the first boot option.
Figure 102 Checking the SD card in the boot menu
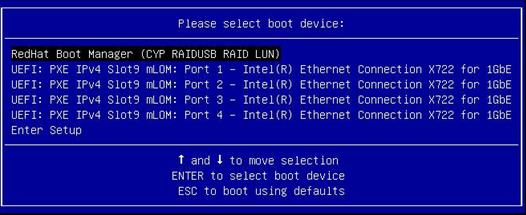
¡ If the SD card exists but is not the first boot option, restart the server. Then press Del or Esc to enter the BIOS Setup utility. Select Boot > Fixed Boot Order Priorities > Boot Option #1 and then press Enter to set the SD card (in the hard disk boot option category) as the first boot option, as shown in Figure 103.
Figure 103 Setting the SD card as the first boot option
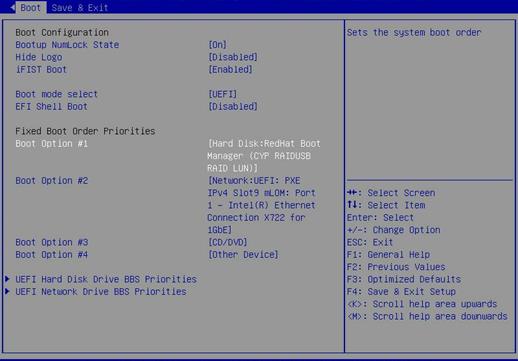
¡ If the SD card exists and is the first boot option, the operating system in the SD card is damaged. Reinstall the operating system.
3. If the issue persists, the SD card slot on the system board is faulty, contact Technical Support.
USB device issues
USB device not recognized
Symptom
A USB device connected to a USB port on the server is not recognized by the BIOS or operating system.
If a USB device connected to a USB port on the multifunctional rack mount ears is not recognized, see "A device connected to the multifunctional rack mount ears is not recognized."
Possible causes
· The USB device is faulty.
· The USB ports on the server are not enabled in the BIOS. Any USB devices connected to the USB ports will be disabled.
· The USB port on the system board is faulty.
Solution
To resolve the issue:
1. Enable all USB ports in the BIOS of the server.
A R4900 G3 server is used in this example.
a. Start the server and press Del or Esc to enter the BIOS setup utility.
b. Select Platform Configuration > PCH Configuration > USB Configuration and then set USB Per-connector Disable to Enabled, as shown in Figure 104.
Figure 104 Setting USB Per-connector Disable to Enabled in the BIOS setup utility
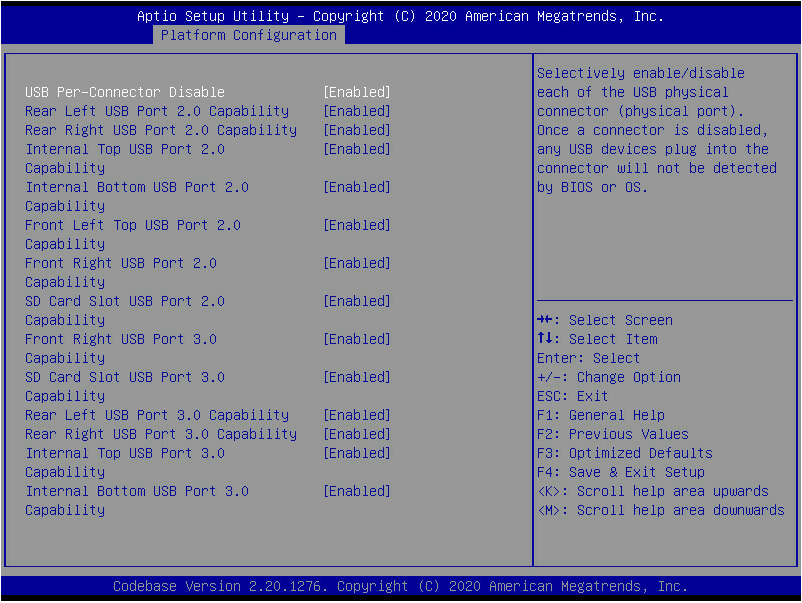
a. Set all the other USB port options to Enabled to enable all USB ports on the server.
b. Press F4 to save the configuration and then restart the server.
2. Replace the USB device with one that functions correctly.
¡ If the issue is cleared, the original USB device is faulty. Replace it.
¡ If the issue persists, the USB connector on the system board is faulty, contact Technical Support.
Operating system fails to boot from a USB drive
Symptom
The operating system installed on a USB drive fails to boot from the USB drive after the server powers up.
Possible causes
· The USB port functions are not enabled in the BIOS. Any USB connected to the USB port will be disabled.
· The USB drive is faulty.
· The operating system in the USB drive is damaged.
· The USB drive is not set as the first boot option in the BIOS.
· The USB connector on the system board is faulty.
Solution
To resolve the issue:
1. Enable the USB port in the BIOS setup utility. For more information, see step 1 in "USB device not recognized."
2. Install the USB drive on another server of the same model to check whether the USB drive is faulty and whether the operating system can boot from it.
3. Be sure that the USB drive can be recognized by the BIOS. If it is not recognized by the BIOS, connect the USB drive to another USB port or replace the USB drive.
To check whether the USB drive can be recognized by the BIOS:
a. Power on the server. Then press Del or Esc to enter the BIOS setup utility.
b. Select Advanced > USB Configuration to identify whether the USB drive is recognized, as shown in Figure 105.
Figure 105 Viewing the USB devices recognized by the BIOS
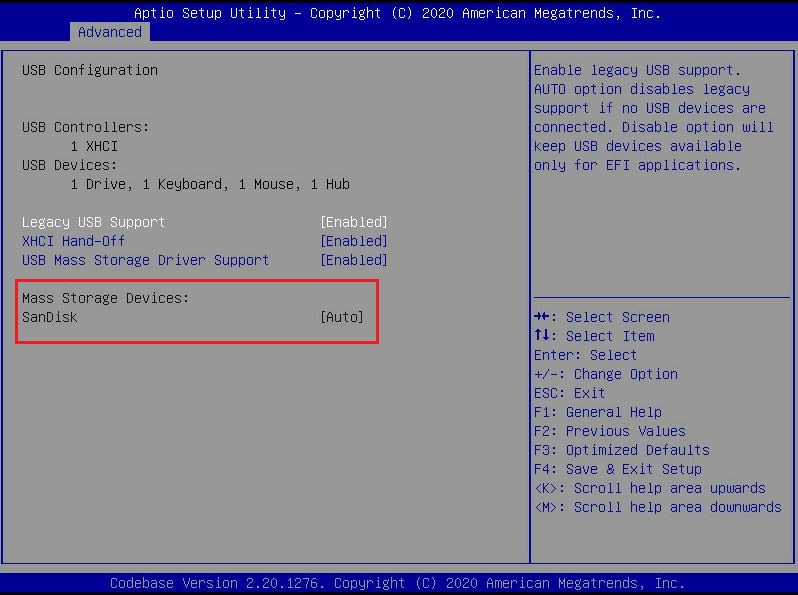
4. Power on the server and press F7 to enter the boot menu. Check whether the USB drive exists and is the first boot option.
As shown in Figure 106, the USB drive, KingstonDataTraveler 3.0PMAP, Partition 1 in this example, exists and is the first boot option.
Figure 106 Checking the USB drive in the boot menu
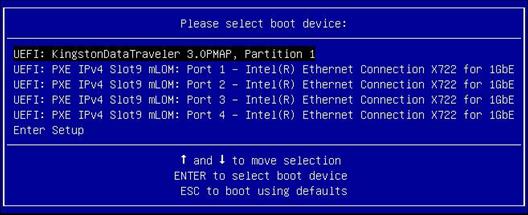
¡ If the USB drive exists but is not the first boot option, restart the server. Then press Del or Esc to enter the BIOS Setup utility. Select Boot > Fixed Boot Order Priorities > Boot Option #1 and then press Enter to set the USB drive (in the hard disk boot option category) as the first boot option, as shown in Figure 107.
Figure 107 Setting the USB drive as the first boot option
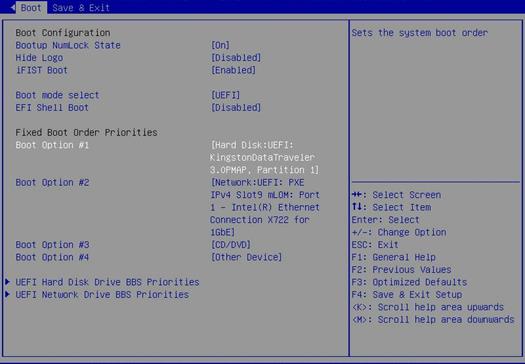
¡ If the USB drive exists and is the first boot option, or the USB drive does not exist, the operating system in the USB drive is damaged. Reinstall the operating system.
5. If the issue persists, the USB connector on the system board is faulty, contact Technical Support.
Optical disk driver issues
|
|
NOTE: Support for optical disk drivers depend on the server model. |
SATA optical disk driver is not recognized
Symptom
The SATA optical disk driver is not recognized by the BIOS or operating system.
Possible causes
· sSATA controller is not enabled in the BIOS setup utility.
· Link failures caused by driver cable or connector damage or loose cable connection.
· The pins of the SATA connector on the system board are bent.
· The optical disk driver is not installed correctly or securely.
· The optical disk driver is faulty.
Solution
To resolve the issue:
1. Power on the server and press Del or Esc to enter the BIOS setup utility. Then select Platform Configuration > PCH Configuration > PCH sSATA Configuration and set the sSATA Controller option to Enabled. Then press F4 to save the configuration and reboot the server.
Figure 108 Setting the sSATA Controller option to Enabled
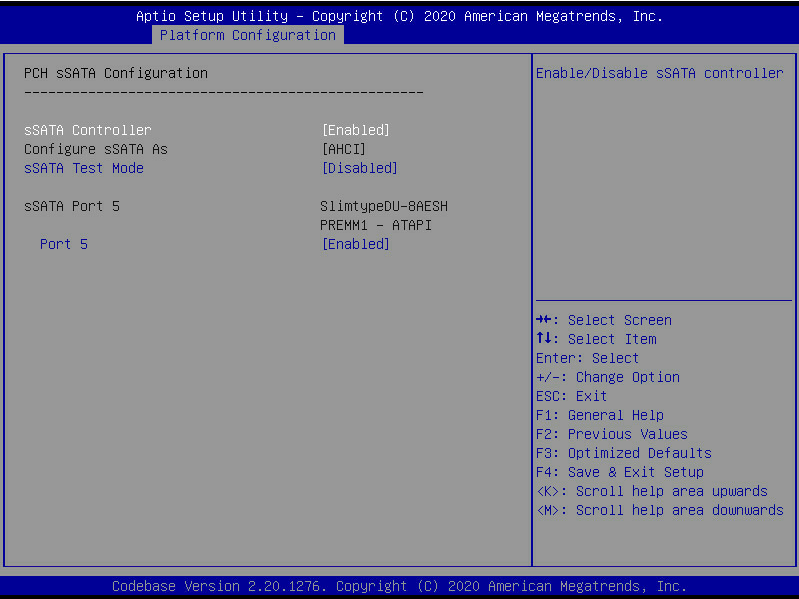
2. Be sure that the optical disk driver cable and connector are intact and undamaged, and the pins of the SATA connector on the system board are not bent.
3. Be sure that the optical disk driver cable is connected to the SATA connector on the system board correctly and the connection is firm and secure.
4. Replace the optical disk driver with a known functional one.
¡ If the new optical disk driver is recognized, the original optical disk driver is faulty. Replace it.
¡ If the new optical disk driver is recognized, contact Technical Support.
SATA optical disk driver is not recognized (AMD and Hygon processors)
Symptom
The SATA optical disk driver is not recognized by the BIOS or operating system.
Possible causes
· sSATA controller is not enabled in the BIOS setup utility.
· Link failures caused by driver cable or connector damage or loose cable connection.
· The pins of the SATA connector on the system board are bent.
· The optical disk driver is not installed correctly or securely.
· The optical disk driver is faulty.
Solution
To resolve the issue:
1. Power on the server and press Del or Esc to enter the BIOS setup utility. Select Advanced > AMD CBS > FCH Common Options > SATA Configuration Options and set the SATA Enable option to Enabled. Then press F4 to save the configuration and reboot the server.
Figure 109 Setting the SATA Controller option to Enabled
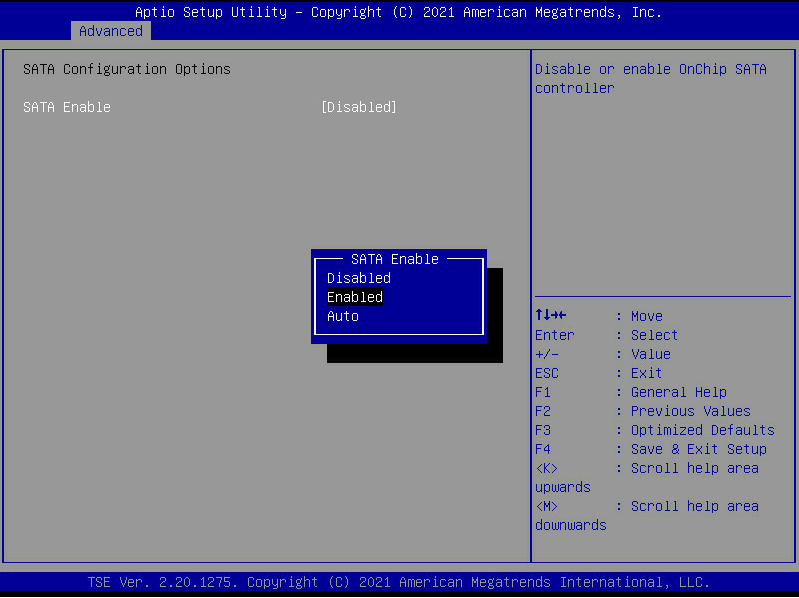
2. Be sure that the optical disk driver cable and connector are intact and undamaged, and the pins of the SATA connector on the system board are not bent.
3. Be sure that the optical disk driver cable is connected to the SATA connector on the system board correctly and the connection is firm and secure.
4. Replace the optical disk driver with a known functional one.
¡ If the new optical disk driver is recognized, the original optical disk driver is faulty. Replace it.
¡ If the new optical disk driver is not recognized, contact Technical Support.
GPU module issues
GPU module not recognized
Symptom
A GPU module fails to be recognized by the system.
Possible causes
· The GPU power cord does not match the GPU module.
· The GPU module does not match the riser card.
· The riser card or riser card slot is faulty.
· Incorrect parameters settings exist in the BIOS, causing failure of the operating system to recognize the GPU module.
· The BIOS firmware version does not support the GPU module.
· The GPU module is not faulty.
Solution
To resolve the issue:
1. Be sure that the GPU power cord matches the GPU module. For the compatibility between the GPU power cords and GPU modules, see the user guide for the server.
2. Be sure that the GPU module matches the riser card. For the compatibility between the GPU modules and riser cards, see the user guide for the server.
3. (Optional.) For a NVIDIA Tesla GPU module, you must access the BIOS Setup utility and select Advanced > PCI Subsystem settings and set the Above 4G Decoding status to Enabled. If the status is Disabled, the operating system and HDM cannot recognize the GPU module.
Figure 110 Setting Above 4G Decoding to Enabled
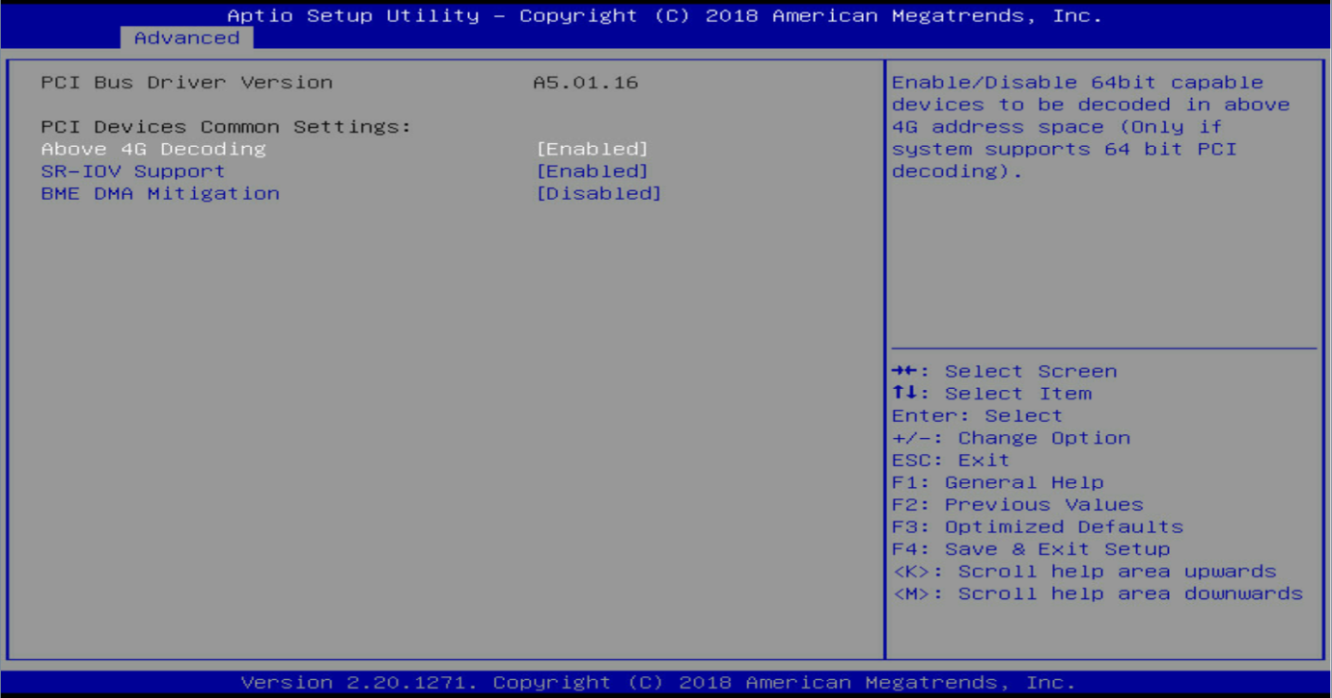
4. Update the BIOS to the latest version released from the H3C official website. If the BIOS version is too low, the operating system and HDM might fail to recognize the GPU module. After the update, verify that the GPU module can be recognized.
Figure 111 Viewing the BIOS version
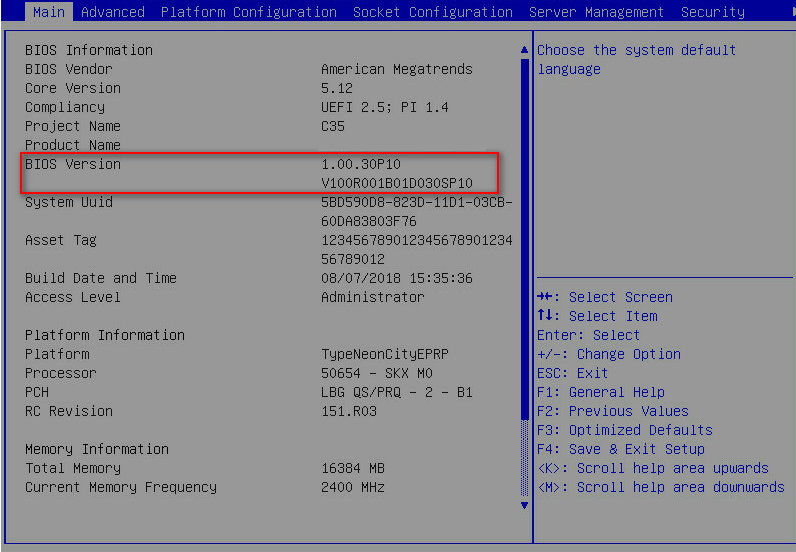
5. Replace the riser card with a known functional riser card to check whether the riser card or the riser card slot is faulty. Replace the GPU mode with a known functional GPU module to check whether the GPU module is faulty. If one of the components is faulty, replace it.
6. If the issue persists, contact Technical Support.
Graphs not displayed as expected
Symptom
Graphs are not displayed as expected.
Possible causes
· The server power is insufficient.
· The GPU module power cord is not connected.
· The server does not support the GPU module.
· The GPU module is faulty or not installed correctly and securely.
Solution
To resolve the issue:
1. Be sure that the power provided by the power supplies and cooling conditions meet the requirements of the server.
2. (Optional.) If the power of the GPU module exceeds 75 W, be sure that the GPU module power cord is connected.
3. Check whether the monitor device is connected to the VGA connector on the system board or the GPU module.
As shown in Figure 112, enter the BIOS setup utility and select Platform Configuration > Miscellaneous Configuration > Miscellaneous Configuration. View the value of the Active Video option.
¡ Onboard Device indicates that server information is displayed through the VGA connector on the system board.
¡ PCIe Device indicates that server information is displayed through the PCIe GPU module.
|
|
NOTE: Support for external connectors depends on the GPU model. |
Figure 112 Miscellaneous configuration screen
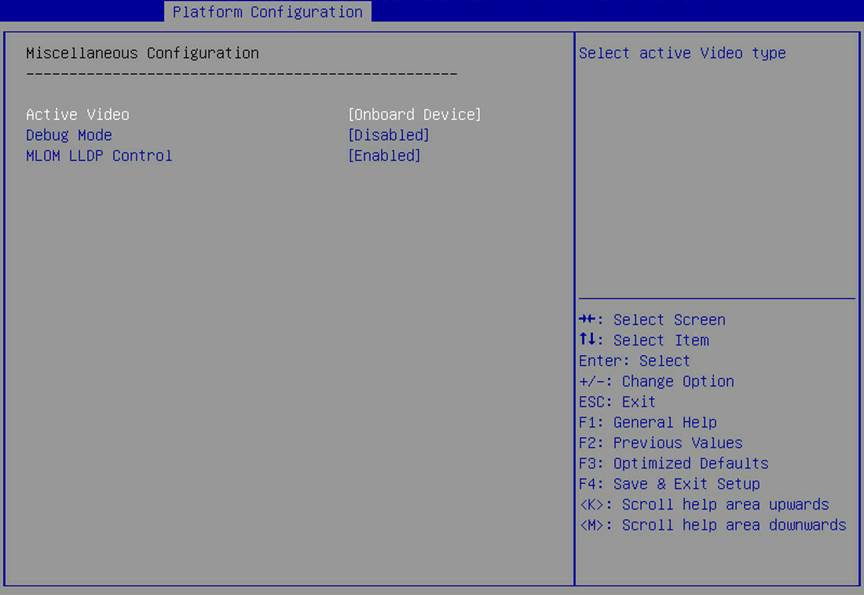
4. If the server uses the GPU module to display graphics, make sure the GPU module is compatible with the server and the operating system.
¡ To check whether the GPU module is compatible with the server, use the query tool available from Query tool for server and component compatibility.
¡ To check whether the GPU module is compatible with the operating system installed on the server, use the query tool available from Query tool for operating system compatibility.
5. If the server displays graphics through the VGA connector, be sure that the cables are connected correctly. If the cable connection is good, troubleshoot the system board. If a cable is faulty, replace the cable.
6. Be sure that all GPU modules are installed correctly and securely.
7. Replace each GPU module with a known functional GPU module to identify whether the GPU module is faulty. If a GPU module is faulty, replace it.
8. If the issue persists, contact Technical Support.
GPU UCE error reported by HDM in a virtualization scenario
Symptom
In a virtualization scenario, the server crashes or gets stuck and HDM reports GPU UCE errors.
Applicable models
· H3C UniServer R5300 G3
· H3C UniServer R5300 G5
· H3C UniServer R5500 G5
Possible causes
The server is not enabled with ACS CAP, which is required for supporting virtualization scenarios.
Solution
To resolve the issue:
1. Verify that ACS CAP is enabled.
a. Execute the lspci -vt command to locate the SWITCH PCIe link, as shown in Figure 113.
Figure 113 Locating the SWITCH PCIe link

b. Execute the lspci -vvv command to view the ACS state of the SWITCH chip. For ACS Cap, a plus sign (+) represents enabled and a minus sign (-) represents disabled.
Figure 114 Verifying if ACS CAP is enabled

2. If the ACS CAP is disabled, identify the product model and HDM version and contact Technical Support. Approaches for enabling ACS CAP vary by models.
Self-procured GPU module not recognized
Symptom
The OS does not recognize GPU modules purchased by users, and HDM reports the recognition failure.
![]()
Applicable models
· H3C UniServer R5300 G3 8GPU model
· H3C UniServer R5300 G5 8GPU model
Possible causes
Dual-slot wide GPU modules require an external power cord. If you use a GPU module and power cord not purchased from H3C, the fuse on the GPU adapter might be burnt. This causes the recognition failure.
Solution
1. Purchase GPU modules and power cords from H3C-authorized channels.
2. If the fuse is burnt, replace the GPU adapter.
Monitor display issues
Screen blank for more than 60 seconds after the server powers up
Symptom
The screen is blank for more than 60 seconds after the server is powered up.
Possible causes
· The monitor is not receiving power.
· The monitor, KVM device, and server are not cabled properly.
· The monitor is in sleep mode.
· The server does not support the GPU module.
· The driver version of the GPU module is too low.
· The riser card and GPU module are not installed correctly.
· The power is insufficient to support the server.
· The GPU module is not receiving power.
Solution
To resolve the issue:
1. Be sure that the power cords are connected correctly to the monitor and server. If the corresponding LEDs on the monitor and server are on, the power cords are connected correctly.
2. Check and ensure that the VGA cable connects to the server and monitor correctly and reliably. If a KVM device is used, make sure the server and the monitor are connected to the KVM device correctly and reliably.
3. Replace the monitor with a known functional monitor to be sure that the original monitor functions correctly and is not in sleep mode
4. If the monitor is connected to the VGA connector on the system board, check whether the cable is connected correctly and reliably.
¡ If the cable is connected correctly and reliably, troubleshoot the system board.
¡ If the cable is damaged or faulty, replace the cable.
5. If the monitor is connected to the GPU module, make sure the server and the operating system are compatible with the GPU module.
¡ To check whether the GPU module is compatible with the server, use the query tool available from Query tool for server and component compatibility.
¡ To check whether the GPU module is compatible with the operating system installed on the server, use the query tool available from Query tool for operating system compatibility.
6. Upgrade the GPU module driver to the latest version released from the H3C official website.
7. Be sure that the riser card and GPU module are installed securely on the server and the power supply meets the requirements.
8. If the issue persists, contact Technical Support.
Screen blank when the server powers up
Symptom
The server starts abnormally and the monitor screen is blank.
Possible causes
· The power supplied to the server is insufficient.
· The DIMMs are installed in the wrong location.
· The server is faulty.
· The monitor is faulty.
Solution
To resolve the issue:
1. Check whether the LEDs on the front panel of the server (including the Health LED) are off, and whether the HDM cannot be connected. If the LEDs are all off and the HMD cannot be connected, see "LEDs off" to resolve the issue.
2. If the Health LED indicates a system error. View the operating status of the system from HDM.
3. Be sure that the memory installation on the server complies with the memory installation guidelines. If the DIMM are installed in wrong positions, the server will have a startup failure. For the memory installation guidelines, see the user guide for the server.
4. Perform replacement tests to identify whether the server or monitor is faulty.
¡ If the issue goes with the monitor, replace the monitor.
¡ If the issue goes with the server, contact Technical Support.
Screen blank when the server is operating correctly
Symptom
· The monitor screen is blank when the monitor is connected to a running server.
· The monitor screen goes black suddenly when some applications are started on the server
Possible causes
· The monitor has an incorrect or unreliable power connection, or the power supplied to the monitor does not meet the requirements.
· Incorrect or unreliable VGA cable connection to the server and monitor.
· The monitor brightness and contrast are not set correctly.
· The server is faulty.
· The monitor is faulty.
Solution
To resolve the issue:
1. Check and ensure that power is being supplied to the monitor correctly. If the LEDs on the monitor are on, power is being supplied correctly to the monitor.
2. Check and ensure that the VGA cable connects to the server and monitor correctly and reliably.
3. Adjust the brightness and contrast of the monitor.
4. Power cycle the server.
5. Perform replacement tests to identify whether the server or monitor is faulty.
¡ If the issue goes with the monitor, replace the monitor.
¡ If the issue goes with the server, contact Technical Support.
Screen jitters, screen image rolls or is distorted
Symptom
The monitor screen jitters, and the screen image rolls or is distorted.
Possible causes
· The VGA cable between the monitor and server is loose or damaged.
· The monitor is disturbed by a strong magnetic field.
· The server is faulty.
· The monitor is faulty.
Solution
To resolve the issue:
1. Check and ensure that the VGA cable connects to the server and monitor correctly and reliably.
2. Move the monitor away from other monitors or devices with strong magnetic field such as power transformers.
3. Power cycle the server. For the procedures of powering on and powering off the server, see the user guide for the server.
4. Perform replacement tests to identify whether the server or monitor is faulty.
¡ If the issue goes along with the monitor, replace the monitor.
¡ If the issue goes along with the server, contact Technical Support.
Abnormal screen colors
Symptom
The color of the video or image displayed on the monitor is abnormal.
Possible causes
· The resolution of the monitor does not match that of the VGA connector on the server.
· Incorrect or unreliable VGA cable connection to the server or monitor.
· The monitor is faulty.
· The VGA cable is damaged or faulty.
Solution
To resolve the issue:
1. Be sure that the resolution of the monitor matches that of the VGA connector of the server.
2. Check and ensure that the VGA cable connects to the server and monitor correctly and reliably.
3. Perform replacement tests to identify whether the server or VGA cable is faulty.
¡ If the issue goes with the monitor, replace the monitor.
¡ If the issue goes with the VGA cable, replace the VGA cable.
4. If the issue persists, contact Technical Support.
Slow-moving horizontal lines displayed on the monitor
Symptom
Slow-moving horizontal lines are displayed on the monitor.
Possible causes
· The monitor is exposed to magnetic field interference.
· The monitor is faulty.
· The VGA cable is damaged or faulty.
Solution
To resolve the issue:
1. Move the monitor away from other monitors or devices with strong magnetic field such as power transformers.
2. Perform replacement tests to identify whether the server or VGA cable is faulty.
¡ If the issue goes with the monitor, replace the monitor.
¡ If the issue goes with the VGA cable, replace the VGA cable.
3. If the issue persists, contact Technical Support.
Mouse and keyboard issues
Mouse or keyboard not recognized
Symptom
The mouse or keyboard is not recognized by the operating system.
Possible causes
· The mouse or keyboard is faulty.
· The USB port on the server to which the mouse or keyword connects is faulty.
· Mouse or keyword connection is not enabled for the USB port in the BIOS. Any device connected to the USB port is disabled.
· The USB driver has not been installed.
Solution
To resolve the issue:
1. Enable the USB port in the BIOS setup utility. For more information, see step 1 in "USB device not recognized."
2. Replace the mouse or keyboard with a known functional one.
¡ If the issue is resolved, the original mouse or keyword is faulty.
¡ If the issue persists, go to step 3.
3. Power on the server and press Del or Esc to enter the BIOS Setup utility. Select Advanced > USB Configuration to view information about the USB devices and determine whether the mouse or keyboard is present, as shown in Figure 115.
¡ If the mouse or keyboard is present, go to step 4.
¡ If the mouse or keyboard is not present, go to step 5.
Figure 115 USB device information
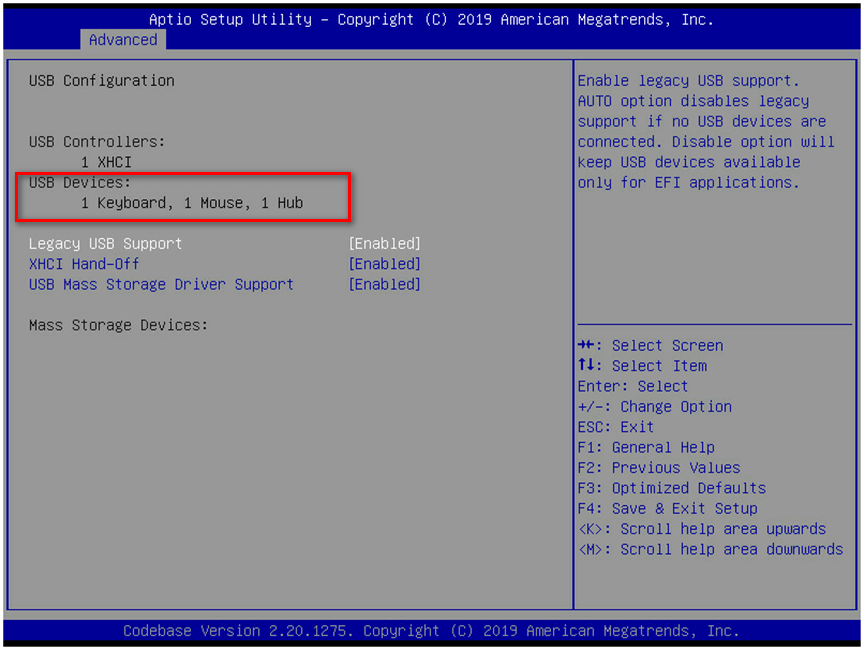
4. Check and be sure that the latest USB driver has been installed.
5. If the issue persists, contact Technical Support.
Network adapter issues
|
|
IMPORTANT: Before troubleshooting a network adapter, make sure the network adapter is compatible with the server and operating system. To determine the network adapter compatibility with the server and operating system, use the query tools available from Query tool for server and component compatibility and Query tool for server and component compatibility |
Newly installed network adapter does not work
Symptom
A newly installed network adapter does not work.
Possible causes
· Network adapter connection issue.
· The network adapter is not compatible with the installed transceiver module, or the transceiver module/cable is not installed correctly or securely.
· The network adapter, cable, transceiver module, or any other component such as a riser card is faulty.
· Incorrect hardware settings on the server, for example, slot mismatch or processor not present.
· The firmware or driver version of the network adapter is too low.
· The network adapter is not compatible with the server.
· The firmware or driver version of the network adapter is not compatible with the operating system.
Solution
To resolve the issue:
1. Be sure that the network adapter is compatible with the server and the operating system.
¡ To check whether the network adapter is compatible with the server, use the query tool available from Query tool for server and component compatibility.
¡ To check whether the network adapter is compatible with the operating system installed on the server, use the query tool available from Query tool for operating system compatibility.
If the network adapter is not compatible with the server and operating system, replace it with one that meets the compatibility requirements.
2. During the startup process of the server, press Delete or Esc as prompted to enter the BIOS setup utility.
3. Check whether the network adapter is recognized by the BIOS.
¡ In UEFI boot mode, check whether the configuration item for the network adapter is displayed on the Advanced tab.
Figure 116 Configuration item for the network adapter in the UEFI boot mode
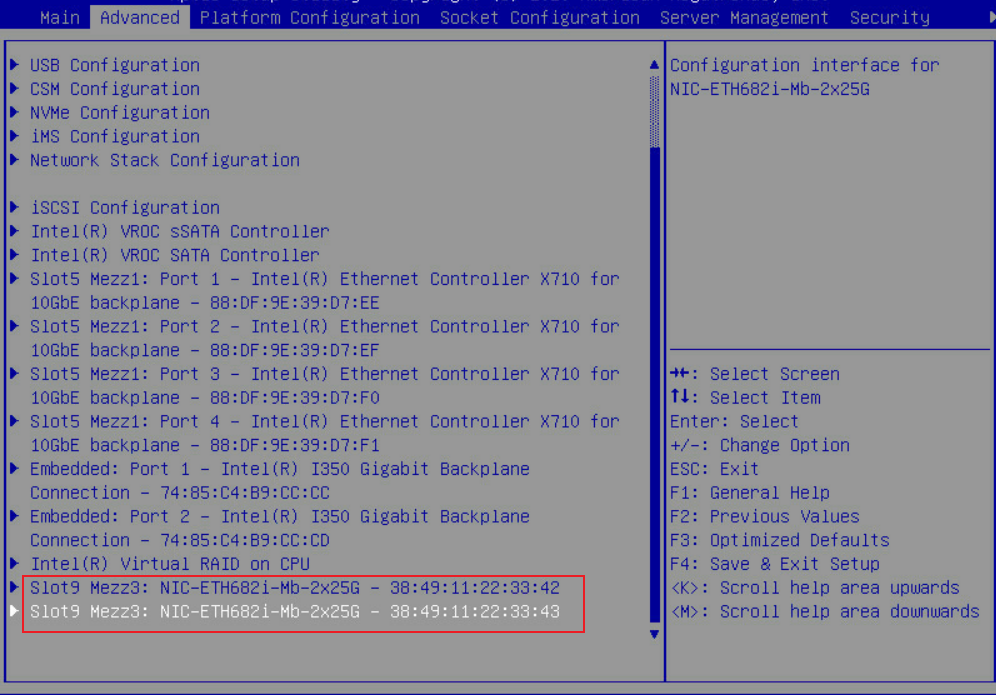
¡ In Legacy boot mode, check whether a message about the network adapter is generated during the POST state.
Figure 117 Network adapter message in the POST stage in the Legacy boot mode
![]()
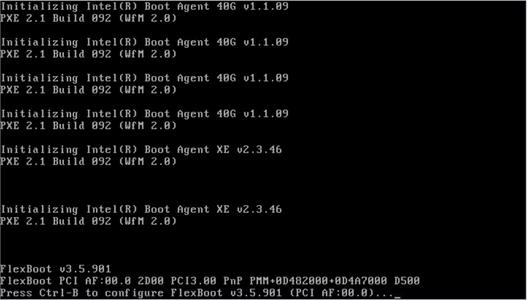
4. Upgrade the firmware and driver of the network adapter to the latest version that meets the compatibility requirements. For the latest firmware and driver versions, go to the H3C official website
5. (Optional.) If the network adapter is recognized by the BIOS, perform the following tasks:
¡ Ensure correct connection of the network adapter.
¡ Be sure that the gold platings, slot, and interfaces are physically intact and not damaged.
¡ (Optional.) For an NCSI-capable network adapter, check and ensure that the NCSI cable is connected to the system board correctly.
¡ Ensure compatibility of the network adapter with the transceiver module.
¡ Replace the transceiver module with a known functional one to check whether the original transceiver module is faulty.
¡ Be sure that the firmware and driver of the network adapter have been updated to the latest versions. For the latest firmware and driver versions, go to the H3C official website.
7. If the issue persists, contact Technical Support.
An interface on a network adapter is not available
Symptom
An interface on a network adapter is not available in the operating system.
Possible causes
· Network adapter connection issue.
· The firmware or driver version of the network adapter is too low.
· The network adapter is not compatible with the installed transceiver module, or the transceiver module or cable is not installed correctly or securely.
· The network adapter, cable, transceiver module, or any other component such as a riser card is faulty.
· Incorrect hardware settings on the server, for example, mismatched slot or processor not present.
Solution
To resolve the issue:
1. View PCI device information in the operating system. If no information about the network adapter is displayed, go to step 2. If information about the network adapter is displayed, go to step 3.
¡ Linux operating system
Execute the lspci | grep Eth command to view information about the PCI devices.
Figure 118 Displaying information about the PCI devices in the Linux operating system
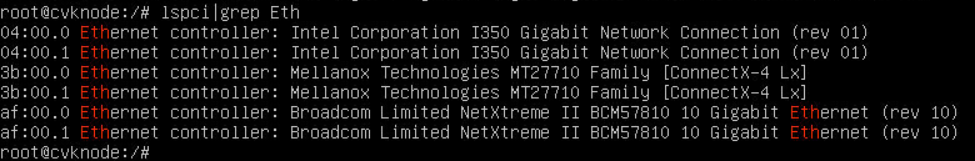
Execute the ifconfig –a command to view information about the network interfaces. If information about the interface is displayed, the interface is recognized by the system.
Figure 119 Displaying information about network interfaces
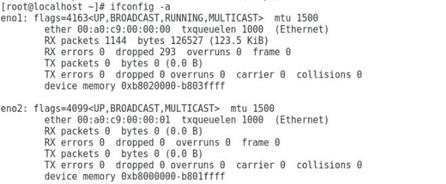
¡ Windows operating system
As shown in Figure 120, view information about network adapters on the Network Connections page. If the network adapter is displayed, the network adapter is recognized by the system.
Figure 120 Viewing information about network adapters in the Windows operating system
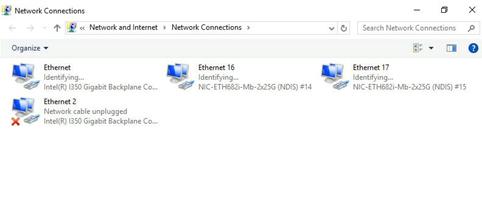
If the network adapter is not displayed on the Network Connections page, open Device Manager. Select Network adapters > Other devices to view whether Ethernet Controller or Unknown device exists.
Figure 121 Device Manager
![]()
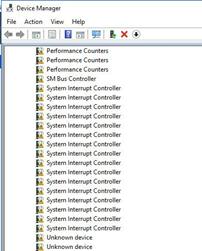
a. Ensure that the processor corresponding to the PCIe slot is present. For the relations between PCIe slots and processors, see the user guide for the server.
b. Power cycle the server.
c. Swap the network adapter with a known functional network adapter to determine whether the network adapter or PCIe slot is faulty. If a component is faulty, replace it.
d. If the network adapter supports the NCSI function, be sure that the NCSI cable is connected to the system board correctly.
a. Ensure compatibility between the network adapter and transceiver module. For compatibility between network adapters and transceiver modules, contact Technical Support. If the transceiver module is not compatible with the network adapter, replace the transceiver module.
b. Replace the transceiver module with a known functional one to check whether the original transceiver module is faulty.
c. Update the firmware and driver of the network adapter to the latest versions compatible with the operating system. For the latest versions, go to the H3C official website. Check whether errors occur or error logs are generated by the driver during the upgrading process.
4. If the issue persists, collect the system logs generated when the issue occurred and contact Technical Support.
A port on the network adapter is not reachable
Symptom
A port on the network adapter is not reachable.
Possible causes
· Network configuration or uplink switch configuration issue.
· The network adapter is not compatible with the installed transceiver module, or the transceiver module or cable is not installed properly.
· The network adapter, cable, transceiver module, or other components such as the riser card is faulty.
· The firmware or driver version of the network adapter is too low.
Solution
To resolve the issue:
1. Be sure that the status LED of the port has normal indication and the cable is connected correctly. For some network adapters, you can see the LED descriptions in H3C Network Adapter Datasheet. For the network adapters not included in the datasheet, contact Technical Support to obtain related information.
2. Contact the Technical Support for the network adapter compatibility with the transceiver module. If they are not compatible, replace the transceiver module
3. Check and be sure that the network adapter settings including port status, port number, data rate, duplex mode are consistent with those of the uplink switch.
¡ Linux operating system
- Execute the ifconfig <network adapter port number> command to view the port status and whether the IP address set correctly, as shown by callout 1 in Figure 122.
- Execute the ethtool <network adapter port number> command to view the data rate and duplex mode of the network adapter, as shown by callout 1 in Figure 122. Be sure that they are consistent with those of the uplink switch.
Figure 122 Viewing network adapter settings in the Linux system
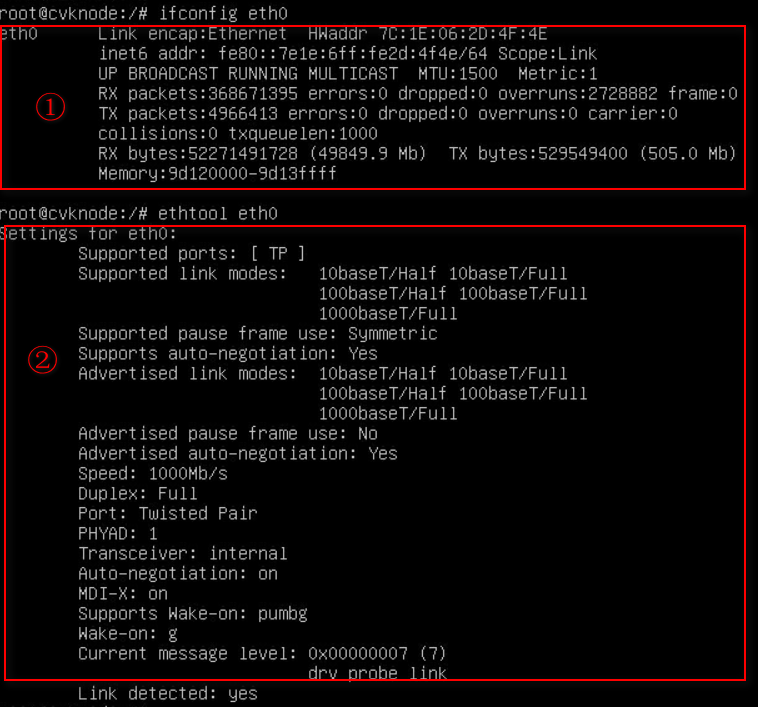
¡ VMware operating system
- Execute the esxcli network nic list command to view network adapter information.
- Execute the esxcli network nic up -n vmnicX command to enable the network adapter.
- Execute the esxcli network nic get -n vmnicX command to view the port status, and firmware and driver version of the network adapter.
¡ Windows operating system
# Right-click the computer icon on the desktop and select Manage.
# Select Device Manager > Network Adapter.
# Identify and right-click the network adapter and select Properties to view information about the network adapter.
4. View network-related configurations, including the IP address, VLAN, bonding settings of the port and the port settings of the uplink switch, to determine whether the issue is caused by improper configurations. Correct the improper configurations, if any.
5. Upgrade the firmware and driver of the network adapter to the latest version meeting the compatibility requirements
6. Replace or swap the cable, transceiver module, network adapter, and switch one after another with a known functional one to determine whether one of the components is faulty. If a component is faulty, replace it.
7. Contact Technical Support to determine whether the network adapter is compatible with the switch.
8. If the issue persists, collect the system logs generated when the issue occurred and contact Technical Support.
Packet loss or error on a port
Symptom
Packet loss or error occurs on a port of a network adapter.
Possible causes
· The network adapter, cable, transceiver module, or switch is faulty.
· The firmware or driver version of the network adapter is too low.
· The firmware or driver version of the network adapter is not compatible with the operating system.
· Service traffic issue.
Solution
To resolve the issue:
1. Determine whether the packet loss or error is accidental. If it is accidental, just ignore the issue and go to 2.
2. Be sure that the driver and firmware versions of network adapter are up to date and compatible with the operating system. For the driver and firmware version compatibility with the operating system, use the query tool available from Query tool for operating system compatibility.
3. Replace the cable or transceiver module with a known functional one to determine whether the cable or transceiver module is faulty. If the cable or transceiver module is faulty, replace it.
4. Connect the network adapter to a port on another known functional switch to determine whether the switch is faulty. If the switch is faulty, troubleshoot the switch.
5. Install the network adapter in another known functional slot to determine whether the network adapter is faulty. If the network adapter is faulty, replace it. If the network adapter can work correctly in the other slot, contact Technical Support to determine whether the slot is faulty.
6. Switch the traffic on the port to another port to determine whether the issue is traffic specific. If the issue is traffic specific, troubleshoot the traffic issue.
7. If the issue persists, collect the following information and contact Technical Support.
¡ System logs.
¡ Packet loss or error information. In the Linux system, you can execute the ethtool -S <network adapter port number> command to view the transmitted and received traffic statistics of a port.
Figure 123 Viewing the transmitted and received traffic statistics of a port
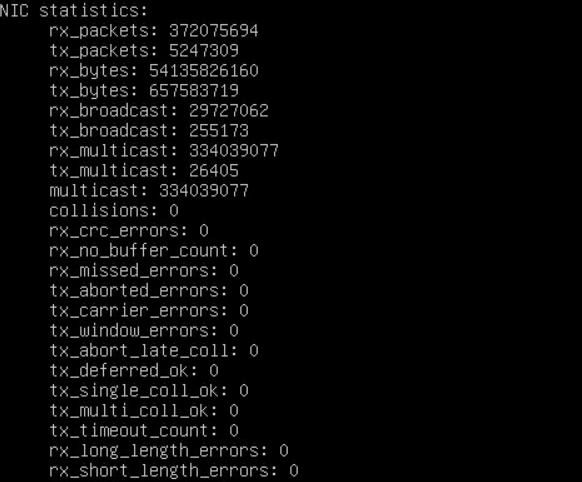
Unsatisfactory performance
Symptom
The performance of the network adapter, such as the port rate, does not meet the specifications.
Possible causes
· Some network adapter settings in the operating system have been changed, for example, unevenly distribution of network adapter interrupts between the processor cores, and modification of the network adapter port buffer.
· The firmware or driver version of the network adapter is too low.
Solution
To resolve the issue:
1. Update the firmware or driver of the network adapter to the latest version. For the latest firmware or driver versions, go to the H3C official website.
2. Check whether the issue is caused by the network adapter settings in the operating system. The Linux operating system is used in this example:
a. Execute the cat /proc/interrupts | grep -i <network adapter driver name> command to check the bindings between the network adapter interrupts and processor cores, and determine whether the interrupt distribution is even. Typically, the system automatically balances interrupts. Performance might not meet the specifications when the load is heavy.
- If the interrupt distribution is uneven, contact Technical Support.
- If the interrupt distribution is uneven, go to step a.
Figure 124 Viewing whether the network adapter interrupt distribution is even
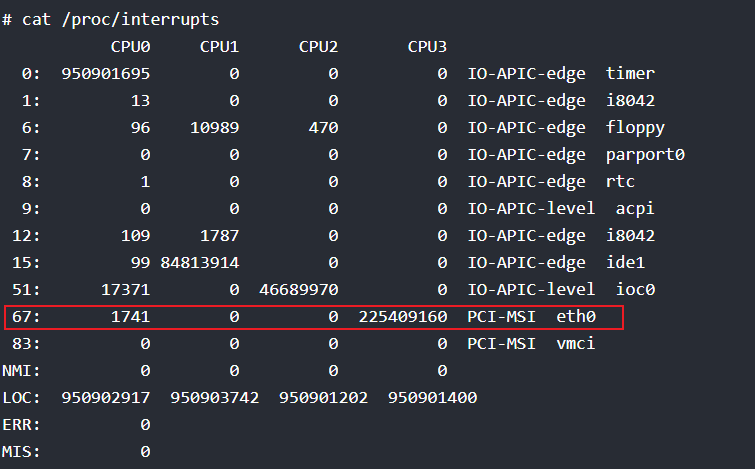
a. Execute the ethtool -g <network adapter port number command to check whether the network adapter port buffer settings have been modified. You can use the ethtool -G <rx/tx> <buffer size> command to adjust the buffer size of the network adapter. The default is the minimum value. When a performance bottleneck is reached, increase the buffer size. For specific adjustment methods and strategies, contact Technical Support. If the network adapter does not require an adjustment, go to step a.
Figure 125 Viewing the network adapter port buffer settings
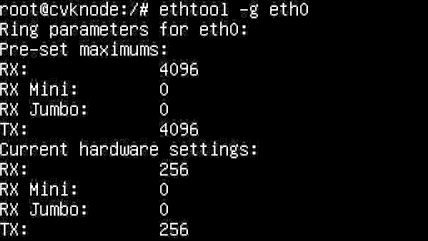
a. Execute the ethtool -k <network adapter port number> command to check whether LRO and TSO settings have been modified. You can use the ethtool -k <network adapter port number> tso/lro on command to enable these parameters. For specific adjustment methods and strategies, contact Technical Support.
Figure 126 Viewing the network adapter LRO and TSO settings
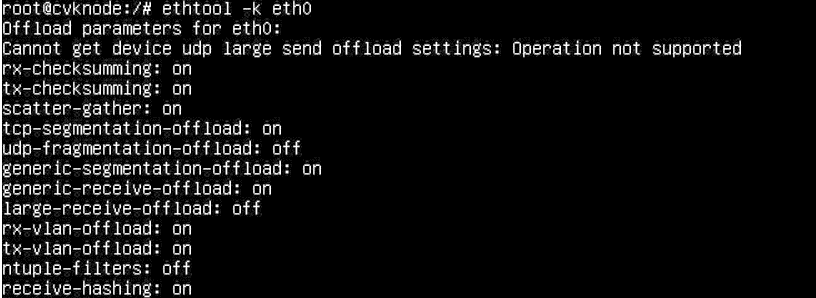
3. If the issue persists, collect system logs and contact Technical Support.
mLOM network adapter failure
Symptom
A mLOM network adapter is faulty.
Possible causes
The mLOM network adapter has a hardware failure.
Solution
View the power status LED on the mLOM network adapter.
· If the power status LED is not steady green, the mLOM network adapter is faulty. Replace it.
· If the power status LED is steady green, the mLOM network adapter is not faulty. Identify the other reasons that might cause the failure or contact Technical Support.
Figure 127 Power status LED of the mLOM network adapter
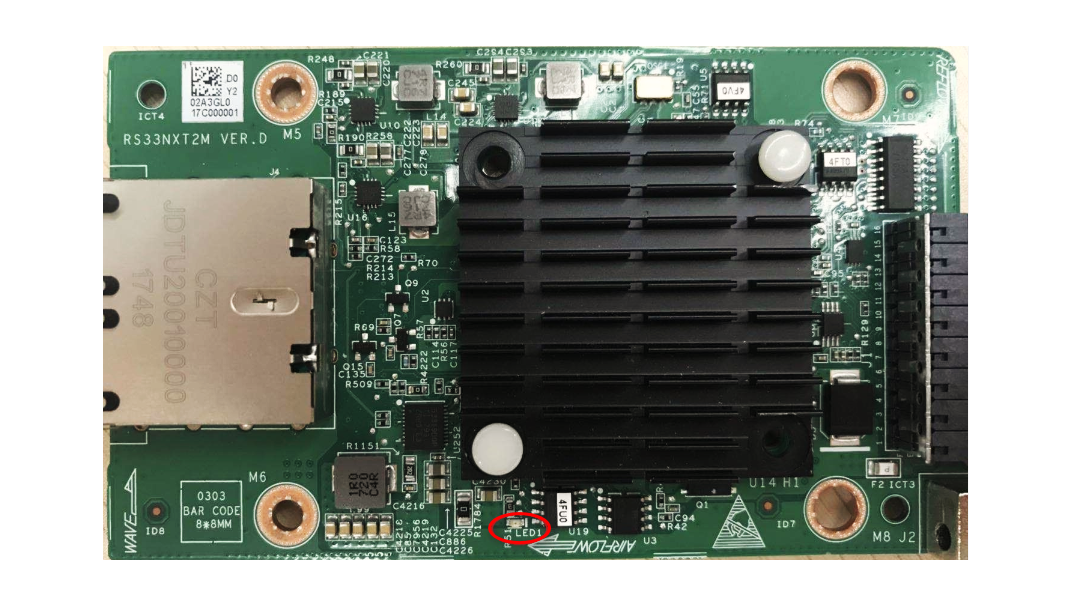
mLOM network adapter is recognized but not reachable
Symptom
An mLOM network adapter is recognized but not reachable.
Possible causes
· The mLOM network adapter is not compatible with the switch.
· The mLOM network adapter is not compatible with the server.
Solution
To resolve the issue:
1. Follow the procedure described in "A port on the network adapter is not reachable" to troubleshoot the issue.
2. Check the mLOM network adapter and switch settings and determine whether the mLOM network adapter is compatible with the switch.
A 10GE mLOM network adapter is compatible with a GE or 10-GE switch, but not compatible with a 100M switch
3. Check the mLOM network adapter and server settings and determine whether the mLOM network adapter is compatible with the server.
An R2900 G3 or R2700 G310GE server does not support a 10-GE mLOM network adapter.
4. If the issue persists, collect system logs generated when the issue occurred and contact Technical Support.
FC HBA issues
Port WWPN on an FC HBA is not recognized by the storage device
Symptom
As shown in Figure 128, an FC HBA is installed on the server. The FC HBA connects to a storage device through an FC switch. The storage device fails to recognize the WWPN of the port on the FC HBA.
Figure 128 Storage network connection diagram

Possible causes
· The firmware or driver version of FC HBA is too low, or incompatible with the operating system
· The port on the FC HBA and the storage device do not belong to the same zone
· A hardware component, such as FC HBA, a cable, or a transceiver module on the FC link is faulty.
· The storage device and the switch have an identification failure.
Solution
To resolve the issue:
1. Check and be sure that the port on the switch to which the FC HBA connects is up.
Log in to the switch (an H3C switch in this example) and execute the display interface fc xxx brief command to view brief information about the port.
Brief information about the FC1/0/1 port is displayed in this example.
<Sysname> display interface fc 1/0/1 brief
Brief information on FC interface(s):
Admin Mode: auto - auto; E - e port; F - f port; NP - n port proxy
Oper Mode: E - e port; F - f port; NP - n port proxy;
TE - trunking e port; TF - trunking f port;
TNP - trunking n port proxy
Interface VSAN Admin Admin Oper Oper Status SAN-Aggregation
Mode Trunk Mode Speed
Mode
Fc1/0/1 2 F off F 4G UP SAGG23
Log in to the switch (an H3C switch in this example) and execute the display fc login command to view registration information of the node.
Registration information of the VSAN 1 node is displayed in this example.
<Sysname> display fc login vsan 1
Interface VSAN FCID Node WWN Port WWN
Vfc1 1 0x010000 21:01:00:1b:32:a0:fa:18 21:01:00:1b:32:a0:fa:17
If the port WWPN of the FC HBA is displayed in the command output, the FC HBA has been registered with the switch, go to step 3.
If the port WWPN of the FC HBA is not recognized by the switch, the FC HBA has not been registered with the switch, perform the following tasks to identify the reason.
b. Access the HDM Web interface to check whether the FC HBA is present.
- If the FC HBA is present, go to step c.
- If the FC HBA is not present, replace the FC HBA with a known functional FC HBA to determine whether the original FC HBA or the slot is faulty. If the original FC HBA is faulty, replace it.
- If the cable or transceiver module is faulty, replace it.
- If the cable are transceiver module are not faulty, go to step d.
d. Check and be sure that the FC HBA is installed with the latest driver and firmware versions compatible with the operating system. For the driver and firmware versions compatible with the operating system, use the query tool available from Query tool for operating system compatibility.
e. For a multi-switch connection scenario, check whether the N_Port, E_Port and F_Port modes of the switch are correct. For more information, see the configuration guide and command reference for the switch.
f. If the issue persists, collect the following logs and contact Technical Support.
- System logs and logs about the FC HBA.
- Switch logs. For more information, see the log message manual for the switch.
3. Determine whether the storage device is registered with the switch by checking whether the storage device WWPN is recognized by the switch. For the detailed procedure, see step 2. If the storage device has been registered with the switch, go to step 5. If it has not been registered with the switch, go to step 4.
¡ If the cable or transceiver module is faulty, replace it.
¡ If the cable are transceiver module are not faulty, go to step 5.
5. Execute the corresponding command on the switch, for example, the zoneshow command on a Brocade switch to determine whether the FC HBA port and the storage device port are in the same zone. If they are in the same zone, proceed to step 6. If they are not in the same zone, configure them to be in the same zone. For more information about the command, see the command reference for the switch.
Figure 129 Checking whether the FC HBA port and the storage device port are in the same zone
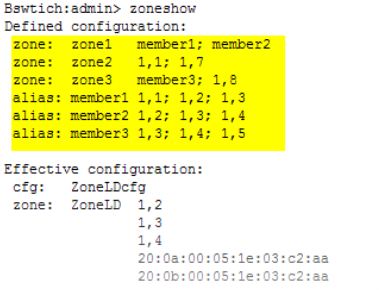
7. If the issue persists, collect the following logs and contact Technical Support.
¡ System logs and logs about the FC HBA.
¡ Switch logs. For more information, see the log message manual for the switch.
Port WWPN on an FC HBA is recognized by the storage device, but the server fails to recognize the LUN
Symptom
As shown in Figure 130, an FC HBA is installed on the server. The FC HBA connects to a storage device through an FC switch. The storage device recognizes the port WWPN on the FC HBA, but the server fails to recognize the LUN.
Figure 130 Storage network connection diagram

Possible causes
· The firmware and driver versions of the FC HBA are too low, or incompatible with the operating system.
· The operating system does not recognize the LUN and needs to rescan the FC link.
· The storage device is faulty.
· The FC link is faulty.
Solution
To resolve the issue:
1. Check and be sure that the FC HBA is installed with the latest driver and firmware versions compatible with the operating system. For the driver and firmware versions compatible with the operating system, use the query tool available from Query tool for operating system compatibility.
2. Collect operating system logs and FC HBA logs and search for information printed by the FC HBA driver in the logs, and determine whether logs about link establishment and LUN identification exist.
¡ If such logs exist, the link was established and the LUN was recognized previously. Go to step 3 to scan and identify the storage link again.
¡ If such logs do not exist, no link has been established. Check and be sure that the FC link between the FC HBA card and the switch is normal. For example, replace or swap the cable or transceiver module with a known functional one to determine whether a component faulty. If a component is faulty, replace it. If the issue is not caused by the hardware components on the link or the issue persists after component replacement, contact Technical Support.
Figure 131 Identifying the logs about link establishment and LUN recognition
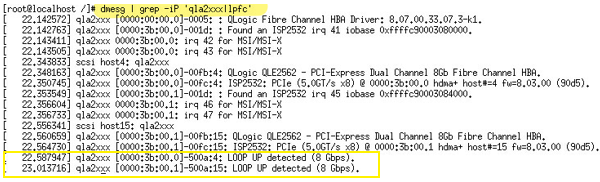
3. Execute the echo 1 > /sys/class/fc_host/host<number>/issue_lip command to scan the link. Number represents the interface number. For the relations between the interface numbers and FC HBA port, identify host# from the system logs. As shown in Figure 132, interface 3b:00.0 matches fc_host number 4.
Figure 132 Matching relations between number and FC HBA port
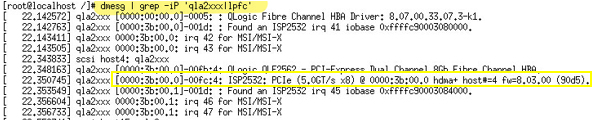
Rescan the link as shown in Figure 133.
Figure 133 Rescanning the FC link
![]()
4. Contact the storage device or OS vendor for troubleshooting. If collaborative analysis with the server side is required, collect logs and contact Technical Support.
Some of the multiple LUN links fail
Symptom
As shown in Figure 134, an FC HBA is installed on the server. The FC HBA connects to a storage device through multiple FC switches. Some of the LUN links fail
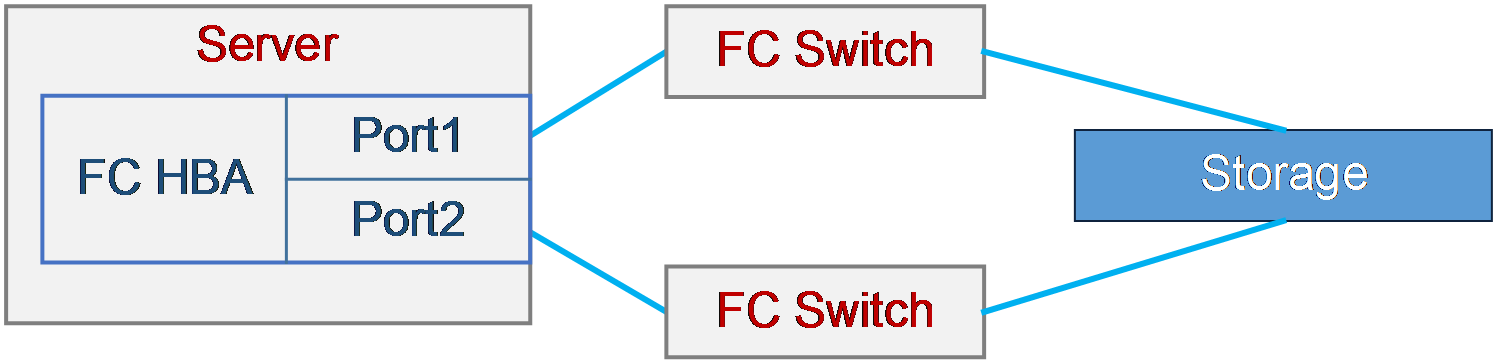
Possible causes
· The firmware and driver versions of the FC HBA are too low, or incompatible with the operating system.
· Multi-path driver failure in the operating system.
· The switch is faulty.
· The storage device is faulty.
· A hardware component on the FC link, such as the FC HBA, cable, or transceiver module, is faulty.
Solution
To resolve the issue:
1. Check and be sure that the FC HBA is installed with the latest driver and firmware versions compatible with the operating system. For the driver and firmware versions compatible with the operating system, use the query tool available from Query tool for operating system compatibility.
2. View port error statistics on the switch to check whether errors occur on the FC link between the FC HBA and the storage device. If an error occurs, the FC link is abnormal. Go to step 3. If no error occurs, go to step 4.
For example, execute the porterrshow command on the Brocade switch to check related statistics.
¡ crc_err as shown in Figure 135 indicates the CRC errors of data frames. If a data frame is damaged, the receiver will detect the value inconsistency, and the error count increases. If the value is 0, the data frames are not damaged. A hardware component on the FE link might be faulty.
¡ enc_out as shown in Figure 135 indicates errors caused by non-data frame issues, typically cable quality or endpoint issues. In addition, the ups and downs of ports caused by the restart of the endpoint might also cause increase of the enc_out value. If the value is 0, no errors occur on the data frames. If the value is not 0, the cable might be faulty.
As shown in Figure 135, the crc_err and enc_out parameters of port 0 are both 0, indicating that the hardware components on the FC link are operating correctly. Go to step 4. If the crc_err and enc_out parameter values are not 0, go to step 3.
Figure 135 Viewing the port error statistics for the FC link between the FC HBA and storage device

Low LUN read and write performance
Symptom
As shown in Figure 136, an FC HBA is installed on the server. The FC HBA connects to a storage device through an FC switch. The LUN read and write performance is low.
Figure 136 Storage network link diagram
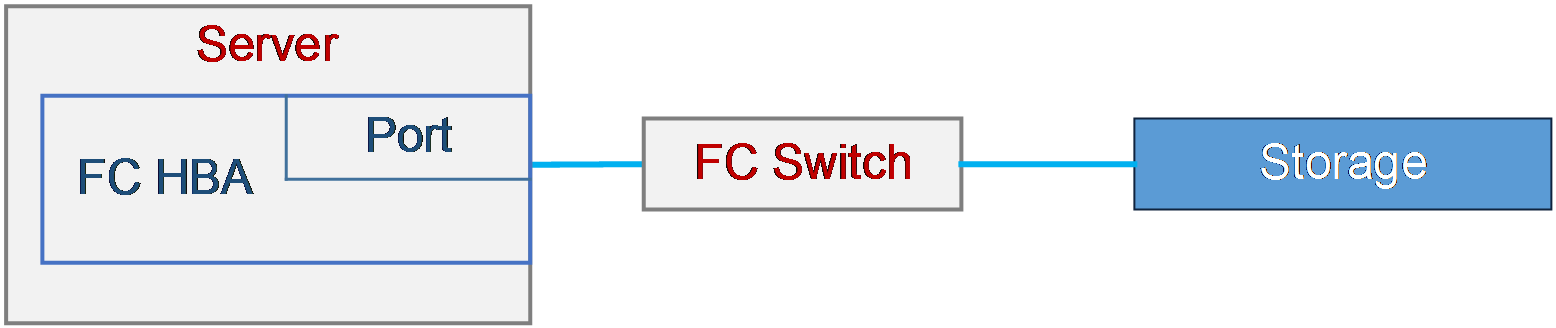
Possible causes
· The firmware and driver versions of the FC HBA are too low, or incompatible with the operating system.
· The FC link between the server and storage device is faulty.
· The storage device is faulty.
Solution
To resolve the issue:
1. Check and be sure that the FC HBA is installed with the latest driver and firmware versions compatible with the operating system. For the driver and firmware versions compatible with the operating system, use the query tool available from Query tool for operating system compatibility.
2. Compare the I/O performance between the server and the storage device to determine whether the FC link causes low LUN read and write performance.
a. Compare the I/O delays and concurrent operations on the server with those on another server with the same configuration. Determine whether the server provides satisfactory I/O performance. If the server provides satisfactory I/O performance, go to step a. If the server's I/O performance is not satisfactory, contact Technical Support to troubleshoot the I/O performance.
For example, you can use the iostat command in the Linux system to view the I/O performance.
- r/s—Number of reads completed per second.
- w/s—Number of writes completed per second.
- await—Average waiting time for each I/O request.
- r_await—Average wait time for each read request.
- w_await—Average wait time for each write request.
Figure 137 Viewing the I/O delays and concurrent operations
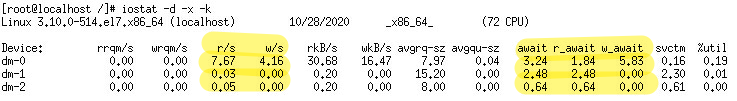
a. Check on the server whether the I/O performance from the FC HBA to the storage device reaches the expected performance. Compare the local I/O performance obtained in 2.a with this performance to determine whether the performance degrades. If the performance degrades, the link between the FC HBA and the storage device is faulty, go to step 3. If the performance does not degrade, contact Technical Support to determine whether an application issue causes performance degradation.
For example, in the Linux operating system, execute the dd command to test the I/O performance.
Figure 138 Checking whether the I/O performance from the FC HBA to the storage device reaches the expected performance
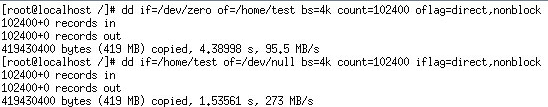
3. Log in to the switch to check whether errors occur on the FC link between the FC HBA an the storage device. If an error occurs, the FC link is abnormal, go to step 4. If no error occurs, go to step 5.
For example, execute the porterrshow command on the Brocade switch to check related statistics.
¡ crc_err as shown in Figure 139 indicates the CRC errors of data frames. If a data frame is damaged, the receiver will detect the value inconsistency, and the error count increases. If the value is 0, the data frames are not damaged. A hardware component on the FE link might be faulty.
¡ enc_out as shown in Figure 139 indicates errors caused by non-data frame issues, typically cable quality or endpoint issues. In addition, the ups and downs of ports caused by the restart of the endpoint might also cause increase of the enc_out value. If the value is 0, no errors occur on the data frames. If the value is not 0, the cable might be faulty.
As shown in Figure 139, the crc_err and enc_out parameters of port 0 are both 0, indicating that the hardware components on the FC link are operating correctly. Go to step 4. If the crc_err and enc_out parameter values are not 0, go to step 5.
Figure 139 Viewing the error statistics on the FC link from the HBA to the storage device
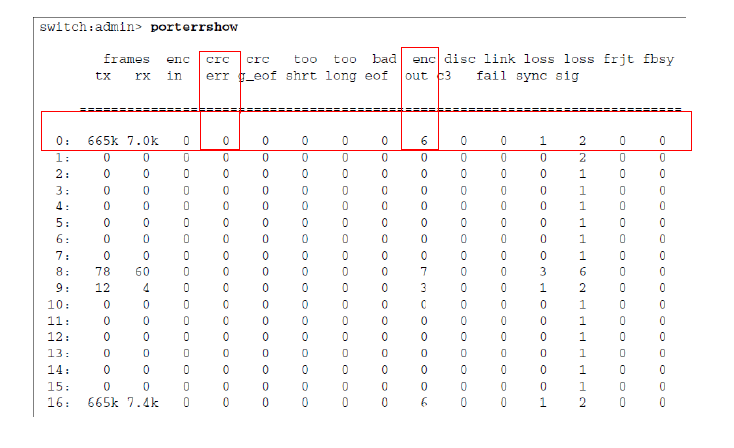
4. If a hardware component on the FC link is faulty, replace the faulty component. For example, you can replace or swap the cable or transceiver module with a known functional one to determine whether the cable or transceiver module faulty. If the issue persists after the faulty component is replaced or the issue is not caused by the hardware components on the FC link, go to step 5.
PCIe module issues
PCIe module not recognized by the BIOS
Symptom
A PCIe module is not recognized by the BIOS.
Possible causes
· The PCIe module is not compatible with the server.
· The golden plating of the PCIe module or riser card is oxidized, resulting in poor contact, or foreign objects exist in the riser card slot.
· The PCIe port status is set incorrectly in the BIOS setup utility.
· The PCIe module has a hardware fault.
· The riser card has a hardware fault.
· The riser card slot on the system board has a hardware fault.
Solution
To resolve the issue:
1. Use the query tool available from Query tool for server and component compatibility to verify if the PCIe module is compatible with the server.
2. Check and ensure correct installation and good contact between the PCIe module, riser card, and system board.
3. Ensure good contact between the golden plating with the PCIe slot. If the golden plating is oxidized, wipe it with a rubber. Remove the dust, if any.
Figure 140 Normal golden plating (left) and oxidized golden plating (right)
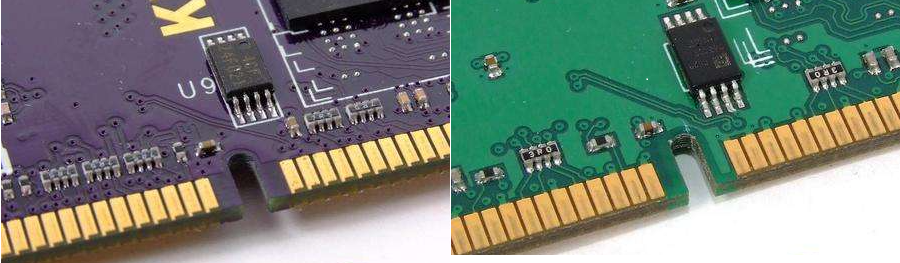
4. Access the BIOS setup utility and select Socket Configuration > IIO Configuration to view the values of the PCI-E Port and PCI-E Port Link Status parameter. If the value of the PCI-E Port Link Status parameter is Linked as xx as shown in Figure 141, the link is connected. If the value is Link Did Not Train as shown in Figure 142, the link is not connected.
Figure 141 PCIe link connected
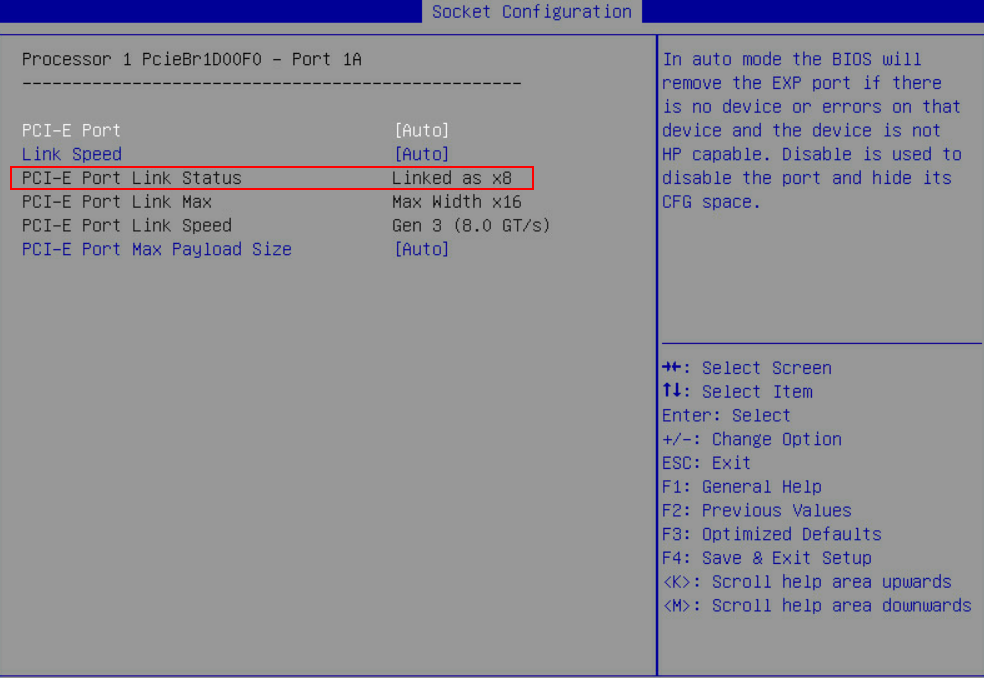
Figure 142 PCIe link not connected
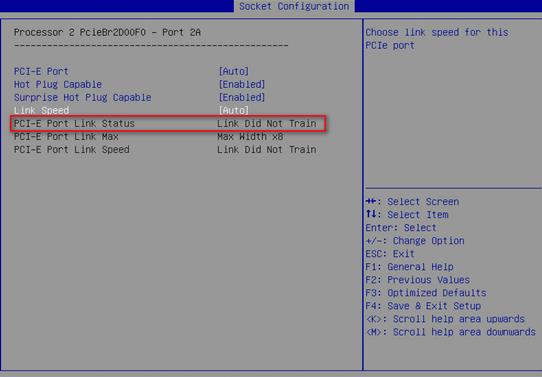
If the value of the PCI-E Port parameter is Disabled, the link will be disconnected. Change the value of the PCI-E Port parameter to Enabled or Auto, and then save the configuration and exit the BIOS setup utility. If the issue persists, the firmware version of the PCIe module does match the BIOS, update the firmware of the PCIe module to the latest version or a version compatible with the BIOS.
Figure 143 Firmware version of the PCIe module
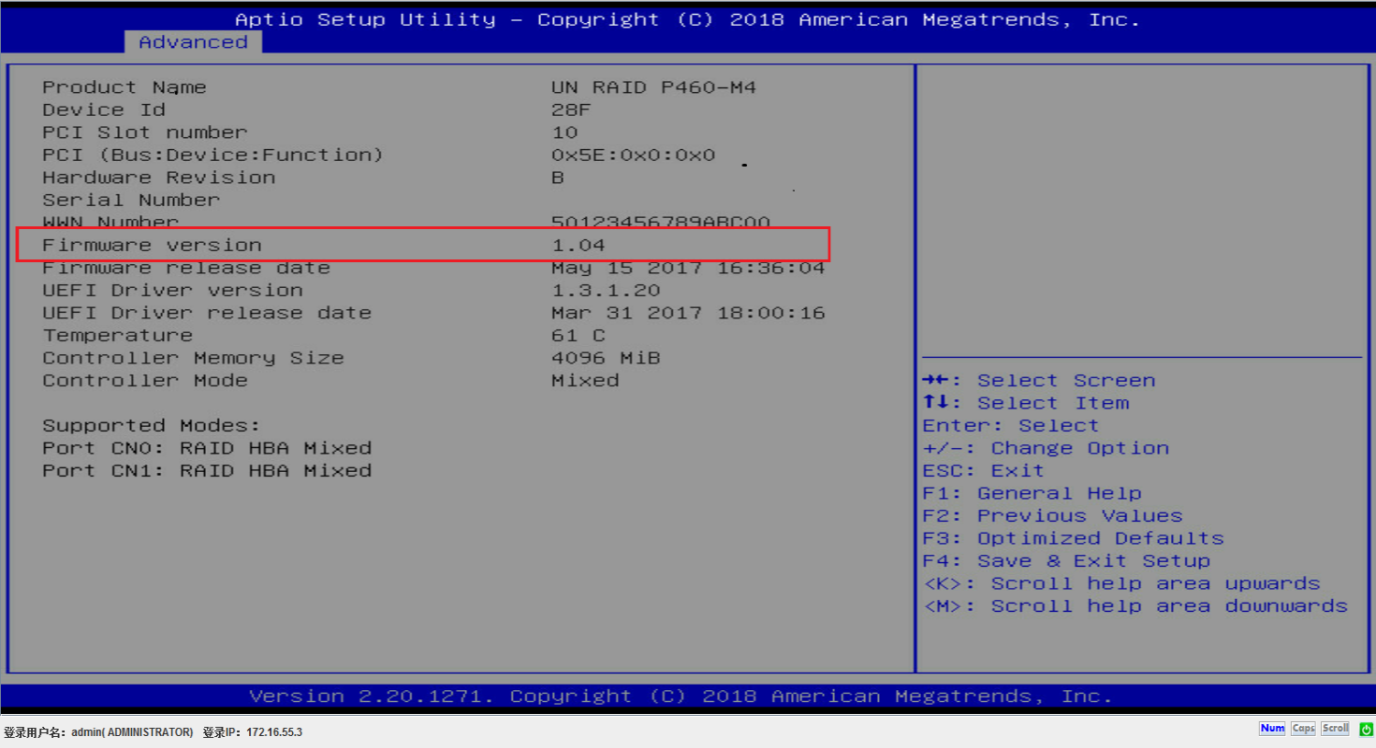
5. View the event logs on the HDM. If a log description like "Interrupt, EventType: Discrete, Event: Bus uncorrectable error, Data2: xx, Data3:x Bus uncorrectable error---Slot X---PCIE Name: XXX" exists, the PCIe module is damaged, replace the PCIe module.
6. Replace the PCIe module with a known functional one. If the new PCIe module is still not recognized, check whether the riser card is faulty.
7. Replace the riser card with a known functional one. If the PCIe module is recognized, the riser card is faulty.
8. If both the riser card and PCIe module function correctly, access the BIOS to determine whether the PCIe slot on the system board is faulty.
a. Set the EFI Shell Boot option to Enabled, as shown in Figure 144.
Figure 144 Setting the EFI Shell Boot option

b. Press F7 to enter the boot menu and select the UEFI:Built-in EFI Shell boot option, as shown in Figure 145.
Figure 145 Selecting the UEFI:Built-in EFI Shell boot option
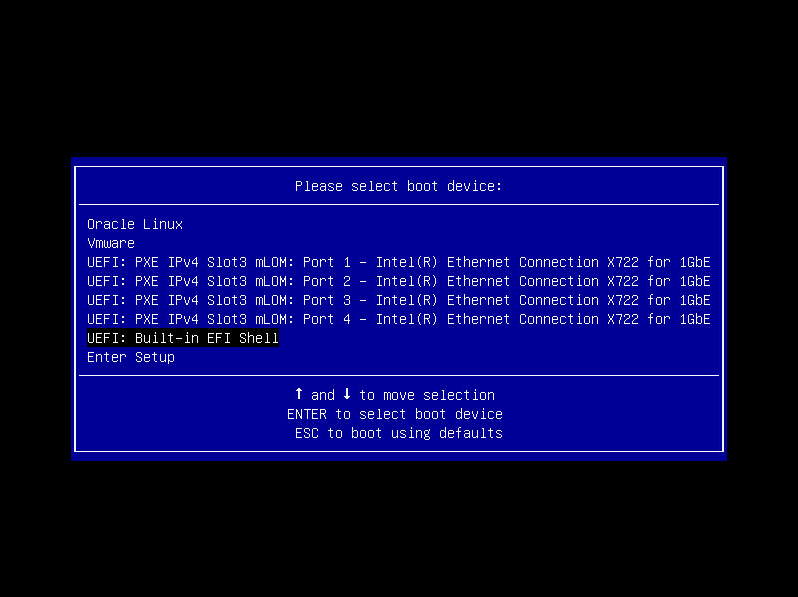
c. Access the UEFI Shell screen. Use the help command to view the available shell commands, as shown in Figure 146.
Figure 146 UEFI Shell screen

d. Execute the smbiosview -t 9 –b command to view the PCIe slot information. If no information about the PCIe slot is displayed, the slot is faulty. Replace the system board.
Figure 147 EFI Shell screen
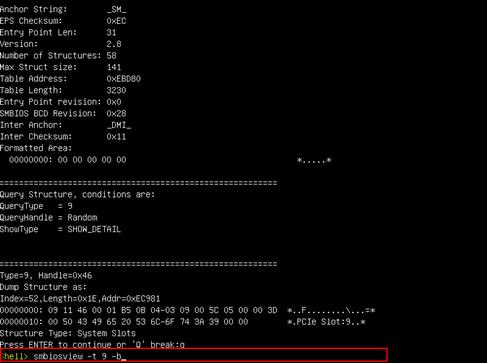
Figure 148 PCIe slot information
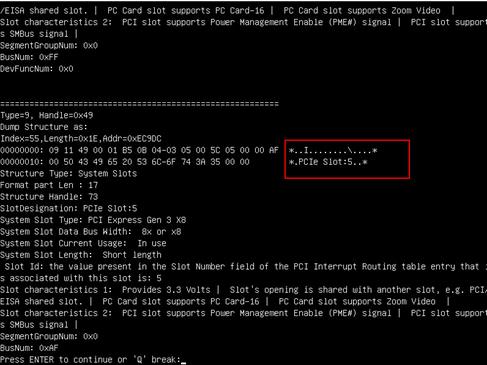
9. If the issue persists, contact Technical Support.
PCIe module is faulty
Symptom
The PCIe module does not work. A PCIe module error message is displayed in the HDM event log.
Possible causes
· The PCIe module has a hardware fault.
· The firmware or driver version of the PCIe module is too low.
Solution
1. If the PCIe module is newly installed, check whether it is compatible with the server and the operating system.
¡ To check whether the PCIe module is compatible with the server, use the query tool available from Query tool for server and component compatibility.
¡ To check whether the PCIe module is compatible with the operating system installed on the server, use the query tool available from Query tool for operating system compatibility.
If the PCIe module does not meet the compatibility requirements, replace it.
2. Update the firmware and driver of the PCIe module to the latest version. For the latest versions of the firmware and driver, go to the H3C official website.
3. Replace the PCIe module with a known functional one to determine whether the PCIe module is faulty.
4. If the issue persists, collect HDM SDS logs and operation logs and contact Technical Support.
PCIe module negotiated rate or bandwidth decreases
Symptom
The negotiated rate or bandwidth of the PCIe module decreases to a level out of the normal range.
Possible causes
· The PCIe module has a hardware failure.
· The link bandwidth and rate of the slot in which the PCIe module is installed does not meet the bandwidth and rate requirement of the PCIe module.
· The link speed for the PCIe module is set incorrectly in the BIOS setup utility.
· The firmware and driver versions of the PCIe module are outdated.
Solution
To resolve the issue:
1. Check whether the link bandwidth of the slot in which the PCIe module is installed meets the bandwidth requirements of the PCIe module.
¡ For the link bandwidth of the slot, see the user guide for the server.
¡ For the bandwidth and speed specifications of the PCIe module, use the query tool available from Query tool for server and component compatibility.
Be sure that the slot link bandwidth is not lower than the minimum bandwidth requirement of the PCIe module.
2. Enter the BIOS Setup utility and select Socket Configuration > IIO Configuration to view the values of the Link Speed and PCI-E Port Link Status parameters for the PCIe module.
Figure 149 Parameter settings of the PCIe module in the BIOS
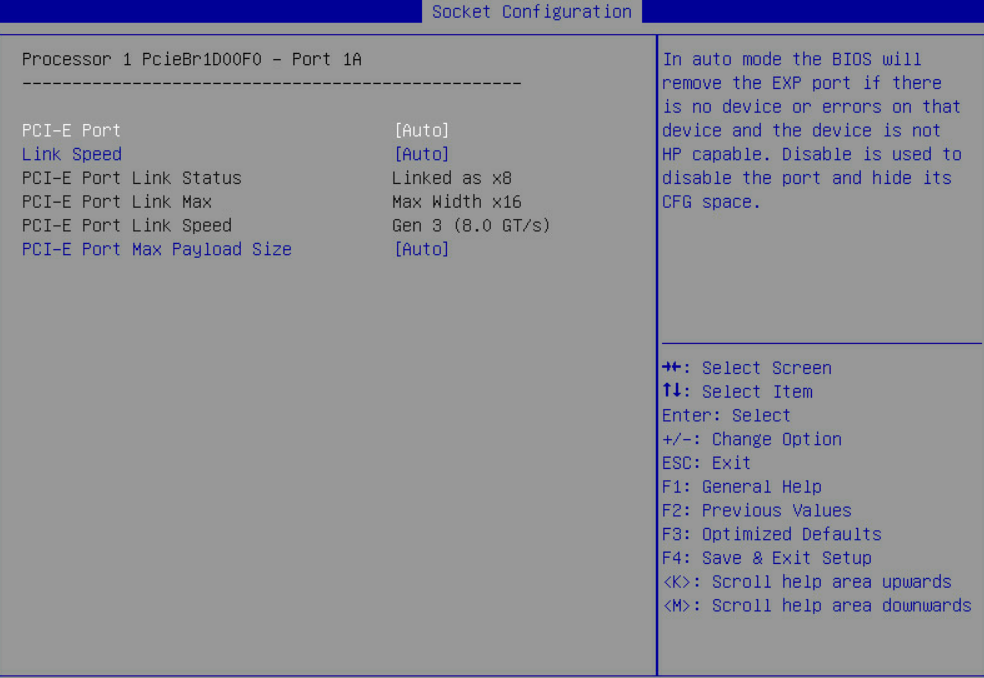
¡ Be sure that the value of the Link Speed is set to Auto.
¡ Check whether the values of the PCI-E Port Link Status and PCI-E Port link Speed parameters meet the requirements. If the values do not meet the requirements, manually change the link speed to a value that meets the requirement. Than save and reboot the system.
Figure 150 Changing the PCIe link speed
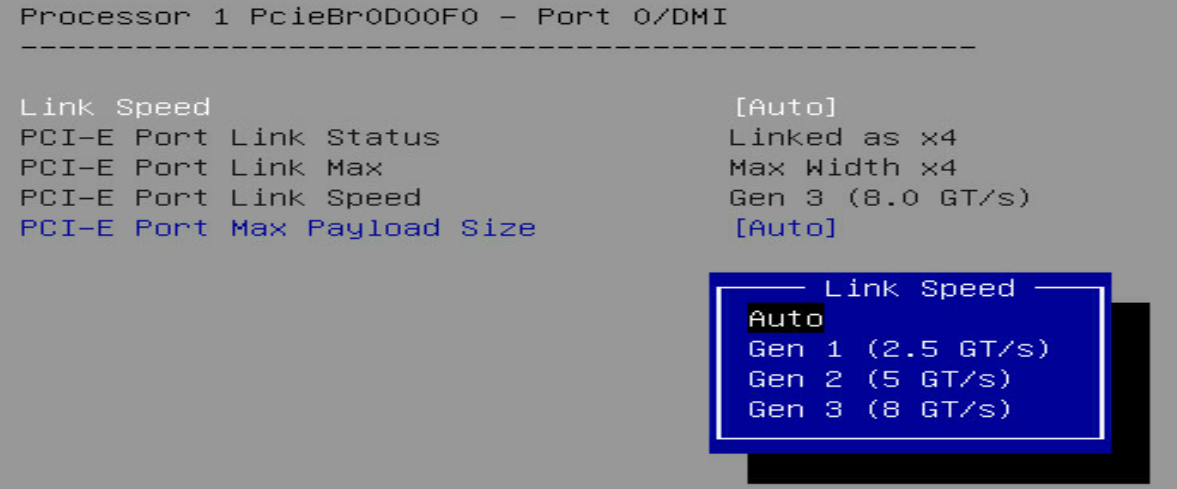
3. Update the PCIe module firmware and driver to the latest version.
4. Install the PCIe module in a known working slot, and check whether it can work correctly. If it can work correctly, go to step 5. If it cannot work correctly, replace the PCIe module.
5. Perform replacement tests to verify whether the PCIe slot on the system board or the riser card is faulty. If the PCIe slot or the riser card is faulty, replace it. If they function correctly, go to step 6.
6. If the issue persists, contact Technical Support.
Cable issues
Cabling guidelines
General guidelines
· Use only cables provided with the server. Do not use third-party cables or cables provided with other servers.
· Do not use the cables provided with the server on other devices.
· For any new component, be sure to use cables matching the component. For example, if the power cord used for a GPU module does not match the GPU module, the GPU module will not work correctly. For the correct connection methods for the cables, see the user guide for the product.
· If the installation positon of a component such as a storage controller or GPU module changes, adjust the cables accordingly:
¡ If the cable length is not enough, contact Technical Support to obtain a longer cable.
¡ Determine whether the interface position at the other end of the cable will change. For more information, see the user guide for the product.
· Before installing or removing any non-hot-swappable component and supporting cables, power off the server first.
· If you cannot identify the cables by labels provided with the cables, apply new labels to cables for easy identification.
Guidelines before connecting cables
· Be sure that the cables and connectors are not damaged.
· Identify the installation position of the cable to ensure that the cable will not be connected to a wrong port.
· Remove the protective cover (if any) from the target cable connector before connecting a cable to it.
Guidelines when connecting cables
· For heat dissipation, make sure no cables block the inlet or outlet air vents of the server.
· When connecting a cable, insert the cable into the interface gently and slowly. An excessive force will result in interface damage.
· Properly route the cables and ensure that the cables are not squeezed.
· When routing cables, avoid sharp edges and do not pull the connectors.
· When routing a cable with a net-like outfit, pay attention to the mushroom heads inside the server to avoid cable catching.
· Do not route cables above removable components, such as DIMMs.
· The cable routing shall not hinder the insertion and removal of other components, and ensure no interference with any components in the chassis
· Route the cables neat and tidy in their own fixed spaces. Make sure the cables will not be squeezed or scratched by other internal components.
· Do not use a cable tie to bundle an excessive number of cables.
· Appropriately bind long cables. Coil and use cable ties to secure unused cables.
· When connecting cables including data cables, power cords, and signal cables for a drive, make sure they click into place.
Multiple drives numbered sequentially report failure
Symptom
· The Fault/UID LEDs of multiple drives numbered sequentially are steady orange, indicating that the drives are faulty. For the location and indications of the drive LEDs, see the user guide for the drive.
· Failure information of multiple drives numbered sequentially is displayed in the HDM event log.
Possible causes
· Third-party cables or cables provided with other servers are used for the drives.
· Incorrect cable connections.
Solution
To resolve the issue:
1. Be sure that the drive cables including data cables, power cords, and signal cables are provided with the server, not third-party cables or cables provided with other servers. You can check the cable nodes and interface specifications to determine whether the drive cables are provided with the server.
2. When multiple drive backplanes are configured on the server, check and be sure that the data cables and signal cables of each drive backplane are correctly connected, without reverse connections or cross connections between the drive backplanes. For the correct cable connection methods, see the user guide for the server.
3. If the issue persists, contact Technical Support.
Troubleshooting software issues
OS issues
OS compatibility with the server
Symptom
The user cannot determine whether the operating system (OS) to be installed is compatible with the server.
Solution
To resolve the issue:
1. Use the OS compatibility query tool to query the OSs that are compatible with the server, and verify the compatibility between the server components and OSs.
2. If any other issues exist, contact Technical Support.
OS installation method
Symptom
The user cannot determine which OS installation methods are supported by the server, and how to select an appropriate installation method.
Solution
To resolve the issue, access the official website to obtain the OS installation guide. Learn the installation methods supported by the server and the associated application scenarios, and then select an appropriate installation method as needed.
OS installation error
Symptom
The errors as shown in Figure 151 and Figure 152 might occur during OS installation.
Figure 151 OS installation error I
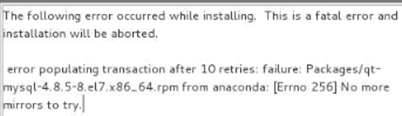
Figure 152 OS installation error II
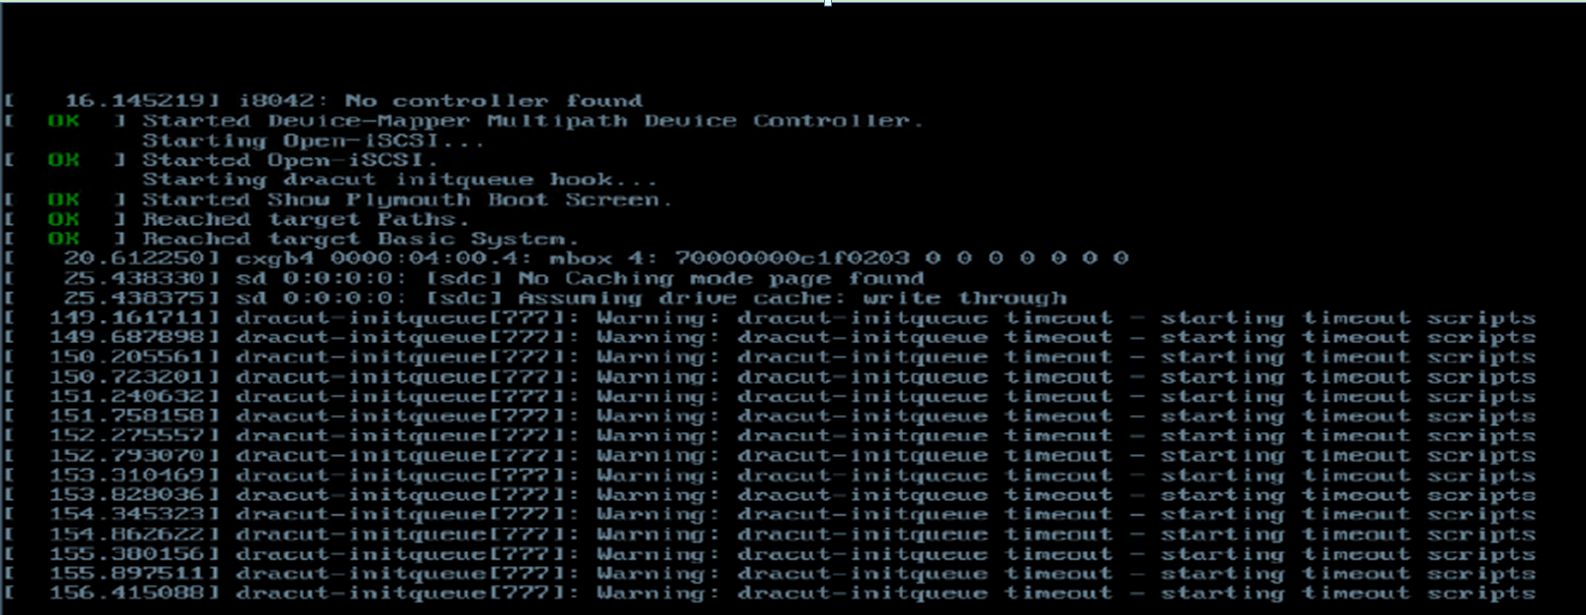
Possible causes
· The OS is not compatible with the server.
· The OS image file is damaged or modified.
· The OS installation procedure is incorrect.
· BIOS configuration error.
Solution
To resolve the issue:
1. Verify that the server is compatible with the OS. For more information, see "OS compatibility with the server."
2. Verify that the OS image file is complete and has not been modified.
3. Check the OS installation guide and verify that the installation procedure is correct.
4. Check the FAQ of the OS installation guide for relevant operation guide.
5. Verify that no special settings have been configured for BIOS. If special BIOS settings have been configured, reset BIOS settings to default values, and then reinstall the OS.
6. If the issue persists, contact Technical Support.
Hard disk identification issues during OS installation
Symptom
Some issues might occur during OS installation, such as hard disk identification failure, incorrect identification of hard disk capacity, and error reported upon location selection.
Possible causes
· The OS is not compatible with the server.
· Improper installation of the storage controller or hard disk.
· Incorrect cable connection for the storage controller or hard disk.
· Failure of the storage controller or hard disk.
· Incorrect RAID settings for the storage controller.
· Driver not loaded or low driver version on the storage controller.
· RAID configuration failure because of residual RAID settings on the hard disk.
Solution
To resolve the issue:
1. Verify that the server is compatible with the OS. For more information, see "OS compatibility with the server."
2. Verify that the storage media (hard disks, M.2 SSD cards, or SD cards) for the storage controller and OS have been correctly installed on the server.
3. Check for cable connection faults of the target storage device.
4. Check the Storage page of HDM or the Advanced page of BIOS (in UEFI mode only) to verify that the storage controller and target storage device can be correctly identified. If the identification fails, reinstall or replace the storage controller or storage device.
5. Check the storage controller configuration, including the storage controller mode and RAID settings.
6. Identify the storage controller model and OS version and verify that the storage controller driver has been loaded.
7. Update the storage controller driver to the latest version.
8. If the target storage device is a hard disk, check for residual RAID settings on the hard disk. If residual RAID settings exist, format the hard disk and then configure RAID settings again.
9. If the issues persist, contact Technical Support.
OS boot faults
Symptom
After you install the OS, you cannot enter the OS after rebooting it.
The following are the possible symptoms:
· On the Save & Exit page of the BIOS, you cannot see the boot option under the Boot Override option, as shown in Figure 153.
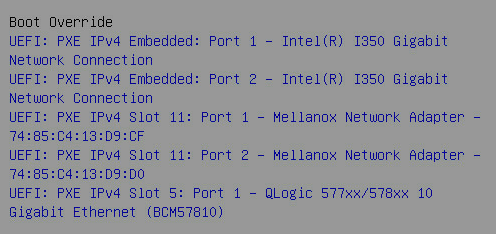
· An error occurs during the OS boot process, as shown in Figure 154.
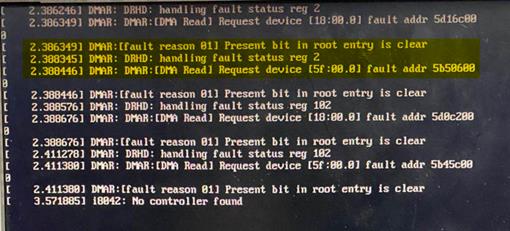
· The OS is stuck in the boot process, as shown in Figure 155.
Figure 155 OS stuck in boot process
Possible causes
· The OS is not compatible with the server.
· The BIOS startup mode has been changed.
· The server startup options in BIOS are incorrect.
· Certain settings in BIOS are abnormal.
· The BIOS firmware version is too low.
Solution
To resolve the issue:
1. Verify that the server is compatible with the OS. For more information, see "OS compatibility with the server."
2. Verify that the BIOS startup mode (UEFI or Legacy) is consistent with that during OS installation.
3. Check server startup options in BIOS and verify that the storage device running the OS is the first startup option.
4. Verify that the server BIOS has been updated to the latest version.
5. If another server is deployed and operating with similar hardware and software configuration as the faulty server, check the BIOS settings of that server. Then modify the BIOS settings of the faulty server according to the settings on that server.
6. If the issue persists, save relevant screenshots (for example, the screenshot of OS stuck in boot process or BIOS startup option settings), collect HDM SDS logs, and contact Technical Support.
Slow OS boot process
Symptom
After you install and reboot the OS, the BIOS startup process is normal and the OS can be booted, but the boot process is very slow.
Possible causes
· The OS is not compatible with the server.
· The driver version for the storage controller is too low.
Solution
To resolve the issue:
1. Verify that the server is compatible with the OS. For more information, see "OS compatibility with the server."
2. Verify that the driver of the storage controller has been updated to the latest version.
3. If the issue persists, contact Technical Support.
Hard disk capacity identification issue
Symptom
The OS can be correctly booted after being installed, but part of the hard disk capacity of the OS cannot be identified.
Possible causes
· The OS is not compatible with the server.
· The OS kernel or application software is running incorrectly.
· The driver version for the storage controller is too low.
Solution
To resolve the issue:
1. Verify that the server is compatible with the OS. For more information, see "OS compatibility with the server."
2. Check the RAID level of the storage controller. After you create a RAID with redundancy, the logical disk capacity is smaller than the total capacity of physical disks.
3. Check the Storage page of HDM or the Advanced page of BIOS (in UEFI mode) to verify that the hard disk capacity can be correctly identified. If the hard disk capacity can be correctly identified, update the storage controller driver. If the hard disk capacity cannot be correctly identified, contact Technical Support.
OS stuck in operation
Symptom
After correct operation of the server for a period of time, when you power on or power off the server, the OS fails to respond.
Possible causes
· The application software or the version of the firmware, driver, or OS kernel has been changed, and the latest version has not been installed.
· The OS kernel or application software is running incorrectly.
· Hardware problem of the server causes the OS issue.
Solution
1. Check for abnormal information displayed on the screen when the issue occurs. If abnormal information is displayed, save the screenshot. After reboot, collect OS logs and contact the OS vendor to locate the fault. If no abnormal information is displayed, proceed to steps 2 to 6.
3. Check the fault type (on a single device or multiple devices) and time.
4. Check for any most recent updates to the firmware or driver.
5. Check for any most recent updates to the OS kernel version or application software.
6. Check for anomalies in HDM sensor information and event logs.
¡ If anomalies exist, collect information in steps 2 to 5 and HDM SDS logs, and then contact Technical Support.
¡ If no anomalies exist, access the HDM web page, and click Execute in the NMI debug settings to forcibly generate dump files. After reboot, collect information in steps 2 to 5 and OS logs, and then contact the OS vendor to locate the fault.
Unexpected reboot of the OS
Symptom
After correct operation of the server for a period of time, the OS reboots unexpectedly.
Possible causes
· The application software or the version of the firmware, driver, or OS kernel has been changed, and the latest version has not been installed.
· The OS kernel or application software is running incorrectly.
· Hardware problem of the server causes the OS issue.
Solution
1. Check the fault type (on a single device or multiple devices) and time.
2. Check for any most recent version updates to the firmware or driver.
3. Check for any most recent updates to the OS kernel version or application software.
4. Check for anomalies in HDM sensor information and event logs.
¡ If anomalies exist, collect information in steps 1 to 3 and HDM SDS logs, and then contact Technical Support.
¡ If no anomalies exist, collect information in steps 1 to 3 and OS logs, and then contact the OS vendor to locate the fault.
Error messages in OS logs
Symptom
After correct operation of the server and OS for a period of time, error messages are displayed in OS logs.
Possible causes
· The application software or the version of the firmware, driver, or OS kernel has been changed, and the latest version has not been installed.
· The OS kernel or application software is running incorrectly.
· Hardware problem of the server causes the OS issue.
Solution
To resolve the issue:
1. Check for anomalies in HDM sensor information and event logs.
¡ If anomalies exist, collect HDM SDS logs, and then contact Technical Support.
¡ If no anomalies exist, collect the error messages and the OS logs, and then contact the OS vendor to locate the fault.
Anomalies after application program or OS patch installation
Symptom
After correct operation of the server for a period of time and installation of application programs or OS patches, OS anomalies occur. For example, error information is displayed, or the system is stuck or rebooted unexpectedly.
Possible causes
· The application programs or OS patches are not installed correctly.
· Hardware problem of the server causes the OS issue.
Solution
To resolve the issue:
1. Check for anomalies in HDM sensor information and event logs.
¡ If anomalies exist, collect HDM SDS logs, and then contact Technical Support.
¡ If no anomalies exist, collect the error information and OS logs, and then contact the OS vendor to locate the fault.
OS update issue
Symptom
Update is required for the OS kernel version according to service demands.
Prerequisites
Before OS version update, check the release notes corresponding to the update packages released by the OS vendor for the correct update method.
Solution
To resolve the issue:
1. Perform a full backup for OS before update.
2. Update the OS following the guide in the release notes corresponding to the OS update packages.
3. Check for component driver version updates. As a best practice, download and install the latest component driver version from the H3C website.
OS reinstallation
Symptom
After the OS becomes faulty, consider reinstalling the OS if you cannot troubleshoot the problem.
Solution
To resolve the issue:
1. Before reinstalling the OS, follow these guidelines:
¡ Make sure the server has sufficient resources (process performance, memory, and hard disk space) to run the OS and application software.
¡ Verify that the server is compatible with the OS. For more information, see "OS compatibility with the server."
¡ Access the official website of the application software to be deployed to identify the software operating environment. Make sure the OS version to be reinstalled meets the compatibility requirements of the application software.
¡ Verify that the server BIOS, HDM, and CPLD firmware has been updated to the latest version. For more information, see the firmware update guide.
2. Follow the OS installation guide to reinstall the OS.
Application software issues
|
|
NOTE: This section provides a guide for troubleshooting application software issues. To troubleshoot a specific issue, obtain the software-related user manual or consult the software provider. To locate cause of the fault based on hardware information, contact Technical Support. |
Zombie software
Symptom
The application software enters zombie state.
Possible causes
· The server hardware configuration cannot meet the software running environment.
· The software is not compatible with the OS.
· The software conflicts with other software installed on the server.
· The system resources are insufficient on the server.
· The server configuration has been modified recently.
· The server has been infected by virus.
Solution
To resolve the issue:
1. View the software guide to verify the following information:
¡ Verify that the server hardware configuration meets the software running environment.
¡ Verify that the software is compatible with the OS version.
¡ Verify that the software does not conflict with other software installed on the server.
2. Check the system resource usage and shut down unnecessary background programs.
3. Collect OS logs and application software logs. For more information, see "Collecting operating system logs" or the software user guide.
4. Check the OS and application software logs for the reason of the issue.
5. Check the OS logs to check the settings that cause the issue, and restore the default of the settings.
6. Use the most recent virus scanner program to detect and kill the virus.
7. If the issue persists, contact the software provider for technical support.
OS error after software configuration change
Symptom
After you change the software configuration, an OS operation error occurs.
Possible causes
The OS does not support the new software settings.
Solution
To resolve the issue:
1. View the software guide to check for relevant issues and solutions.
2. Collect OS logs. For more information, see "Collecting operating system logs."
3. Check the OS logs for the associated settings, and restore the default for the settings. Restore each setting at a time to locate the cause of the issue.
4. If the issue persists, contact the software provider for technical support.
OS error after installation of a new application program
Symptom
After you install a new application program, an OS operation error occurs.
Possible causes
· The server hardware configuration cannot meet the application program running environment.
· The application program is not compatible with the OS.
· The application program conflicts with existing application programs on the server.
· The application program requires specific BIOS or OS settings.
· The system resources are insufficient.
Solution
To resolve the issue:
1. View the application program guide to verify the following information:
¡ Verify that the server hardware configuration meets the application program running environment.
¡ Verify that the application program is compatible with the OS version.
¡ Verify that the application program does not conflict with existing application programs on the server.
¡ Verify that specific BIOS settings are required. For how to configure BIOS settings, see BIOS user guide of the product.
¡ Verify that specific OS settings are required, and modify the OS settings.
2. Check the system resource usage and shut down unnecessary background programs.
3. Collect OS logs. For more information, see "Collecting operating system logs."
4. View OS operation logs to locate the cause of the issue.
5. Try to reinstall the application program.
6. If the issue persists, contact the application program provider for technical support.
BIOS issues
BIOS alarm information (Intel processors)
As shown in Figure 156, BIOS alarm information is displayed on the Early POST interface. You can obtain the anomalies through the alarm information. Table 22 shows the alarm messages and associated actions for BIOS 2.00.XX. Table 23 shows the alarm messages and associated actions for BIOS 5.XX.
Figure 156 Early POST interface
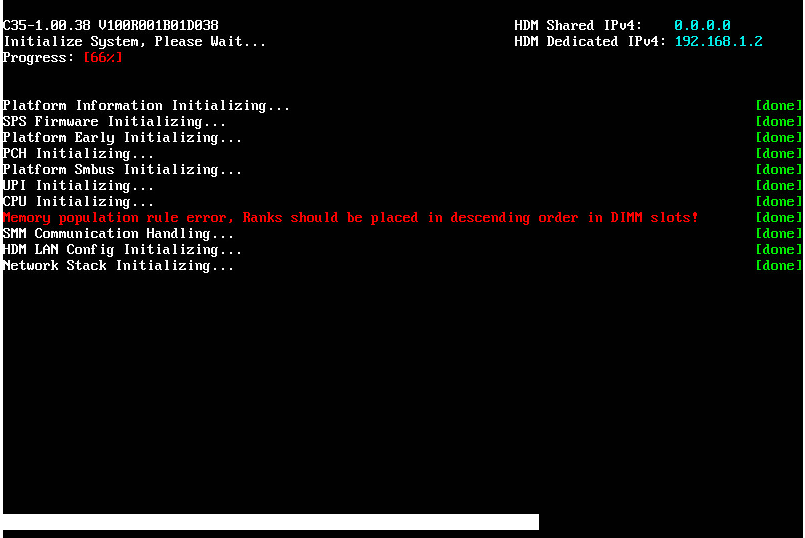
Table 22 Alarm messages and relevant actions (for BIOS 2.00.XX)
|
No. |
Component |
Alarm message |
Fault and associated action |
|
1 |
Memory |
Invalid memory configuration. Please refer to memory population rules in Server User Guide.- System Halted!" |
Invalid memory configuration. See the memory installation rules in the server user guide, and install again. |
|
2 |
Memory |
LRDIMM and RDIMM are installed in the system. The system cannot have both types of DIMMs installed. Please refer to memory population rules in Server User Guide.- System Halted! |
The system does not support installing both LRDIMM and RDIMM. This results in system halt error. See the memory installation rules in the user guide, and install again. |
|
3 |
Memory |
No memory is available or invalid memory configuration. Please refer to memory population rules in Server User Guide.- System Halted!" |
No memory modules installed or the installed memory modules are unavailable. The system fails to find a memory. Verify that the memory modules are installed correctly or replace the memory modules. |
|
4 |
Memory |
Memory Initializing... Some DIMMs fail Initialization,won't be available to OS! |
The OS fails to use the memory because of memory initialization errors. Replace the memory. |
|
5 |
Memory |
Memory population rule error, Ranks should be placed in descending order in DIMM slots! |
Memory installation error. You need to install memory ranks in descending order in DIMM slots. Install larger memory ranks first. Get rank information from the memory label. |
|
6 |
Memory |
Lockstep | Rank spare degrade to independent mode! |
In lockstep mode, the rank sparing mode is degraded to independent mode. Reinstall memory in the DIMM slots by using the mode-specific method. Memory mode degradation does not affect startup. |
|
7 |
Memory |
Lockstep | Mirror degrade to independent mode! |
In lockstep mode, the mirror mode is degraded to independent mode. Reinstall memory in the DIMM slots by using the mode-specific method. Memory mode degradation does not affect startup. |
|
8 |
Memory |
Lockstep | Partial mirror degrade to independent mode |
In lockstep mode, the partial mirror mode is degraded to independent mode. Reinstall memory in the DIMM slots by using the mode-specific method. Memory mode degradation does not affect startup. |
|
9 |
Memory |
Lockstep degrade to independent mode! |
The lockstep mode is degraded to independent mode. Reinstall memory in the DIMM slots by using the mode-specific method. Memory mode degradation does not affect startup. |
|
10 |
Memory |
Rank spare degrade to independent mode! |
The rank sparing mode is degraded to independent mode. Reinstall memory in the DIMM slots by using the mode-specific method. Memory mode degradation does not affect startup. |
|
11 |
Memory |
Mirror degrade to independent mode |
The mirror mode is degraded to independent mode. Reinstall memory in the DIMM slots by using the mode-specific method. Memory mode degradation does not affect startup. |
|
12 |
Memory |
Partial mirror degrade to independent mode! |
The partial mirror mode is degraded to independent mode. Reinstall memory in the DIMM slots by using the mode-specific method. Memory mode degradation does not affect startup. |
|
13 |
Video card |
Warning: Early VGA will stop work, Due to CPU1 offboard video is active |
In Legacy mode, an external video card is connected to a CPU except for CPU 0. The VGA no longer displays the Early POST interface. |
|
14 |
UPI |
UPI Topology mismatch is detected. |
A CPU type mismatch is detected on the server. You need to replace a matching CPU. |
|
15 |
CPU |
CPU Microcode mismatch is detected. |
A CPU microcode mismatch is detected. You need to replace a matching CPU. |
|
16 |
CPU |
CPU Frequency mismatch is detected. |
A CPU frequency mismatch is detected. You need to replace a matching CPU. |
|
17 |
CPU |
CPU Frequency,Microcode mismatches are detected. |
CPU frequency and microcode mismatches are detected. You need to replace a matching CPU. |
|
18 |
CPU |
CPU Stepping mismatch is detected. |
A CPU stepping mismatch is detected. You need to replace a matching CPU. |
|
19 |
CPU |
CPU Stepping,Microcode mismatches are detected. |
CPU stepping and microcode mismatches are detected. You need to replace a matching CPU. |
|
20 |
CPU |
CPU Stepping,Frequency mismatches are detected. |
CPU stepping and frequency mismatches are detected. You need to replace a matching CPU. |
|
21 |
CPU |
CPUStepping,Frequency,Microcode mismatches are detected. |
CPU stepping, frequency, and microcode mismatches are detected. You need to replace a matching CPU. |
Table 23 Alarm messages and relevant actions (for BIOS 5.XX)
|
No. |
Component |
Alarm message |
Fault and associated action |
|
1 |
Memory |
WARNING: Invalid DIMM configuration. |
The memory installation method does not meet the requirement. See the memory installation rules in the server user guide, and install again. |
|
2 |
Memory |
WARNING: Different DIMM types are detected. System halt occurred. |
The system detects different memory installation methods. This results in system halt error. See the memory installation rules in the user guide, and install again. |
|
3 |
Memory |
WARNING: No memory is available or memory configuration is invalid. System halt occurred. |
No memory modules installed or the installed memory modules are unavailable. The system fails to find a memory. Verify that the memory modules are installed correctly or replace the memory modules. |
|
4 |
Memory |
WARNING: Some DIMMs are not initialized. Please review HDM event logs. |
Some DIMMs are not initialized. Please check the HDM event logs to locate the fault and replace the faulty memory module. |
|
5 |
Memory |
WARNING: Memory Lockstep and Rank Sparing degraded to Independent mode. |
In lockstep mode, the rank sparing mode is degraded to independent mode. Reinstall memory in the DIMM slots by using the mode-specific method. Memory mode degradation does not affect startup. |
|
6 |
Memory |
WARNING: Memory Lockstep and Mirror degraded to Independent mode. |
In lockstep mode, the mirror mode is degraded to independent mode. Reinstall memory in the DIMM slots by using the mode-specific method. Memory mode degradation does not affect startup. |
|
7 |
Memory |
WARNING: Memory Lockstep and Partial Mirror degraded to Independent mode. |
In lockstep mode, the partial mirror mode is degraded to independent mode. Reinstall memory in the DIMM slots by using the mode-specific method. Memory mode degradation does not affect startup. |
|
8 |
Memory |
WARNING: Memory Lockstep degraded to Independent mode. |
The lockstep mode is degraded to independent mode. Reinstall memory in the DIMM slots by using the mode-specific method. Memory mode degradation does not affect startup. |
|
9 |
Memory |
WARNING: Memory Rank Sparing degraded to Independent mode. |
The rank sparing mode is degraded to independent mode. Reinstall memory in the DIMM slots by using the mode-specific method. Memory mode degradation does not affect startup. |
|
10 |
Memory |
WARNING: Memory Mirror degraded to Independent mode. |
The mirror mode is degraded to independent mode. Reinstall memory in the DIMM slots by using the mode-specific method. Memory mode degradation does not affect startup. |
|
11 |
Memory |
WARNING: Memory Partial Mirror degraded to Independent mode. |
The partial mirror mode is degraded to independent mode. Reinstall memory in the DIMM slots by using the mode-specific method. Memory mode degradation does not affect startup. |
|
12 |
Memory |
WARNING: Memory ADDDC degraded to Independent mode. |
The system does not support memory ADDDC, and starts up with the independent mode. Replace the x8 memory with an x4 memory. |
|
13 |
Memory |
WARNING: Memory SDDC degraded to Independent mode. |
The system does not support memory SDDC, and starts up with the independent mode. Check for model mismatch between the memory and CPU. |
|
14 |
Memory |
WARNING: Memory mapping degraded. |
Memory mapping is degraded. See the memory installation rules in the server user guide, and install again. |
|
15 |
MCA |
WARNING: Last boot MCE detected. Please review HDM logs. |
An MCE error has been detected in the most recent reboot. Please check the HDM event logs to locate the fault. |
|
16 |
UPI |
WARNING: Mismatched UPI link option configuration. |
A CPU type mismatch is detected on the server. You need to replace a matching CPU. |
|
17 |
UPI |
WARNING: System is operating in KTI link low speed mode. |
The UPI link is operating in low speed mode. Please check the UPI settings in BIOS. If the problem persists, try replacing the main board. |
|
19 |
UPI |
WARNING: CPU link training issue. Topology changed after reset. |
The UPI link training is abnormal. The topology is changed after reset. Try replacing the main board. |
|
20 |
UPI |
WARNING: UPI resource allocation issue. |
UPI resource allocation failed. Try restoring the default BIOS settings and reboot the system. |
|
21 |
UPI |
WARNING: Mismatched UPI topology. |
UPI topology mismatch is detected. Verify that the number of CPUs installed meets the installation requirement. |
|
22 |
PCIe |
WARNING: Bandwidth or speed degrade detected for IIO port. |
Bandwidth or speed degradation is detected for the PCIe card. Check the gold finger installation of the PCIe card. |
|
23 |
CPU |
WARNING: CPU BIST detected core issue. Faulty cores have been disabled. |
In the CPU BIST process, core issues are detected, and faulty cores have been disabled. This fault does not affect system startup, but certain cores become unavailable. |
|
24 |
CPU |
WARNING: Mismatched CPU microcode. |
A CPU microcode mismatch is detected. You need to replace a matching CPU. |
|
25 |
CPU |
WARNING: Mismatched CPU frequency. |
A CPU frequency mismatch is detected. You need to replace a matching CPU. |
|
26 |
CPU |
WARNING: Mismatched CPU frequency and microcode. |
CPU frequency and microcode mismatches are detected. You need to replace a matching CPU. |
|
27 |
CPU |
WARNING: Mismatched CPU stepping. |
A CPU stepping mismatch is detected. You need to replace a matching CPU. |
|
28 |
CPU |
WARNING: Mismatched CPU stepping and microcode. |
CPU stepping and microcode mismatches are detected. You need to replace a matching CPU. |
|
29 |
CPU |
WARNING: Mismatched CPU stepping and frequency. |
CPU stepping and frequency mismatches are detected. You need to replace a matching CPU. |
|
30 |
CPU |
WARNING: Mismatched CPU stepping, frequency, and microcode. |
CPU stepping, frequency, and microcode mismatches are detected. You need to replace a matching CPU. |
|
31 |
BIOS |
ERROR: BIOS flash firmware damaged. System halt occurred. |
The BIOS flash firmware is damaged, and the system is halted. Do not update the BIOS during BIOS startup. When the error occurs, update the BIOS firmware again with forcible overwrite. |
|
32 |
BIOS |
WARNING: BIOS flash firmware damaged. |
The BIOS flash firmware is damaged. Do not update the BIOS during BIOS startup. When the error occurs, update the BIOS firmware again with forcible overwrite. |
|
33 |
HDM |
WARNING: Cannot obtain configuration data from HDM. |
Failed to obtain configuration data from HDM. The communication with HDM is abnormal. Please check the HDM status or reboot HDM. |
BIOS alarm information (AMD processors)
As shown in Figure 157, BIOS alarm information is displayed on the interface during startup. You can view the information to locate errors. For servers using AMD processors, refer to Table 24 for BIOS alarm messages and the recommended actions.
Figure 157 Alarm information during startup (AMD processors)
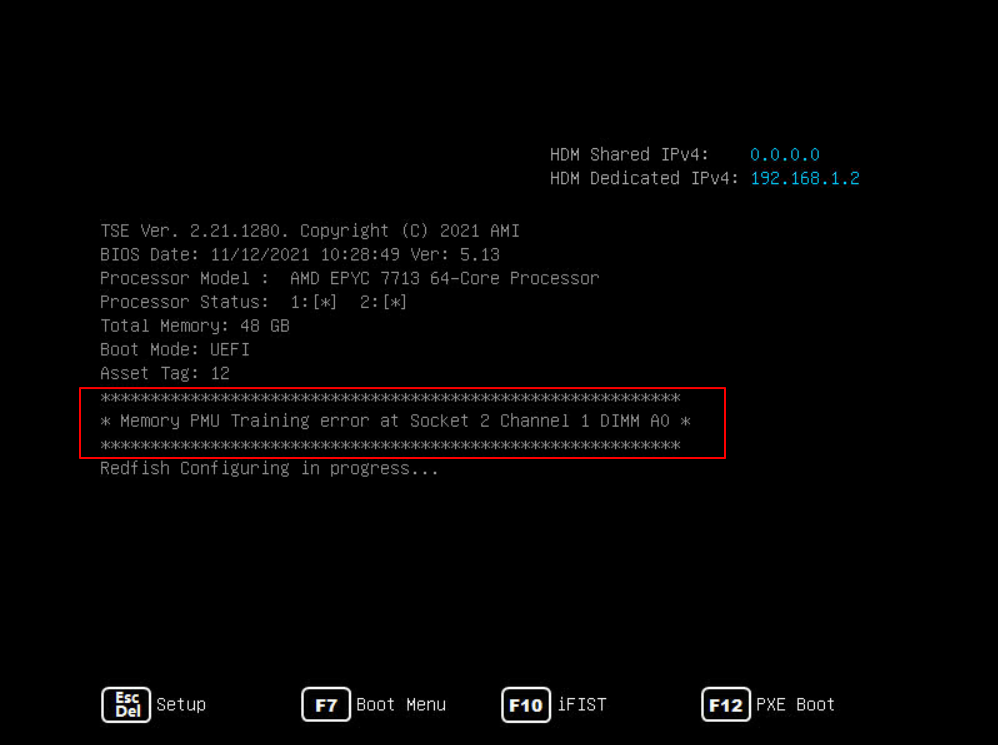
Table 24 Alarm messages and recommended actions (AMD processors)
|
component |
Alarm message |
Description |
Recommended actions |
|
HDM |
WARNING: Get configuration data from HDM failed! |
Failed to get configuration data from HDM. Errors occurred during message exchanges with HDM. |
Verify the HDM status or reboot HDM. |
|
HDM |
WARNING: Parse HDM configuration data failed! |
Failed to parse HDM configuration data. Errors occurred during message exchanges with HDM. |
Verify the HDM status or reboot HDM. |
|
Memory |
Memory PMU training error at Socket:%d Channel:%d Dimm:%c%d |
Errors occurred during memory PMU training. |
Verify that the DIMMs are installed correctly or replace the DIMMs. |
|
Memory |
Agesa Memory Test error at Socket Socket:%d Channel:%d Dimm:%c%d |
Errors occurred during memory test, which interrupted the test. |
Verify that the DIMMs are installed correctly or replace the DIMMs. |
|
Memory |
Mixed ECC and non-ECC DIMM in system at Socket:%d Channel:%d |
Both ECC and non-ECC DIMMs are installed on the same server. |
Replace the ECC or non-ECC DIMMs and make sure all DIMMs present are of the same type (ECC or non-ECC). |
|
Memory |
Mix certain vendor LRDIMM with other vendor LRDIMM in the same channel, at Socket:%d Channel:%d |
LRDIMMs from different vendors are installed on the same server. |
Re-install LRDIMMs and make sure that all LRDIMMs on a server are from the same vendor. |
|
CPU |
CCD BIST error at Socket %d Die %d CCD %d |
CPU CCD BIST failed. |
Check the installed processors for errors and replace the faulty ones. |
BIOS alarm information (Hygon processors)
As shown in Figure 158, BIOS alarm information is displayed on the interface during startup. You can view the information to locate errors. For servers using Hygon processors, refer to Table 25 for BIOS alarm messages and the recommended actions.
Figure 158 Alarm information during startup (Hygon processors)

Table 25 Alarm messages and recommended actions (Hygon processors)
|
Component |
BIOS alarm message |
Description |
Recommended actions |
|
USB |
WARNING: No USB Keyboard Present |
USB keyboard is not recognized. |
Re-connect the USB keyboard. |
|
CMOS |
ERROR: CMOS BAD. Setup Data loaded default. |
CMOS error occurred. BIOS Setup settings are restored to the default. |
Re-install the CMOS battery. |
|
Memory |
Memory PMU training error at Socket:%d Channel:%d Dimm:%c%d |
Memory PMU training error occurred. |
Verify that the DIMMs are installed in place or replace the DIMMs. |
HDM issues
Firmware image file upload failure
Symptom
The firmware image file fails to be uploaded.
Possible causes
· Mismatch between the firmware type and firmware image file, or between the firmware image file and server model.
· A firmware upgrade is in progress.
· The firmware image file is damaged or modified.
· The network communication is abnormal.
Solution
To resolve the issue:
1. Select the firmware type matching the firmware image file on the firmware update page. If the issue persists, proceed to the next step.
2. Verify that the firmware image file matches the server model. If the issue persists, proceed to the next step.
3. Verify that no firmware upgrade is in progress.
¡ If firmware upgrade is in progress, upload the firmware image file after the upgrade completes.
¡ If no firmware upgrade is in progress, proceed to the next step.
5. Verify that the network communication is in normal status.
¡ If network communication is in normal status, contact Technical Support.
¡ If network communication is in abnormal status, check and restore the normal network communication.
Failure to access HDM web pages
Symptom
HDM web pages cannot be accessed correctly.
Possible causes
· The HDM management interface IP address is not on the same network segment as the HDM client IP address.
· The HDM client proxy settings are incorrect.
· No network cable is connected to the HDM management interface or the network connection is in abnormal status.
· The IP address or MAC address of the client is blocked by the HDM firewall.
Solution
To resolve the issue:
1. Verify that the HDM management interface IP address is on the same network segment as the HDM client IP address.
¡ If they are on the same network segment, proceed to the next step.
¡ If they are not on the same network segment, modify the network settings of the HDM client.
2. Verify that the HDM client has proxy settings.
¡ If proxy settings are configured, disable the proxy settings.
¡ If no proxy settings are configured, proceed to the next step.
3. Verify that a network cable is connected to the HDM management interface.
¡ If a network cable is connected, verify that the network interface and network cable are in normal status.
- If they are in normal status, proceed to the next step.
- If they are not in normal status, contact Technical Support to replace the faulty component.
¡ If no network cable is connected, connect a network cable correctly.
5. If the issue persists, contact Technical Support.
Configuration file import failure
Symptom
The configuration file cannot be imported.
Possible causes
· The configuration file type does not match the imported configuration type.
· Invalid values exist in the configuration file.
· The product name in the configuration file does not match the imported server model.
· The network connection is interrupted during the import process.
Solution
To resolve the issue:
1. Select the configuration type that matches the configuration file on the configuration import and export page. If the issue persists, proceed to the next step.
2. Verify that all values in the configuration file are valid.
¡ If they are all valid, proceed to the next step.
¡ If invalid values exist, edit the values.
3. Verify that the product name in the configuration file matches the imported server model.
¡ If they match, proceed to the next step.
¡ If they do not match, update the configuration file, or select the server matching the product name in the configuration file.
4. For a BIOS configuration file, check for dependent settings. For other configuration files, proceed to the next step.
¡ If dependent settings exist, edit the settings.
¡ If no dependent settings exist, proceed to the next step.
5. Verify that the network communication is in normal status during the import process.
¡ If network communication is in normal status, contact Technical Support.
¡ If not, restore the normal network communication.
Failure to open the KVM link
Symptom
The KVM link cannot be opened, so the KVM remote console cannot be accessed.
Possible causes
· An exclusive KVM session has been opened.
· The KVM service is not enabled.
· The KVM environment is not configured for the HDM client.
· The HDM client proxy settings are incorrect.
· Network communication issues.
Solution
To resolve the issue:
1. Verify that an exclusive KVM session has been opened.
¡ If such a session has been opened, close the session.
¡ If no such a session has been opened, proceed to the next step.
2. Access the service configuration page as shown in Figure 159, and make sure that the KVM service is enabled.
Figure 159 Service configuration page
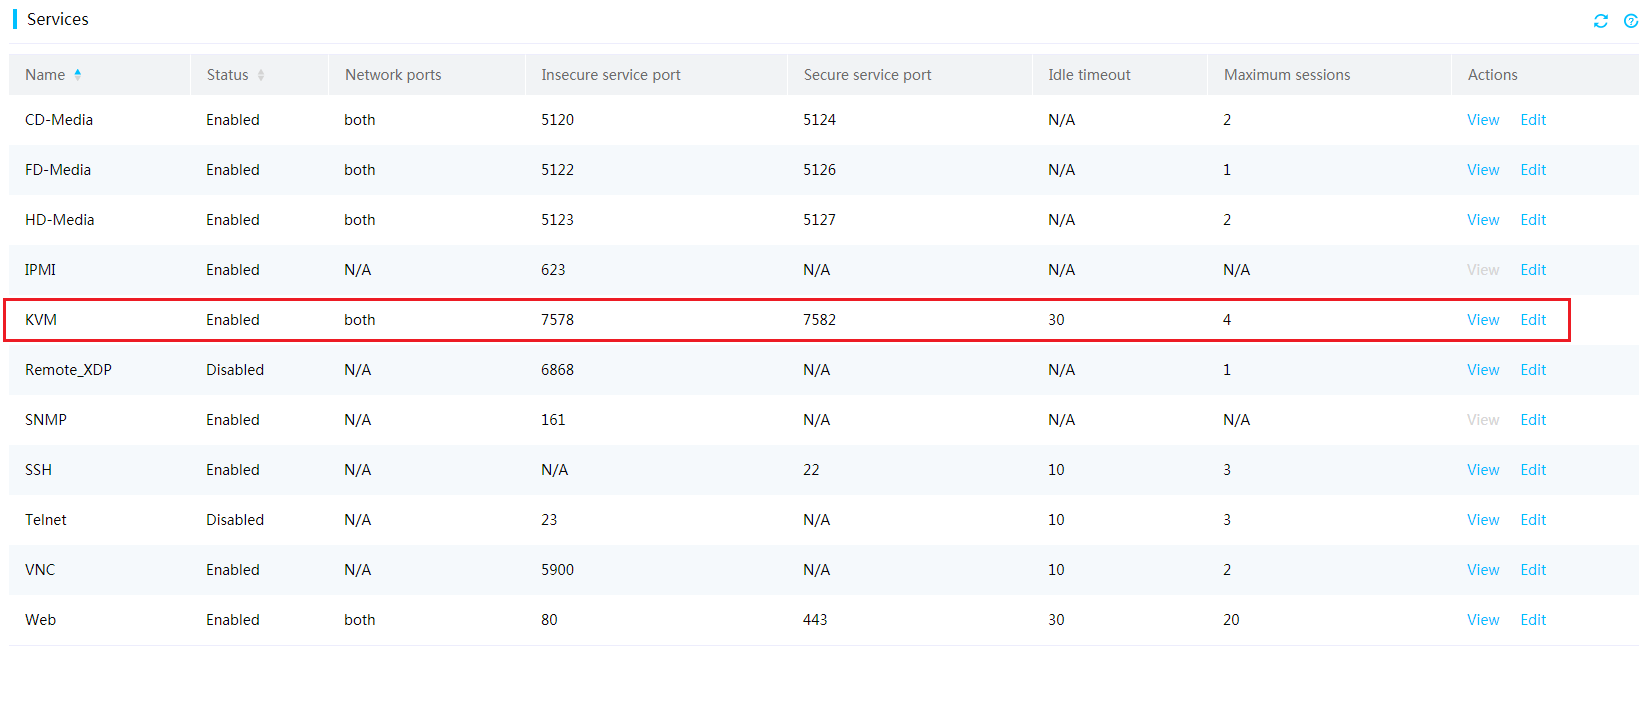
¡ If the KVM service is enabled, proceed to the next step.
¡ If the KVM service is disabled, click Edit in the Actions column to enable the KVM service.
3. Verify that the KVM environment has been correctly configured for the HDM client.
¡ If the KVM environment is configured, proceed to the next step.
¡ If the KVM environment is not configured, configure the KVM environment. For more information, see the remote console settings in the HDM user guide.
4. Verify that the HDM client has proxy settings.
¡ If proxy settings are configured, disable the proxy settings.
¡ If no proxy settings are configured, proceed to the next step.
5. Verify that the network environment is in normal status.
¡ If network environment is in normal status, contact Technical Support.
¡ If network environment is in abnormal status, make sure the network communication is normal.
KVM usage anomalies
Symptom
The KVM session can be opened, but the following anomalies might occur:
· The KVM keyboard and mouse are abnormal.
· The KVM display is abnormal.
· The image file fails to be mounted through KVM.
· The OS image file is successfully mounted through KVM, but the OS installation is slow or fails.
Possible causes
· OS issues.
· Network communication issues.
· HDM configuration issues.
Solution
To resolve the issue:
· Troubleshoot KVM keyboard and mouse issues.
a. Change the mouse mode for the best user experience.
b. If the keyboard and mouse directly connected to the server is used, as a best practice, use the keyboard and mouse directly connected to the HDM client.
c. If the issue persists, contact Technical Support.
· The KVM display is abnormal.
a. Verify that the network communication in normal.
- If the network communication is normal, proceed to the next step.
- If the network communication is abnormal, restore the normal network communication.
c. If the issue persists, contact Technical Support.
· The image file fails to be mounted through KVM.
a. Access the service configuration page as shown in Figure 160, and make sure the CD-Media, FD-Media, and HD-Media services are enabled.
Figure 160 Service configuration page
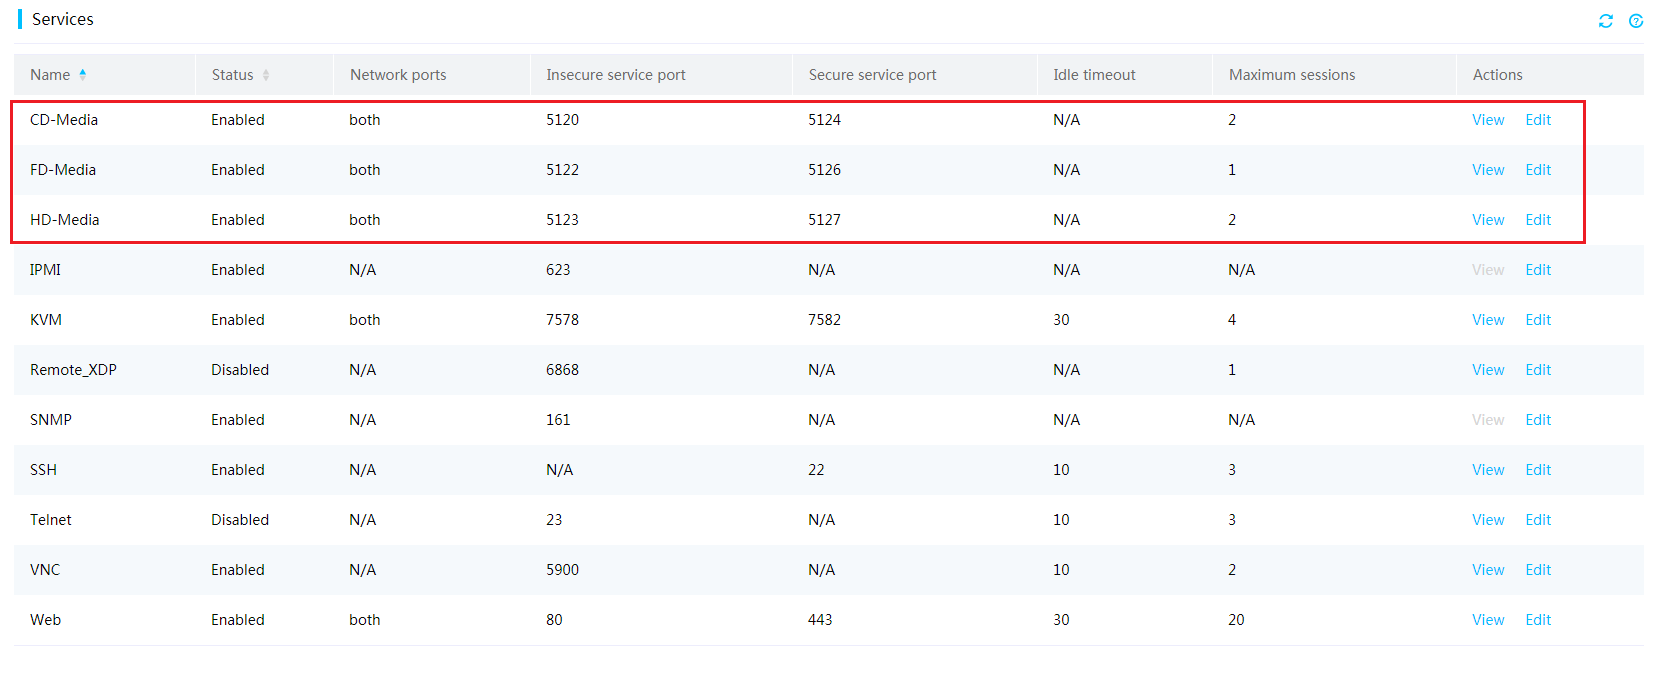
- If the services are enabled, proceed to the next step.
- If the services are disabled, click Edit in the Actions column to enable the services.
a. Verify that the network communication is in normal status.
- If the network communication is in normal status, contact Technical Support.
- If the network communication is abnormal, restore the normal network communication.
· The OS image file is successfully mounted through KVM, but the OS installation is slow or fails.
a. Verify that the network communication is in normal status.
- If the network communication is in normal status, proceed to the next step.
- If the network communication is abnormal, restore the normal network communication.
- If the requirements are met, set the network adapter properties to 100 Mbps Full Duplex for the HDM client environment, as shown in Figure 161, or select Options > CD/DVD Acceleration on the KVM page, and then reinstall the OS.
- If the requirements are not met, proceed to the next step.
Figure 161 Setting network adapter properties
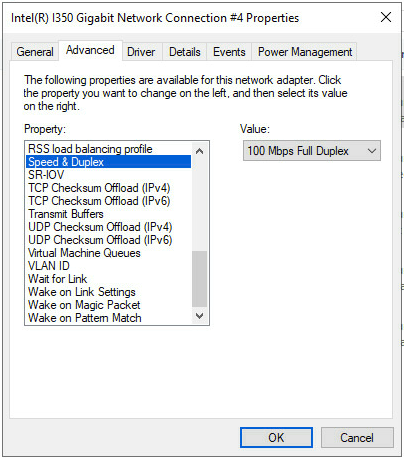
b. If the issue persists, contact Technical Support.
Slow or failed OS installation on H5 KVM
Symptom
The OS image file is successfully mounted through H5 KVM, but the OS installation is slow or fails.
Possible causes
· Network communication issues.
· HDM configuration issues.
Solution
To resolve the issue:
1. Verify that the network communication is in normal status.
¡ If the network communication is in normal status, proceed to the next step.
¡ If the network communication is abnormal, restore the normal network communication.
2. Verify that the H5 KVM session is in non-encryption mode.
¡ If the session is in non-encryption mode, proceed to the next step.
¡ If the session is not in non-encryption mode, exit the session and enable the non-encryption-mode H5 KVM, and then reinstall the OS.
¡ If the requirements are met, set the network adapter properties to 100 Mbps Full Duplex for the HDM client environment, as shown in Figure 162, or select Options > CD/DVD Acceleration on the H5 KVM page, and then reinstall the OS.
¡ If the requirements are not met, proceed to the next step.
Figure 162 Setting network adapter properties

5. If the issue persists, contact Technical Support.
iFIST issues
Device information error during server diagnosis
Symptom
If the server HDM version is lower than 1.30.11, the server diagnosis information about certain components, such as BIOS, HDM, fan, PSU, and temperature, are different than their actual status.
Possible causes
The server diagnosis information comes from the SDS logs of the HDM. If the HDM version is lower than 1.30.11, the diagnosis function obtains the most recently downloaded SDS logs. The logs are not obtained in real time.
Solution
To resolve the issue:
1. Download all SDS logs on the HDM page, and then scan device information again.
2. Update the HDM version to 1.30.12 or higher.
3. If the issue persists, contact Technical Support.
Failure to diagnose hard disk issues
Symptom
The server cannot diagnose member disks of logical disks.
Possible causes
The server cannot locate the paths where the member disks of logical disks are located.
Solution
To resolve the issue:
1. Verify that the logical disks contain important data.
¡ If the logical disks contain important data, contact Technical Support.
¡ If the logical disks do not contain important data, delete the logical disks, and then restart the server diagnosis operation. Then, proceed to the next step.
2. Scan device information, and then select hard disks to perform diagnosis.
3. If the issue persists, contact Technical Support.
iFIST startup failure
Symptom
The iFIST software cannot start up.
Possible causes
· The BIOS version is not compatible with the iFIST version.
· The iFIST software is not installed correctly.
Solution
To resolve the issue:
1. Restart iFIST.
2. Update the BIOS firmware version, and the restart iFIST. For information about iFIST-compatible BIOS versions, see the compatibility matrix in the iFIST release notes.
3. Update iFIST. For more information, see the iFIST user guide.
4. If the issue persists, contact Technical Support.
Component driver and firmware issues
Observe the relevant restrictions and guidelines when you obtain the component driver and firmware.
Driver and firmware version
Use the OS compatibility query tool to query the recommended driver and firmware version for the component compatible with a specific OS.
Compatibility between HDM and firmware
For information about the compatibility between HDM and firmware, see the HDM release notes.
Compatibility between BIOS and firmware
For information about the compatibility between BIOS and firmware, see the BIOS release notes.
Table 26 shows the components that integrate the firmware into BIOS. You can upgrade the firmware for the components only by upgrading BIOS.
Table 26 Components with firmware integrated into BIOS
|
Component type |
Model |
|
MLOM adapter |
NIC-10GE-2P-560F-L2 |
|
MLOM adapter |
NIC-10GE-2P-560T-L2 |
|
MLOM adapter |
NIC-GE-4P-360T-L3 |
Version upgrade
Before upgrading a version, see the related release notes to verify the compatibility of the software with the firmware and driver.
You can resolve many common issues by upgrading the software, firmware, and driver.
You can upgrade the following items on the server:
· Firmware of the host software: HDM, BIOS, and CPLD.
· Firmware and driver of these components: Hard drive, hard drive backplane, storage control card, NIC, GPU, FC HBA, and power supply module.
Companion documents for upgrade
The companion documents for HDM, BIOS, FIST, and iFIST are identified by versions. Please use the correct version of guides and releases notes when you upgrade an item.
The documents listed in this section are subject to change without notice. Please obtain the latest documents from the official website.
Companion documents for upgrading HDM and BIOS
Upgrading a single device
· Host software release notes
· Firmware update guide
· Server REPO user guide
Upgrading devices in bulk
· Host software release notes
· Server REPO user guide
· FIST user guide
· FIST installation guide
· FIST online help
· Firmware update guide
Companion documents for upgrading the firmware and driver of components
Upgrading a single device
· Option driver and firmware release notes
· Server REPO user guide
· Operating system installation guide
Upgrading devices in bulk
· Option driver and firmware release notes
· Server REPO user guide
· FIST user guide
· FIST installation guide
· FIST online help
· Firmware update guide
Contents of the companion documents
Table 27 Contents of the companion documents
|
Field |
Description |
|
Host software release notes |
Displays detailed information about server host software (HDM and BIOS): · Supported hardware platforms. |
|
Server REPO user guide |
Provides information about updating repositories (REPOs) on a single device or on multiple devices in bulk. A repository (REPO) is a collection of firmware and driver of components, including HDM, BIOS, CPLD, and storage controller. |
|
Firmware update guide |
Describes procedures of updating the firmware of HDM, BIOS, CPLD, and PSU on a single device or on multiple devices in bulk. |
|
FIST user guide |
FIST is a server management tool that allows you to flexibly and quickly configure rack servers, blade servers, and switches in bulk. FIST allows you to perform the following tasks: · Manage servers in bulk. · Install operating systems in bulk. · Configure RAID in bulk. · Update driver and firmware in bulk. · Installation by cloning. · Manage enclosures and systems. |
|
FIST installation guide |
Describes how to install and use FIST. |
|
FIST online help |
Describes information about the functions that can be configured from the Web interface. |
|
Option driver and firmware release notes |
Describes version information about the driver and firmware of each component and the update methods. |
|
Operating system installation guide |
Describes the operating system (OS) installation methods and installation steps and contains the following contents: · Installing an OS through the BIOS. · Installing an OS through FIST. · Installing an OS through iFIST. · Installing drivers. |
Software and configuration utilities
Relationship among software and configuration utilities
As shown in Figure 163, the software and configuration utilities relate to each other as follows:
· Internally, HDM communicates with BIOS, iFIST, and components (including firmware of components) to monitor and manage the server. Externally, HDM communicates with management tools, O&M systems, and users.
· BIOS boots the OS and iFIST and reports various messages to HDM.
· iFIST can perform RAID configuration, OS auto installation, and hardware diagnostics.
· FIST can work with REPO to bulk upgrade HDM, BIOS, component firmware, and driver.
· U-Center and FIST can bulk manage servers based on HDM, FIST SMS, and iFIST. The FIST SMS is a program on the OS used to support some functions of FIST and HDM.
Figure 163 Relationship among software and configuration utilities
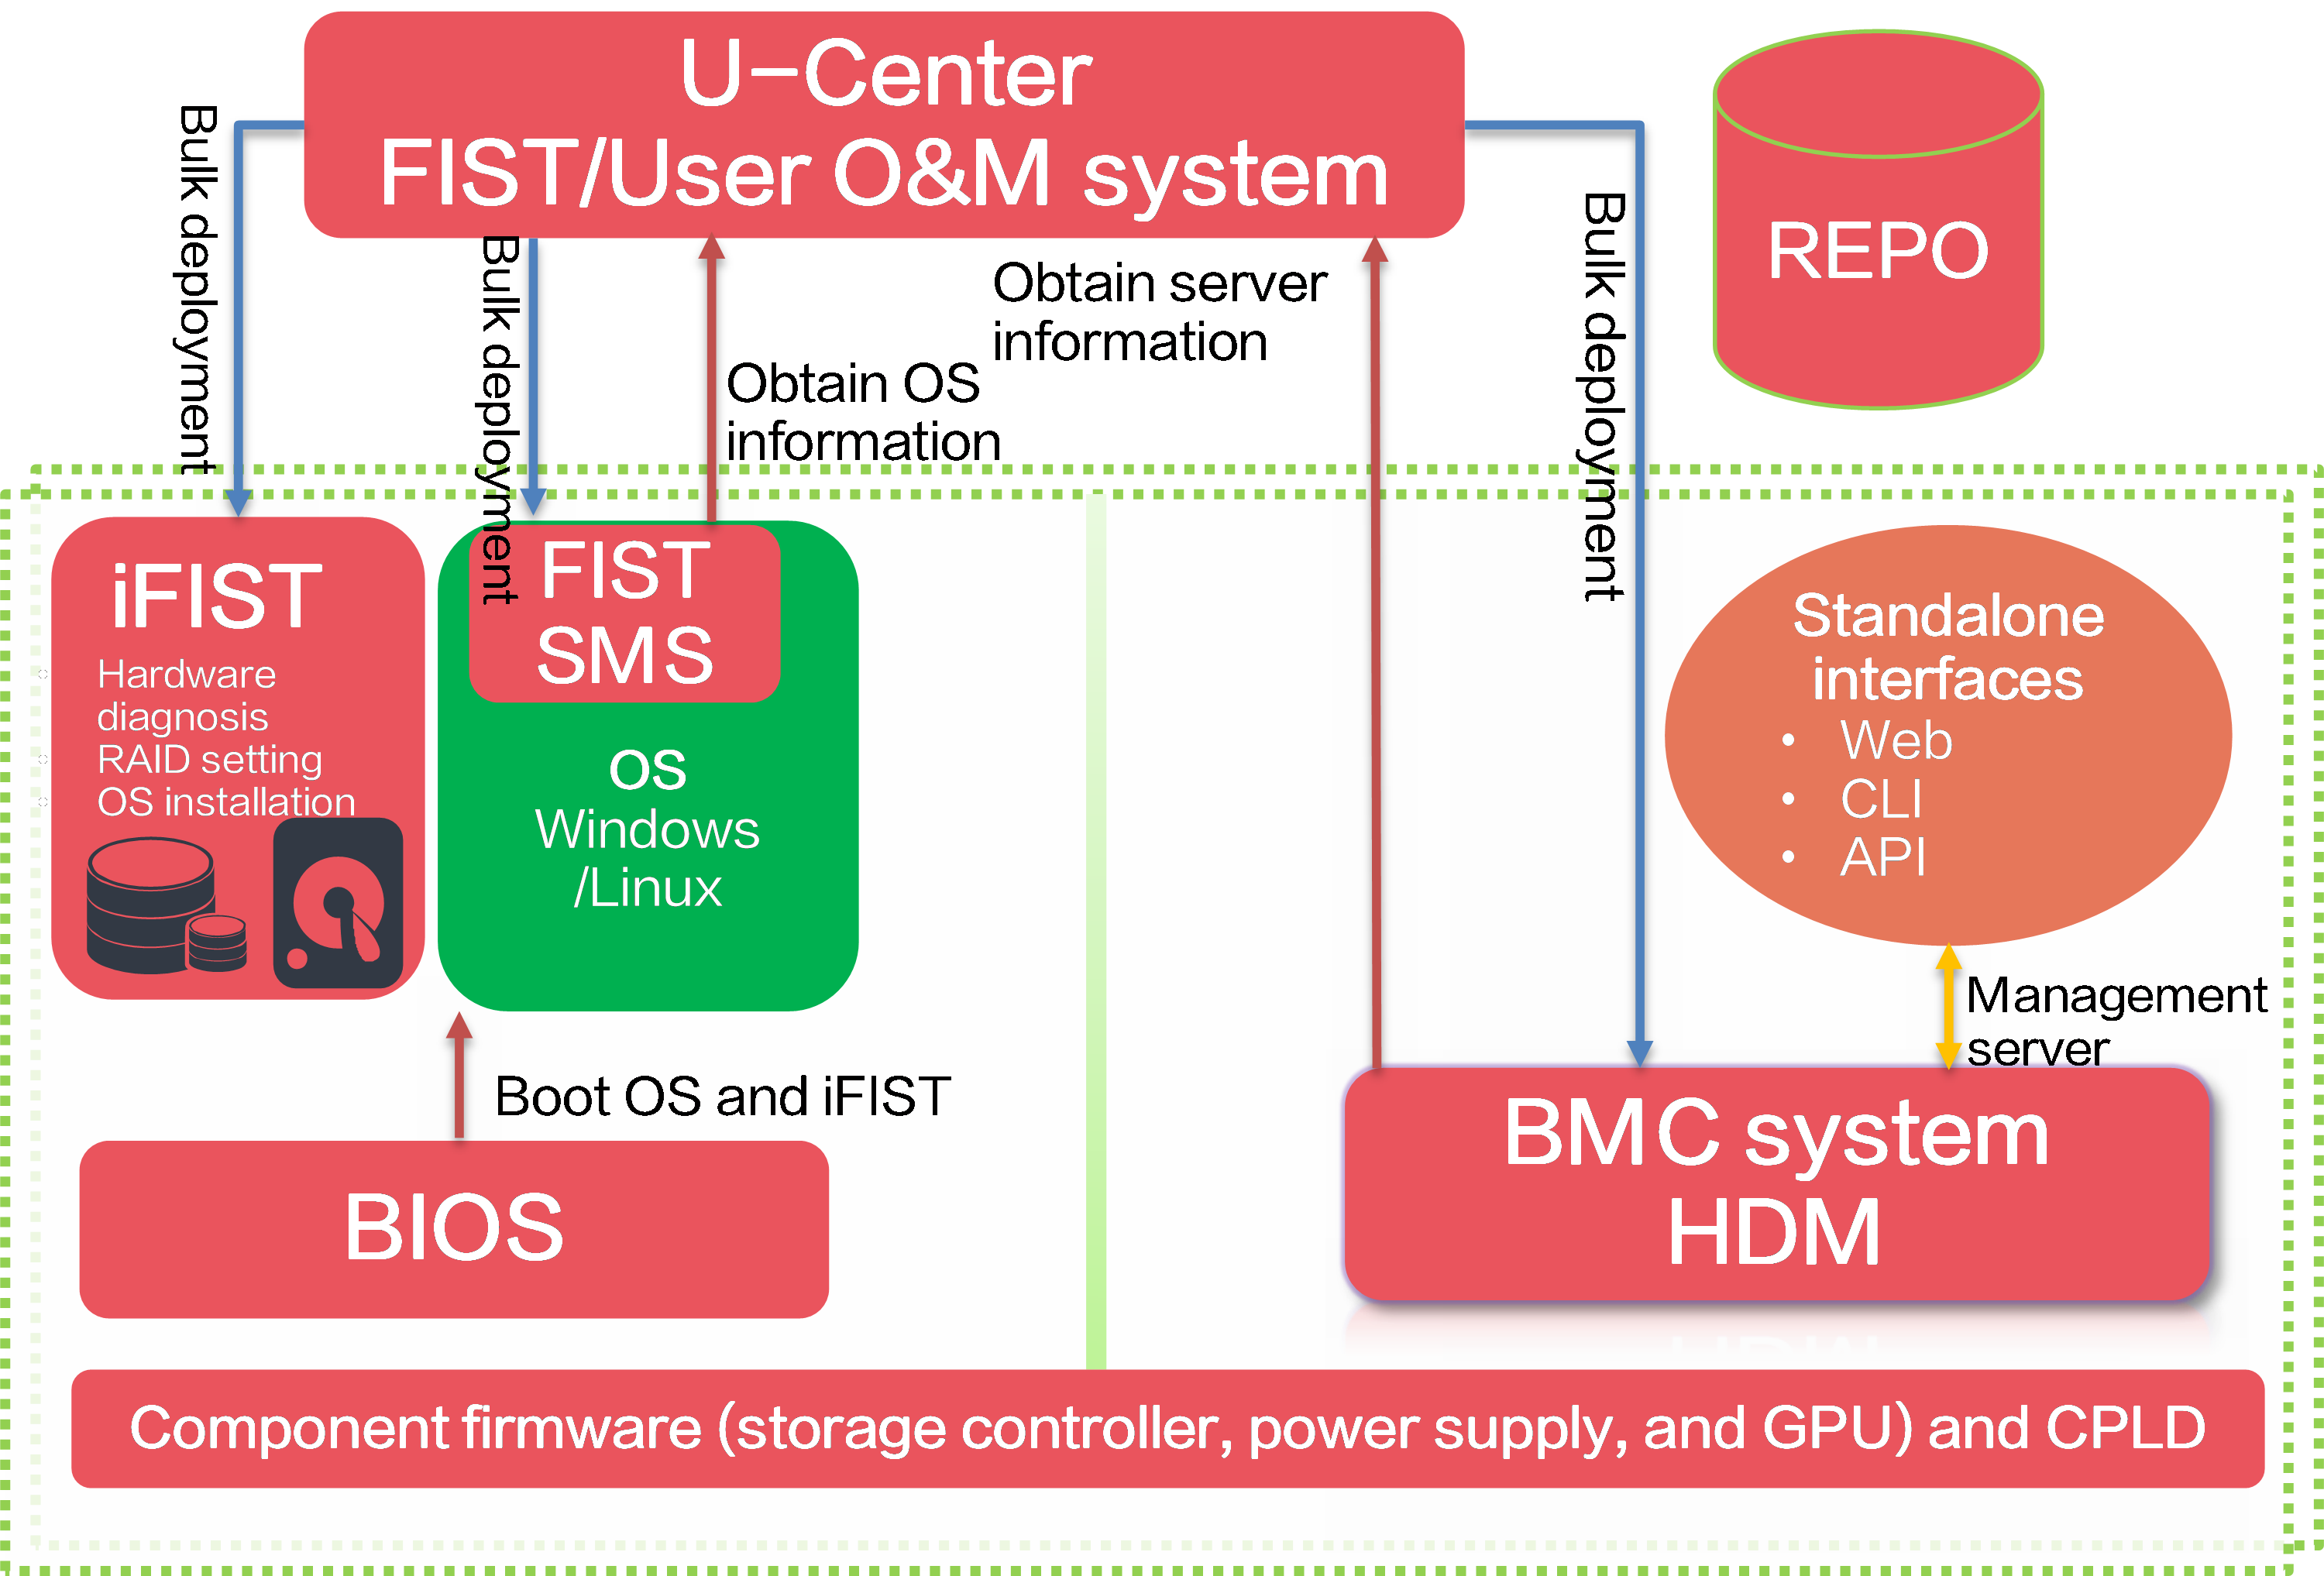
BIOS
Basic Input/Output System (BIOS) is stored on ROM and is a program a computer's microprocessor uses to start the computer system after it is powered on. Located between the computer's operating system (OS) and hardware components, BIOS initializes hardware and makes preparations for the OS to run.
When a server fails, you can troubleshoot problems by using BIOS:
· When a problem occurs during startup, you can view POST codes reported by BIOS to HDM and locate the problem according to the description of POST codes in the HDM user guide.
· On the BIOS Setup page, view information about processors, memory, and access devices and configuration options. Configuration options can be viewed and exported through HDM.
· In the UEFI Shell CLI environment, BIOS supports UEFI native Shell commands. These commands can be used to execute EFI programs, load EFI drivers, and boot OSs.
· If the problem cannot be resolved, collect BIOS logs and contact technical support. You can collect BIOS logs through the BIOS serial port or the IPMI SOL function. Using the debug mode can obtain detailed log information.
Viewing POST codes
POST codes contain information about all states of BIOS startup and error codes. BIOS reports POST codes to HDM. When the server experiences problems during startup, you can examine the POST codes in HDM as shown in Figure 164 to help analyze the cause of problems.
· For more information about POST codes, see the POST code section in the HDM user guide.
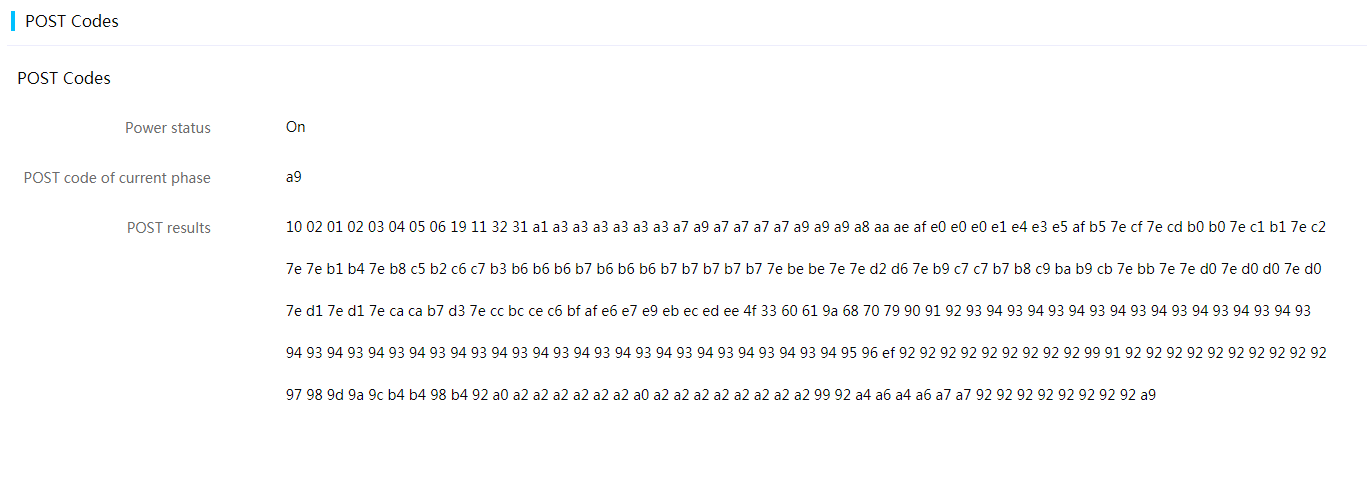
Exporting BIOS configuration
HDM supports exporting the current configuration of BIOS, as shown in Figure 165.
When a server fails, you can export the current configuration of BIOS. On another normal server, install the same version BIOS and export the default BIOS configuration. Compare the two BIOS configurations for differences to identify the cause of the failure.
Figure 165 Exporting BIOS configuration
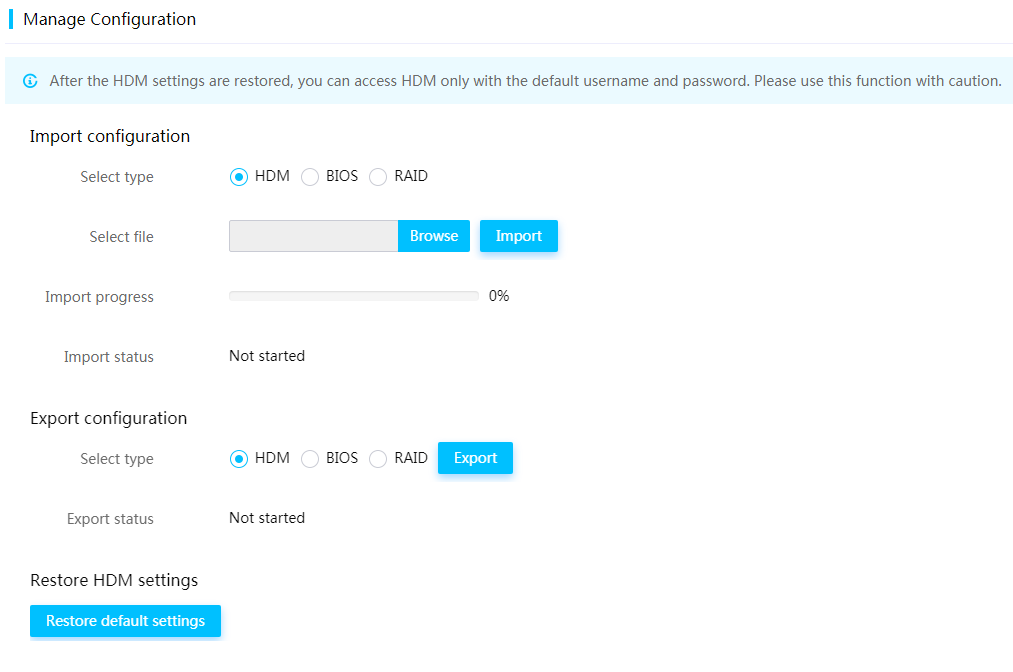
Starting UEFI Shell in BIOS Setup
1. Set EFI Shell Boot to Enabled, as shown in Figure 166.
Figure 166 Setting EFI Shell Boot
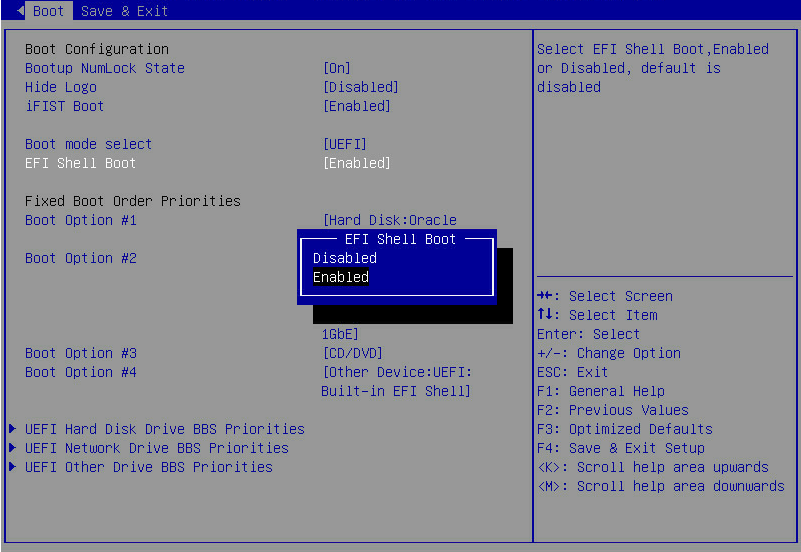
2. After restart, enter F7 to enter Boot Menu and select UEFI: Built-in EFI Shell, as shown in Figure 167.
Figure 167 Selecting UEFI: Built-in EFI Shell

3. The UEFI Shell page is displayed, as shown in Figure 168. You can obtain supported Shell commands by using the help command.
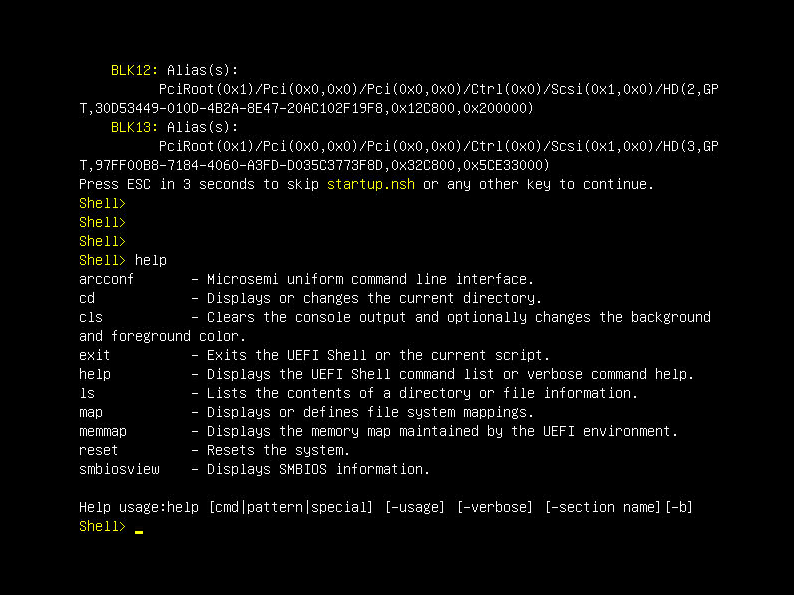
Obtaining BIOS logs
Enabling the Debug mode
Enabling the Debug mode allows you to obtain detailed BIOS logs. This operation will extend the startup time and is typically used for troubleshooting.
The Debug mode is disabled by default. To enable the Debug mode, access the BIOS Setup > Platform Configuration > Miscellaneous Configuration, and set Debug Mode to Enabled, as shown in Figure 169.
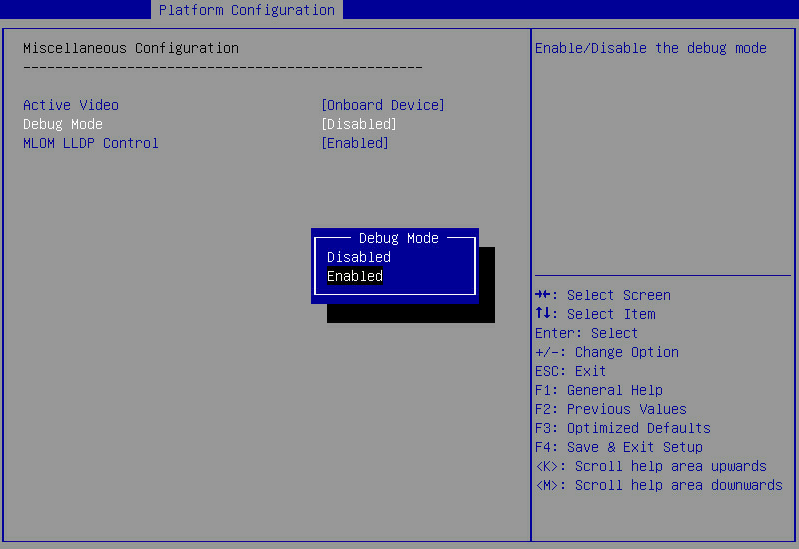
Collecting BIOS logs
You can use the following methods to collect BIOS logs:
· Connect the BIOS serial port, use a serial port client tool such as PuTTY to configure the BIOS serial port, and save BIOS logs during startup. For the position of the BIOS serial port, see the corresponding user guide.
· Save BIOS logs by using the following command: ipmitool.exe –I lanplus –H { hdm_ip } –U { username } –P { password } sol activate > debug.txt
|
|
NOTE: Servers using Hygon processors do not support using IPMI commands to collect BIOS logs. |
HDM
About HDM
As a remote server management system, Hardware Device Management (HDM) is compatible with IPMI, SNMP, and Redfish, and supports the following functions:
· Keyboard, mouse, and video redirection.
· Text console redirection.
· Serial interface redirection.
· Remote virtual media.
· Highly-reliable hardware monitoring and management.
HDM delivers the following benefits:
· Rich management ports
Provides IPMI/HTTPS/SNMP/Redfish management ports to meet diversified system integration requirements.
· Compatible with IPMI1.5/IPMI2.0
Provides standard management ports and can be integrated by standard management systems.
· Web-based user interface.
Allows you to complete setup and query tasks by performing simple Web operations.
· Redfish management ports
Reduces development complexity and provide ease of implementation, ease of use, and ease of expansion.
· Fault monitoring and diagnosis
Guides O&M personnel to resolve problems quickly and ensures reliable operation of the device 24 hours a day, seven days a week.
· Virtual KVM and virtual media
Provides convenient remote maintenance methods.
· Screen capture and recording
Helps rapidly analyze the cause of system crashes.
· Supporting SDS
Helps rapidly analyze the cause of system crashes.
HDM Smart Diagnose System (HDM SDS) is an intelligent diagnostics system and can rapidly diagnose faults of main server hardware components.
· Supporting DNS/LDAP/AD
Simplifies the server management network.
· RAID out-of-band management
Improves RAID configuration efficiency and management capabilities.
· Dual image backup
HDM supports primary/backup image switchover. The switchover enables startup by using the backup image if the system crashes, which enhances system availability.
· Device asset management
Collects unique codes of servers and related components by reading the Field Replaceable Unit (FRU) information.
· Intelligent power management
Power capping helps administrators increase deployment densities and dynamic power saving helps administrators reduce operating costs.
· Security management
Ensures the security of servers from the perspectives of access, account, transmission and storage. Supports blacklist rules and whitelist rules, user management, interface service management, and SSL.
· Unified control
Performs unified management of a small number of servers to reduce operating costs for medium- and small-sized enterprises.
· LCD display
Some rack servers can be equipped with 3.5-inch touchable LCD displays, which facilitates field checks and maintenance.
Remote maintenance through HDM
The following describes how to handle server failures remotely through HDM:
1. Log in to the HDM Web interface to determine the device running status. The following information is displayed on the homepage:
¡ Basic status.
¡ Basic information.
¡ Server power.
2. If the basis status is abnormal, check whether event logs are generated or whether a sensor is in abnormal state.
3. Check whether information about install hardware is displayed completely.
4. Perform the following operations as required (if necessary, contact technical support):
¡ Restore HDM factory defaults.
¡ Restart HDM.
¡ Update firmware for HDM, BIOS, CPLD, and PSU.
¡ Import or export the configuration of HDM, BIOS, and RAID.
FIST
Fast Intelligent Scalable Toolkit (FIST) is a server companion tool used to rapidly and flexibly configure servers and instruct users to use servers.
FIST can run on a PC or server. As a bulk server management and maintenance tool, FIST can help enterprises better manage, monitor, and update systems and query information.
As a built-in tool of the AE module, FIST not only manages local cabinets but also manages other cabinet servers, rack servers, and switches in the network. FIST is applicable to hybrid IT infrastructure and cluster management.
FIST provides the following functions:
· Device management—Centrally manages racks, servers, and switches, including adding devices, view device information, and other common device management operations.
· Template management—Uses templates to configure BIOS, HDM, RAID, and OS parameters for devices to come online quickly.
· Deployment—Bulk applies configuration templates for racks and servers and updates firmware and drivers.
· Monitoring and alarm—Monitors the server status and generates alarms for quick troubleshooting.
· Tool set—Provides common tools used for servers.
· System setting—Provides system settings and management functions for the FIST service end.
iFIST
Integrated Fast Intelligent Scalable Toolkit (iFIST) is an intelligent deployment tool used to deploy standalone servers. After the server is started and completes initialization, you can access iFIST as prompted without installing it.
iFIST provides a simple interface for you to complete RAID settings, OS auto installation, server diagnostics, and log download.
iFIST is applicable to local management of standalone servers. When you cannot log in to HDM remotely, you can use a display, a keyboard, and a mouse to connect to the server and use iFIST for convenient in-band server deployment.
HDM Redfish API
Redfish® is a DMTF's standard based on RESTful. It supports both HTTP and HTTPS. Each Redfish request is sent in UTF-8-coded JSON format and will receive a resource result. This standard is regarded as the next-generation data center management standard, because it reduces development complexity, is easy to implement and use, and is scalable.
HDM supports managing servers through Redfish APIs. Redfish APIs allows you to simplify server configuration, view server component information, monitor server status, and control servers remotely.
For more information about Redfish and Redfish APIs, access the H3C website.
HDM IPMI
Intelligent Platform Management Interface (IPMI) is a standard for server management systems. Independent of the processor, BIOS, and OS, IPMI can centrally manage servers of different types.
In IPMI, the Baseboard Management Controller (BMC) is the core controller. IPMI interacts with the BMC to perform management.
IPMI provides the following out-of-band management and monitoring function:
· Asset management.
· Fault monitoring.
· Log record.
· Recover control.
For IPMI commands supported by HDM, see H3C HDM IPMI Basics Command Reference on the H3C website.
Arcconf
About Arcconf
You can use the Arcconf command line utility provided by PMC to collect information about PMC storage controllers.
For information about how to install the Arcconf command line utility, see the Arcconf user guide on the PMC website. The installation method varies by OS.
The method to start the Arcconf command line utility differs slightly depending on the OS:
· On a Windows OS, enter WIN+R, enter cmd in the dialog box that opens, and enter arcconf.
· On a non-Windows OS, no commands need to be entered, and the Arcconf command line utility is started by default.
After you enter the CLI prompt, the operations are exactly the same for a Windows OS and a non-Windows OS. For information about the commands, see the Arcconf user guide on the PMC website.
Main functions
· Create and delete RAID.
· Create and delete hot backup drives.
· Migrate and expand logical drives.
· Locate disks by lighting.
· Upgrade the firmware of storage controllers.
· Upgrade the driver of storage controllers.
· Upgrade the array log of storage controllers.
Documentation
You can obtain the Arcconf user guide in the following ways:
· Contact Technical Support.
· Access the PMC website (the path might change, contact Technical Support if necessary):
¡ https://storage.microsemi.com/en-us/downloads/
¡ https://storage.microsemi.com/en-us/support/raid/sas_raid/asr-3154-8i/
StorCLI
About StorCLI
You can use the StorCLI command line utility provided by LSI to collect information about LSI storage controllers.
For information about how to install the StorCLI command line utility, see the StorCLI user guide on the PMC website. The installation method varies by OS.
The method to start the StorCLI command line utility differs slightly depending on the OS:
· On a Windows OS, enter WIN+R, enter cmd in the dialog box that opens, and enter storcli.
· On a non-Windows OS, no commands need to be entered, and the StorCLI command line utility is started by default.
After you enter the CLI prompt, the operations are exactly the same for a Windows OS and a non-Windows OS. For information about the commands, see the StorCLI user guide on the LSI website.
Main functions
· Create and delete RAID.
· Create and delete hot backup drives.
· Migrate and expand logical drives.
· Locate disks by lighting.
· Upgrade the firmware of storage controllers.
· Upgrade the driver of storage controllers.
· Upgrade the array log of storage controllers.
Documentation
You can obtain the StorCLI user guide in the following ways:
· Contact Technical Support.
· Access the PMC website (the path might change, contact Technical Support if necessary):
¡ https://docs.broadcom.com/doc/pub-005110
¡ https://www.broadcom.com/products/storage/raid-controllers/megaraid-9460-8i
Resources for troubleshooting
Product information resources
Product information resources include features and server and option specifications.
To obtain these resources, access Products & Technology > Servers at the H3C website.
Product installation resources
Product installation resources include the following:
· User guide—Describes hardware options, specifications, installation, and replacement of the server.
· Removal and installation videos—Describe removal and installation of hardware options.
· Product introduction videos—Provide an overview of the server.
To obtain these resources, access Support > Resource Center > Technical Documents > Servers at the H3C website.
Product configuration resources
Product configuration resources include the following:
· Software configuration user guides—Describe features and configuration for the server software.
· Software configuration videos—Describe software configuration for the server in videos.
To obtain these resources, access Support > Resource Center > Technical Documents > Servers at the H3C website.
Information query utility resources
Information query utility resources include the following:
· OS compatibility query tool
· Components compatible with the server
· Servers compatible with components
· Networking, connector connections for Mezz network adapter and interconnected modules
To obtain these resources, access Support > Resource Center > Technical Documents > Servers at the H3C website.
Log query resources
Log query resources include log message references, which are used for diagnosis and maintenance.
To obtain these resources, access Products & Technology > Servers at the H3C website.
Driver and firmware download resources
Driver and firmware download resources include the following:
· Server software and firmware, and release notes, including HDM, BIOS, CPLD, FIST, iFIST, OM, and interconnect modules
· Component drivers and firmware, and release notes, Including drives, storage controllers, network adapters, GPU modules, and FC HBA modules
To obtain these resources, access Support > Resource Center > Software Download > Servers at the H3C website.
