- Related Documents
-
| Title | Size | Download |
|---|---|---|
| 01-Introduction of Commonly Used Wireless Tools | 2.65 MB |
|
Introduction of Commonly Used |
|
Wireless Tools |
New H3C Technologies Co., Ltd.
http://www.h3c.com
Document version: 6W101-20230331
Contents
Introduction
This document describes some common network maintenance tools for network troubleshooting, fault location, and network operation status displaying for administrators to maintain the network and learn more thoroughly about various protocols and message encapsulation.
Prerequisites
The software introduced in this document does not strictly correspond to the specific software version. If there is a difference between the use process and the actual product, please refer to the relevant software version description manual, or the actual product condition shall prevail.
Commonly used tools
Wireshark
About Wireshark
Wireshark (formerly known as Ethereal) is a network packet analysis software. The function of network packet analysis software is to capture network packets and display as much detailed network packet information as possible. Wireshark uses WinPCAP as an interface to exchange data packets directly with the network card.
Figure 1 Wireshark Software Interface Introduction
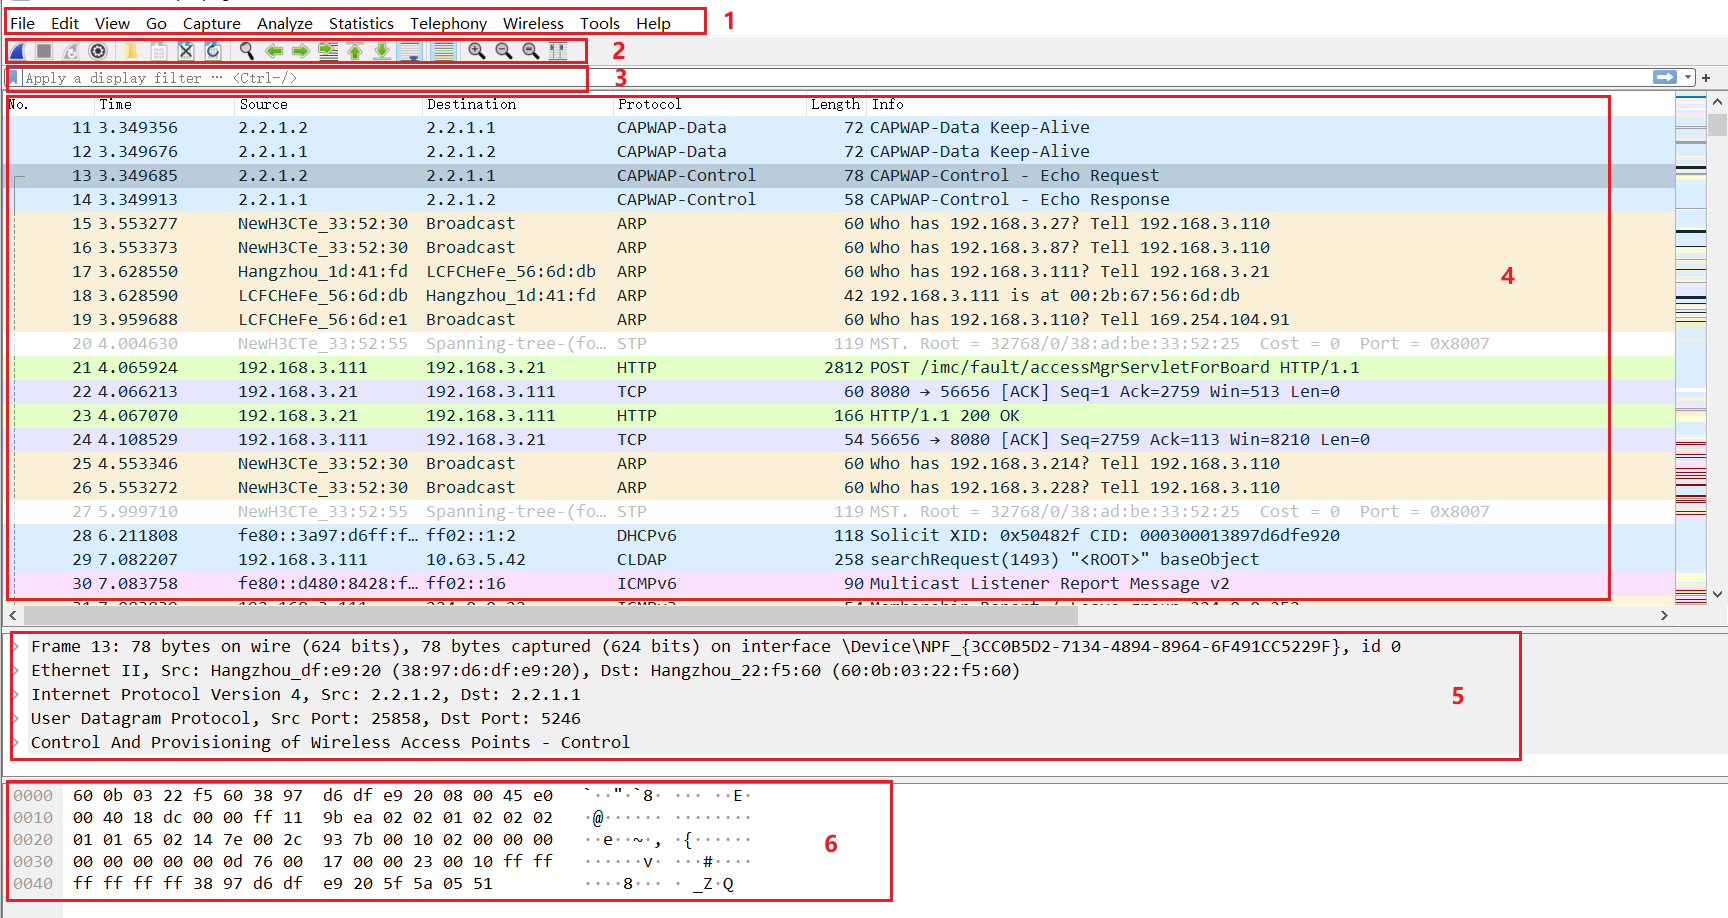
|
(1) Menu bar |
(2) Toolbar |
(3) Filter bar |
|
(4) Message capture area |
(5) Message encapsulation area |
(6) Message content area |
As shown in Figure 1, the Wireshark software interface has the following functional areas.
· Menu bar—Perform various configuration operations on the Wireshark software, for example, saving captured messages.
· Toolbar—Quickly call some common operations, such as, start capture, stop capture, and set the capture interface.
· Filter bar—Set the filtering condition in the filter bar. The software interface will display the messages to be viewed according to the filtering condition.
· Message capture area—View the captured messages.
· Message encapsulation area—View the encapsulation protocol of the message.
· Message content area—View the specific content of the message.
Wireshark common operations
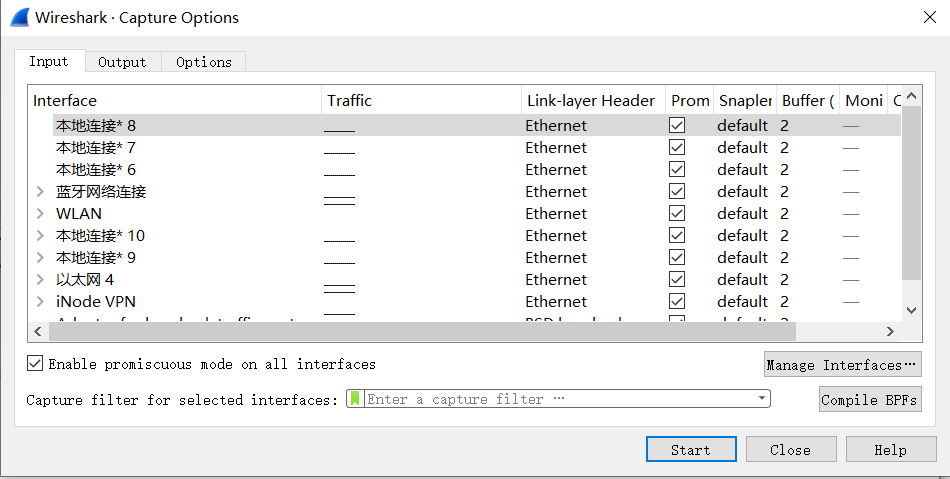
1. Click the Capture
Options icon ![]() in the toolbar and select the interface for which the message needs
to be captured.
in the toolbar and select the interface for which the message needs
to be captured.
2. Click Start to start capturing messages for the current interface.
Figure 2 Selecting the capture interface
3. After capturing is complete, click the Stop Capturing Packets icon ![]() in the toolbar to stop capturing messages for the selected
interface.
in the toolbar to stop capturing messages for the selected
interface.
4. Click the Start
Capturing Group icon ![]() in the toolbar to continue to start capturing messages for the
selected interface.
in the toolbar to continue to start capturing messages for the
selected interface.
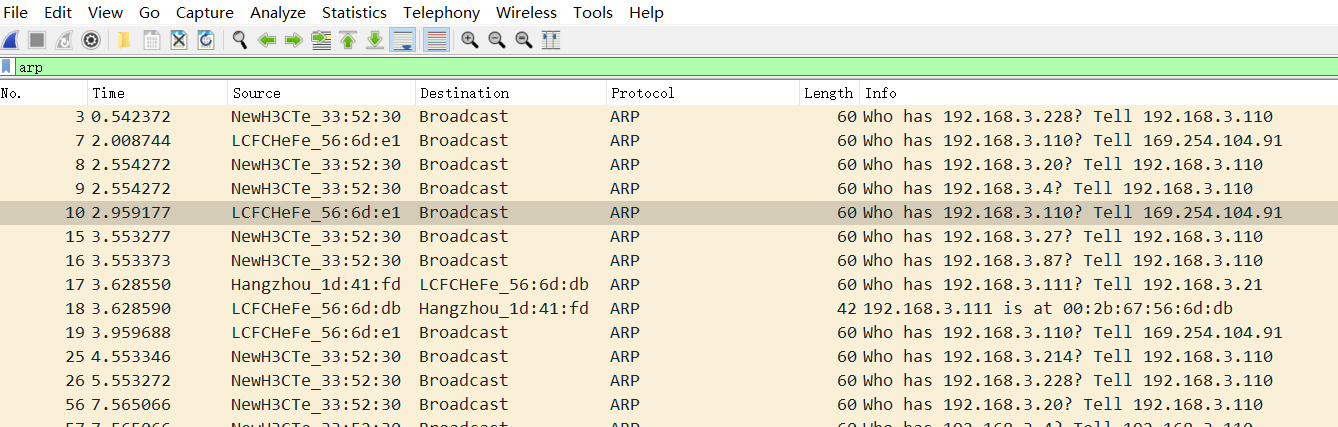
If a large number of captured messages exists, you can set the filtering conditions in the filter bar. For example, if you set the filtering condition to ARP and press Enter or click Apply Filter in the filter bar, only ARP protocol messages will be displayed in the message capture area.
5. Clicking the ![]() icon to clear the
filtering conditions that have
been set.
icon to clear the
filtering conditions that have
been set.
Figure 3 Set filtering conditions
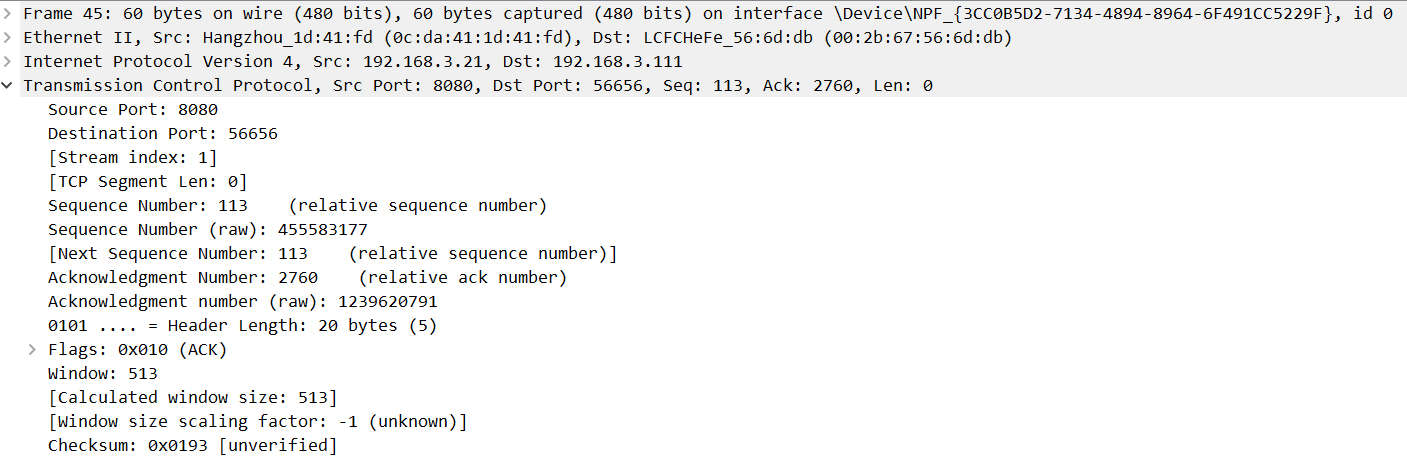
6. Click a message to view the protocol encapsulation level of the message,
and click the ![]() icon to view the
specific contents of each protocol encapsulation level.
icon to view the
specific contents of each protocol encapsulation level.
Figure 4 Message encapsulation area
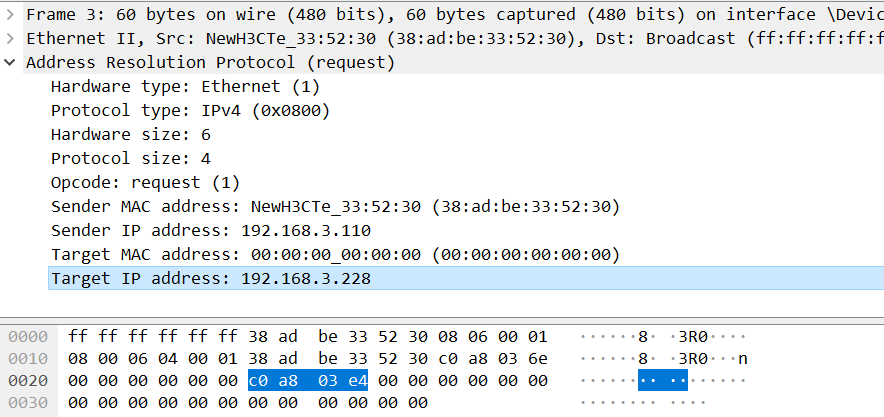
7. Click on the protocol field of the message in the message encapsulation area to view the contents of the protocol field. For example, if you click the Target IP address field, you can view the contents of the field in the message content area as in hexadecimal format, which is c0a803e4 in this example.
Figure 5 Message details
8. To save the
currently captured message to a local file, click the Save Capture File icon ![]() on the toolbar.
on the toolbar.
Typical applications
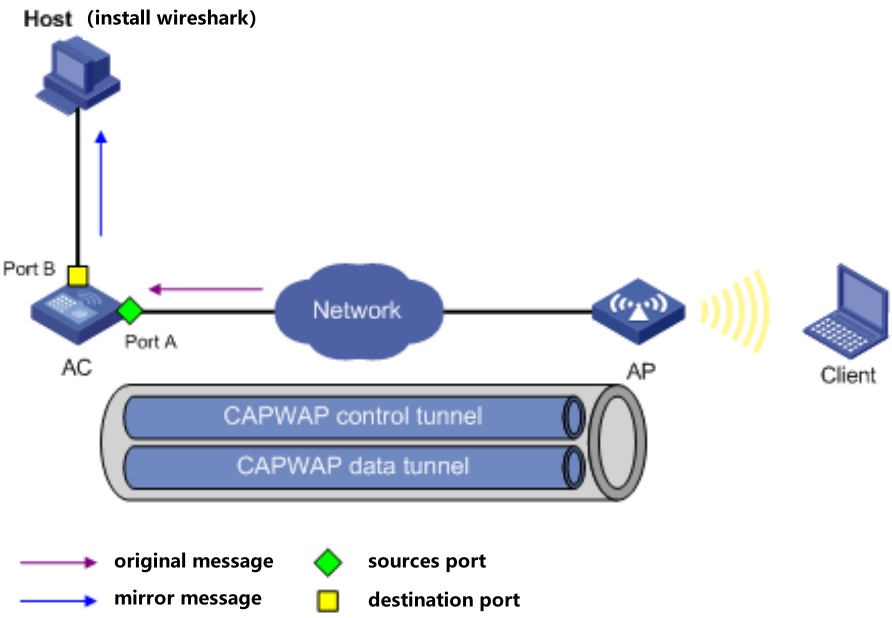
As shown in Figure 6, to capture messages from the CAPWAP tunnel between the AC and the AP, you can configure local port mirroring to mirror messages from source port Port A to destination port Port B.
Install Wireshark on the Host, and select the local NIC connected to the AC to start message capture.
Figure 6 Wireshark typical applications
Inssider
About Inssider
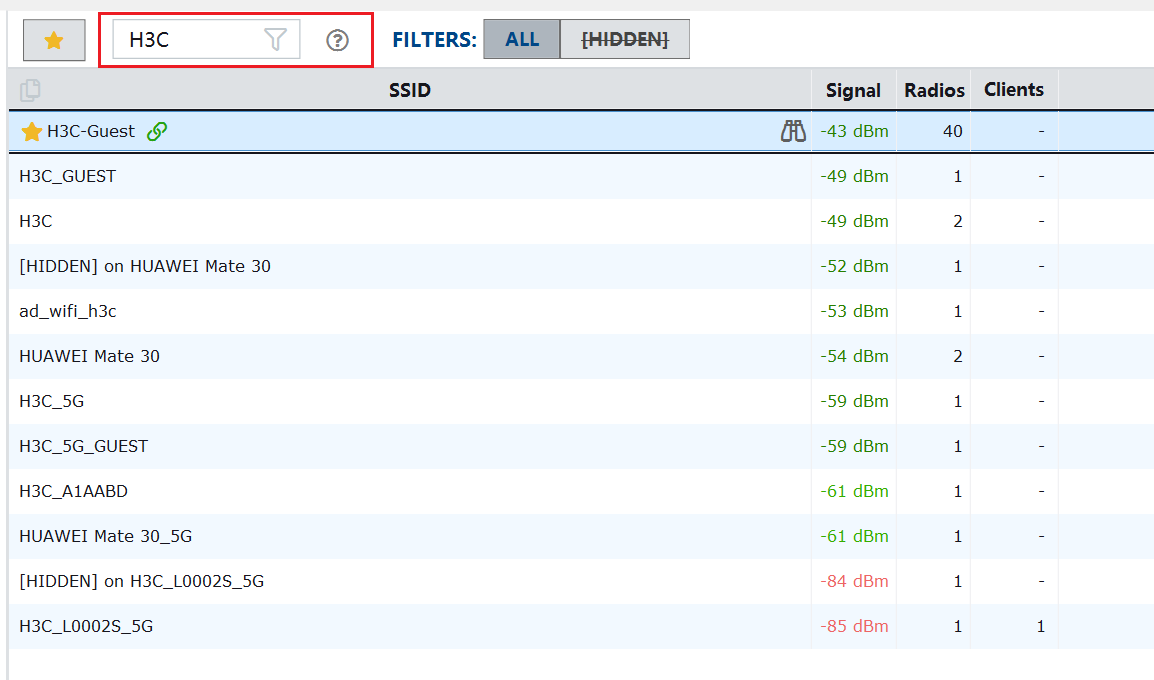
Inssider is a wireless network operation and maintenance software, through which you can survey the surrounding wireless network environment.
Inssider common operations
1. Connect a PC to the wireless network, open Inssider, and use the PC wireless NIC to scan wireless environment.
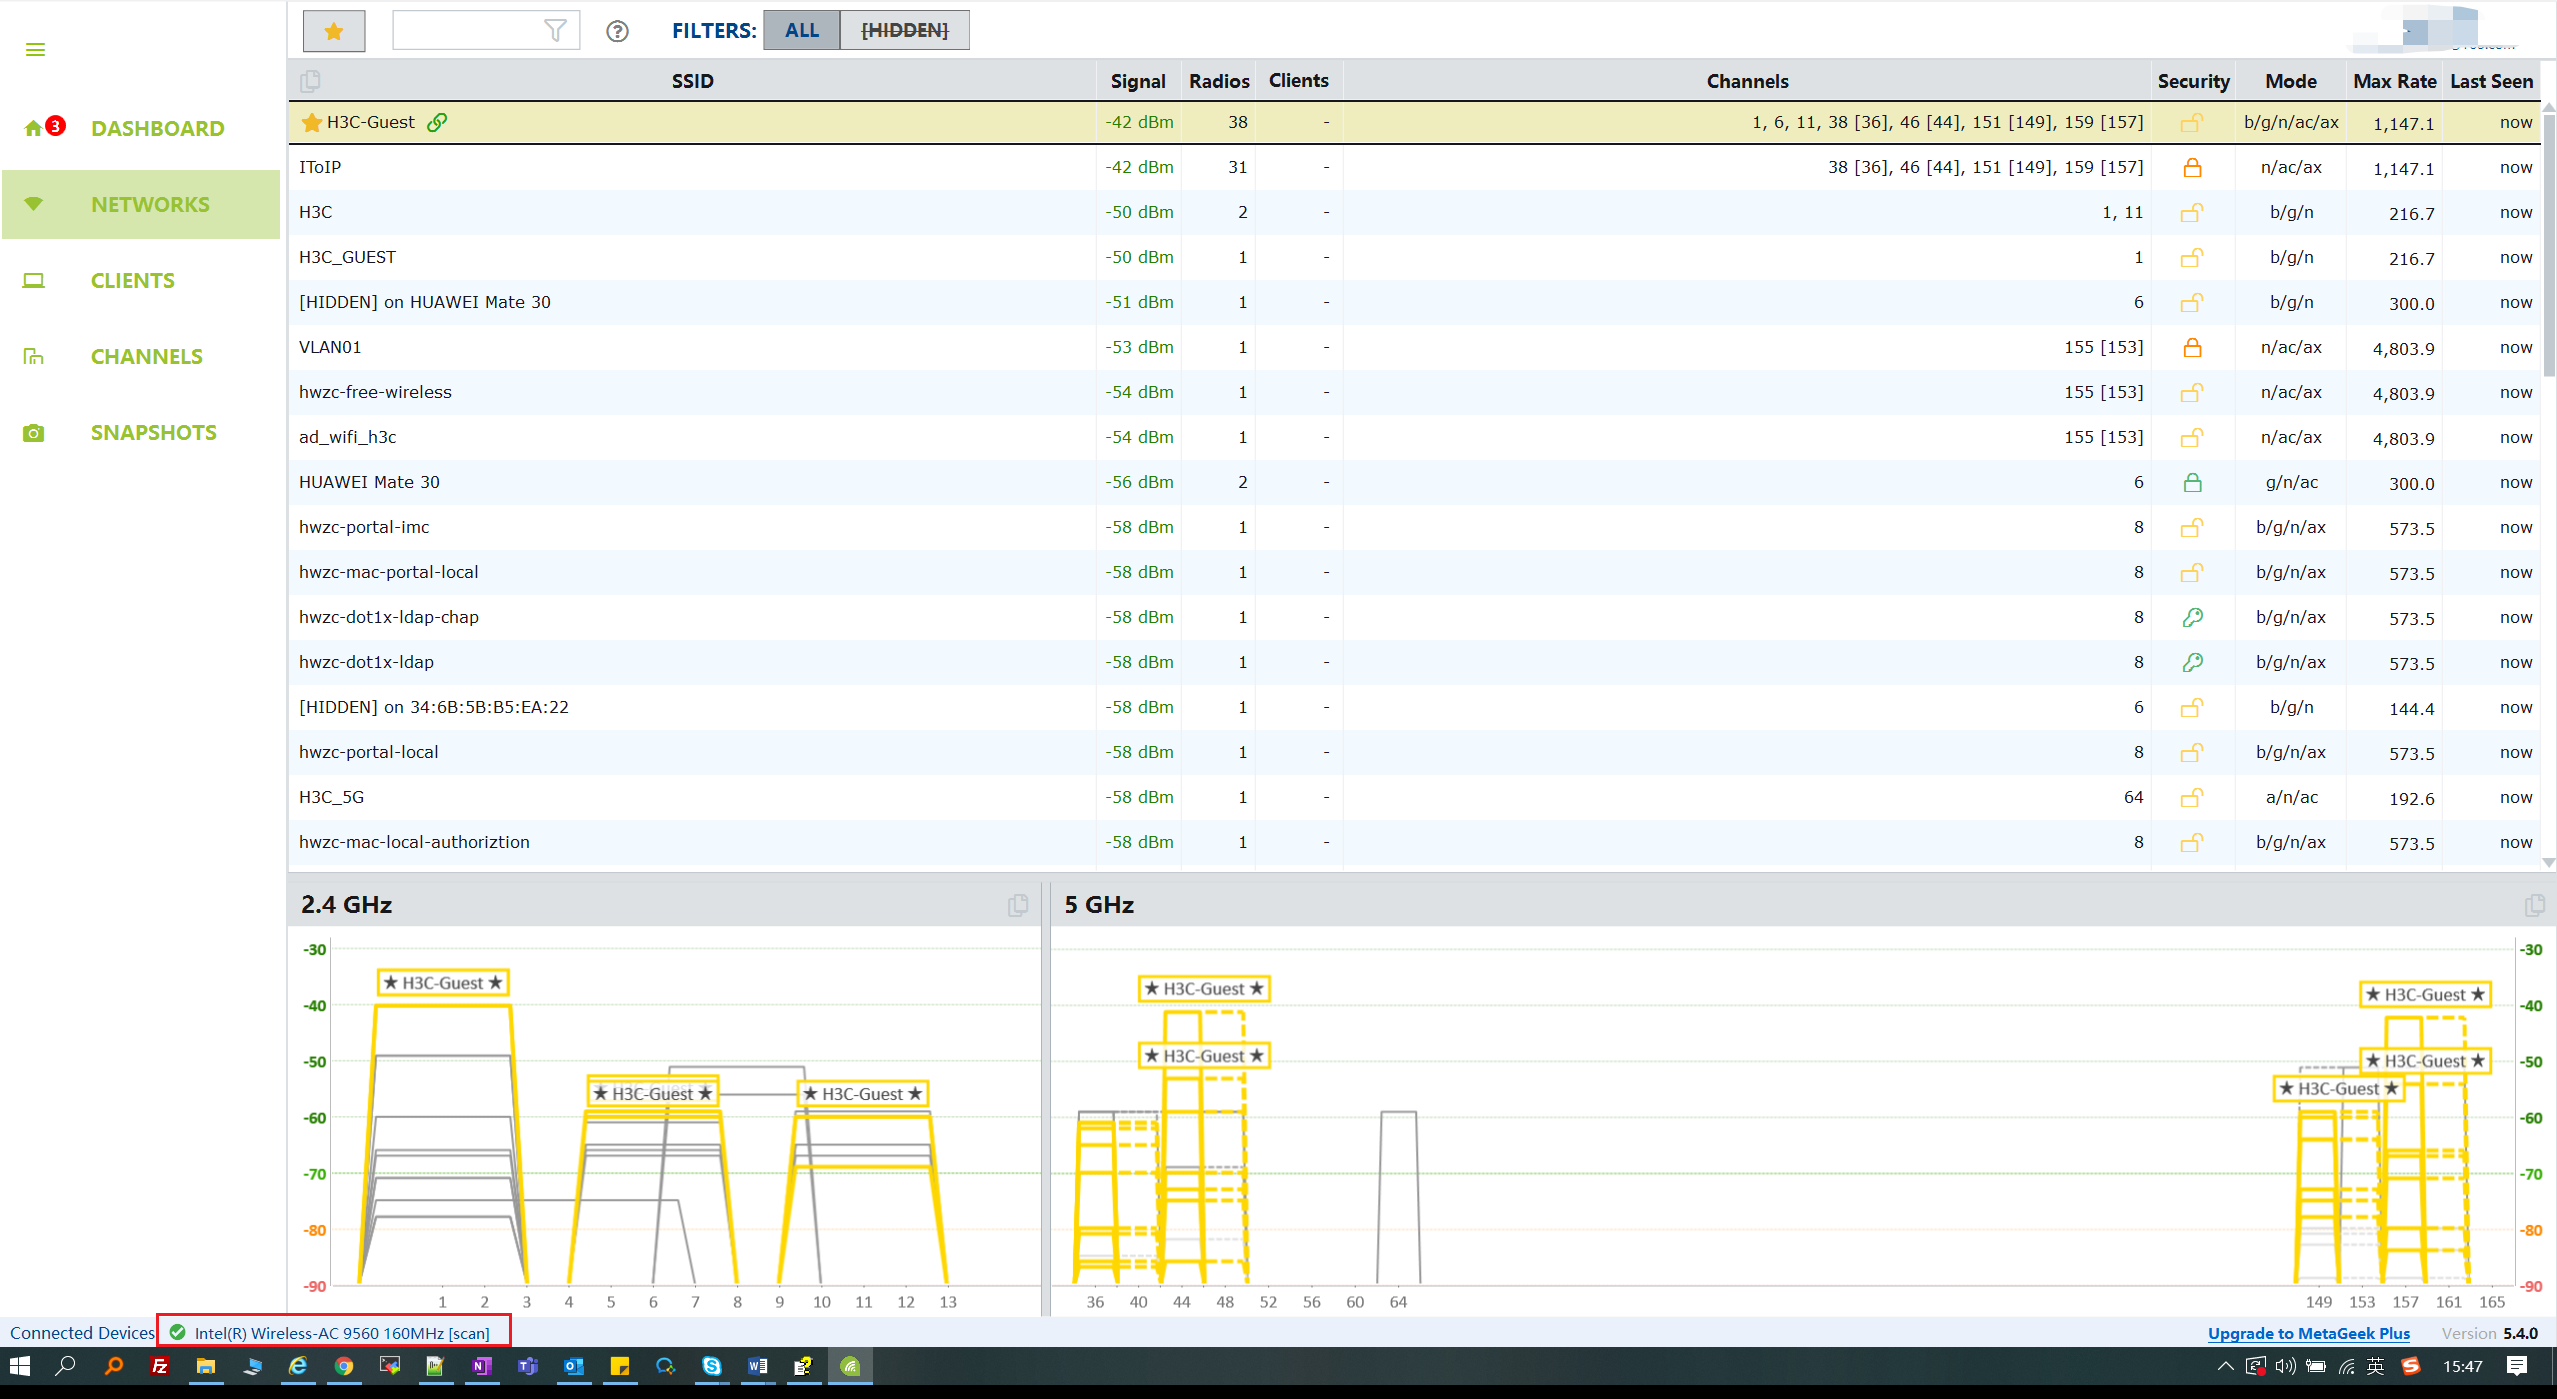
2. Click a wireless service to view its details, including SSID, RF mode, and maximum rate.
3. To filter wireless services, specify the filtering criteria.
Cloudnet App Int
About Cloudnet App Int
Cloudnet App Int is a WLAN O&M application. It provides the common and lite operating modes, and you can change the operating mode on the My tab.
· Cloudnet App Int in common mode contains the following tabs:
¡ Tools—Provides network speed testing, channel interference analysis, AP scanning, client scanning, Wi-Fi, and Cloudnet tools. The Wi-Fi management tool provides Wi-Fi detection and SSH features. The Cloudnet tool provides cloud AP assistant, device replacement, and AP replacement features.
¡ Home—Provides fast deployment, site/device/client statistics, setup wizard, up-to-date documentation, and commonly-used applications.
¡ Sites—Provides site display, adding, editing, and deleting as well as device adding, managing, and monitoring features.
¡ My—Provides technical support, application version display, mode switchover, feedback, and application sharing features.
· Cloudnet App Int in lite mode contains the following tabs:
¡ Home—Provides local management, network creation, site display, site map, site editing and deleting, and device adding, managing, and monitoring features.
¡ Tools—Provides network speed testing, channel interference analysis, AP scanning, client scanning, Wi-Fi, and Cloudnet tools. The Wi-Fi management tool provides Wi-Fi detection and SSH features. The Cloudnet tool provides cloud AP assistant, device replacement, and AP replacement features.
¡ My—Provides technical support, application version display, mode switchover, feedback, and application sharing features.
Cloudnet App Int common operations
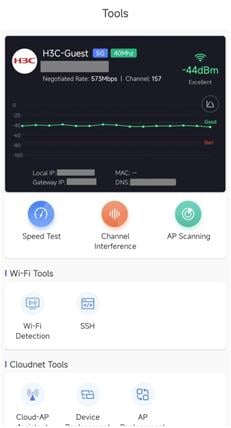
Viewing Wi-Fi information
On the top of the Tools tab, you can view detailed information about the current wireless service, including channel, signal strength, rate, and IP address.
Figure 7 Viewing Wi-Fi information
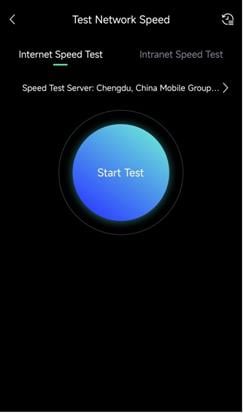
Testing network speed
1. Click Speed Test on the Tools tab.
2. Test the Internet or intranet delay, uploading speed, and downloading speed as needed.
Figure 8 Testing network speed
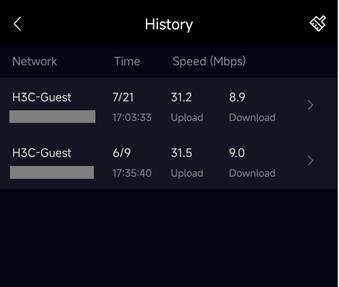
3. To view history test information, click the ![]() icon.
You can click an entry to view its detailed information and click the
icon.
You can click an entry to view its detailed information and click the ![]() icon
to clear the history information.
icon
to clear the history information.
Figure 9 History test information
Performing interference analysis
1. Click Channel Interference on the Tools tab. You can view the wireless service, signal strength, and number of interferences on each 2.4 GHz or 5 GHz channel.
2. To show or hide the SSIDs of the wireless services, click Show SSID or Hide SSID. The SSID of the current wireless service cannot be hidden.
Figure 10 Performing interference analysis

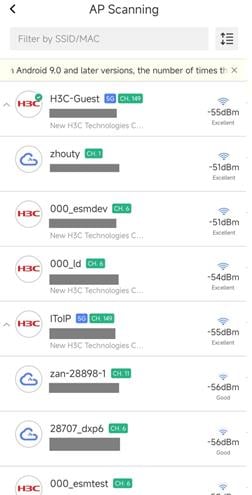
Performing AP scanning
1. Click AP Scanning on the Tools tab. You can view all wireless services detected by the current client.
Figure 11 AP scanning
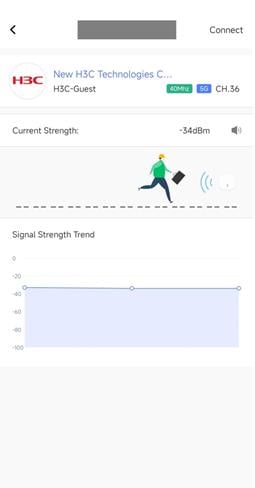
2. To view the real-time signal strength and signal strength trend of a wireless service, click the service.
Figure 12 Signal strength trend
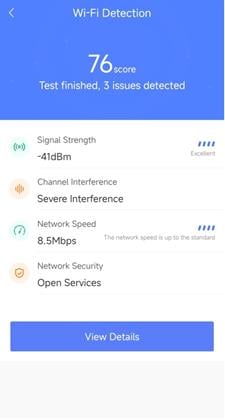
Performing Wi-Fi inspection
1. Click Wi-Fi Detection on the Tools tab to start Wi-Fi inspection. The page will display the basic information, signal strength, interference severity, encryption method, and network speed of the current wireless service. The inspection takes some time. Please wait.
2. After the inspection, you can click View Details to view the result.
Figure 13 Wi-Fi inspection
ixia chariot
About ixia chariot
ixia chariot is a commonly used streaming software for testing the throughput of devices' uplink or downlink traffic.
Figure 14 ixia chariot software interface
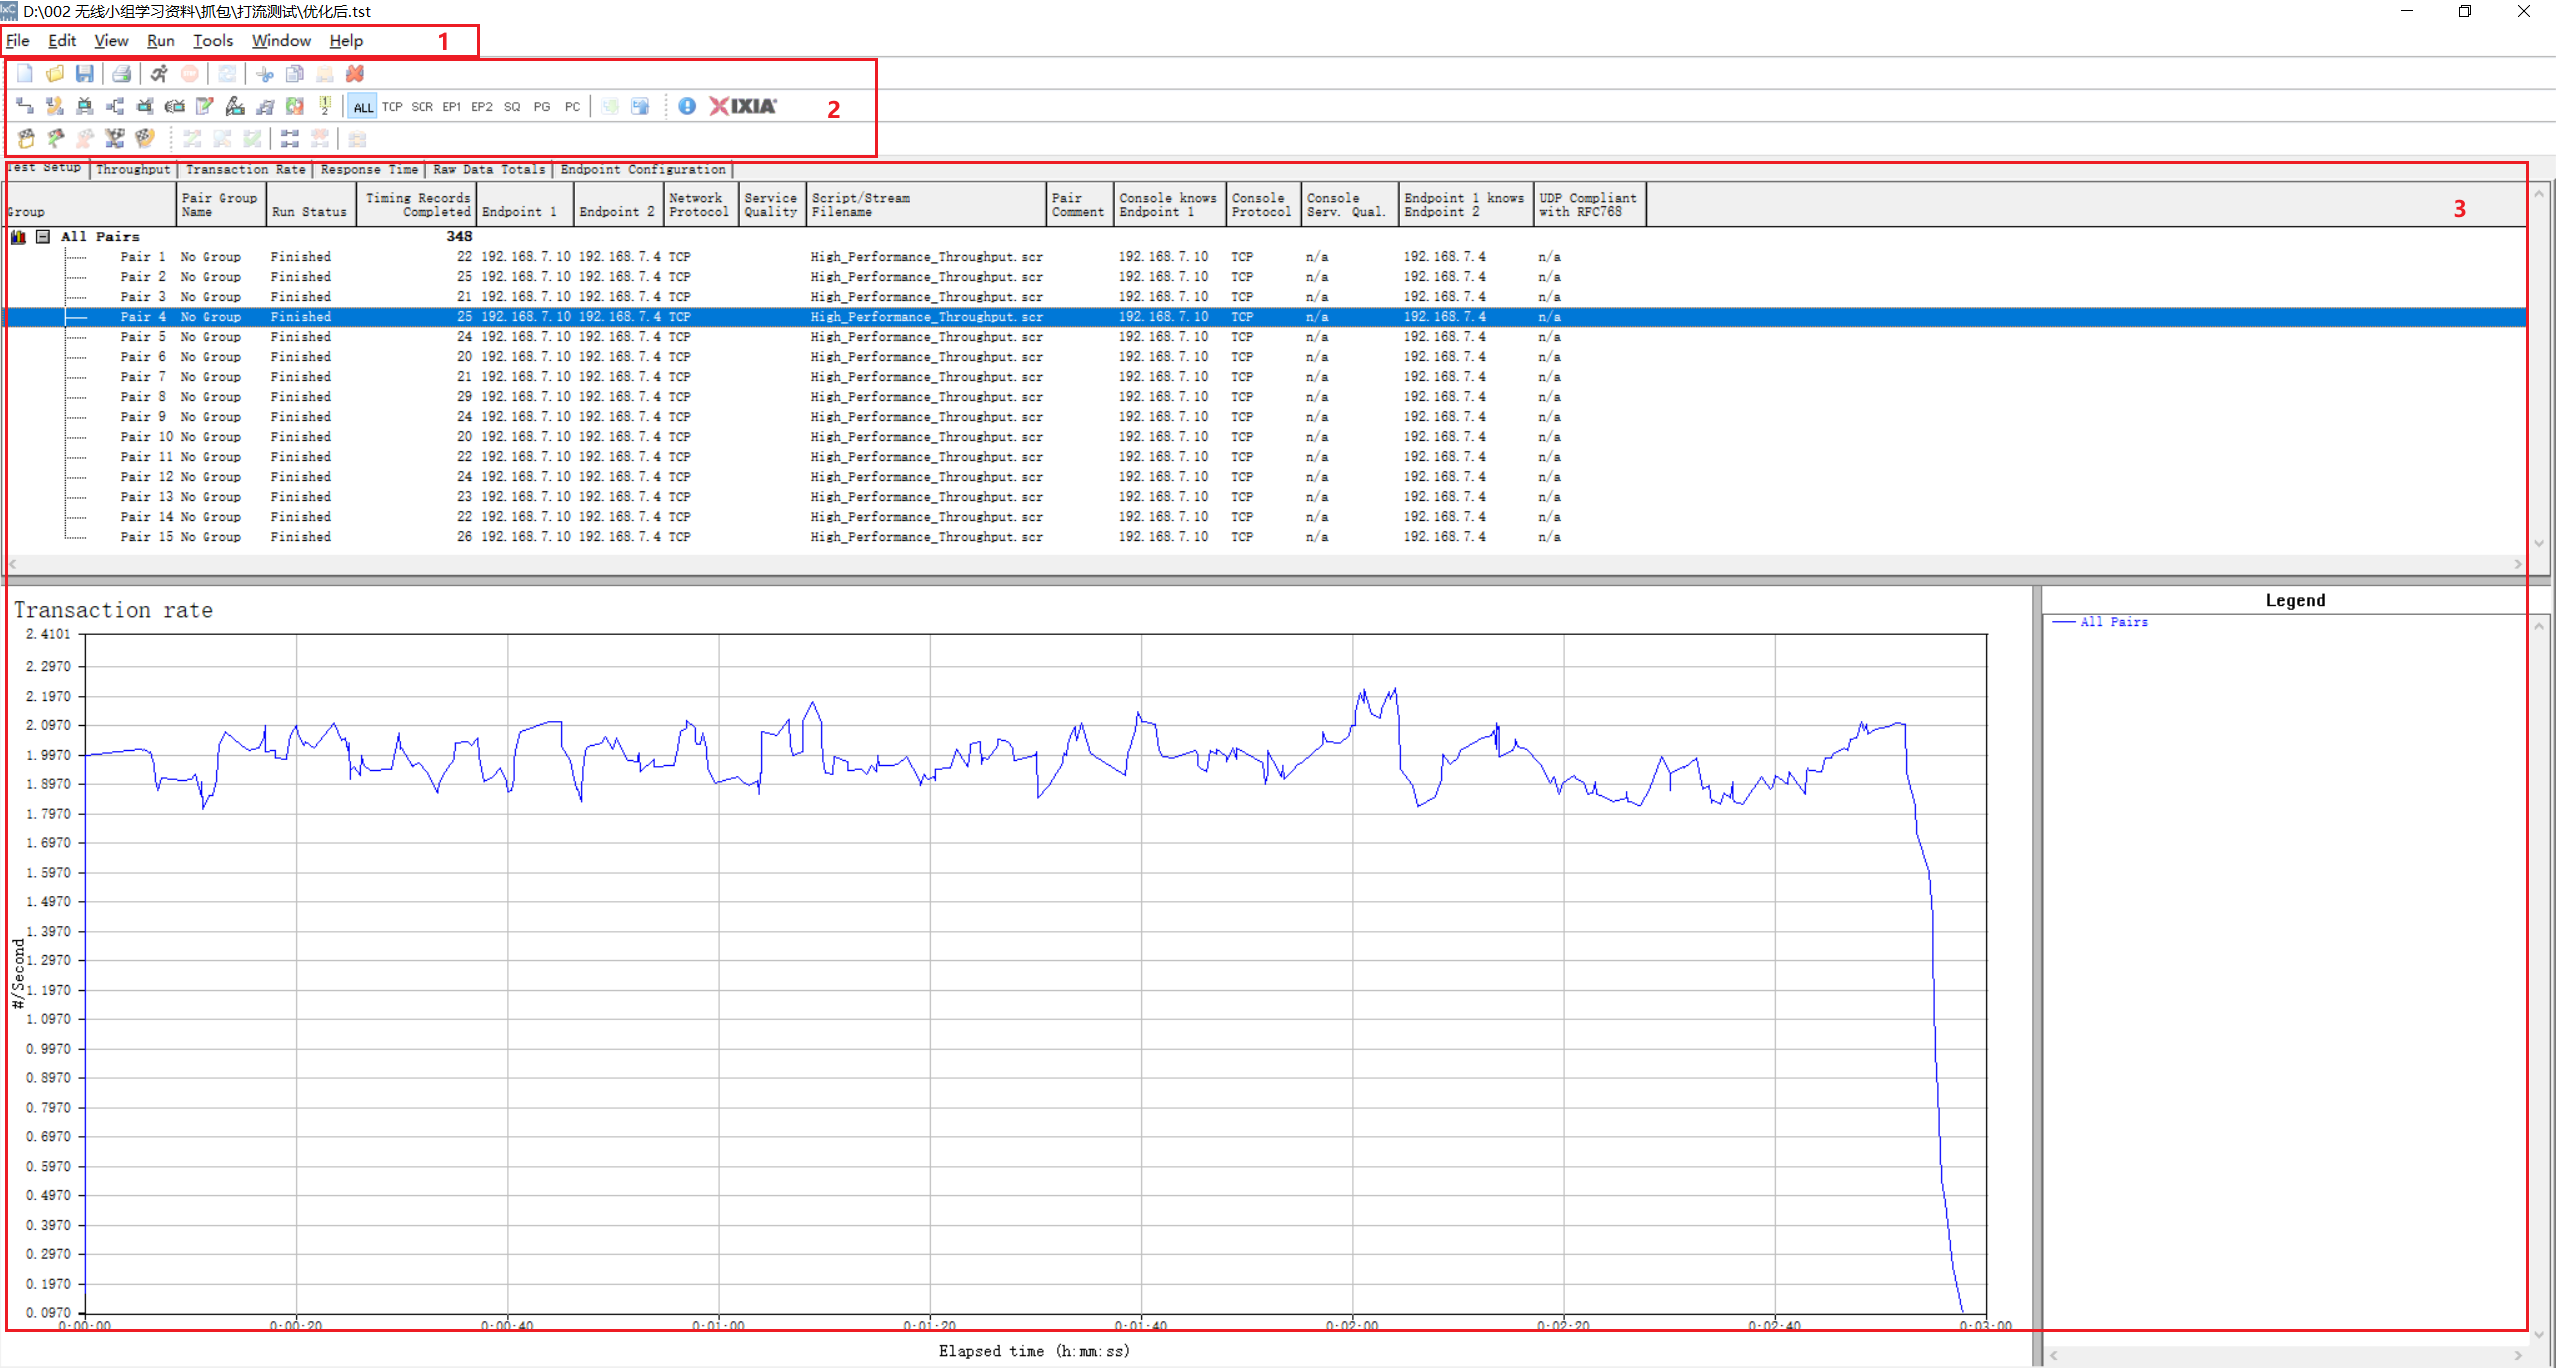
|
(1) Menu bar |
(2) Toolbar |
(3) Statistical area |
· Menu bar—Allows user to save statistics, set running configuration, and perform other operations.
· Toolbar—Provides access to commonly used operations, including save/open files, and start/stop hitting streams.
· Statistical area—Allows users to view the statistical information of playing streams and other contents.
ixia chariot common operations
1. Click the Add Pair
icon ![]() in the toolbar.
in the toolbar.
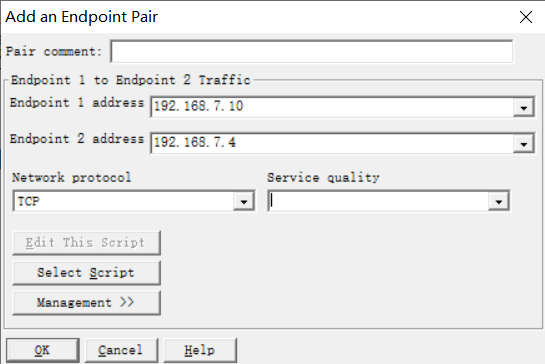
2. Set the source and destination addresses of the traffic. In this example, Endpoint 1 is the source address and Endpoint 2 is the destination address.
3. Click Select Script to modify the parameters of the script.
4. Select the network protocol type.
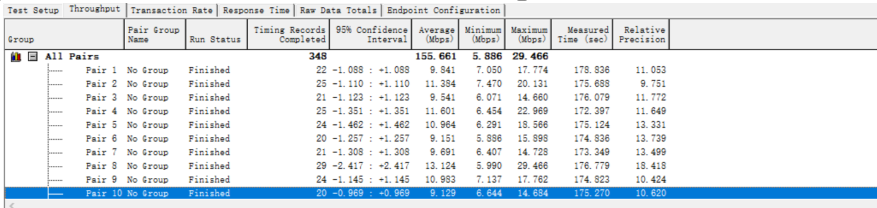
5. Check the added pairs.
You can copy and paste to set up multiple data streams (or multiple pairs) to make full use of the bandwidth.
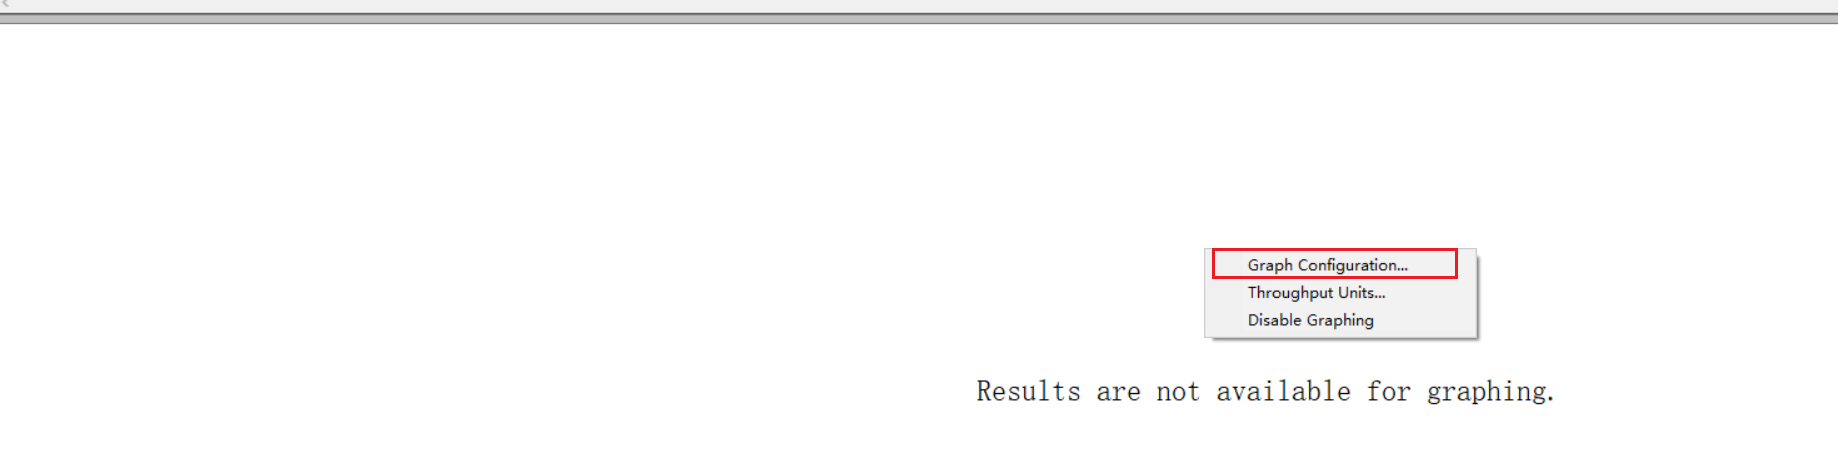
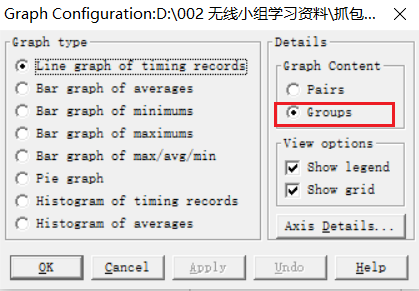
6. Right-click in the margin of the data graph and select Graph Configuration, then select Groups as the Graph Content.
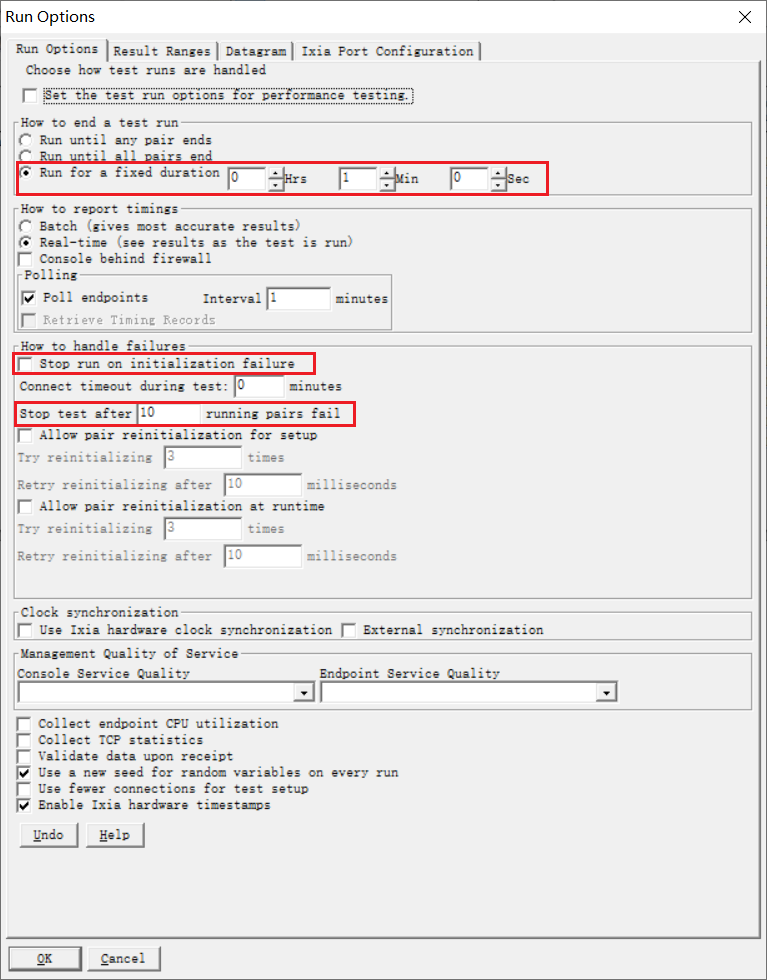
7. Select Run > Set Run Options in the menu bar.
¡ Set the test run time. In this example, the test run time is 1 minute.
¡ Unselect Stop test if initialization fails. If you select this option, the streams might fail to start.
¡ Set the number of failed running pairs that can stop the test.
8. Click Run on the toolbar to start the performance test.
On the Throughput tab, you can view the throughput of the device's upstream or downstream traffic.

