- Table of Contents
- Related Documents
-
| Title | Size | Download |
|---|---|---|
| 01-H3C Wireless Smart O&M All-in-One | 10.57 MB |
H3C Wireless Smart O&M All-in-One
Copyright © 2023 New H3C Technologies Co., Ltd. All rights reserved.
No part of this manual may be reproduced or transmitted in any form or by any means without prior written consent of New H3C Technologies Co., Ltd.
Except for the trademarks of New H3C Technologies Co., Ltd., any trademarks that may be mentioned in this document are the property of their respective owners.
This document provides generic technical information, some of which might not be applicable to your products.
The information in this document is subject to change without notice.
Filter O&M statistics by clients
View packet interaction for client access
View AP association failure statistics
View AP disassociation statistics
Identify zombie APs or invalid APs
Fast view issue analysis summary
Fast view issue analysis details
Key designs
System structure
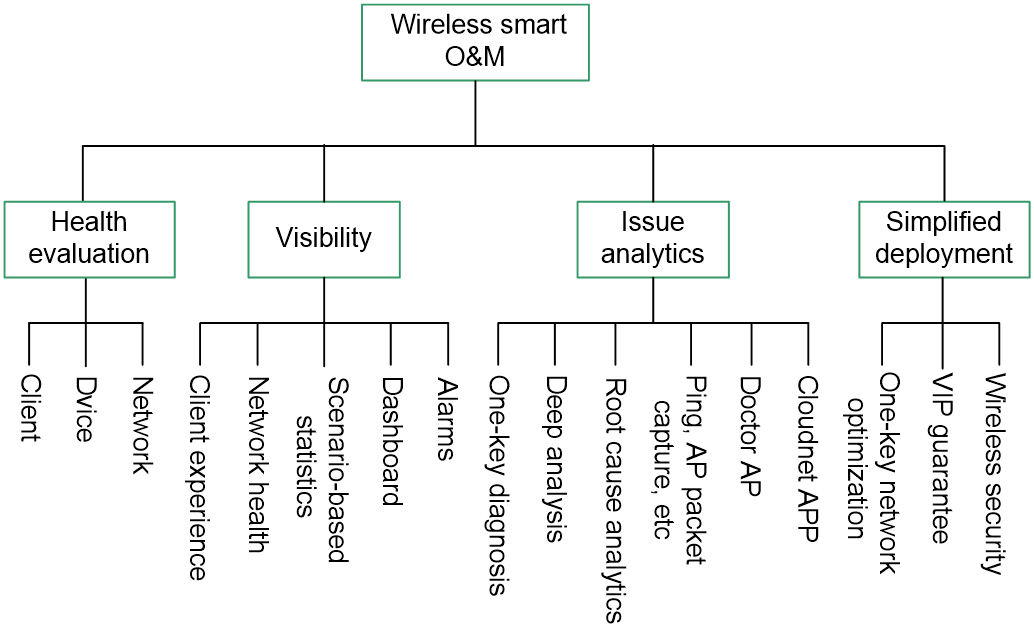
The H3C wireless smart O&M system combines cloud, network, and clients in a structure as shown in Figure 1. The system features the following:
· Complete health evaluation system from client, device, and network perspectives.
· Real-time displaying of client, device, and network operation status and the optimization process from the cloud in a visible manner.
· All-round issue analysis capability, helping O&M engineers to fast locate network issues.
· Flexible deployment method, allowing users to manually deploy the network or adopt automatic deployment based on the actual network scenario.
· Powered by application AI algorithms and able to automatically identify, analyze, and resolve issues.
Figure 1 Structure of the wireless smart O&M system
Health evaluation
A network contains multiple network elements, and the ultimate purpose of O&M is to adjust the operating parameters of the network elements to ensure that the network is in the best condition at all times. The network health evaluation system of H3C wireless smart O&M first evaluates the client experience and the health status of each network element, and then derives the network health status of the entire network in a weighted manner. Health assessment helps administrators quickly locate faulty devices and solve network problems in a timely manner, which greatly reduces the workload of O&M engineers.
Telemetry
With the popularization of wireless networks and the continuous expansion of network scale, the difficulty of network O&M gradually rises. In the face of diversified user needs and changing network environment, traditional O&M methods (such as SNMP, CLI, and logs) cannot meet the network needs, specifically:
· SNMP and CLI obtain device data by sending requests to devices. The operation limits the number of network devices that can be monitored and cannot obtain data fast.
· SNMP Trap and logs obtain data through proactive device reporting. However, only events and alarms are reported and the monitored data are insufficient for accurately displaying the network conditions.
Telemetry is a remote data collection technology that monitors device performance and errors. It depends on proactive device reporting to obtain abundant data in time and pushes the data to the collectors of the network management system to achieve fast fault location. Telemetry provides the following benefits:
· High accuracy and rich type of data collection to fully reflect network conditions.
· Continuous reporting upon subscription.
Compared with traditional network monitoring technologies, Telemetry only needs to be configured once and the device can continuously report data, which reduces the pressure on devices to handle query requests.
· Fast and accurate fault location.
· Data collection and reporting in seconds.
· Per-packet data collection.
The wireless smart O&M solution uses Telemetry to achieve fast network status awareness and second-level O&M. By collecting network-wide information, including network equipment, traffic, quality, related events, and alarm information, data drilling and mining are conducted to show users the key value elements of the network. This helps O&M engineers to quickly perform IT decision-making, problem analysis, and network optimization.
Deep analysis
Deep analysis digitizes and visualizes the message interaction process during client access. In traditional O&M, it is difficult for users to locate the problem when the network is unavailable or network access is difficult. Deep analysis shows the process that a wireless client goes through when using the network, including wireless access, user authentication, IP address application, ARP detection, DNS detection, and data traffic transmission, as well as the time consumption of each stage and server address. This helps users pinpoint network problems.
Doctor AP
The data of traditional O&M system mainly comes from network equipment such as AC AP and switches, lacking the most direct detection data of clients. If the probe nodes are deployed separately on the network, the cost is high and the management is difficult.
In order to solve the above problems, the wireless smart O&M launched the Doctor AP technology, This technology uses online AP to simulate the real business process of the client and diagnose the health of WLAN network from the perspective of the client, including wireless access, network connectivity and so on. During the connection process, the Doctor AP will record the time of message interaction. After connecting to the AP, some network detection functions will be performed, such as APP access and web page access. After the test, Doctor AP will save and upload the detection results to the cloud platform, and users can troubleshoot network faults based on the detection results.
The wireless smart O&M Doctor AP technology collects network fault information through the cloud platform and carries out intelligent analysis to help the rapid recovery of network faults. The advantages are low operation and maintenance cost and short time cycle.
Issue analytics
Successful identification and analysis of issues require experience and the empowerment of new technologies. A complete O&M system must reduce the reliance on people, and be able to proactively identify and analyze problems, quickly locate the root causes, and respond to network changes in a timely manner.
Through over 10 years of experience, the developers of the H3C wireless smart O&M system have analyzed and sorted out the common online problems and introduced the issue analytics feature. This feature can display the statistics of various issues encountered by the clients or APs connected to the device, including nine categories and more than 30 subcategories of problems, such as terminal access, authentication, roaming, Internet access, and wireless environment. This greatly reduces the time cost of network administrators in inspecting the network and provides effective data support for solving network problems.
Quick startup
This section describes some commonly-used functions of the wireless O&M system to help users quickly start to use the system.
|
|
NOTE: H3C wireless smart O&M relies on the Cloudnet public cloud and private cloud. You can access the smart O&M section through Cloudnet. |
Access the smart O&M section
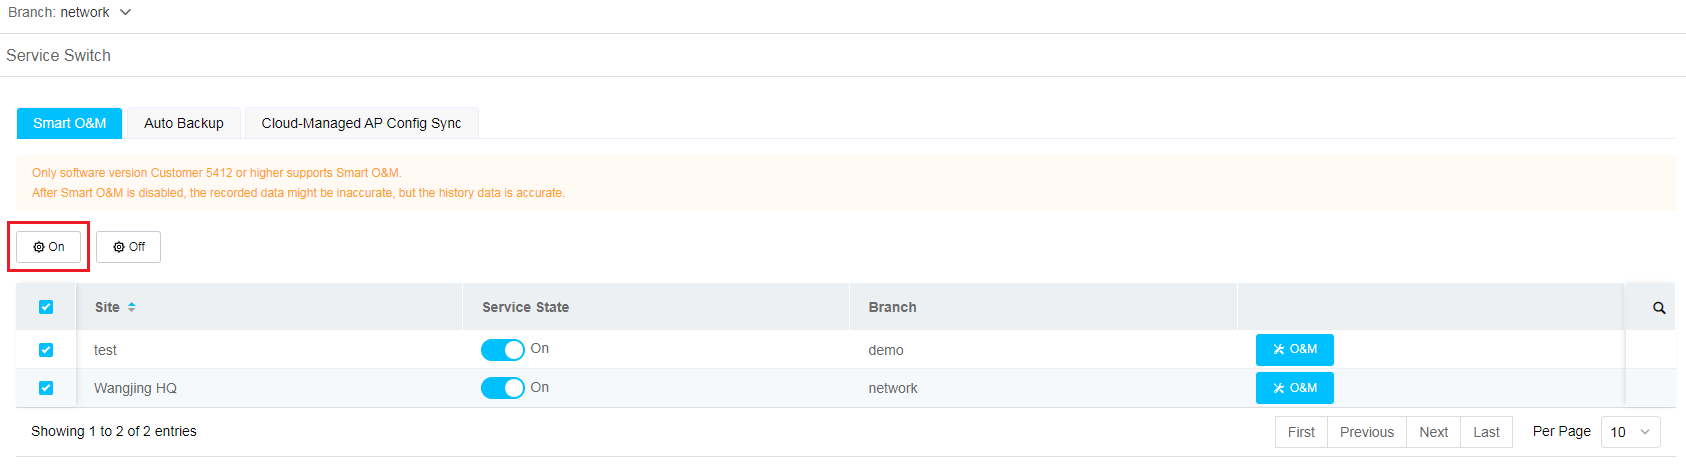
Enable the smart O&M service
1. Log in to the Cloudnet platform.
2. On the top navigation bar, click Network.
3. From the left navigation pane, select System > Service Switch.
4. In the site list, select the target sites, and then click On.
Figure 2 Enabling the smart O&M service
Access the smart O&M section
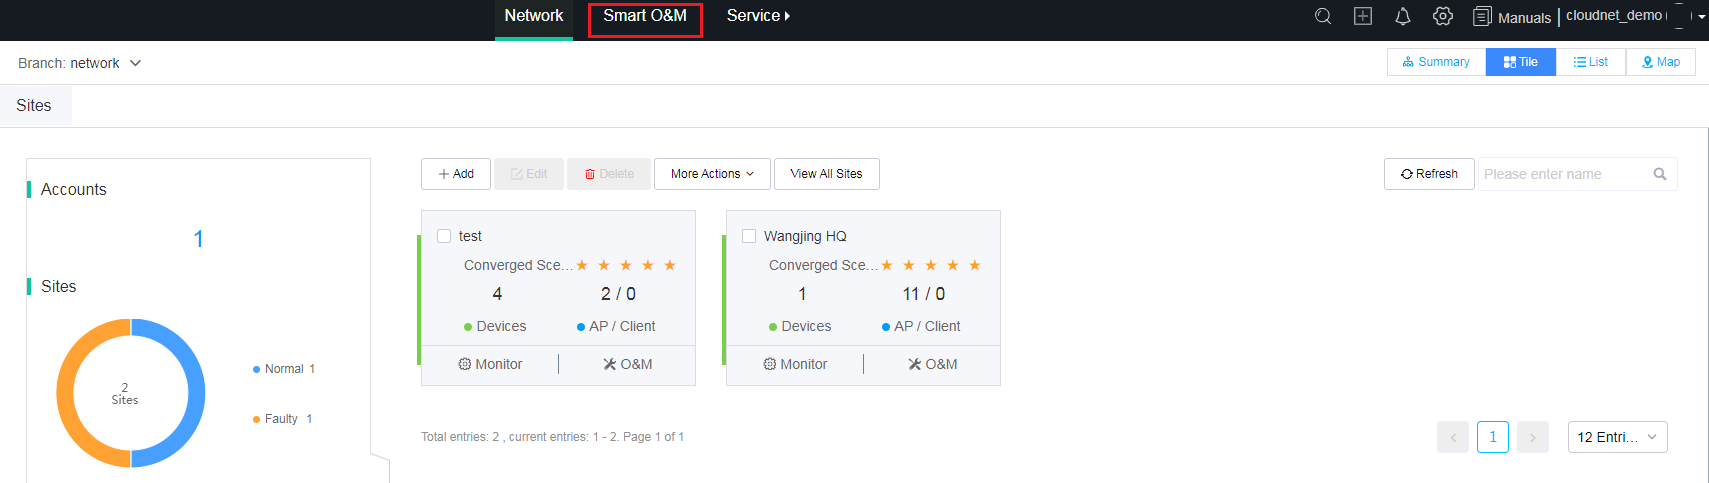
Use one of the following methods to access the smart O&M section:
· Method one:
Click Smart O&M on the top navigation bar.
Figure 3 Accessing the smart O&M section (1)
· Method two:
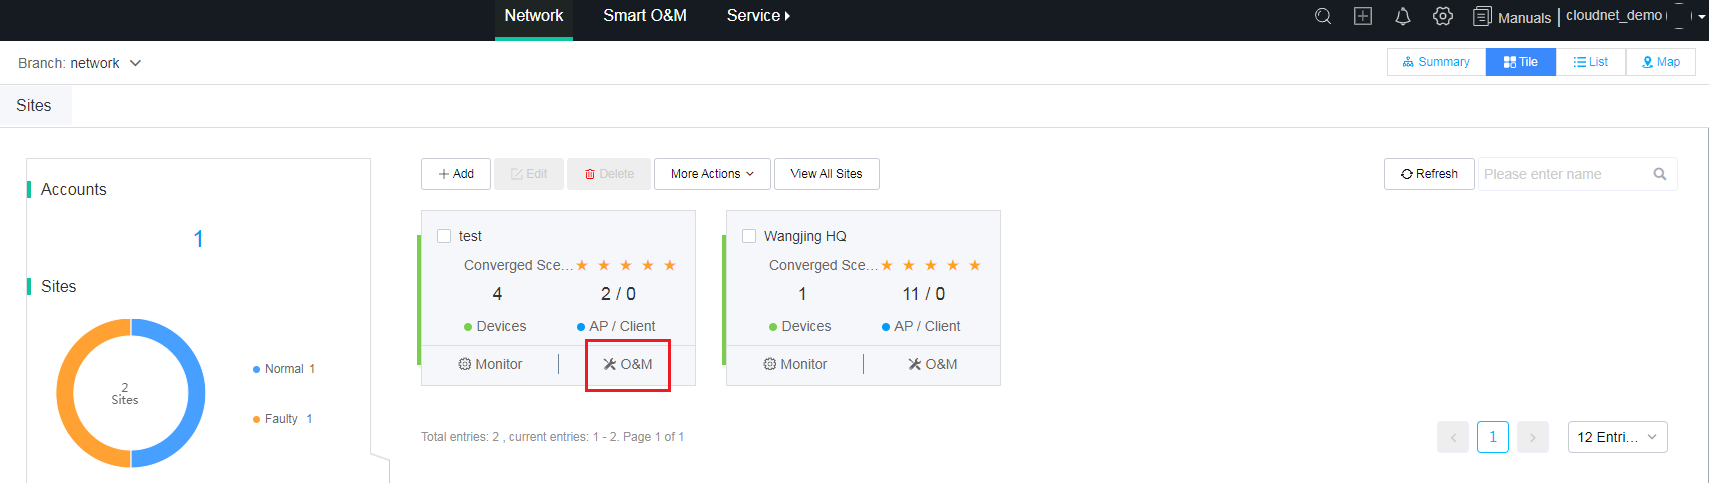
On the Network > Dashboard page, click O&M for the target site.
Figure 4 Accessing the smart O&M section (2)
· Method three:
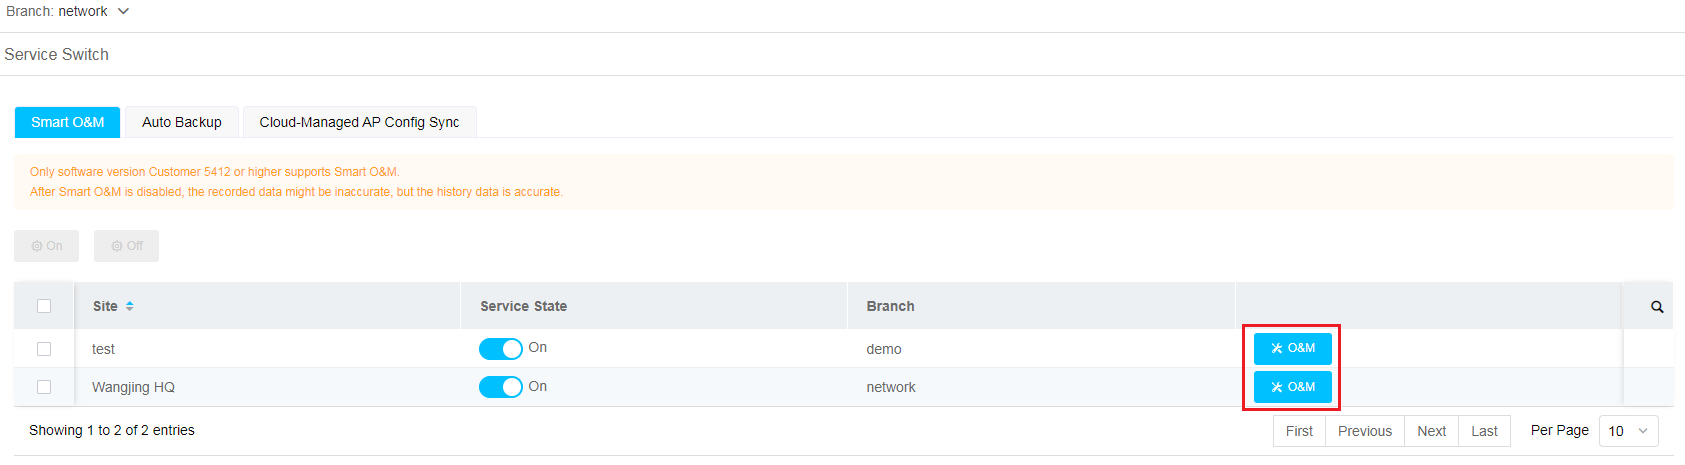
On the System > Service Switch page, click O&M for the target site.
Figure 5 Accessing the smart O&M section (3)
Filter O&M statistics by time
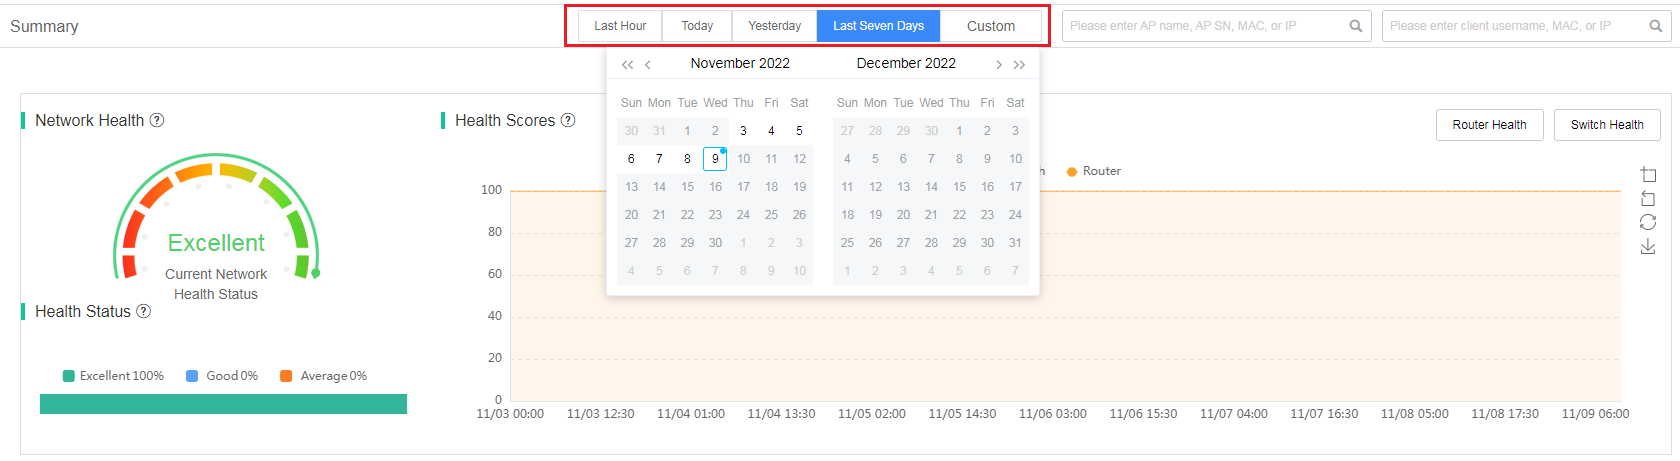
To filter O&M statistics by time, select a time range at the top of the work pane.
Figure 6 Filtering O&M statistics by time
Switch the device or area
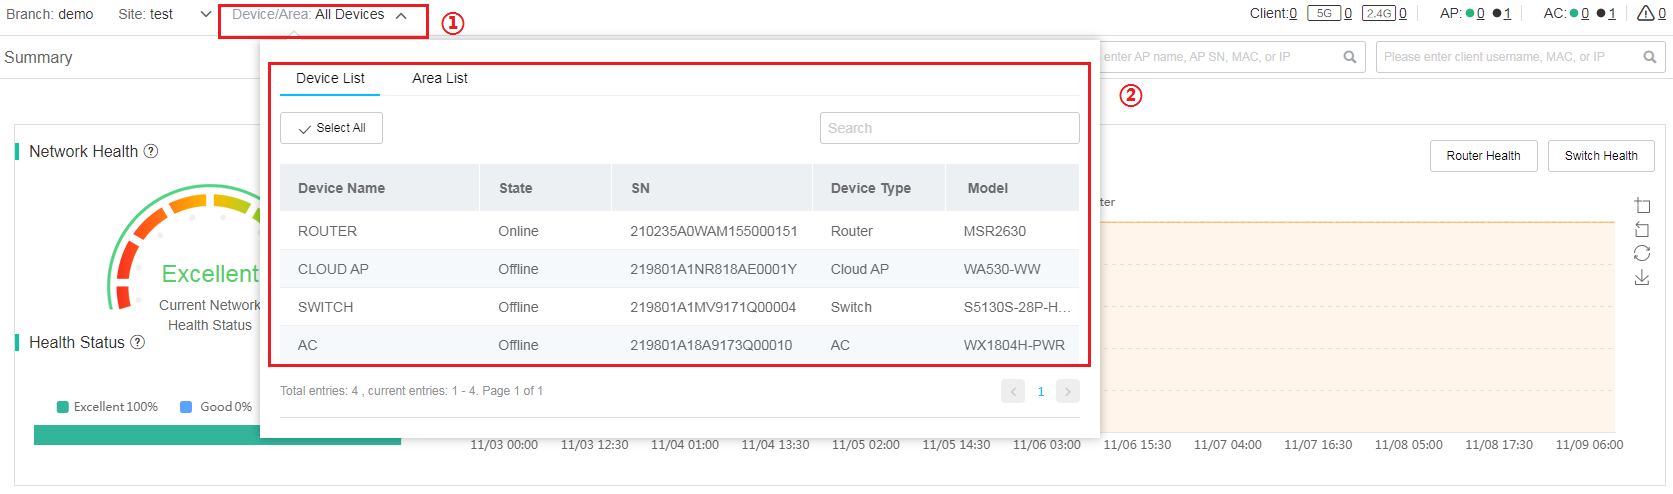
To switch the device or area, select the target device or area from the top of the work pane. The page then displays information about the newly selected device or area.
Figure 7 Switching the device or area
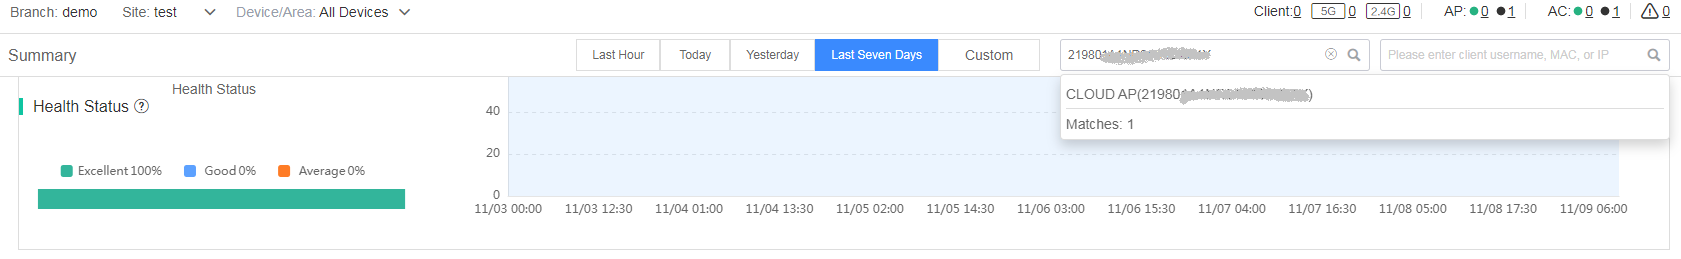
Filter O&M statistics by clients
To view information about a specific client, enter the client username, IP address, or MAC address in the search box. Then, click the client entry. The client information page displays client statistics, basic information, connection information, score trend, and client logs. For more information, see "View client information."
Figure 8 Filtering O&M statistics by clients
Filter O&M statistics by APs
To view information about a specific AP, enter the AP name, serial number, MAC address, or IP address in the search box. Then, click the AP entry. The AP information page displays basic AP information, score trend, CPU and memory trend, online client details, client rate, port traffic, and AP logs. For more information, see "View AP information."
Figure 9 Filtering O&M statistics by APs
Fast view network status
The connecting snapshots feature allows users to view operation status of online clients, online radios, and online APs connected to the specified device in real time.
To view connecting snapshots, navigate to the Dashboard > Connecting page.
Connection statistics snapshots are color coded to indicate the indicator status:
· Red—Poor.
· Orange—Fair.
· Blue—Good.
· Green—Excellent.
· Gray—No data available.
To view detailed information, click a color segment.
Figure 10 Connectivity statistics snapshots
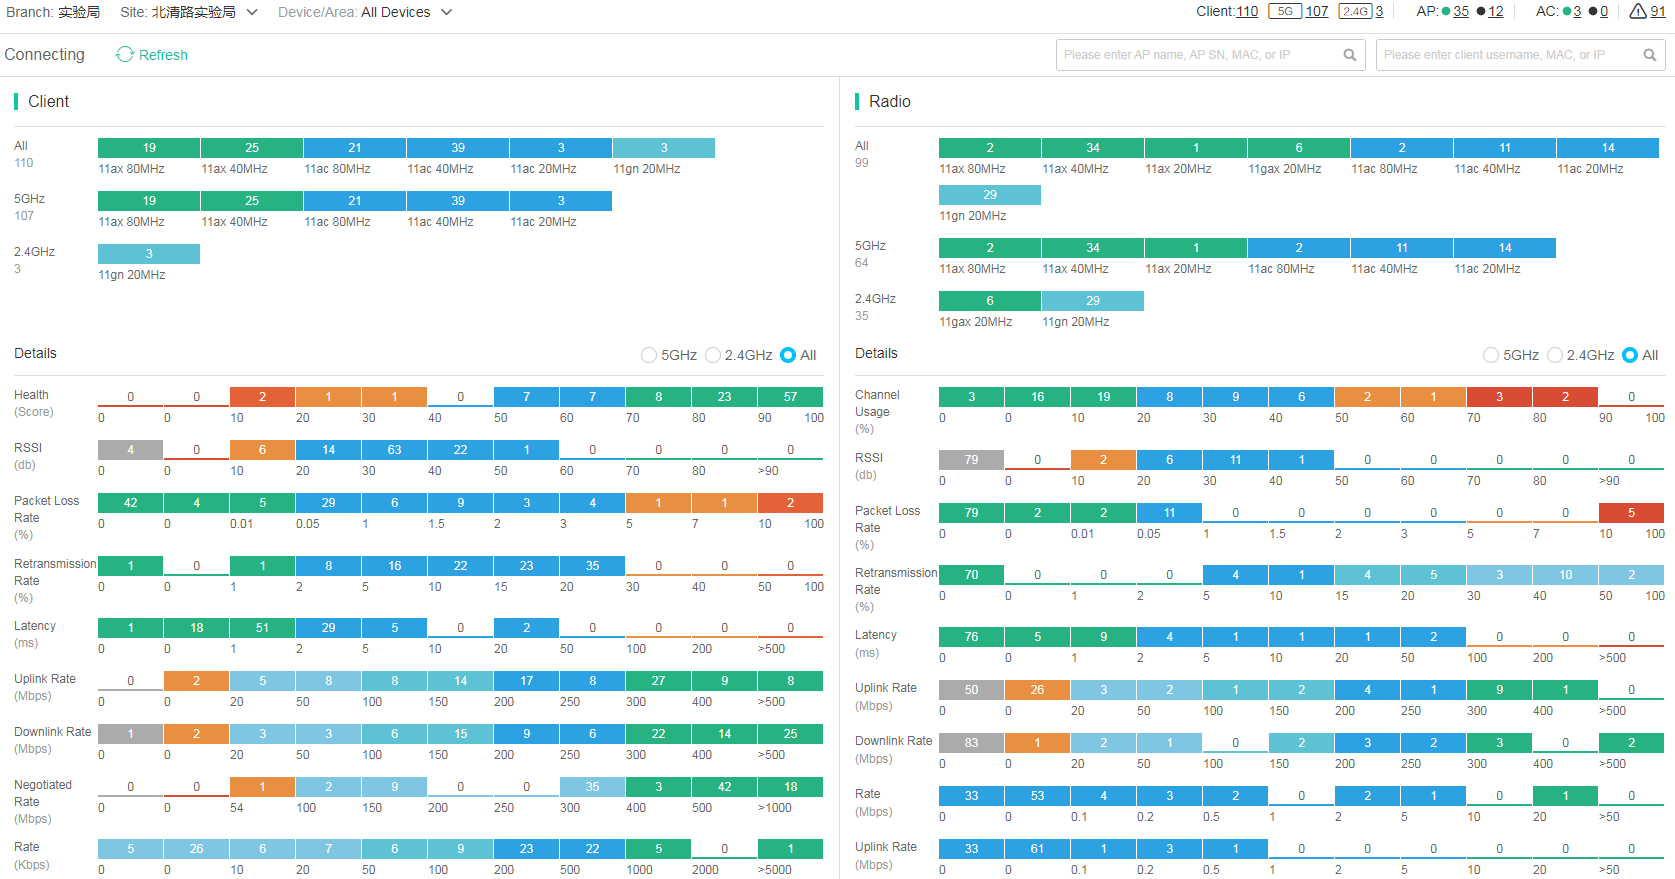
Client statistics snapshots
Client type statistics displays the distribution of client types in the current network in real time. Users can directly view low-rate clients in the network.
The client distribution chart displays information about online client operation in the current network in real time from the following perspectives: client health, RSSI, packet loss rate, retransmission rate, latency, downlink speed, uplink speed, negotiated rate, rate, traffic, and traffic in the past 5 minutes. You can use this chart to identify clients in poor status and take actions accordingly.
Radio statistics snapshots
Radio type statistics displays the distribution of radio types in the current network in real time. Users can directly view radio statistics in the network.
The radio distribution chart displays information about online radio operation in the current network in real time from the following perspectives: radio health, RSSI, packet loss rate, retransmission rate, latency, downlink speed, uplink speed, rate, uplink rate, downlink rate, and client distribution.
AP statistics snapshots
The AP distribution chart displays online AP operation information in the current network in real time from the following perspectives: AP health, CPU usage, and memory usage. You can use this chart to identify APs in poor status and take actions accordingly.
View client information
Use either of the following methods to view client information:
· Filter O&M statistics by clients
· Navigate to the Clients > Wireless > Online Clients page, and then click the MAC address of the target client in the online client list.
Client information
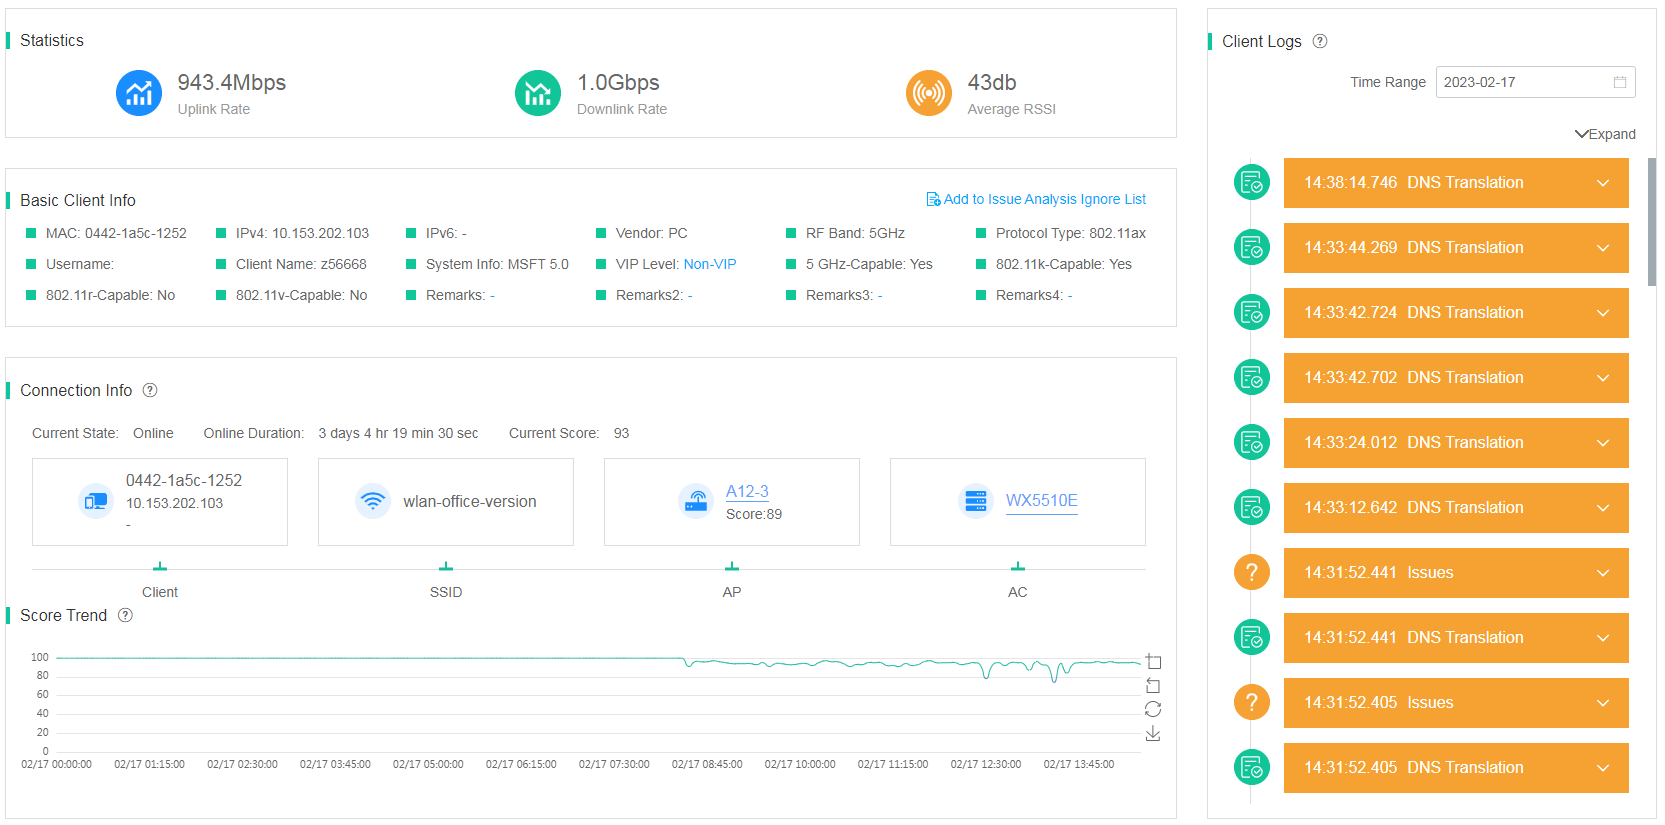
On the Client Info tab, you can view the following information:
· Statistics—For an online client, this area displays the uplink speed, downlink speed, and average signal RSSI during the previous statistics collection period. For an offline client, this area displays data in the last statistics collection period before the client went offline.
· Basic Client Info—Displays basic client information, including MAC address, IP address, vendor, client frequency, and protocol type.
· Connection Info—Displays the online status, access wireless service, and score trend of the client during the most recent statistics collection period. To view detailed information, click the AP name or AC name.
· Score Trend—Displays the client health score trend over a time range. For a score lower than 100, the system also displays the point deduction reason and deducted points.
· Client Logs—Displays all events occurred on the client over a time range as a timeline. Severe issues are red-colored and other issues are yellow-colored.
Figure 11 Client Info tab
Expert mode
The expert mode provides more detailed and specialized data and statistics than the client information page. To access the expert-mode page, click the Expert Mode tab on the terminal information page. You can view the following information:
· Health report—Displays key client indexes and the corresponding reference values. Users can compare the current values and the reference values to evaluate the client status. Indexes with values below or over the reference values are red-colored.
· Client Connection Info—Displays client index trend over a time range. Indexes with values below or over the reference values are red-colored. To view connection information details, click a trend chart.
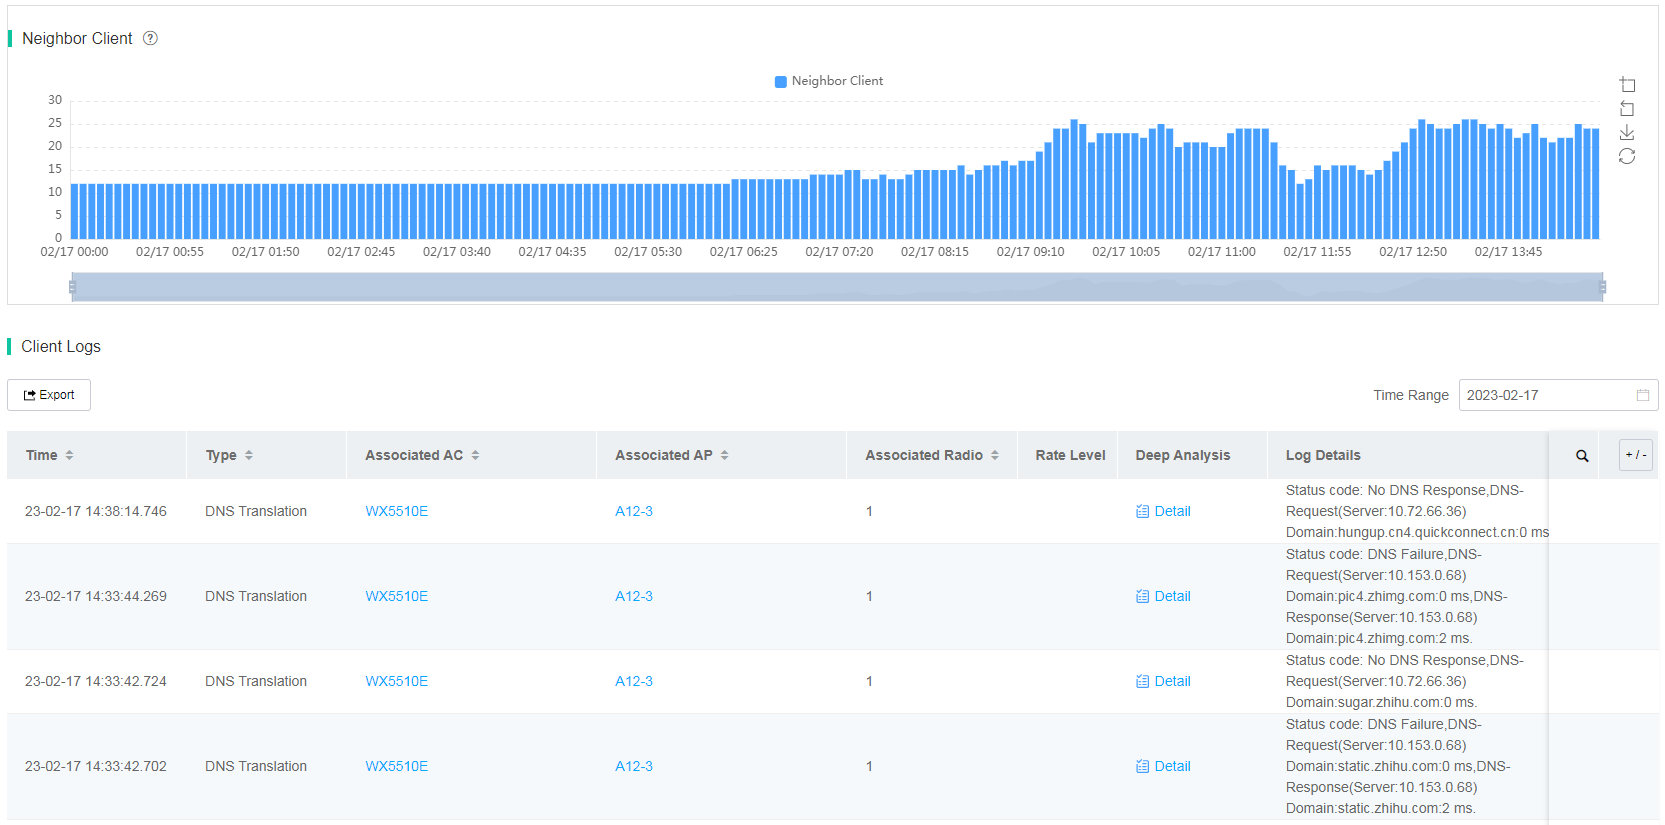
· Neighbor Client—Displays the quantity trend of clients on the same radio over a time range. To view neighbor client details, click a bar in the bar chart. The system then displays the level-1 VIP client, level-2 VIP client, non-VIP client, and self-defined client information for you to view the connection differences between clients of different types on the same radio.
· Client Logs—Displays all client events, including association, disassociation, and association failure, over a time range.
Figure 12 Export mode page (health report and client connection information)
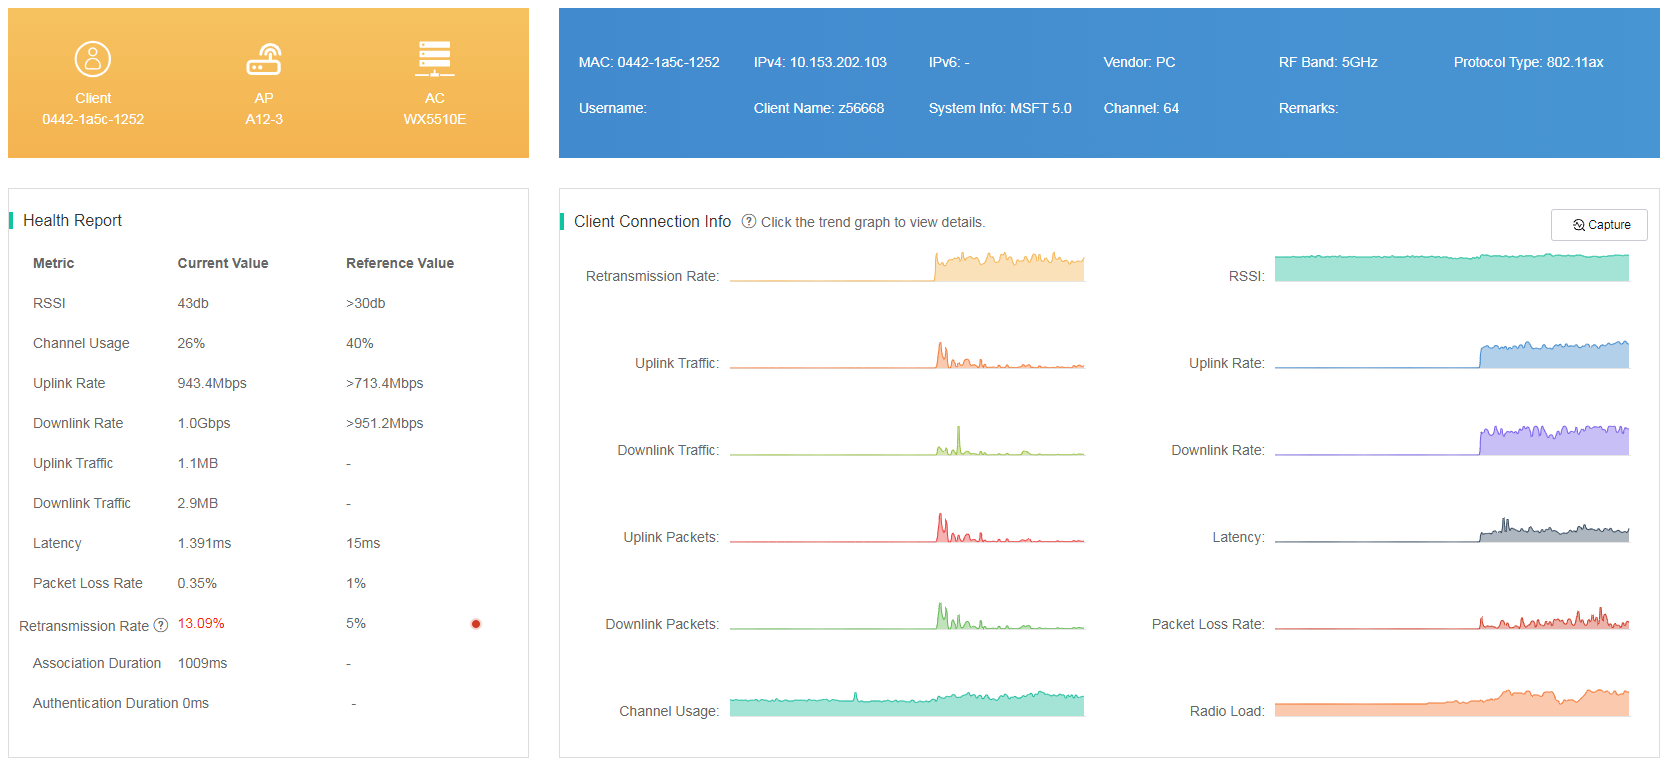
Figure 13 Expert mode page (neighbor clients and client logs)
Issue analytics
Issue analytics summarizes the issues of the current client over a time range, including nine categories and more than 30 subcategories of issues, such as client access, authentication, roaming, Internet access, and wireless environment issues.
Figure 14 Issue analytics
View AP information
Perform one of the following tasks to view AP information:
· Method one:
· Method two:
Navigate to the Network > APs > Health page, and then click an AP name in the Health Details list.
· Method three:
Navigate to the Network > APs > AP Statistics page. On the APs tab, click an AP name in the Online AP list.
· Method four:
Navigate to the Network > APs > AP Statistics page. Click the AP Disassociations tab, and click an AP name in the AP Disassociation Details list.
Basic AP information
On the basic AP information page, you can view the following information:
· Basic AP Info—Displays basic AP information, including AP name, AP model, MAC address, IP address, version, and associated AC.
· AP Score Trend—Displays the score trend of the AP over a time range. For a score lower than 100, the system displays the point deduction reason and the deducted points.
· CPU Usage Trend/Memory Usage Trend—Displays the CPU usage trend and memory usage trend on the AP over a time range.
· Online Client Info—Displays the total number of associated clients over a time range. To view the number of clients on each radio at a moment, hover over the curve.
· Client Rate—Displays the total rate, uplink rate, and downlink rate trends of clients on the AP over a time range. To view the total rate, uplink rate, downlink rate, total traffic, downlink traffic, and uplink traffic at a moment, hover over the curve.
· Port Traffic—Displays the incoming traffic, outgoing traffic, and packet statistics on a specific port during a day or multiple days. The system collects statistics at intervals of 5 minutes. If no port is specified, the system displays information about all ports.
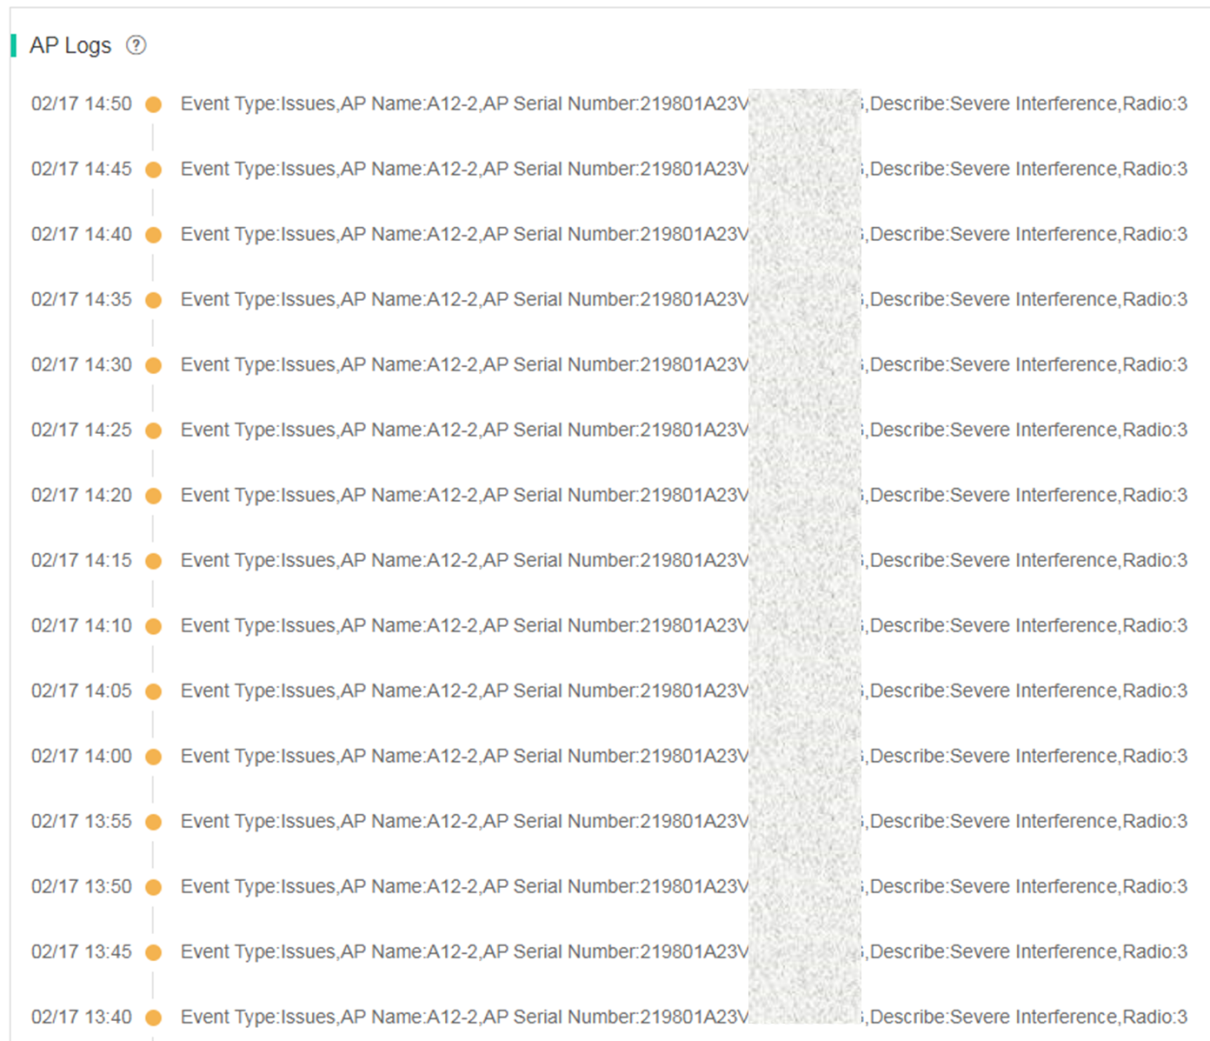
· AP Logs—Displays all events occurred on the AP over a time range as a timeline. Issues are yellow-colored and non-issue events are green-colored.
Figure 15 AP basic information (AP basic information, score trend, CPU and memory trend, and online client details)
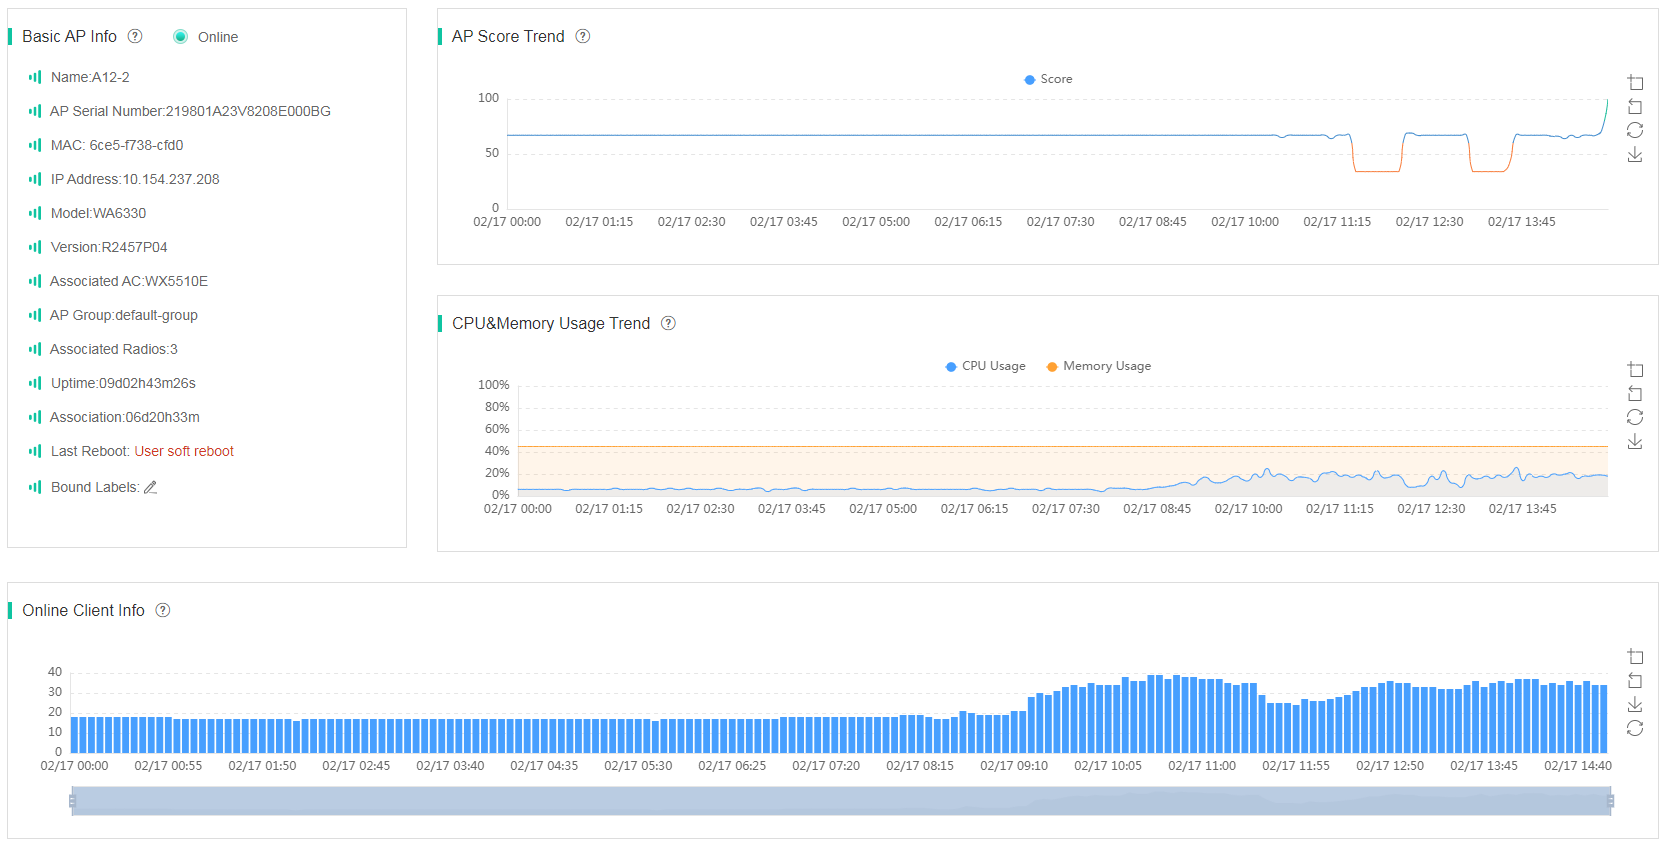
Figure 16 AP basic information (client rate and port traffic)
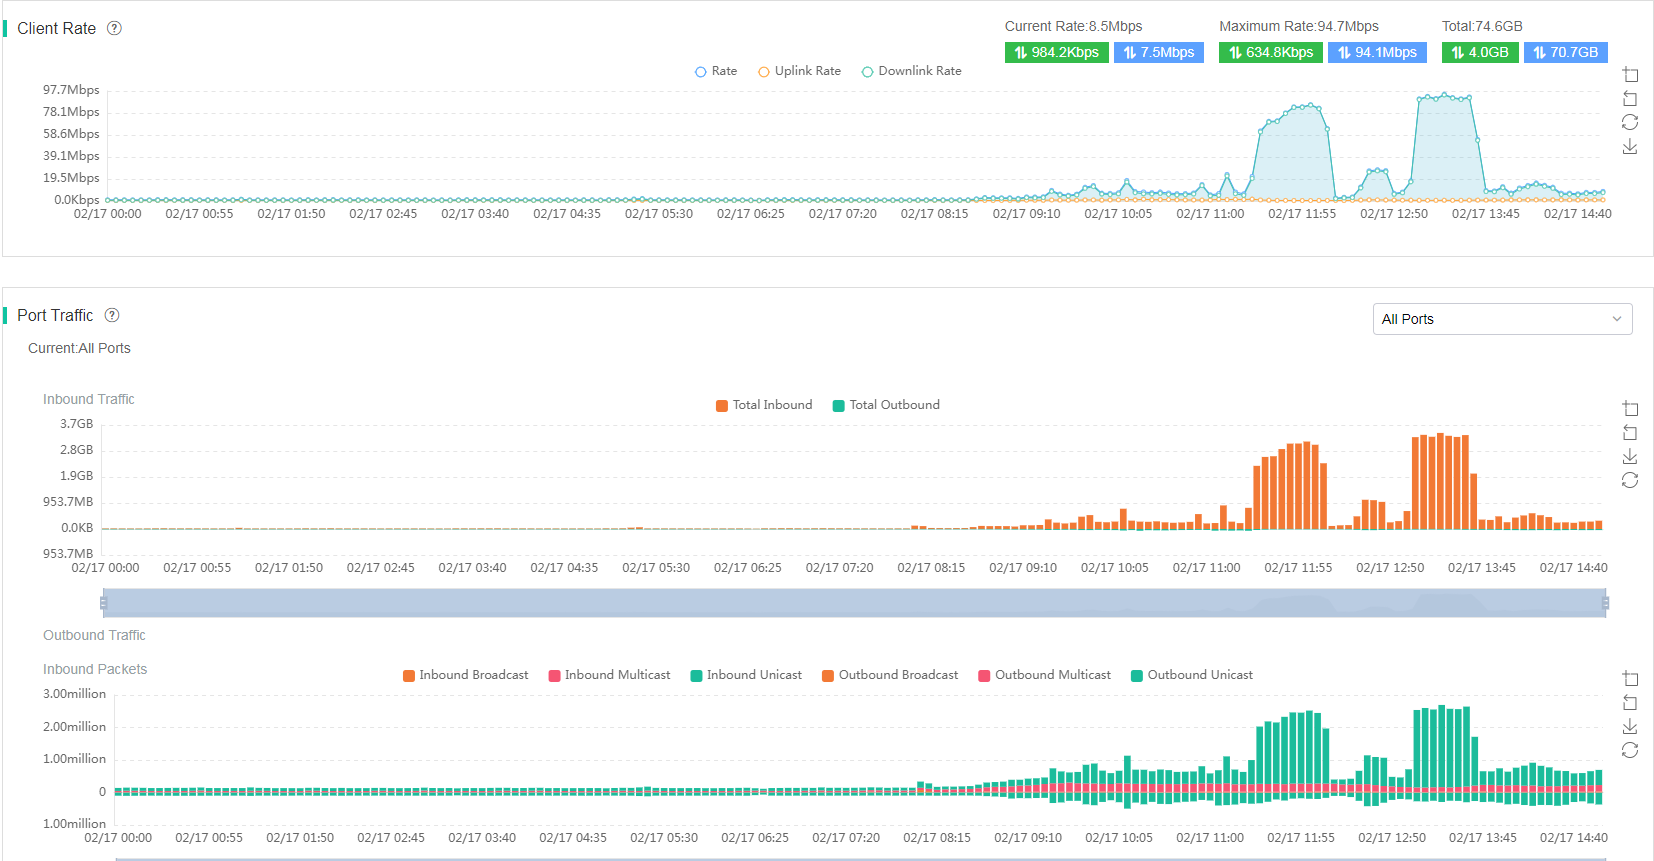
Figure 17 AP basic information (AP logs)
AP radio information
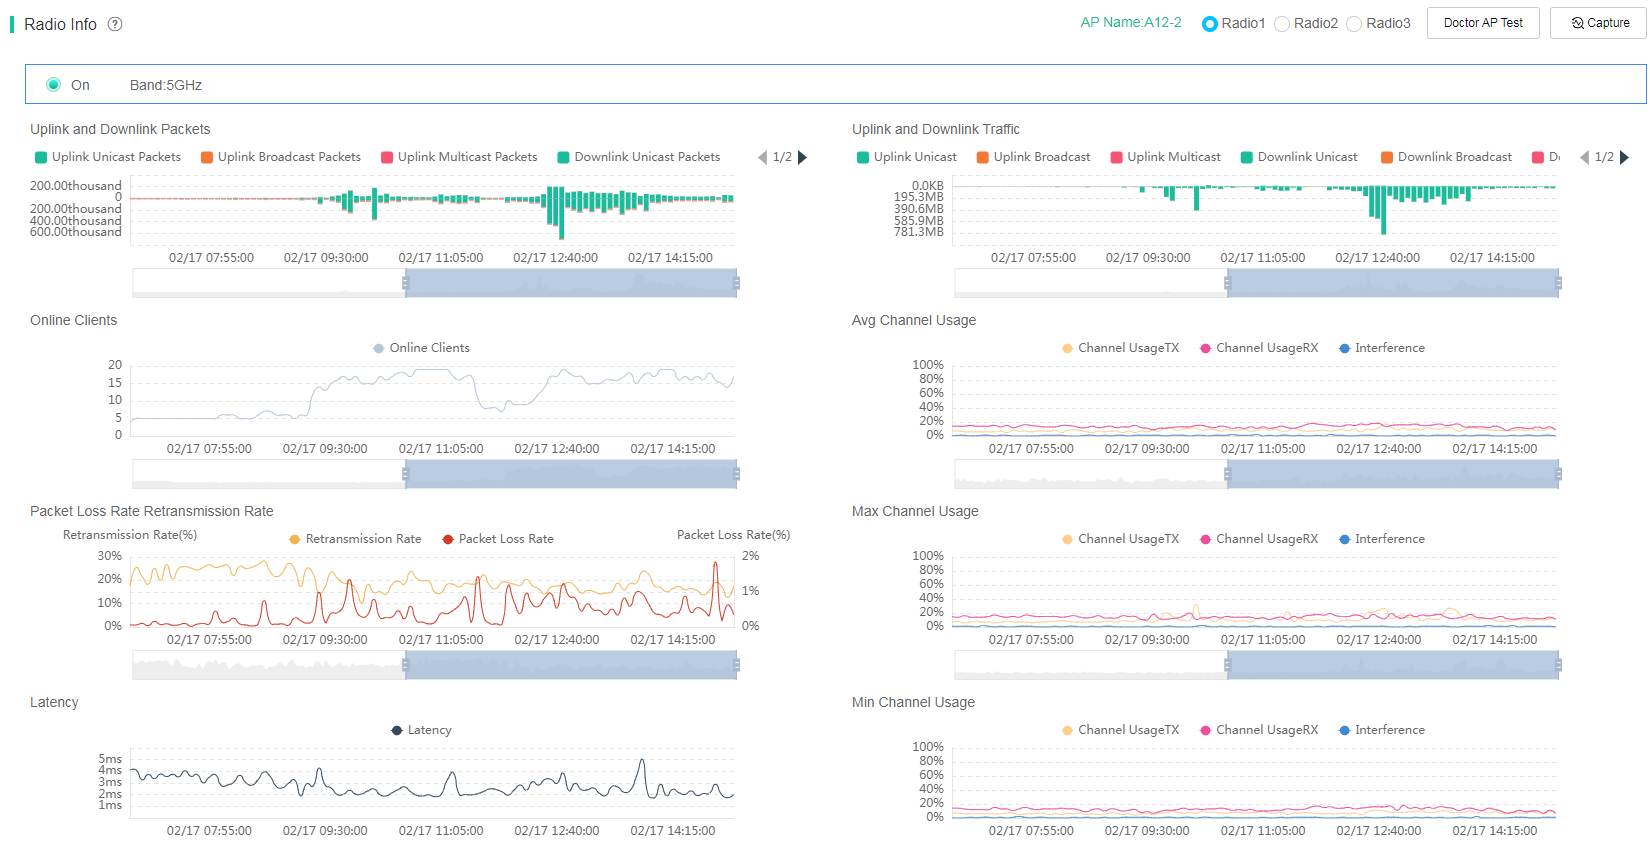
To view AP radio information, click the Radios tab. The page displays the following radio statistics: uplink and downlink packets, online users, packet loss rate and retransmission rate, latency, uplink and downlink speed, RSSI, uplink and downlink traffic, average channel usage, maximum channel usage, minimum channel usage, noise floor, and score.
Figure 18 AP radio information
View packet interaction for client access
Deep analysis can display the packet interaction process experienced by a wireless client when using the network, including the process of wireless access, user authentication, IP address application, ARP detection, DNS detection and data traffic, as well as the time consumption of each process and server address. This helps users pinpoint network problems.
To view packet interaction for client access, use either of the following methods:
· Client Info tab.
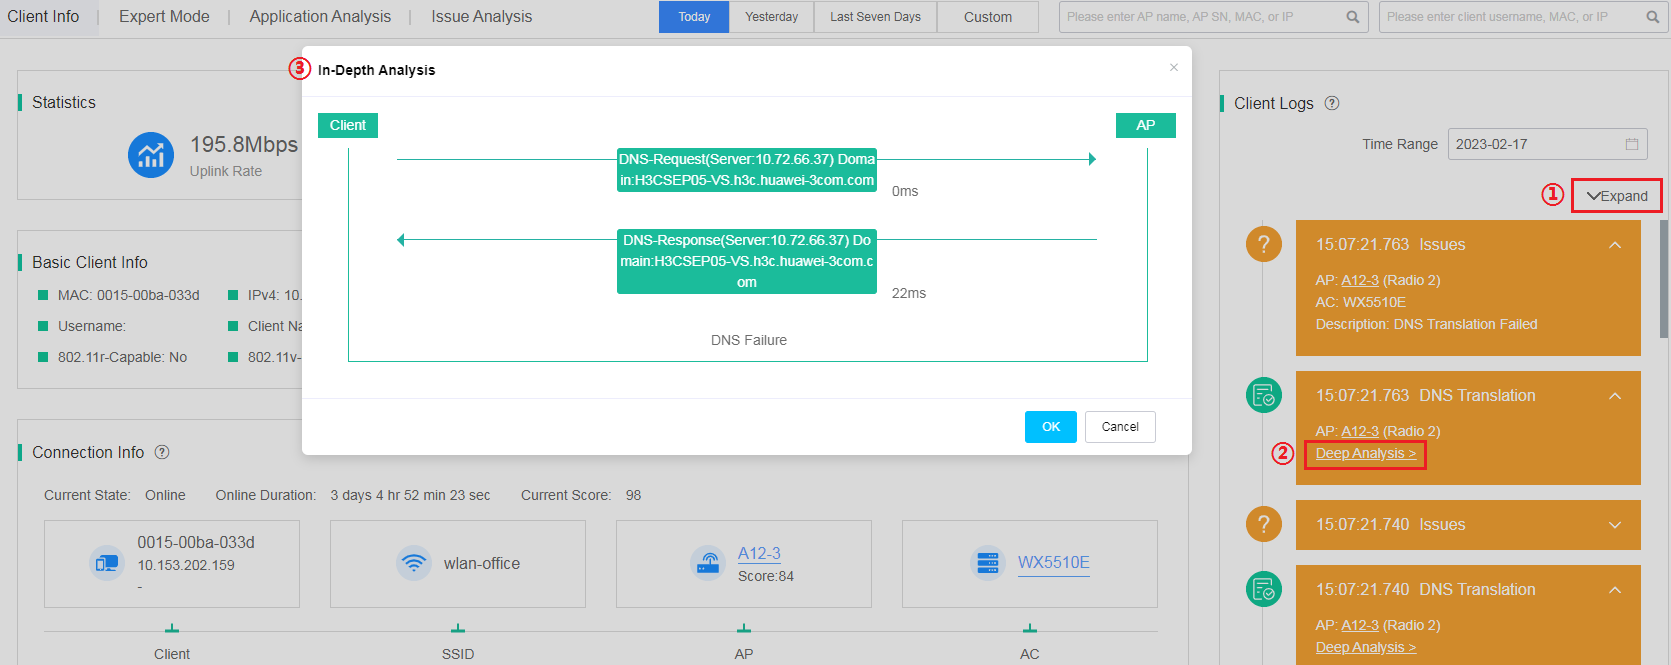
On the Client Info tab, expand the client logs, and then client Deep Analysis for the target event.
Figure 19 Client information tab
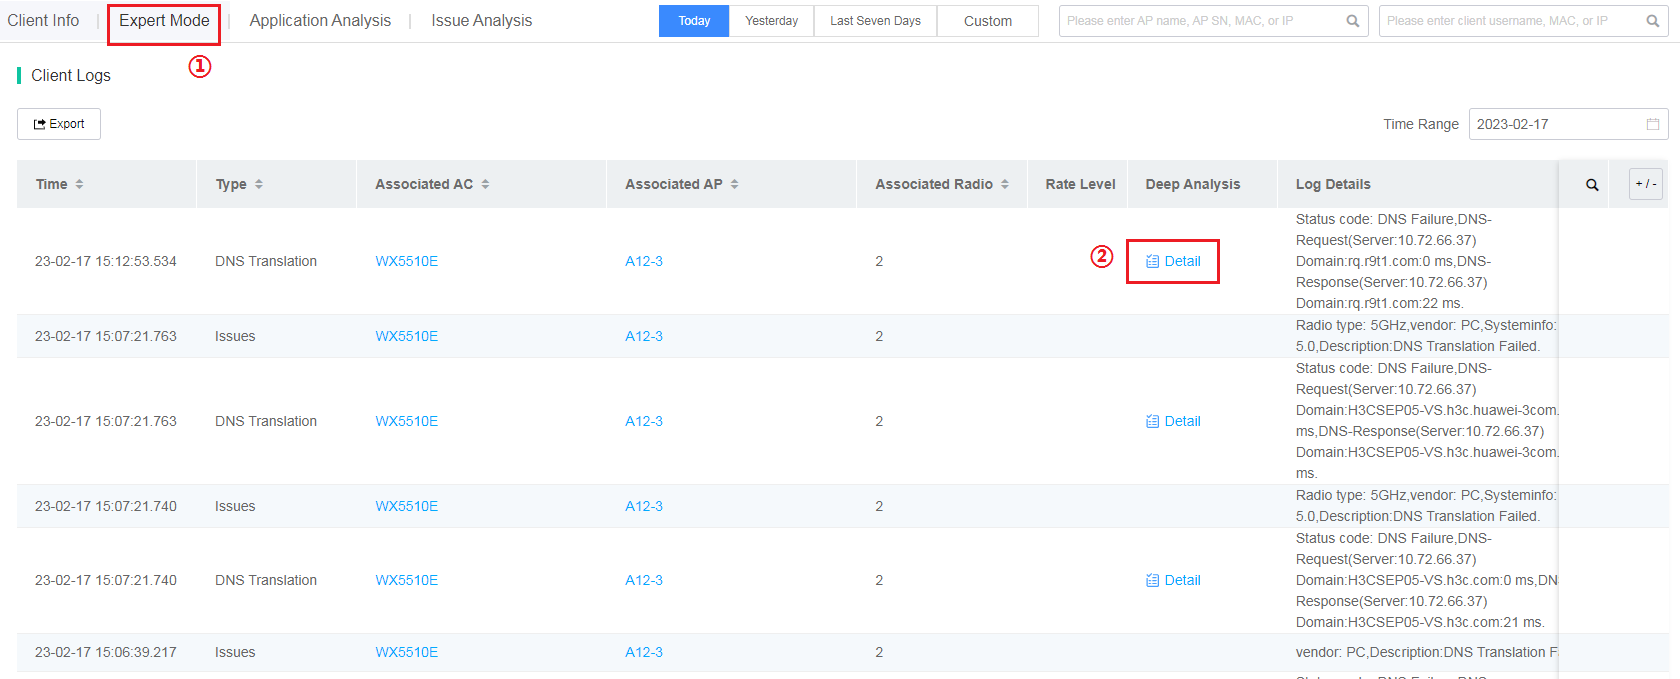
· Expert Mode tab
Click the Expert Mode tab, and click Details for the target event in the Deep Analysis column.
Figure 20 Expert mode tab
View AP association failure statistics
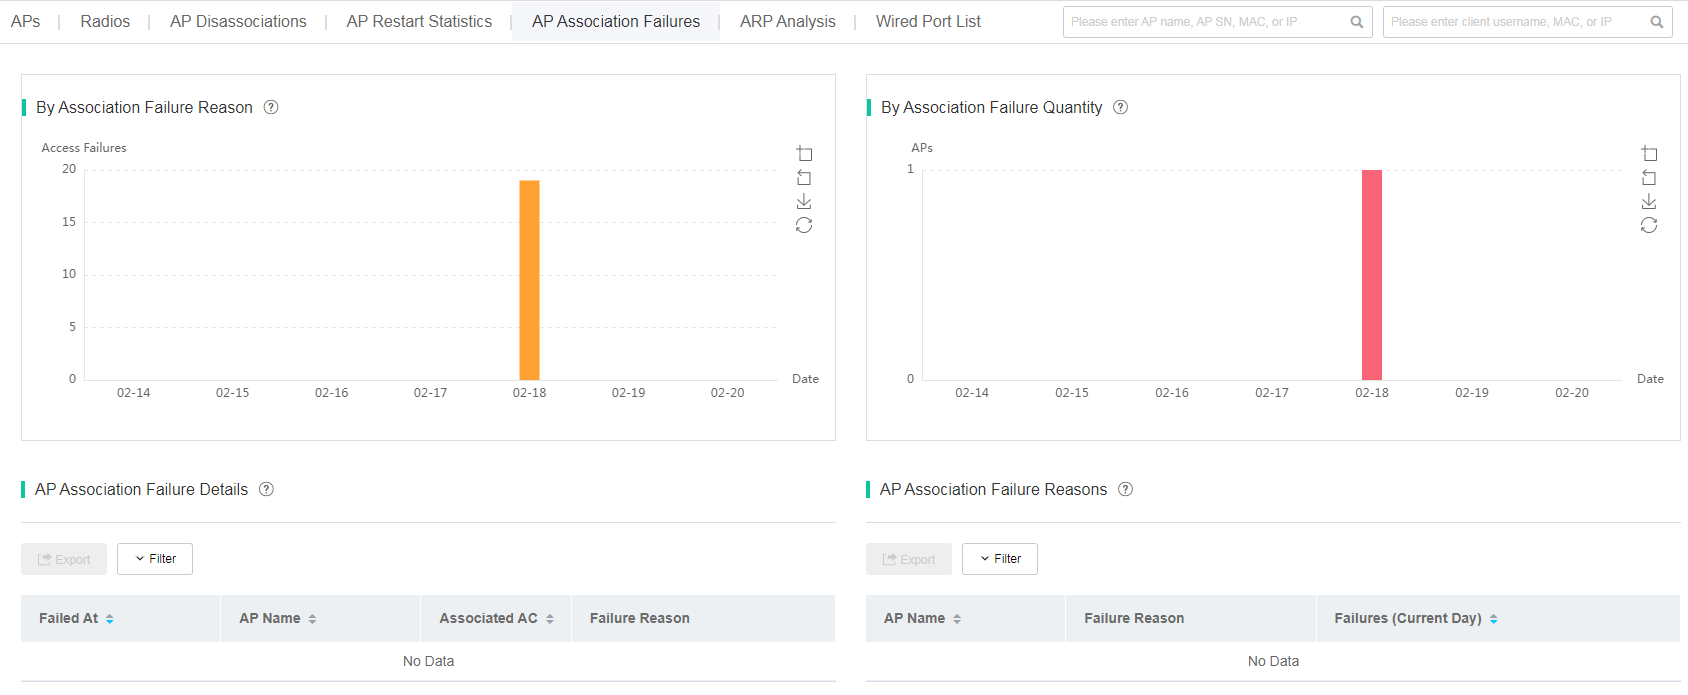
To view AP association failure statistics, navigate to Network > APs > AP Statistics, and then click the AP Association Failures tab. The page that opens displays the number of AP association failures in the past 7 days and the failure reasons. To view the statistics for a specific day, hover over the corresponding bar.
· AP Association Failure Details—If you click a bar in the By Association Failure Reason or By Association Failure Quantity bar chart, the list displays details about all the AP association failures occurred on the day.
· AP Association Failure Reasons—If you click a bar in the By Association Failure Reason bar chart, the list displays reasons about all the AP association failures occurred on the day.
Figure 21 AP association failure statistics
View AP disassociation statistics
To view AP disassociation statistics, navigate to Network > APs > AP Statistics, and then click the AP Disassociations tab. The page that opens displays the number of AP disassociations in the past 7 days and the disassociation reasons. To view the statistics for a specific day, hover over the corresponding bar.
· AP Disassociation Details—To display details about all the AP disassociations occurred on a day, click a bar in the By Disassociation Reason or By Disassociation Quantity bar chart.
· AP Disassociation Reasons—To display reasons about all the AP disassociations occurred on a day, click a bar in the By Disassociation Reason bar chart.
Identify zombie APs or invalid APs
To identify zombie APs or invalid APs, navigate to Network > APs > AP Statistics, and then click the APs tab.
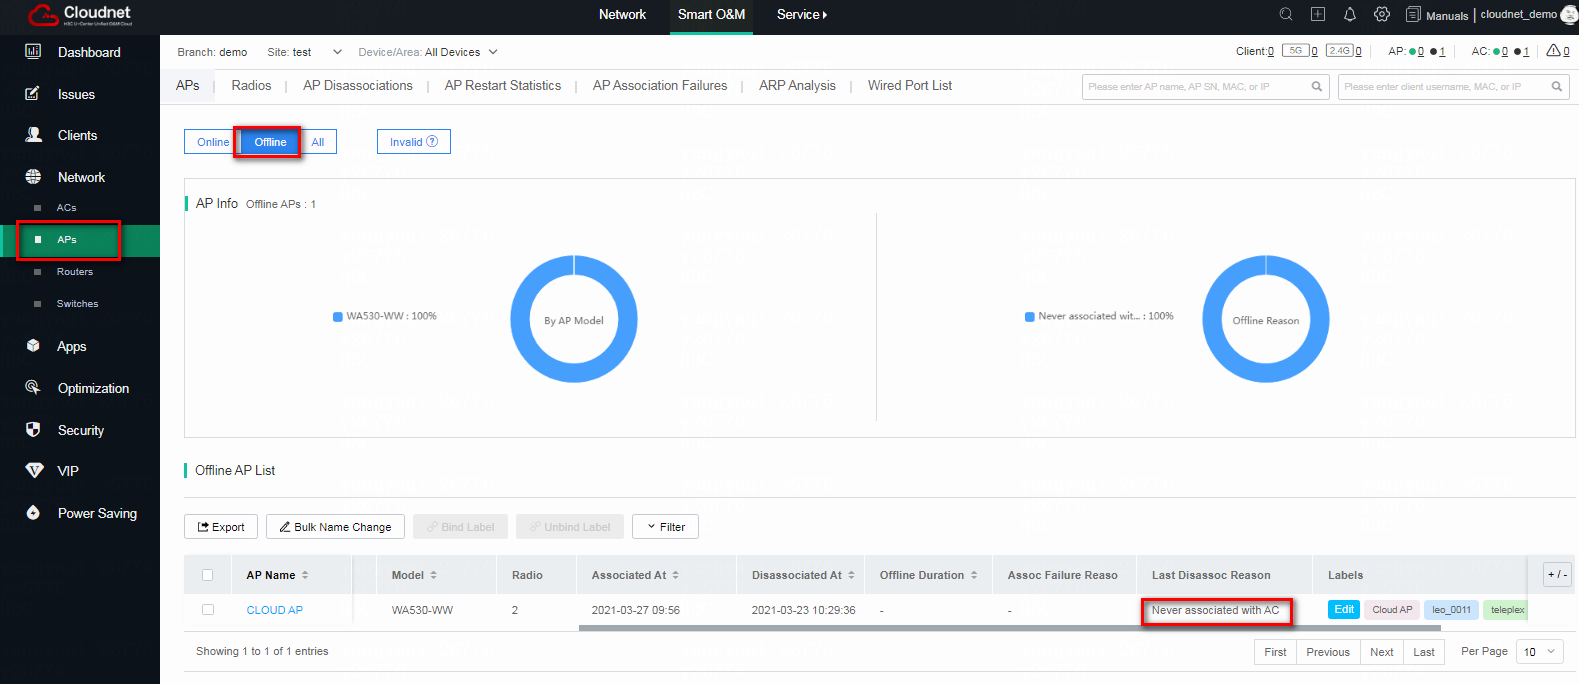
Identify zombie APs
Zombie APs are APs that have never been associated with an AC or are in a fake offline status because residual AP configuration remains on the AC after AP replacement.
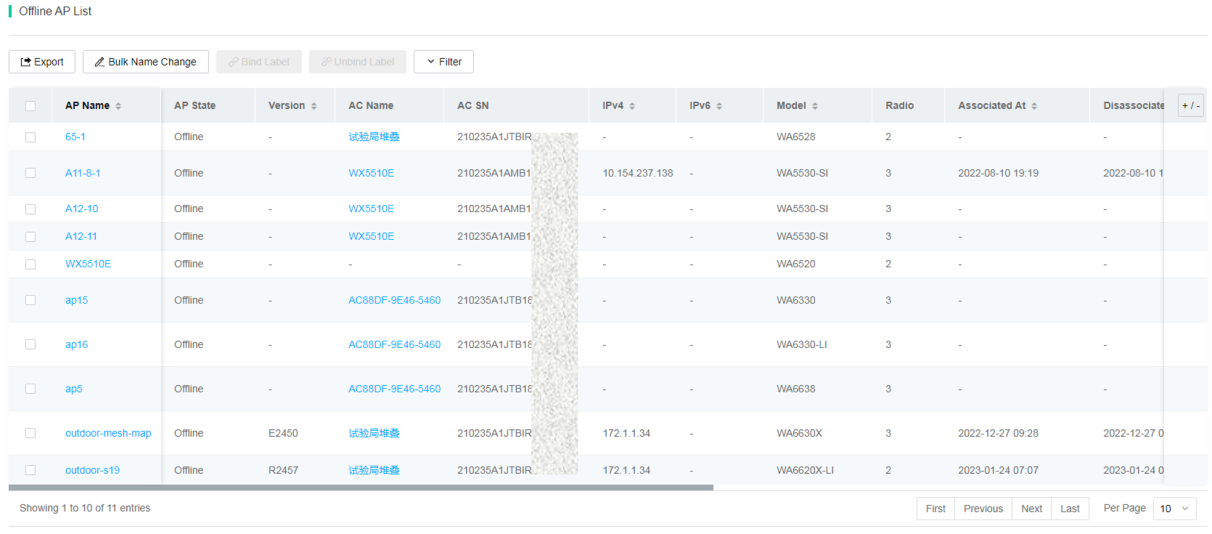
To identify zombie APs, click Offline on the APs tab. On the Offline AP List, if the Last Disassoc Reason filed displays Never associated with AC, the AP is a zombie AP.
Figure 22 Identifying a zombie AP
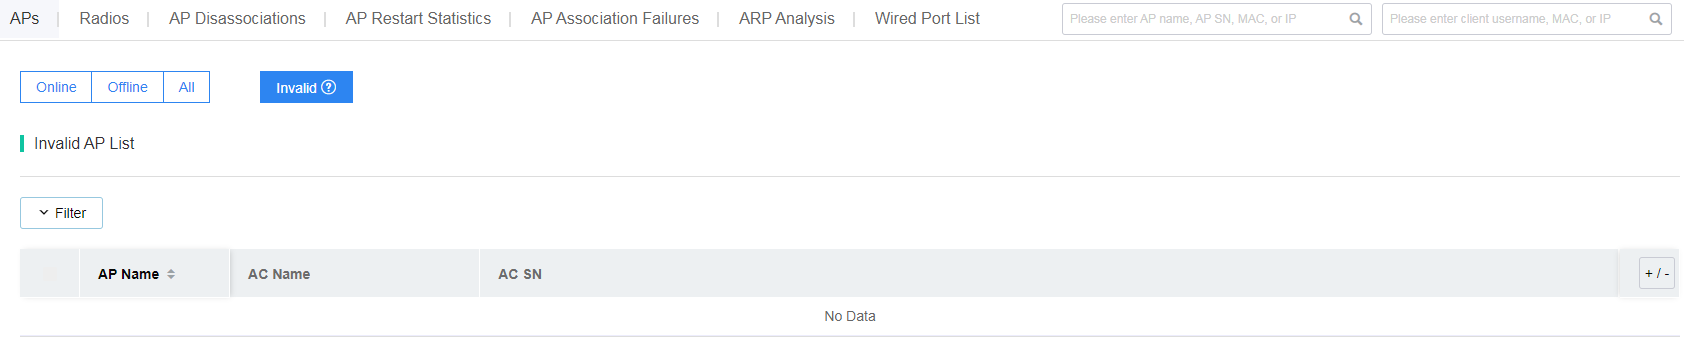
Identify invalid APs
Invalid APs are APs of which the serial number cannot be obtained correctly.
To identify invalid APs, click Invalid on the APs tab and view the Invalid AP List.
Figure 23 Identifying invalid APs
Fast view issue analysis summary
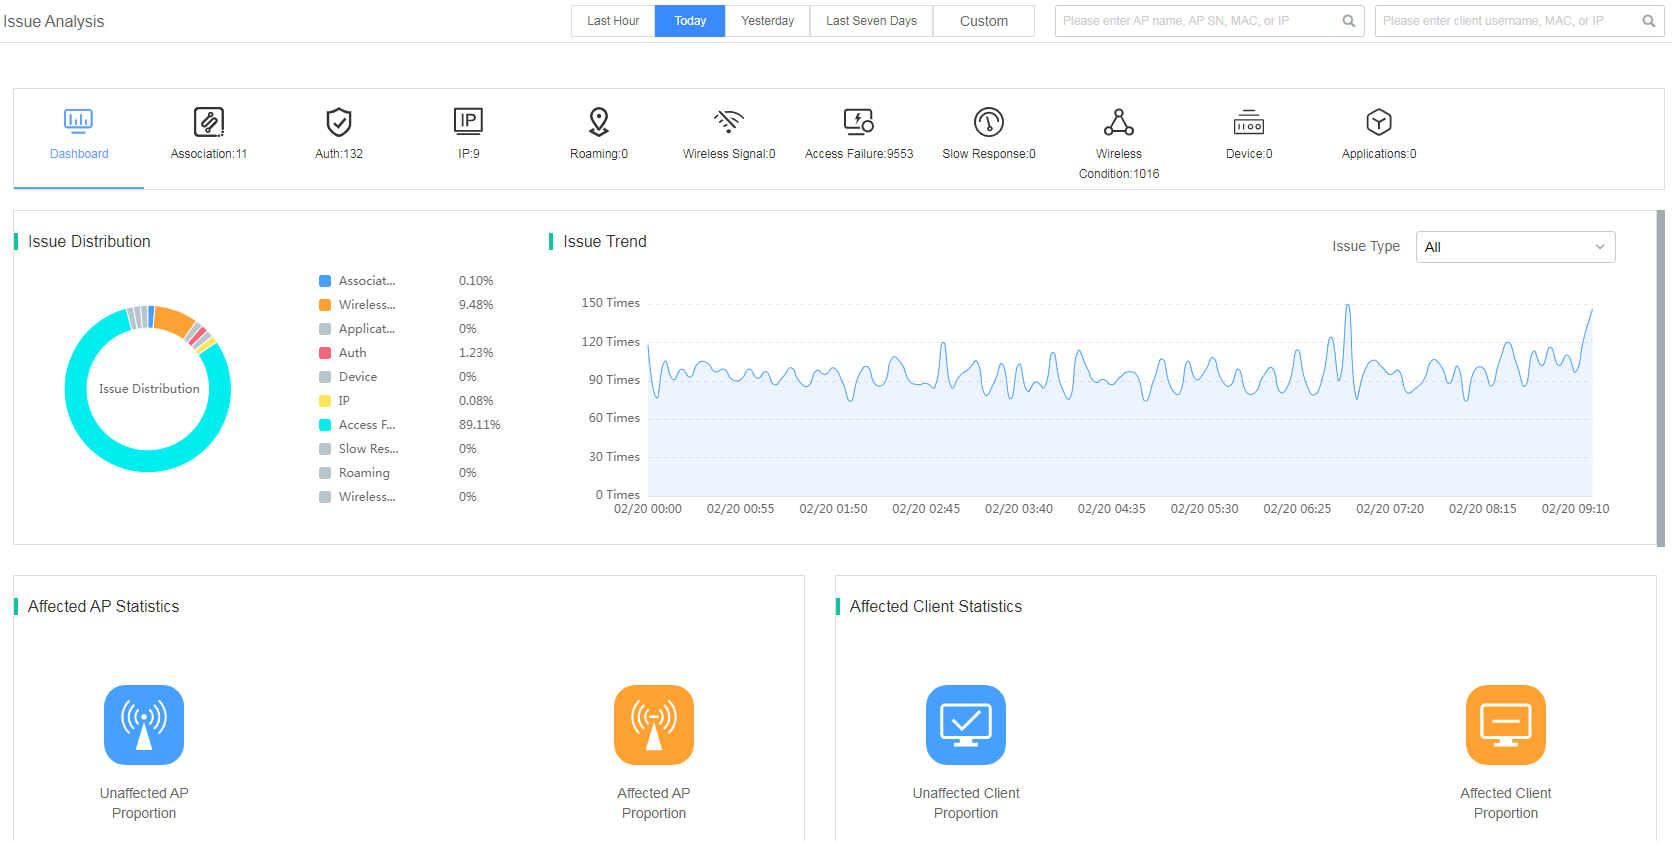
Issue analysis displays issues of devices in the selected site and time span from the following perspectives: issue distribution, issue trend, affected AP statistics, affected client statistics, involved APs, and involved clients.
To view issue analysis summary, navigate to Smart O&M > Issues > Issue Analysis.
The bar on the top of the Issue Analysis page summaries the quantity for the following issue types: association, authentication, IP address, roaming, wireless signal, access failure, slow response, wireless condition, and device.
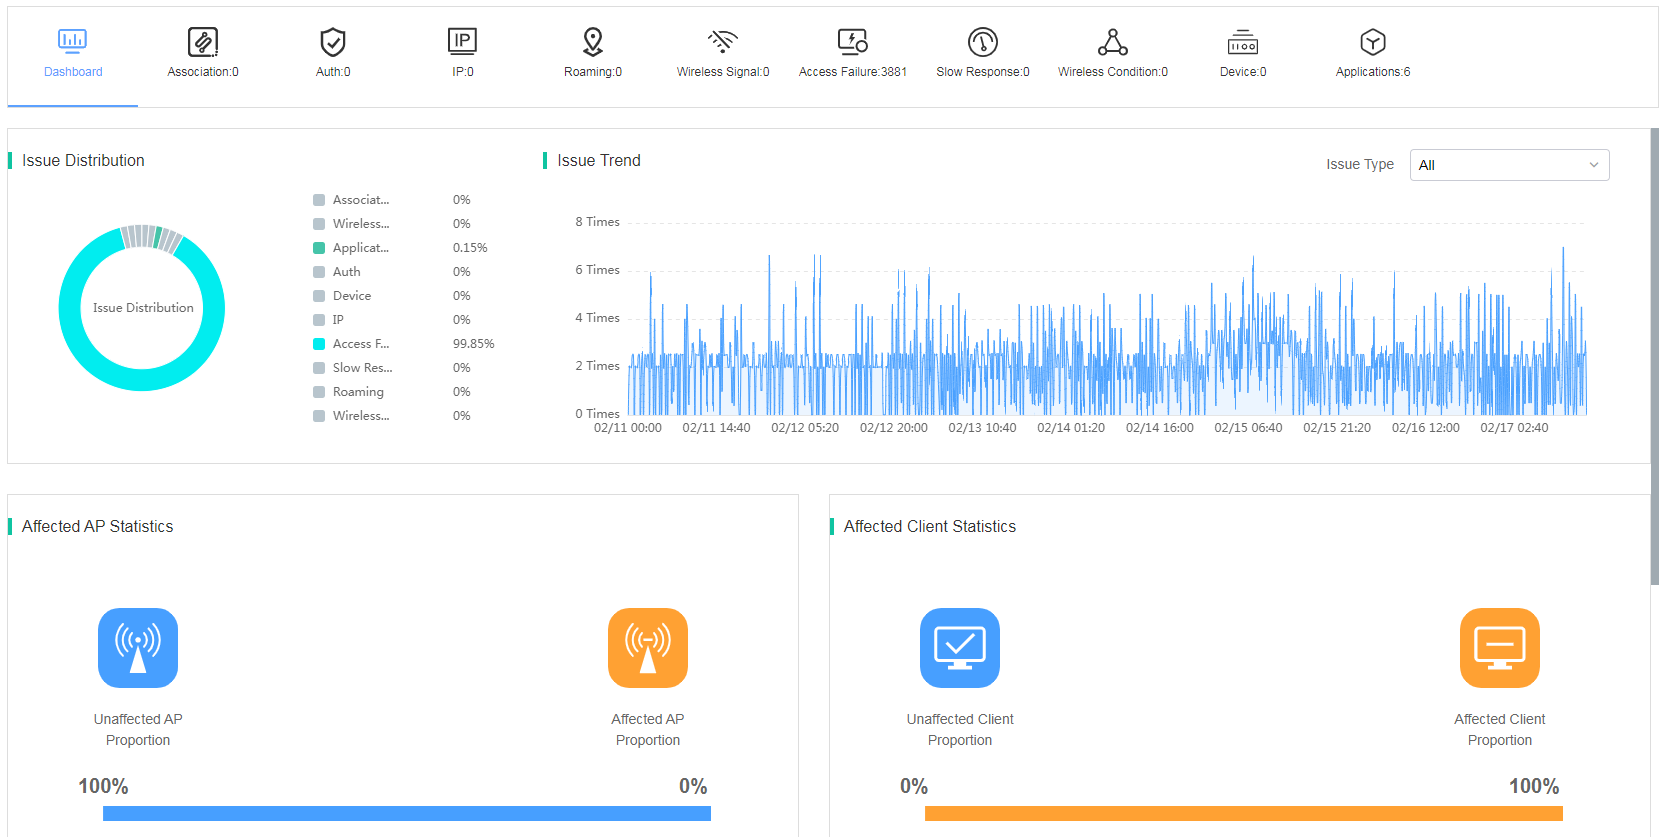
On the Dashboard page, you can view the following information:
· Issue Distribution—Displays issue distribution of specified devices or all devices in the site during the selected time span. Issue types include association, wireless condition, authentication, device, IP address, access failure, slow response, roaming, and wireless signal. To view detailed information about an issue type, click the issue type in the distribution graph.
· Issue Trend—Displays issue trend of specified devices and clients in the site during the selected time span. You can select an issue type to display the corresponding issue trend and the Issue Distribution area will display the corresponding distribution of the subcategories of the selected issue.
· Affected AP Statistics—Displays the proportion of issue-affected APs in the site during the selected time span.
· Affected Client Statistics—Displays the proportion of issue-affected clients in the site during the selected time span.
· Involved APs—Displays the issue-affected AP trend for the specified device in the site during the selected time span.
· Involved Clients—Displays the issue-affected client trend for the specified device in the site during the selected time span.
Figure 24 Viewing issue analysis summary
Fast view issue analysis details
Information about the subcategories of issues is available only if it is supported.
A detected issue can be caused by APs, clients, or poor wireless conditions. The cloud platform reports an issue through an AP report, but this does not indicate that the issue is caused by the AP (or clients associated to the AP). You must identify the root cause of the issue through deep analysis and troubleshooting.
Introduction
The smart O&M system classifies each issue type into multiple subcategories. You can click the corresponding issue type tabs to view the subcategories, influence, root cause analysis and optimization measures, involved APs, involved clients, and row data.
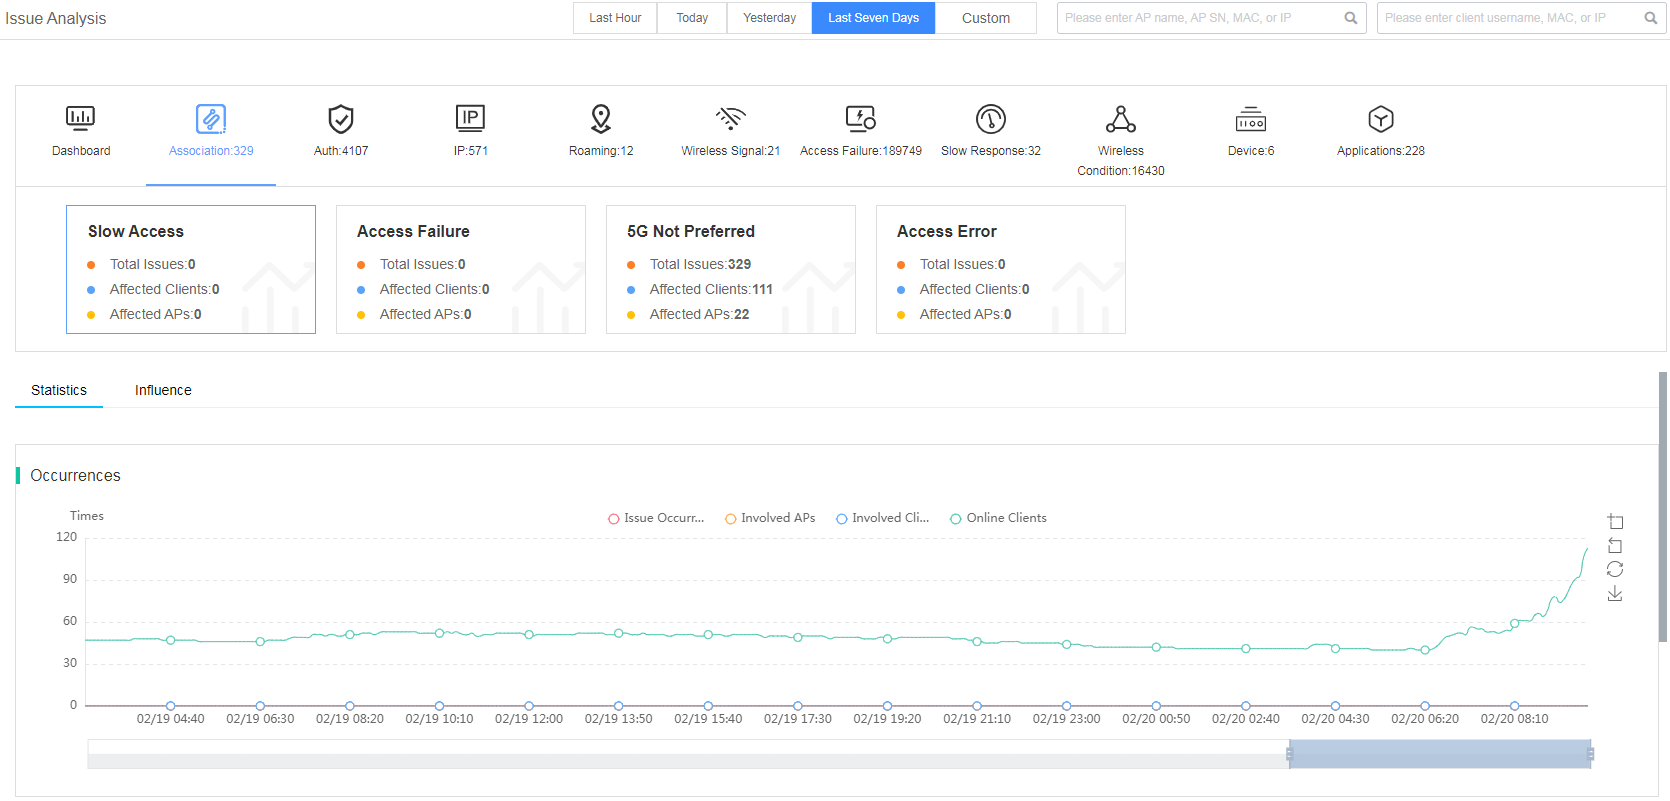
· Statistics—Displays the issue trend graph for a selected issue type.
Figure 25 Statistics
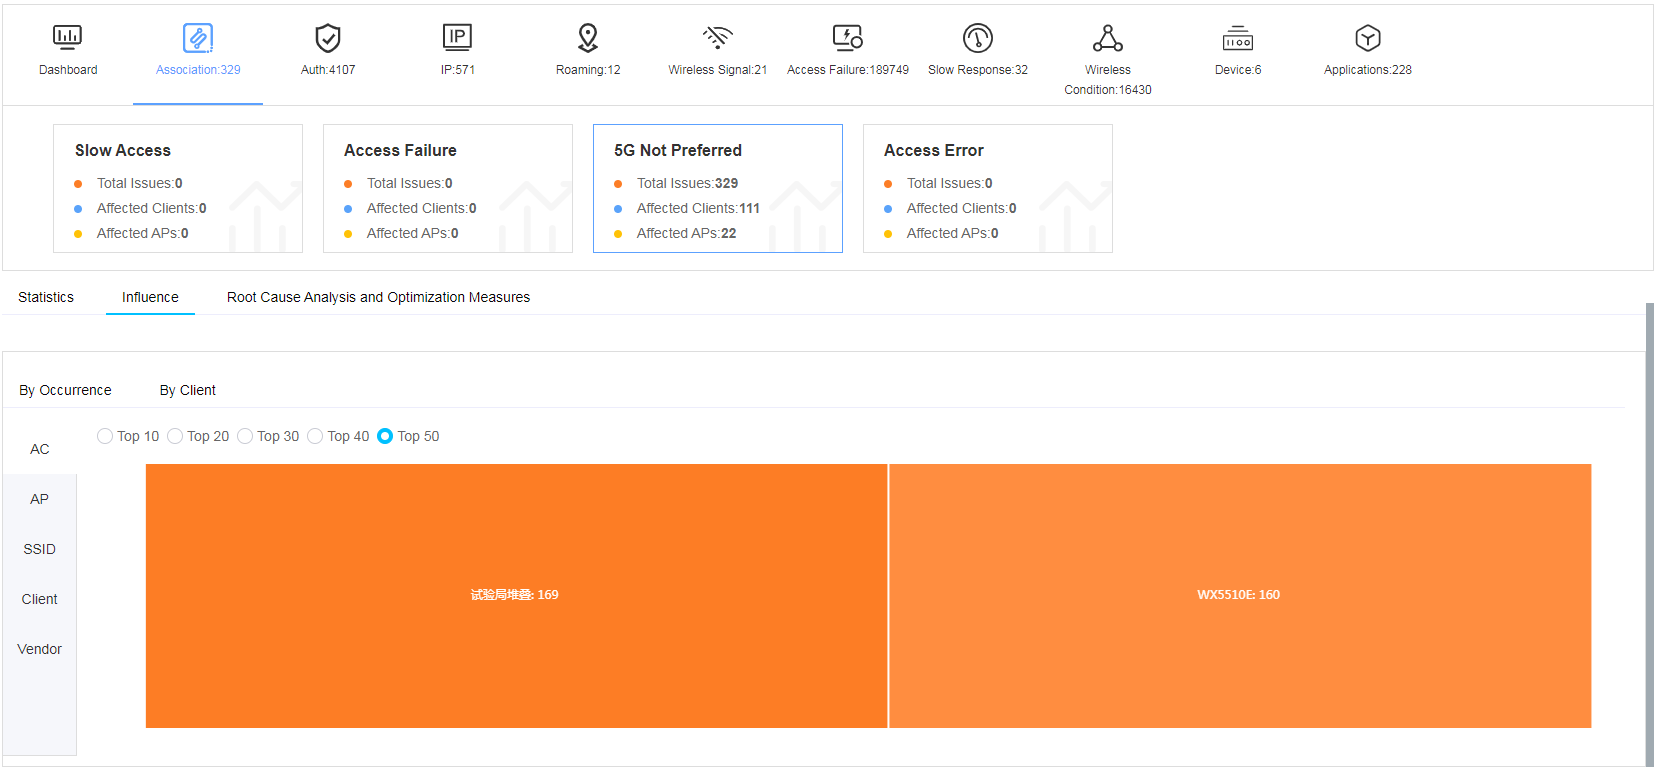
· Influence—Displays Top N statistics by issue occurrence and client. The larger the color segment size, the more issue occurrences or related clients. For example, if you select the By occurrence tab and AP as the statistic collection object, the page will display issue-related APs by color segment and the number of issues for the APs.
Figure 26 Influence
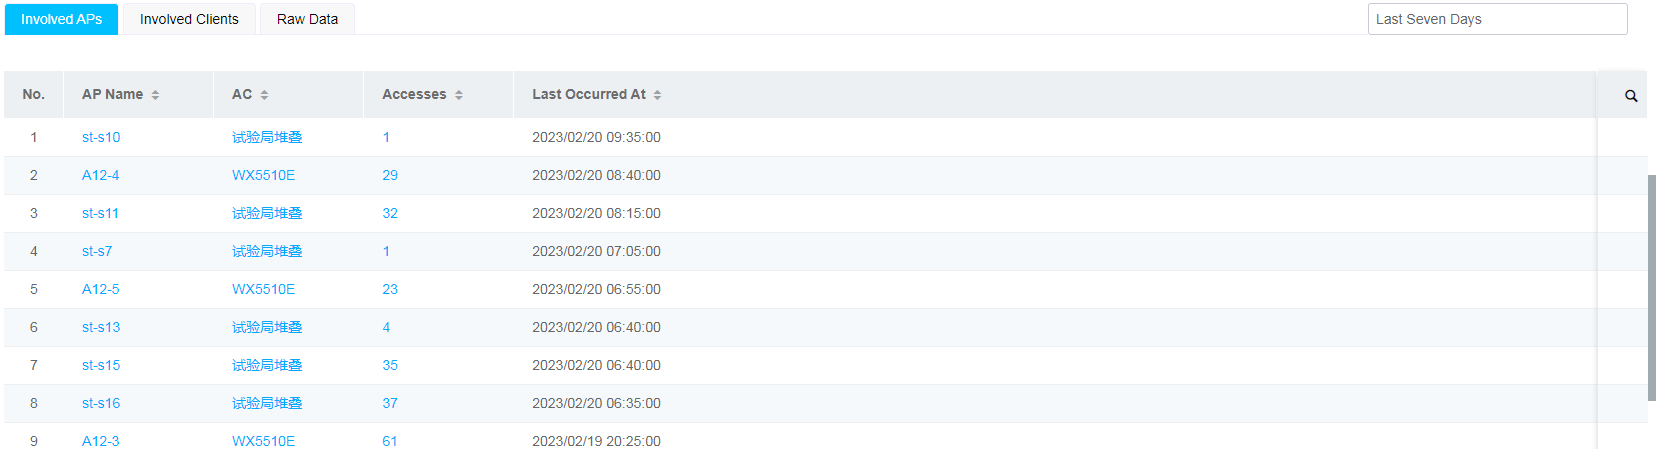
· Issue subcategories—The smart O&M system provides statistics analysis, involved APs, and row data.
Figure 27 Issue details
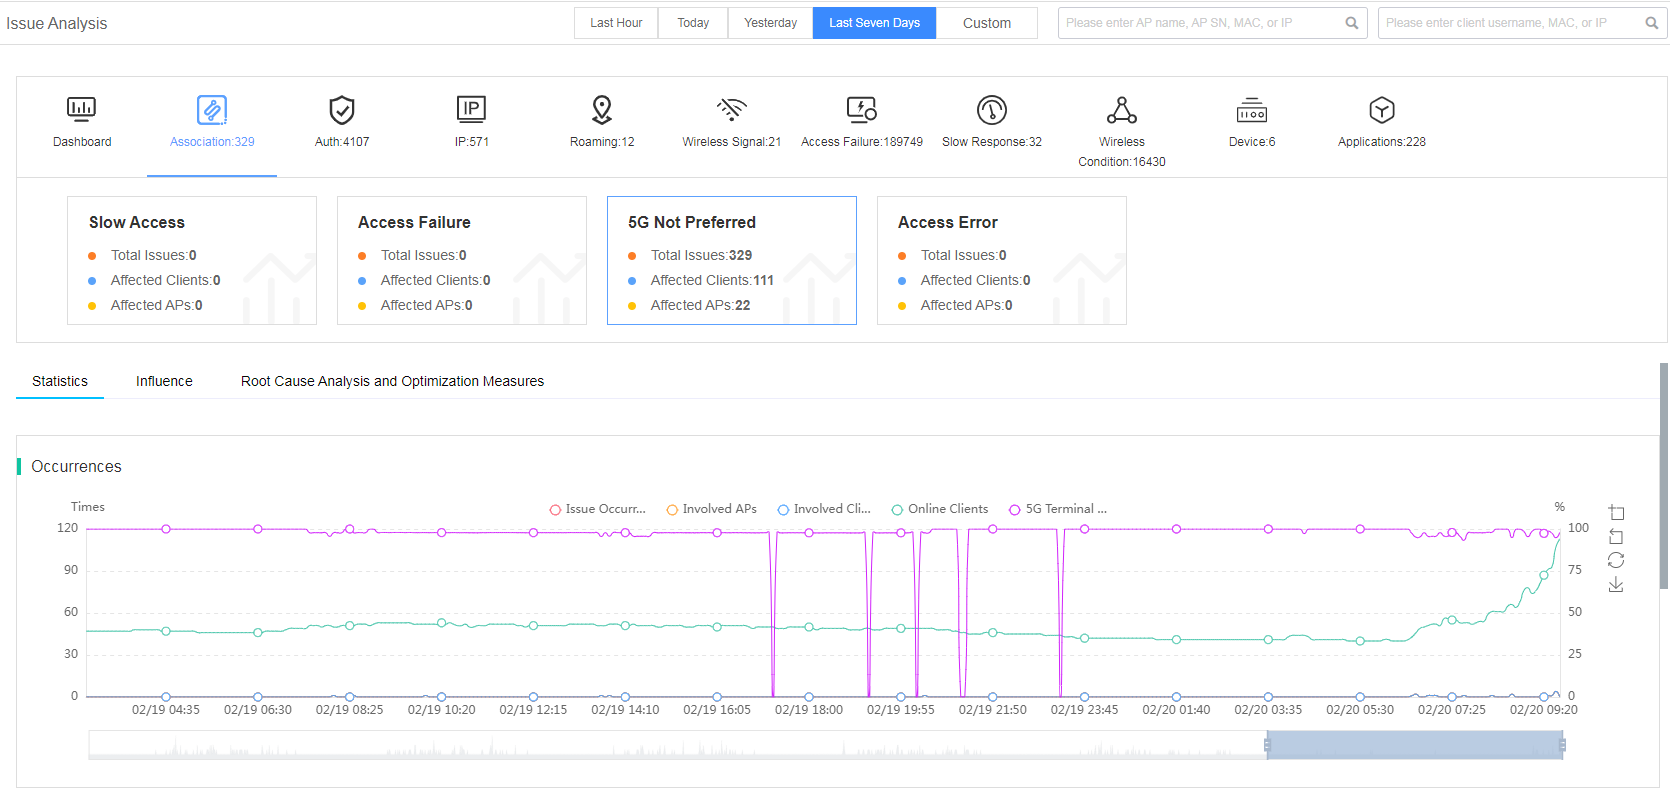
Fast view association issues
The smart O&M system classifies the association issue into subcategories of slow access, access failure, 5G not preferred, and access error.
Figure 28 Viewing association issues
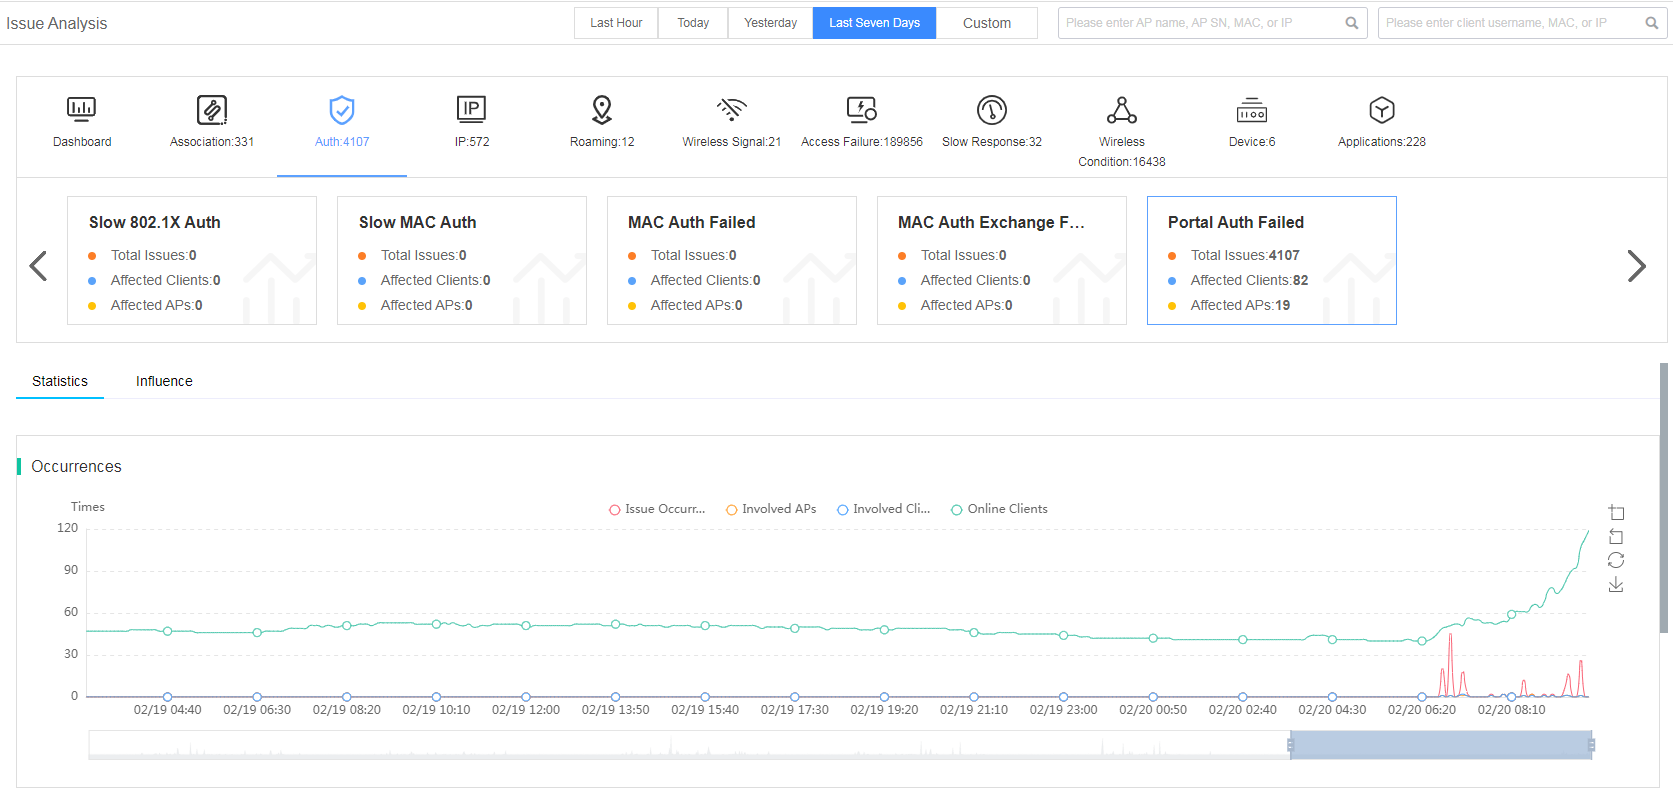
Fast view authentication issues
The smart O&M system classifies the authentication issue into subcategories of 802.1X authentication failure, 802.1X packet exchange failure, slow 802.1X authentication, slow MAC authentication, MAC authentication failure, MAC packet exchange failure, and portal authentication failure.
Figure 29 Viewing authentication issues
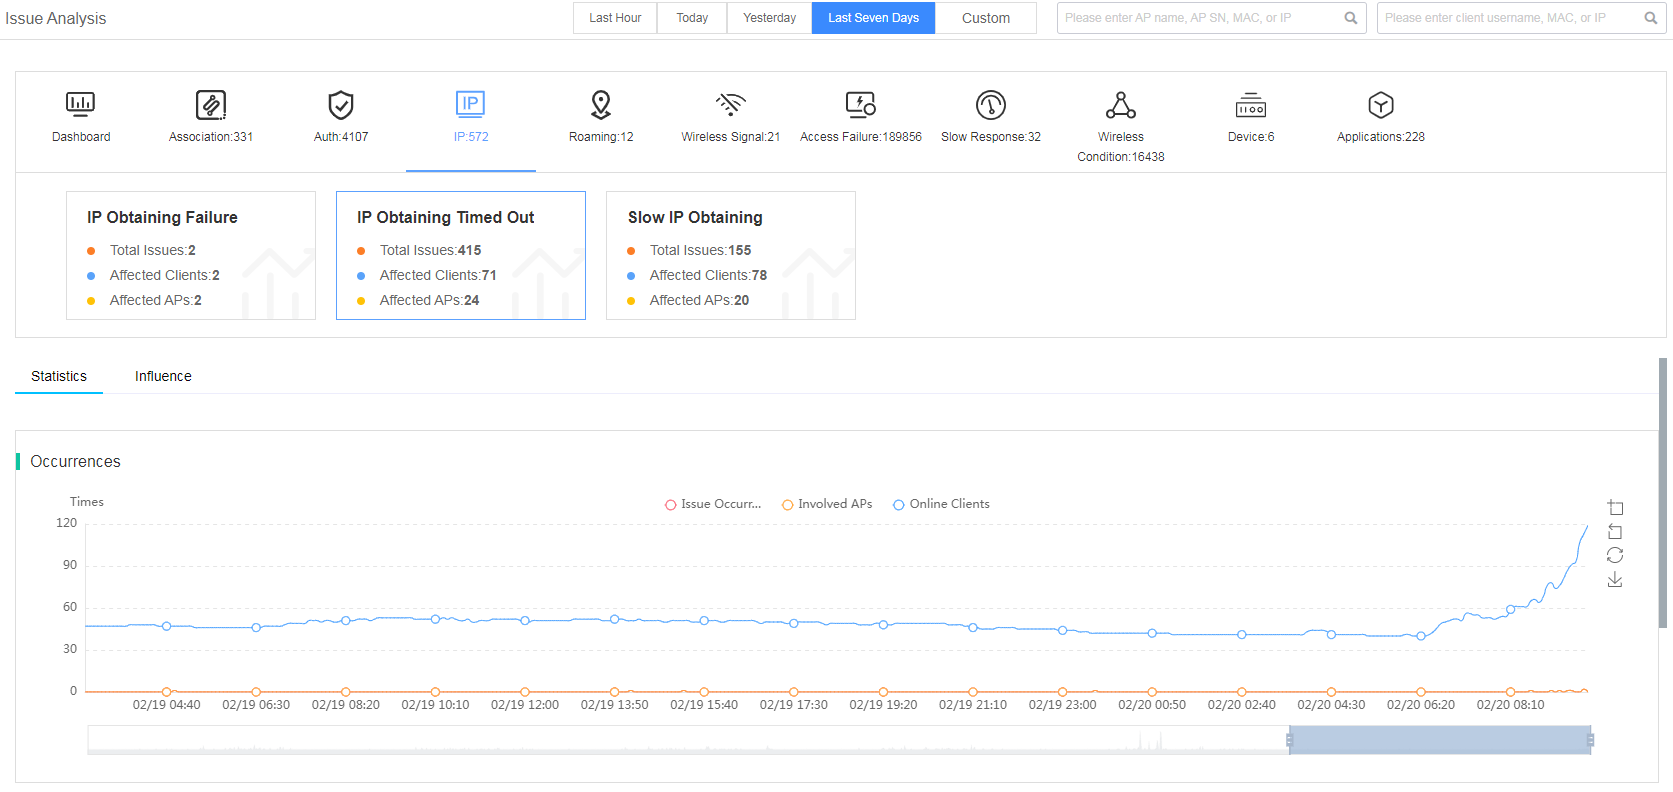
Fast view client IP address issues
The smart O&M system classifies the client IP address issue into subcategories of IP obtaining failure, IP obtaining timeout, and slow IP obtaining.
|
|
NOTE: Before using the feature, you must enable deep analysis on the AC by executing the wlan client inspect enable command in AP view or AP group view. |
Figure 30 Viewing client IP address issues
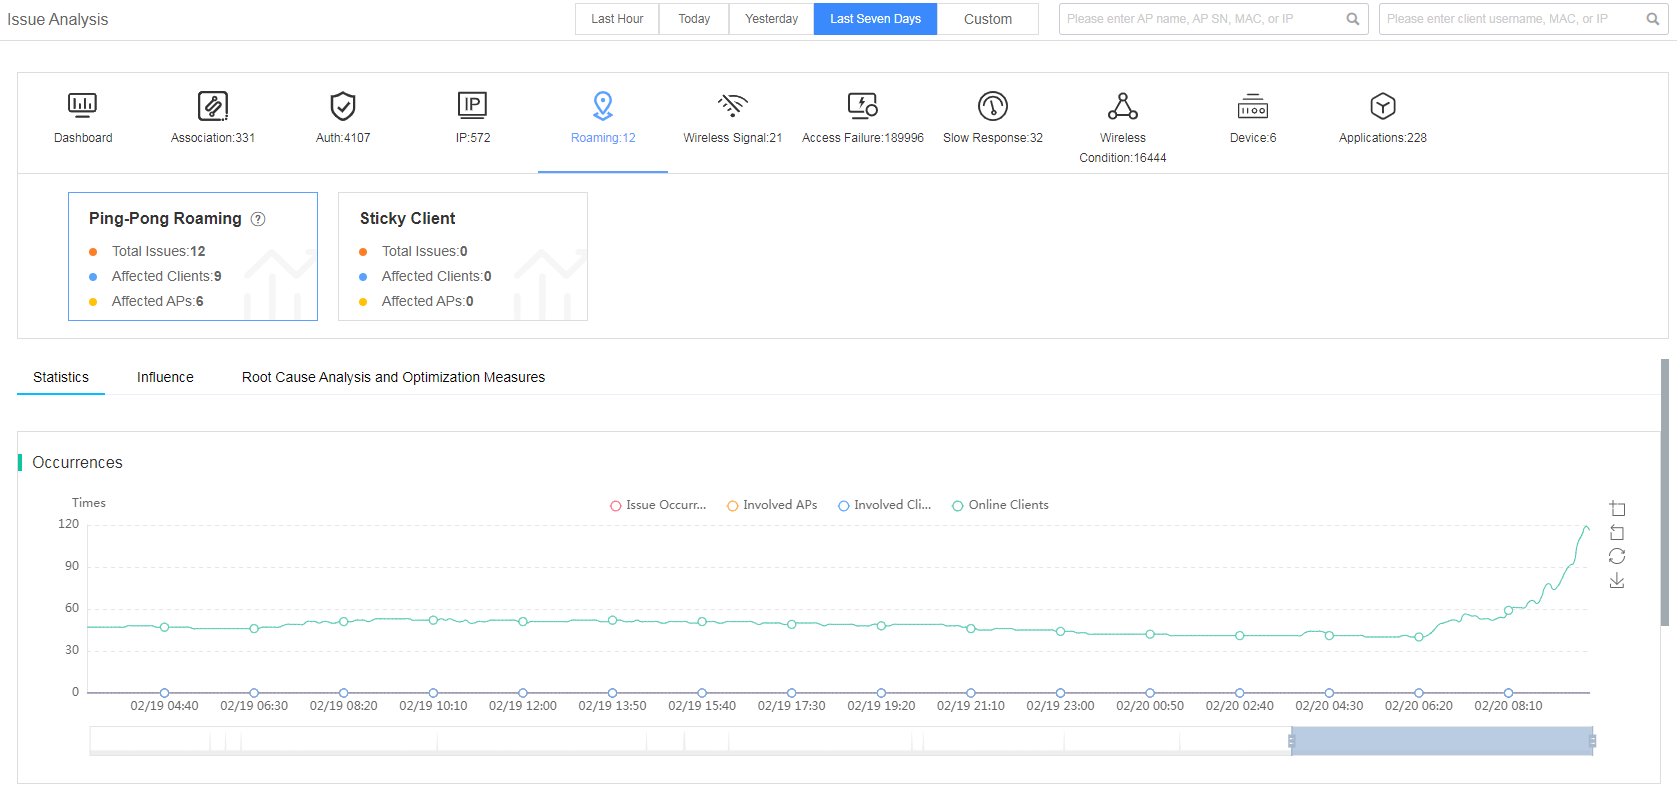
Fast view client roaming issues
The smart O&M system classifies the client roaming issue into subcategories of ping-pong roaming and sticky client.
Figure 31 Viewing client roaming issues
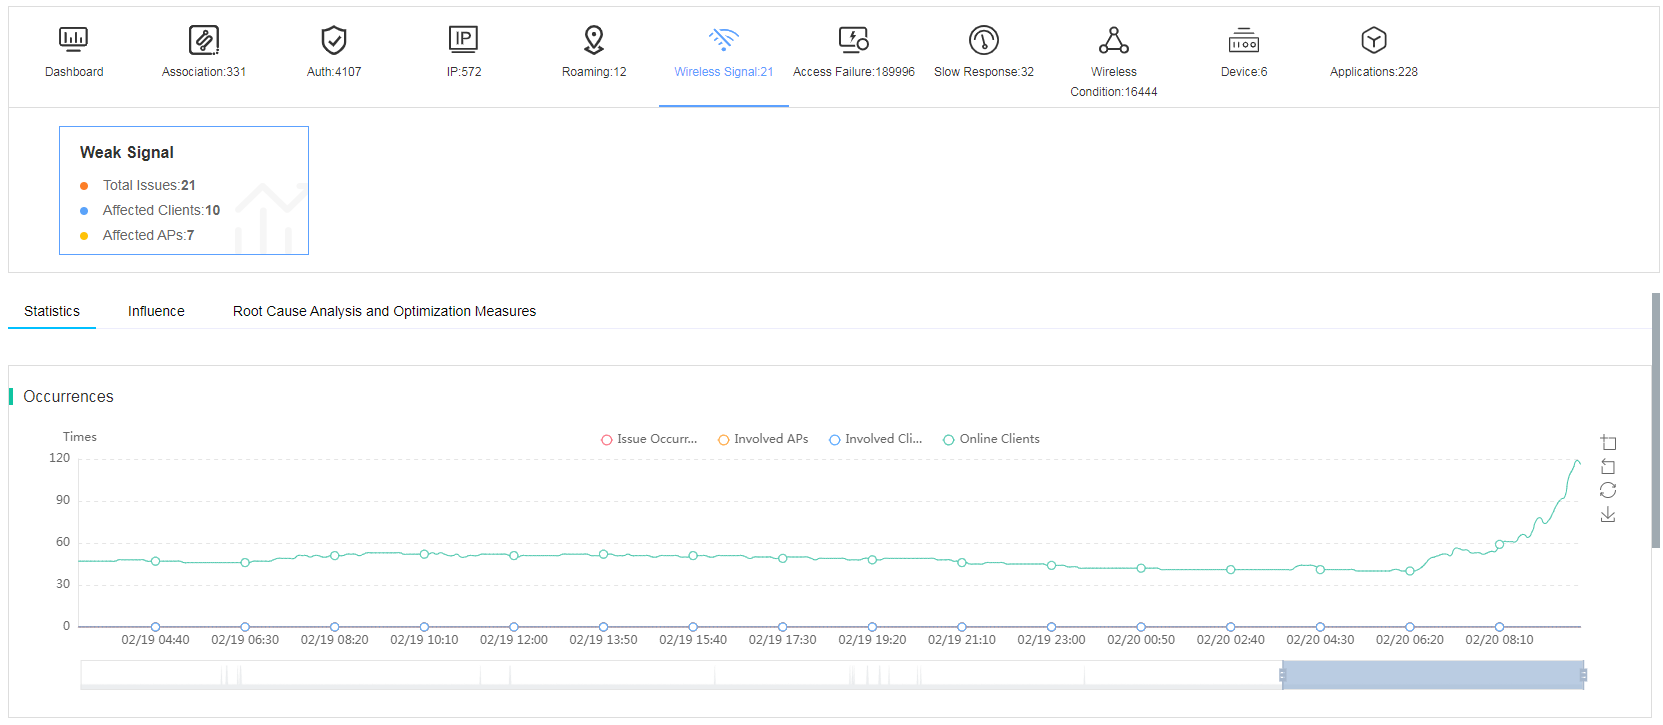
Fast view wireless signal issues
The smart O&M system allows you to view weak signal issue statistics from the following perspectives:
· AP—Weak regional signal might indicate that APs are distributed unevenly. Additional AP installations are required.
· Client—Clients are located in weak signal regions where barriers might exist. Field inspection and additional AP installations are required.
Figure 32 Viewing wireless signal issues
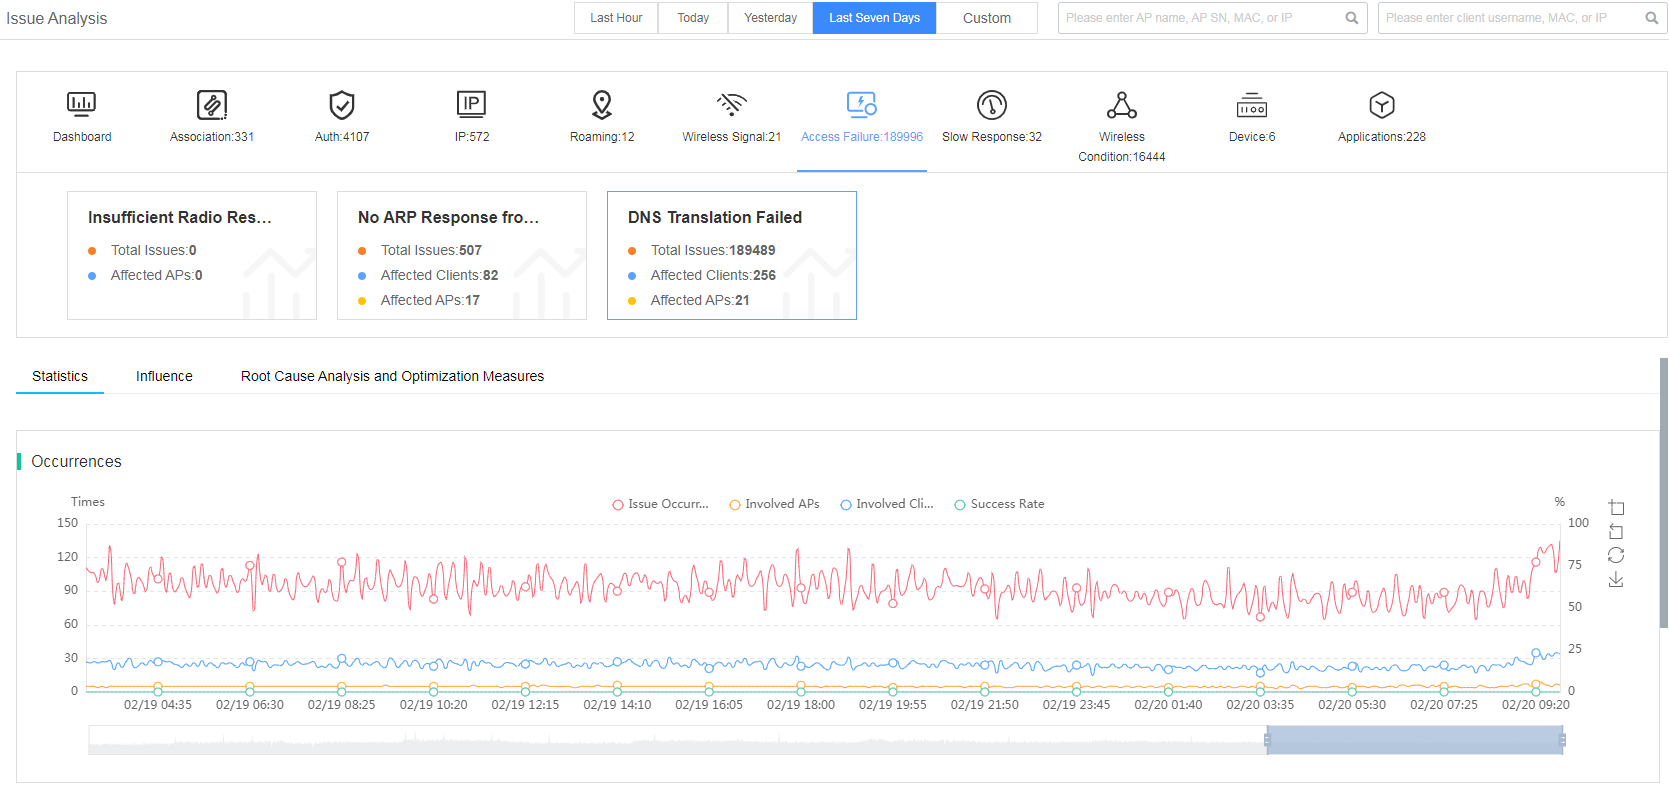
Fast view access failure issues
The smart O&M system classifies the access failure issue into subcategories of insufficient radio resources, no ARP response from gateway, and DNS translation failure.
Figure 33 Viewing access failure issues
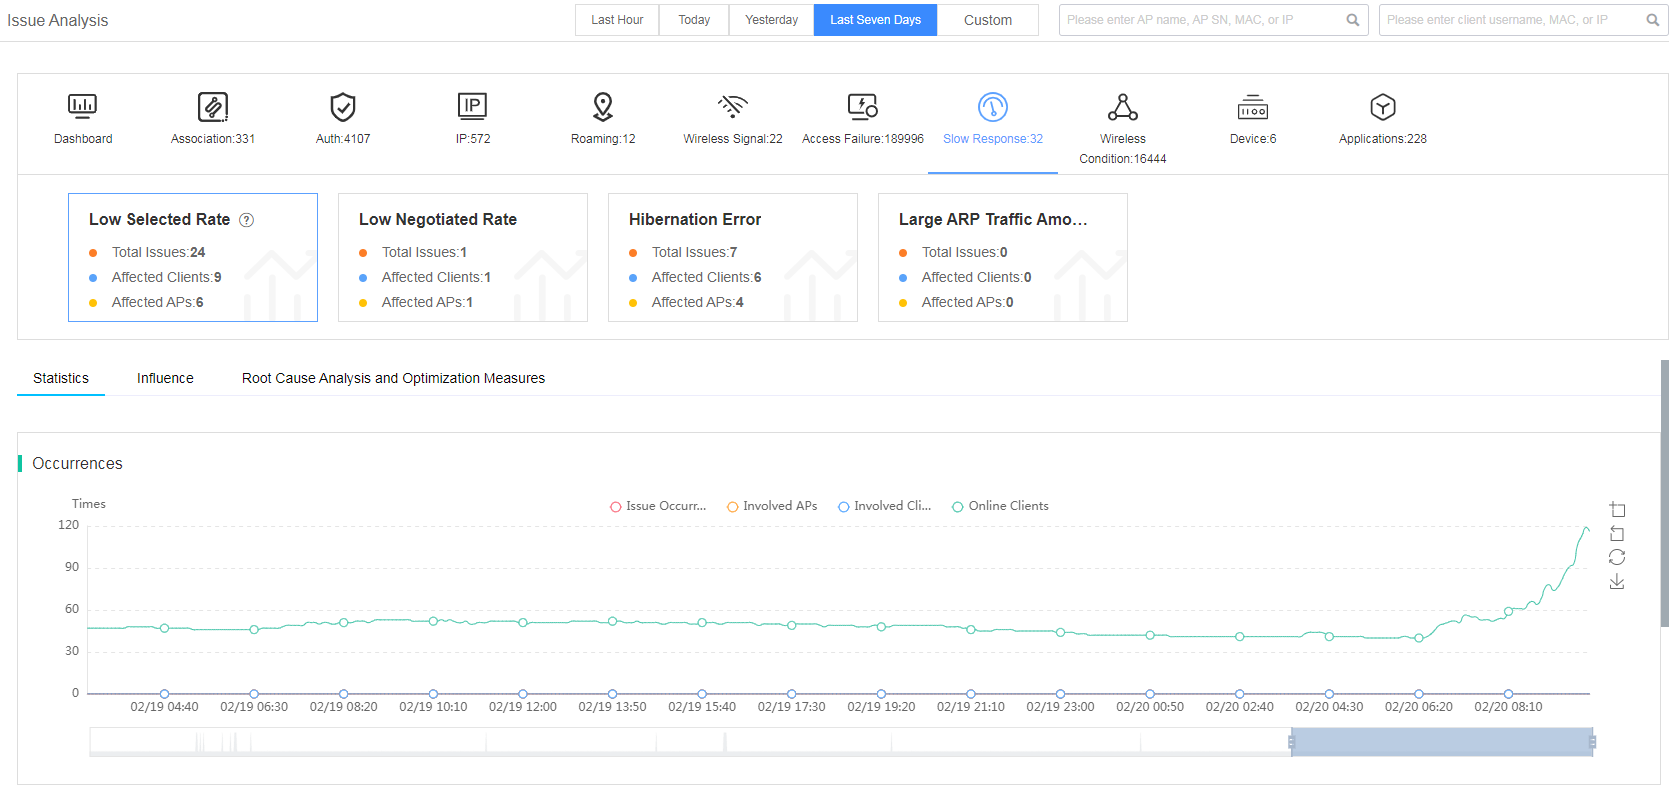
Fast view slow response issues
The smart O&M system classifies the slow response issue into subcategories of low selected rate, low negotiated rate, hibernation error, and large ARP traffic amount.
Figure 34 Viewing slow response issues
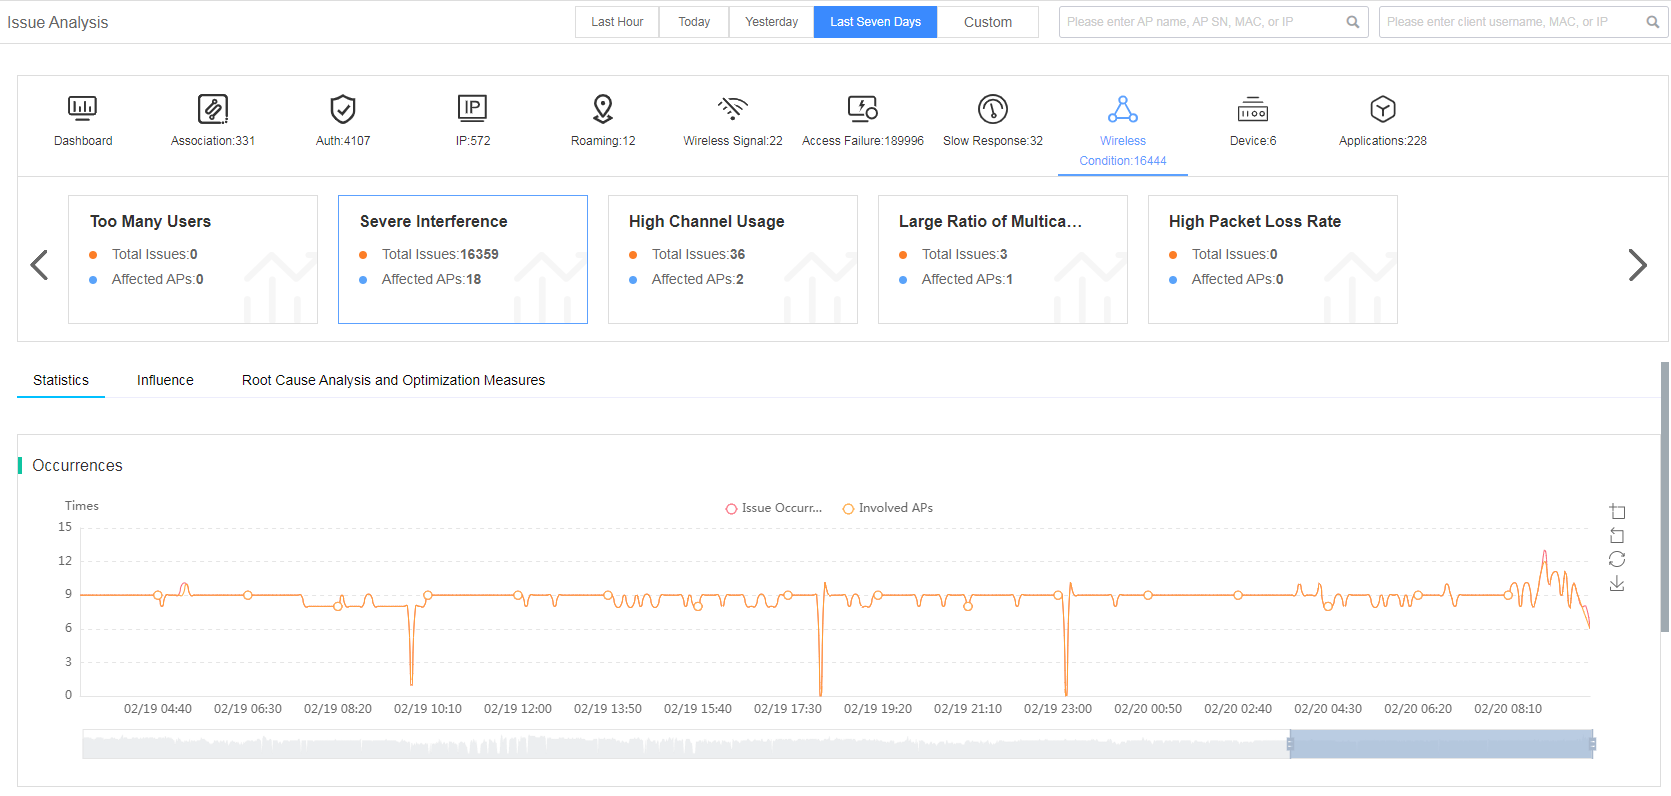
Fast view wireless condition issues
The smart O&M system classifies the wireless condition issue into subcategories of too many users, severe interference, high channel usage, high ratio of broadcast and multicast, high packet loss rate, and high retransmission rate.
Figure 35 Viewing wireless condition issues
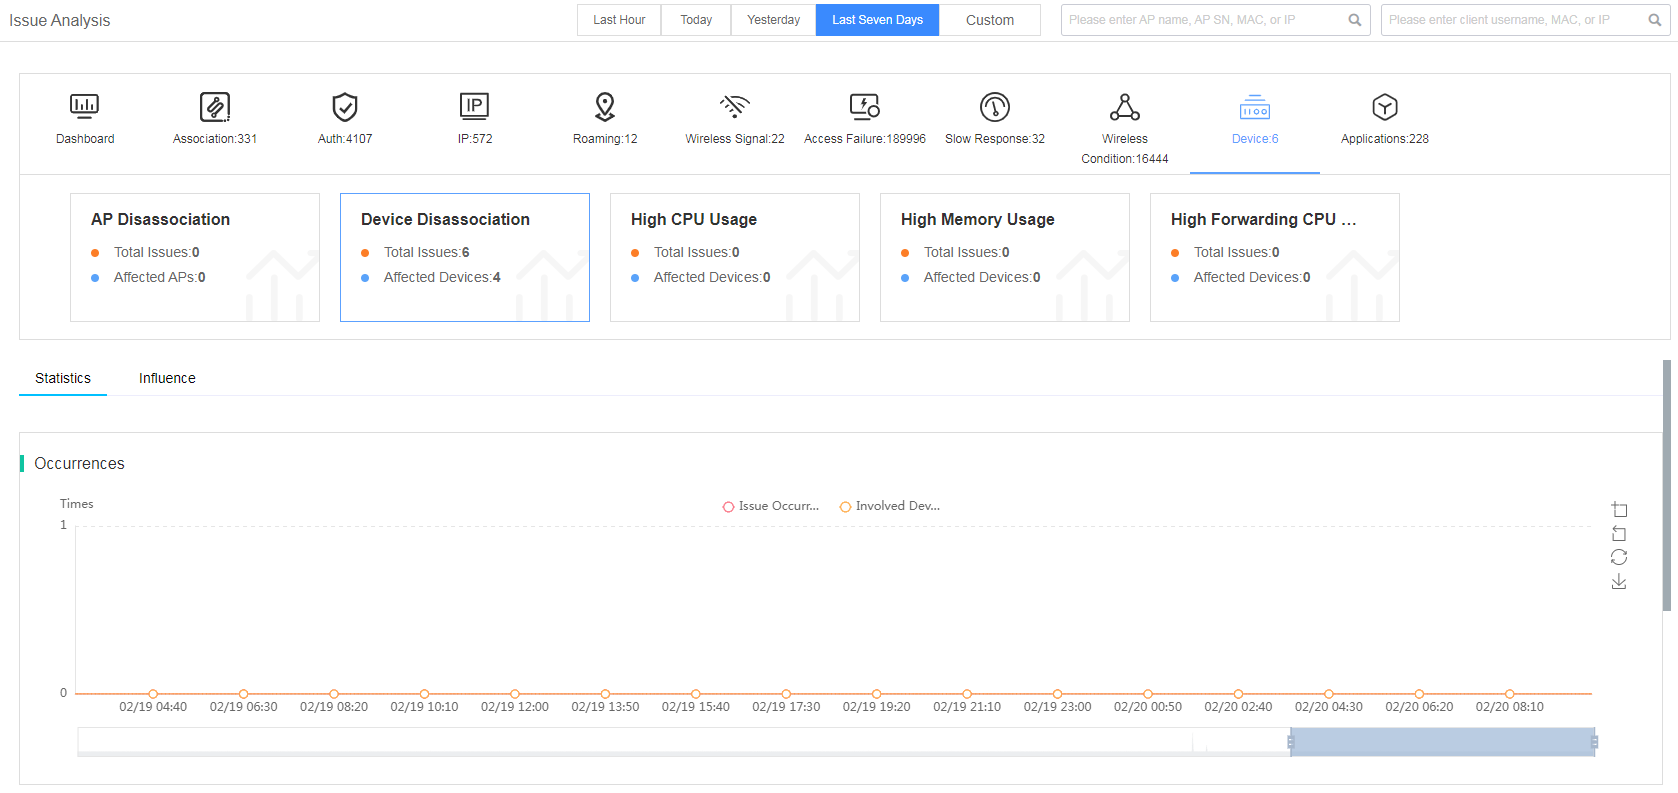
Fast view device issues
The smart O&M system classifies the device issue into subcategories of AP disassociation, device disassociation, high CPU usage, high memory usage, and high forwarding CPU usage.
Figure 36 Viewing device issues
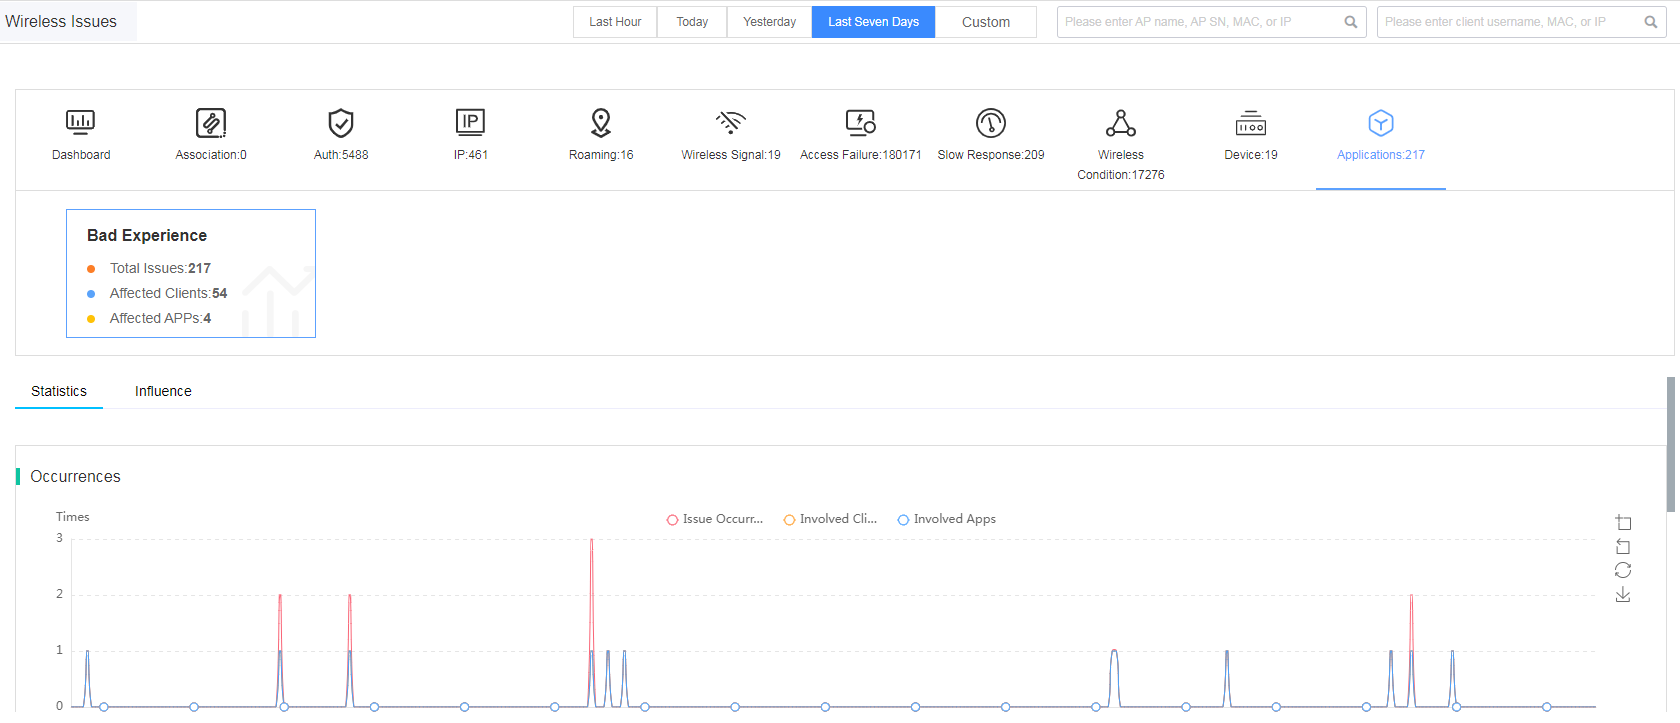
Fast view application issues
The smart O&M system can detect poor application experience issue and count the total number of the issue.
Figure 37 Viewing applications issues
Typical examples
Portal authentication anomaly
Symptom
The administrator discovers that a large amount of portal authentication failure statistics exist in the network through issue analysis.
Analysis
1. Access the Smart O&M > Issues > Issue Analysis page and click the Auth tab. Click the Portal Auth Failed tile and in the Involved Clients list, check the client that has the most authentication failures. If the MAC address for the client is 0000-0000-0000, the client traffic is suspected to be abnormal traffic.
2. Click the occurrence link for the client of which the MAC address is 0000-0000-0000 to view the detailed information. If the client is not associated to an AP and its SSID information is empty, the client traffic is not generated from the network.
Solution
The administrator uses on-site troubleshooting to find out that the traffic is sent by testers to the office network.
Features
Unless otherwise specified, statistics in this section vary by the selected site, devices, and time.
Network visibility
The smart O&M system monitors device performance and network operation status in real time, locates issues quickly, and provides statistics by using graphs. Network visibility enables users to obtain a large scale of data ranged from network summary statistics to client detail statistics. The abundant statistics provide a solid foundation for smart O&M.
Summary
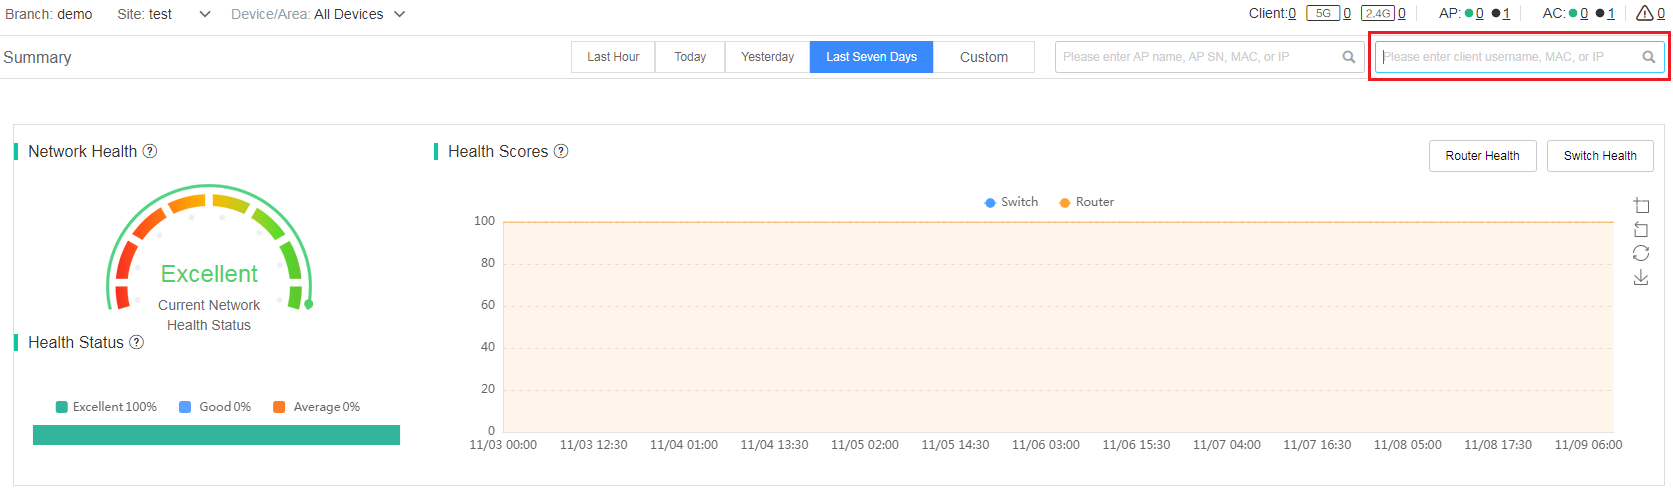
To view summary information, navigate to Smart O&M > Dashboard > Summary. The page that opens displays the summary information of the network, including network health, network issues, alarm information, device status, and client information. To view device-based or site-based summary information, use the filtering feature. To view time-based summary information, select or specify a time span.
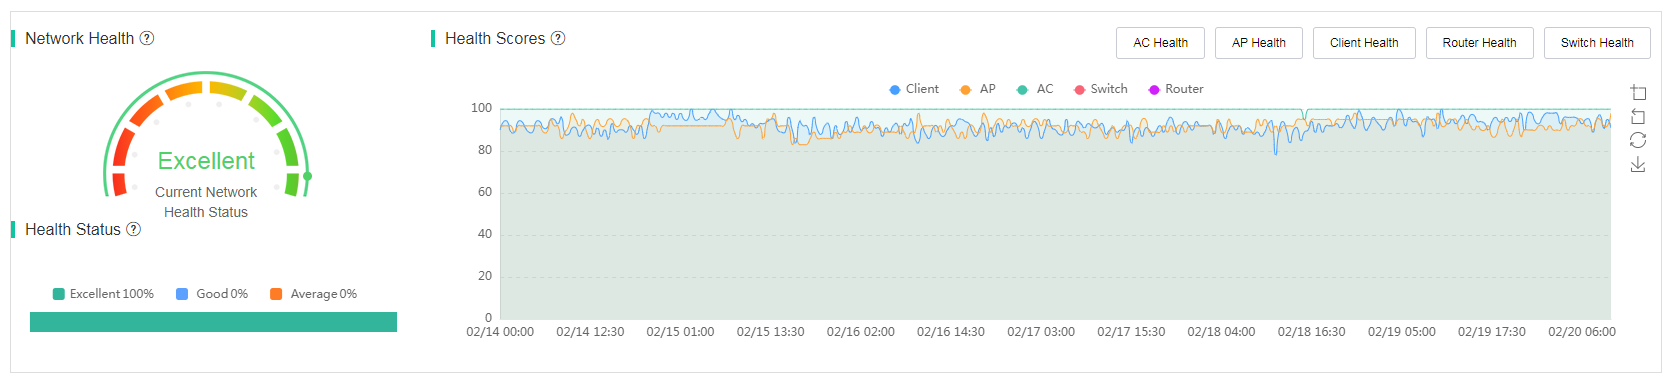
Health
· Network Health—Displays the current network health status by analyzing the health scores of all devices in the site.
· Health Status—Displays the proportion of excellent, good, and average status of the network in the selected time span.
· Health Scores—Displays health scores for all or the specified devices in the site during the selected time span. To hide or display the health score trend of a device type, click the legend of the device type.
¡ AC Health—To view AC health statistics, click AC Health. The AC health is scored based on CPU usage and traffic statistics.
¡ AP Health—To view AP health statistics, click AP Health. The AP health is scored based on channel usage, the number of clients, and client RSSI.
¡ Client Health—To view AP health statistics, click AP Client. The client health is scored based on channel usage, RSSI, and roaming frequency.
Figure 38 Health statistics
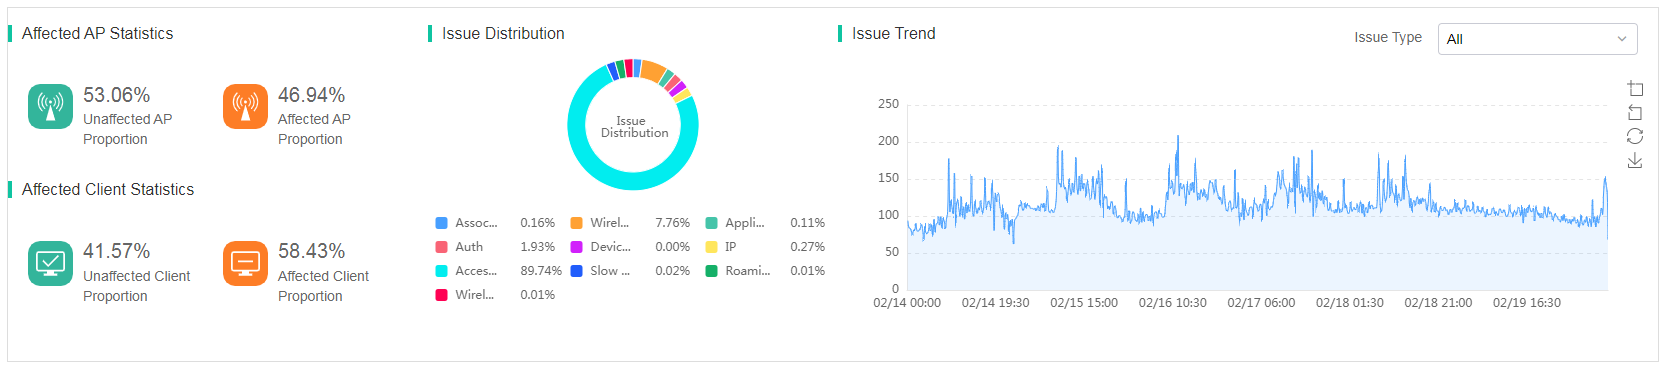
Issue statistics
· Affected AP Statistics—Displays the proportion of affected APs and the proportion of unaffected APs in the site during the selected time span.
· Affected Client Statistics—Displays the proportion of affected clients and the proportion of unaffected clients in the site during the selected time span.
· Issue Distribution—Displays all issues occurred on specified devices or all devices in the site during the selected time range. Issue types include association, wireless condition, authentication, device, IP address, access failure, slow response, roaming, and wireless signal.
To view detailed information about an issue type, click the issue type in the distribution graph.
· Issue Trend—Displays the trend of issues in the site during the selected time span. You can select an issue type to display the corresponding issue trend and the Issue Distribution area will display the corresponding distribution of the selected issue subcategories.
Figure 39 Issue statistics
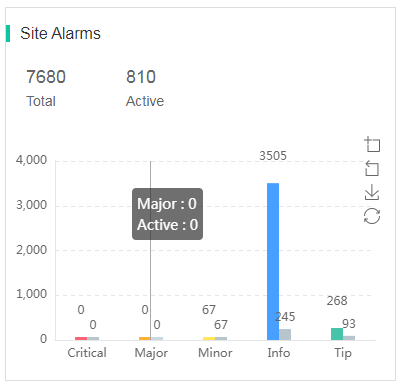
Site alarms
The Site Alarms area displays the total number of alarms and the number of alarms that are not removed. The area uses a bar chart to display the number of alarms in different severity levels and the number of unremoved alarms. To view the alarm details, click a specific bar in the bar chart.
Figure 40 Site alarms
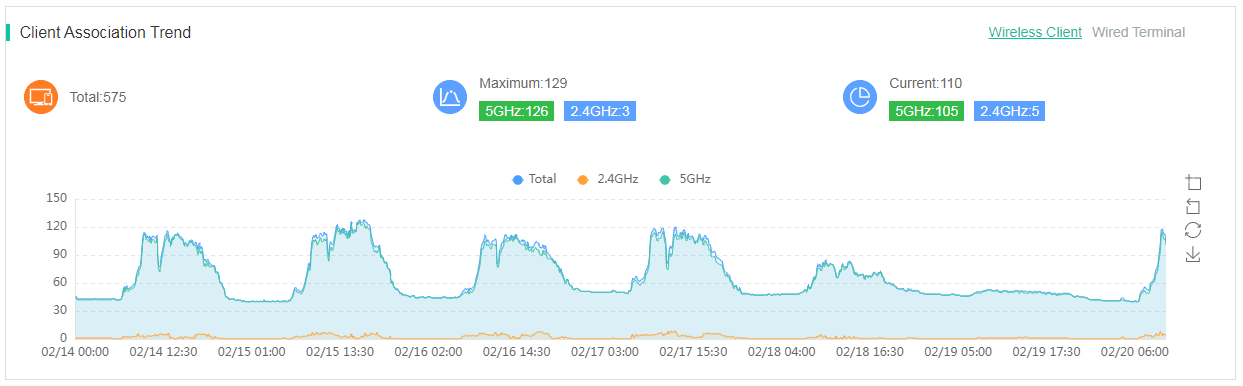
Client association trend
The Client Association Trend area displays wired and wireless client association trends. To view the number of total clients, maximum clients, and current clients for wireless clients, click Wireless Client. To hide or display a trend line, click the legend for the line above the graph.
Figure 41 Client association trend
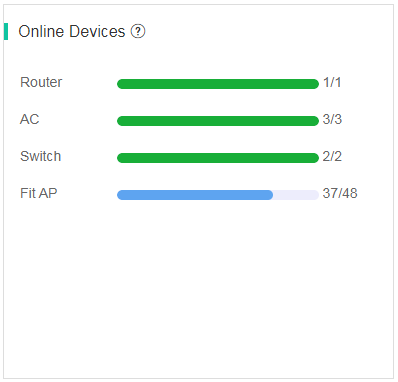
Online devices
The Online Devices area displays the number of online devices and total number of devices by device type. If you select all devices, the system displays the number of online devices and the number of all devices. If you select only one AC, the system displays only the AC online status, the number of online APs, and the number of total APs associated with the AC.
Figure 42 Online devices
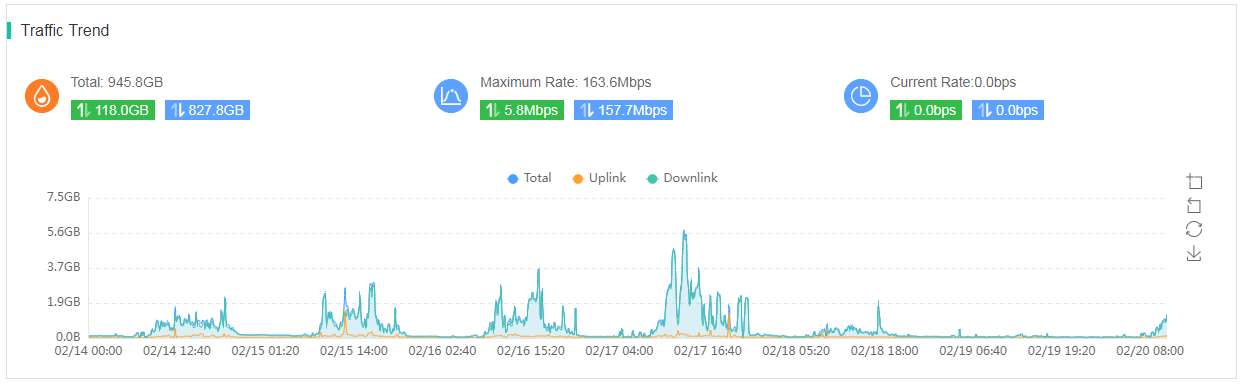
Traffic trend
The Traffic Trend area displays the uplink and downlink traffic data for wireless clients. You can view the total traffic, maximum rate, and current rate in the selected time span. To hide or display a trend line, click the legend for the line above the graph.
Figure 43 Traffic trend
Connectivity snapshots
The connecting snapshots feature allows users to view operation status of online clients, online radios, and online APs connected to the specified device in real time.
To view connecting snapshots, navigate to the Dashboard > Connecting page.
Connection statistics snapshots are color coded to indicate the indicator status:
· Red—Poor.
· Orange—Fair.
· Blue—Good.
· Green—Excellent.
· Gray—No data available.
To view detailed information, click the corresponding color segment.
Client statistics snapshots
The Client area displays statistics of client types and client details.
· Client type statistics
Client type statistics display real-time client type distribution by total client, 5 GHz client, and 2.4 GHz client and classifies these clients by client mode and operation bandwidth. You can directly view low-rate clients in the network.
Figure 44 Client type distribution
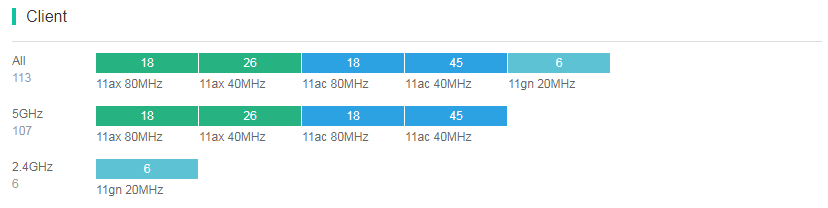
Table 1 Operation mode and bandwidth mode
|
Item |
Value |
|
Client mode |
· 802.11a · 802.11b · 802.11g · 802.11an · 802.11gn · 802.11ac · 802.11gac · 802.11ax · 802.11gax |
|
Operation bandwidth |
· 20 MHz · 40 MHz · 80 MHz · 160 MHz |
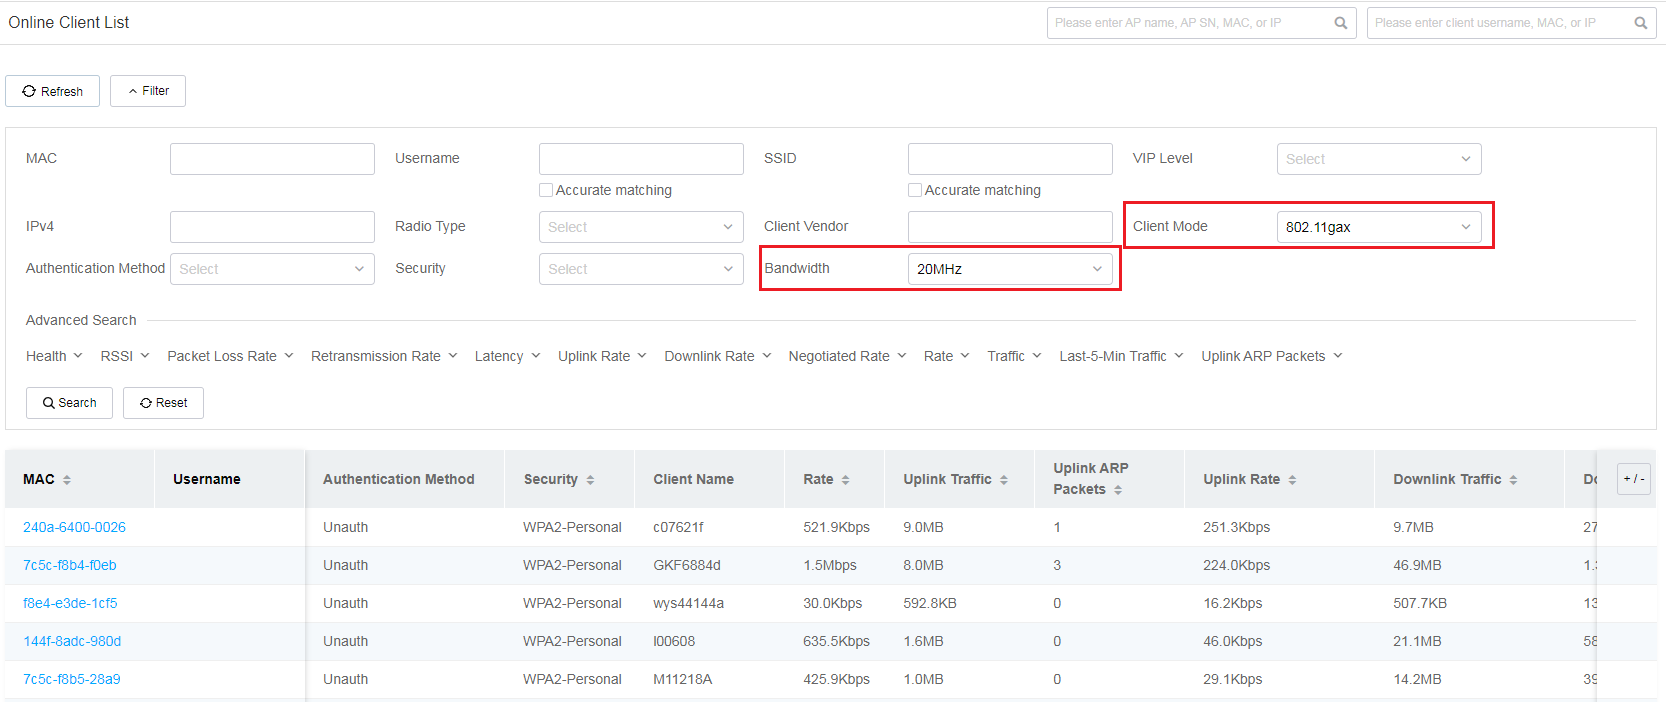
· Filtering by client type
To view filtered client information with a certain client mode and bandwidth, click the corresponding color segment to navigate to the Online Client List page. For example, you can click the 11gax 20MHz segment for All to navigate to the Online Client List page. On the page that opens, the system fills the Client Mode field with 802.11gax and the Bandwidth field with 20 MHz automatically in the Filter section and the list displays the corresponding client information after filtering.
Figure 45 Filtered clients
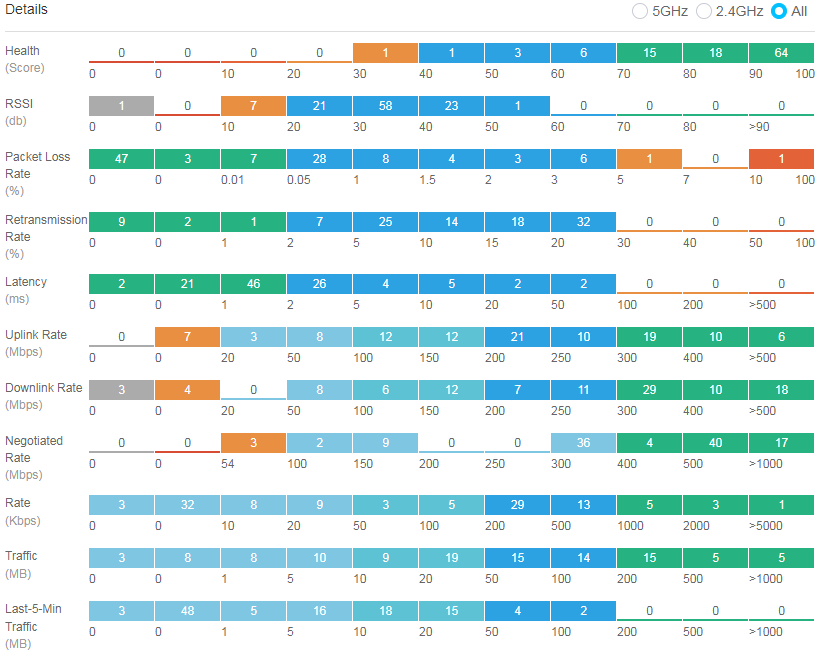
· Client details statistics
The client details chart displays information about 5 GHz, 2.4 GHz, and all online client operation in the current network in real time from the following perspectives: client health, RSSI, packet loss rate, retransmission rate, latency, downlink speed, uplink speed, negotiated rate, rate, traffic, and traffic in the past 5 minutes. You can identify clients in poor operation status through this chart and perform further observation or processing.
Figure 46 Client details statistics
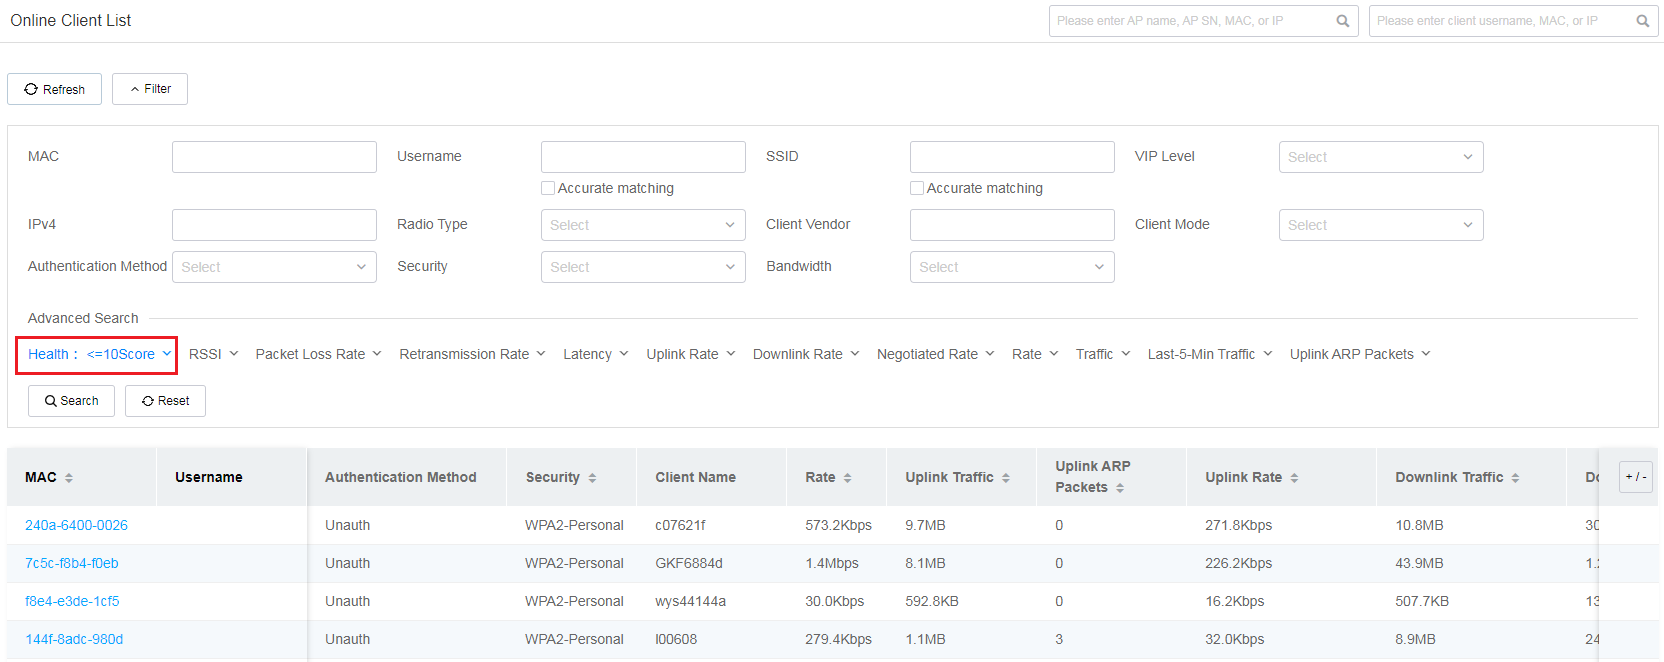
· Filtering by client health
To view filtered details, click the corresponding color segment to navigate to the Online Client List page. For example, you can click the 0-10 segment for Health to navigate to the Online Client List page. On the page that opens, the system fills the Health field with 0-10 automatically in the Filter section and the list displays corresponding clients of which the health scores are in the range of 0 to 10.
Figure 47 Filtered client details
Radio statistics snapshots
The Radio area displays statistics of radio types and radio details.
· Radio type statistics
Radio type statistics display real-time radio type distribution by total radio, 5 GHz radio, and 2.4 GHz radio and classifies these radios by radio capability and bandwidth. You can directly view radio statistics in the network.
Figure 48 Radio type distribution
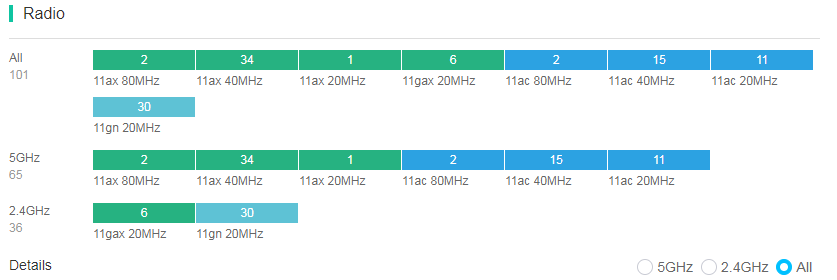
Table 2 Radio capability and bandwidth
|
Item |
Value |
|
Radio capability |
· 802.11a · 802.11b · 802.11g · 802.11an · 802.11gn · 802.11ac · 802.11gac · 802.11ax · 802.11gax |
|
Bandwidth |
· 20 MHz · 40 MHz · 80 MHz · 160 MHz |
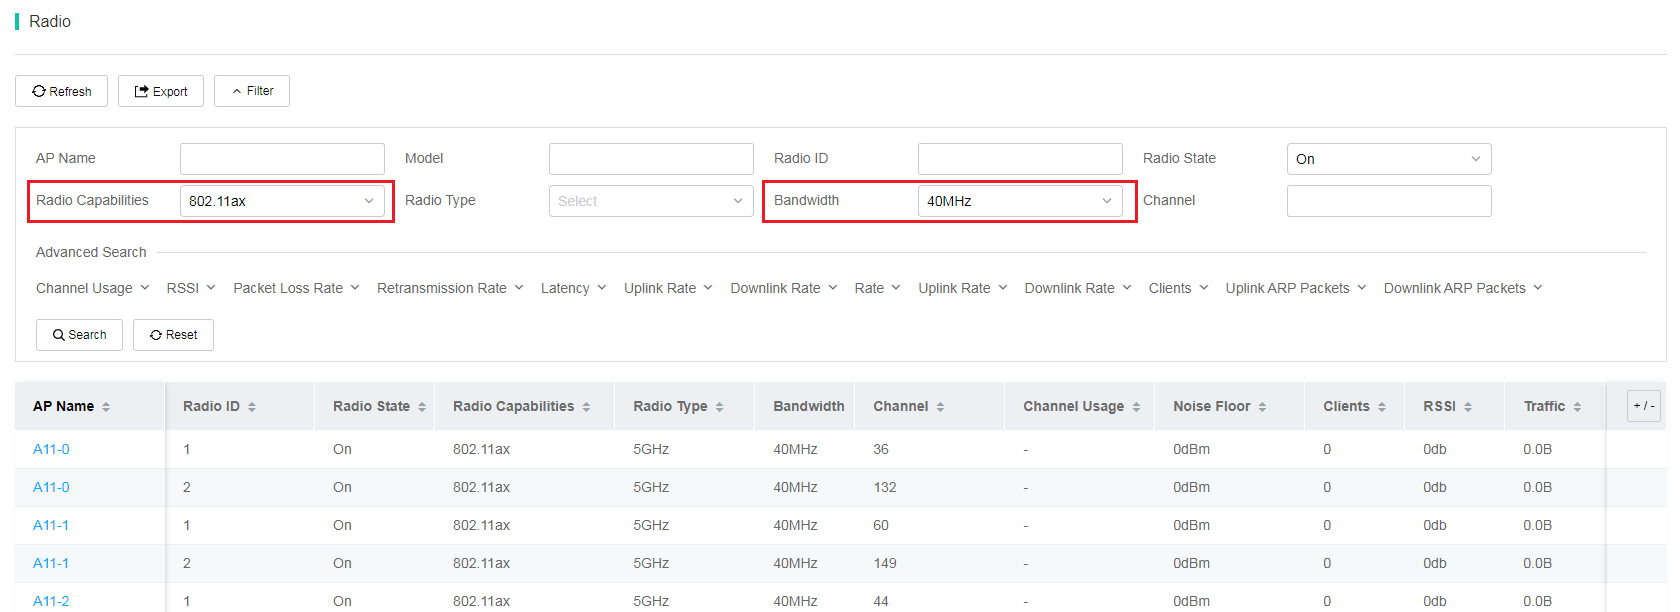
· Filtering by radio type
To view filtered radio information with a certain radio capability and bandwidth, click the corresponding color segment to navigate to the Radios page. For example, you can click the 11ax 40MHz segment for All to navigate to the Radios page. On the page that opens, the system fills the Client Capabilities field with 802.11ax and the Bandwidth field with 40 MHz automatically in the Filter section and the list displays the corresponding radio information after filtering.
Figure 49 Filtered radios
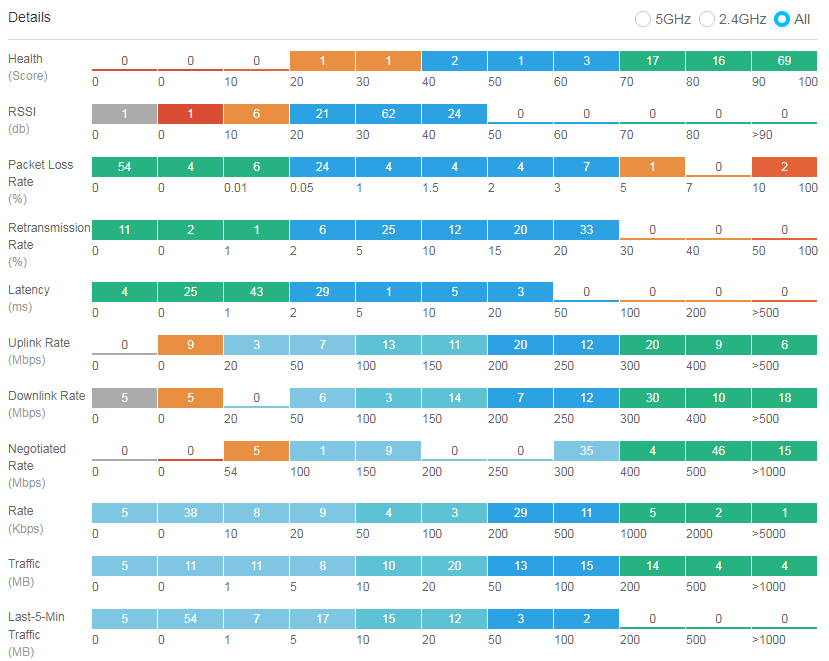
· Radio details statistics
The radio details chart displays information about online radio operation for 5 GHz, 2.4 GHz, and all radios in the current network in real time from the following perspectives: radio health, RSSI, packet loss rate, retransmission rate, latency, downlink speed, uplink speed, rate, uplink rate, downlink rate, and client distribution. You can identify radios in poor operation status through this chart and perform further observation or processing.
Figure 50 Radio details statistics
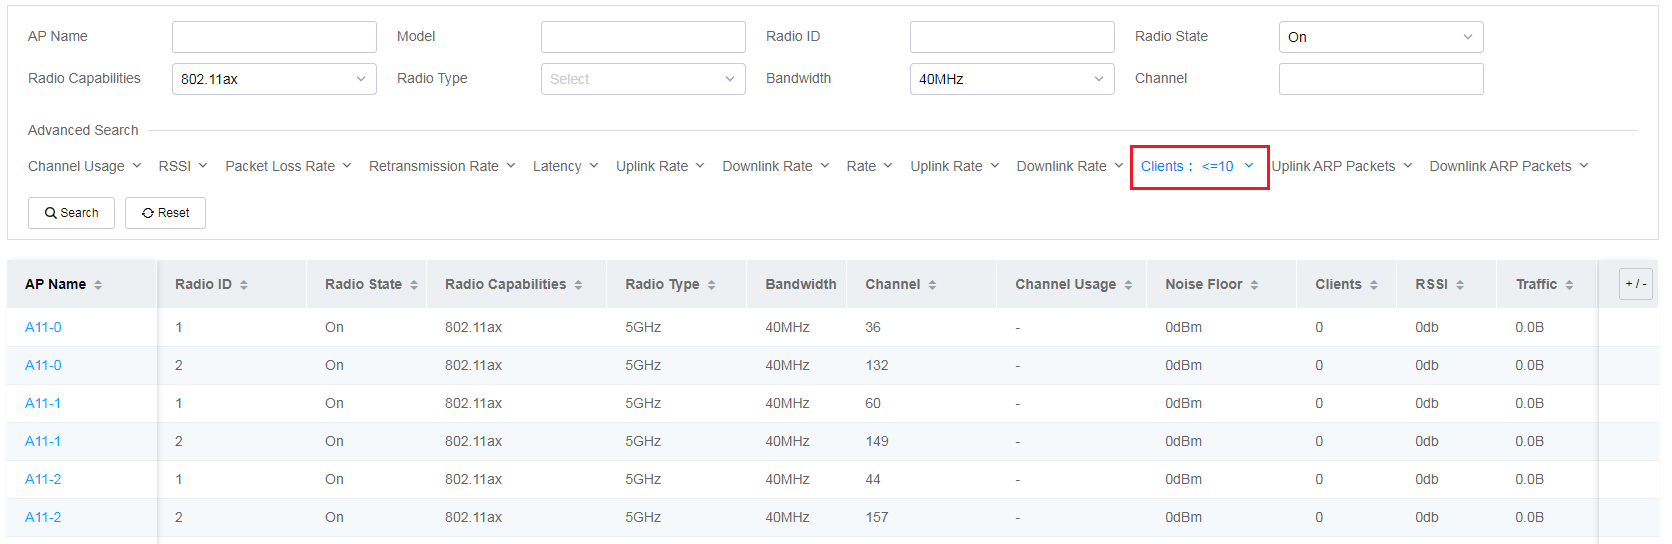
· Filtering by client quantity
To view filtered details, click the corresponding color segment to navigate to the Radios page. For example, you can click the 0-10 segment for Clients to navigate to the Radios page. On the page that opens, the system fills the Clients field with 0-10 automatically in the Filter section and the list displays corresponding radios of which the number of online associated clients is in the range of 0 to 10.
Figure 51 Filtered radio details
AP statistics snapshots
AP statistics snapshots display online AP details.
· AP details
The AP distribution chart displays online AP operation information in the current network in real time from the following perspectives: AP health, CPU usage, and memory usage. You can use this chart to identify APs in poor status and take actions accordingly. Statistics for each indicator are displayed on a scale of 0 to 100 and are color coded.
Figure 52 AP distribution chart
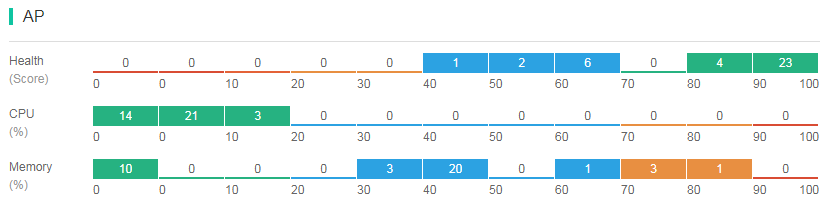
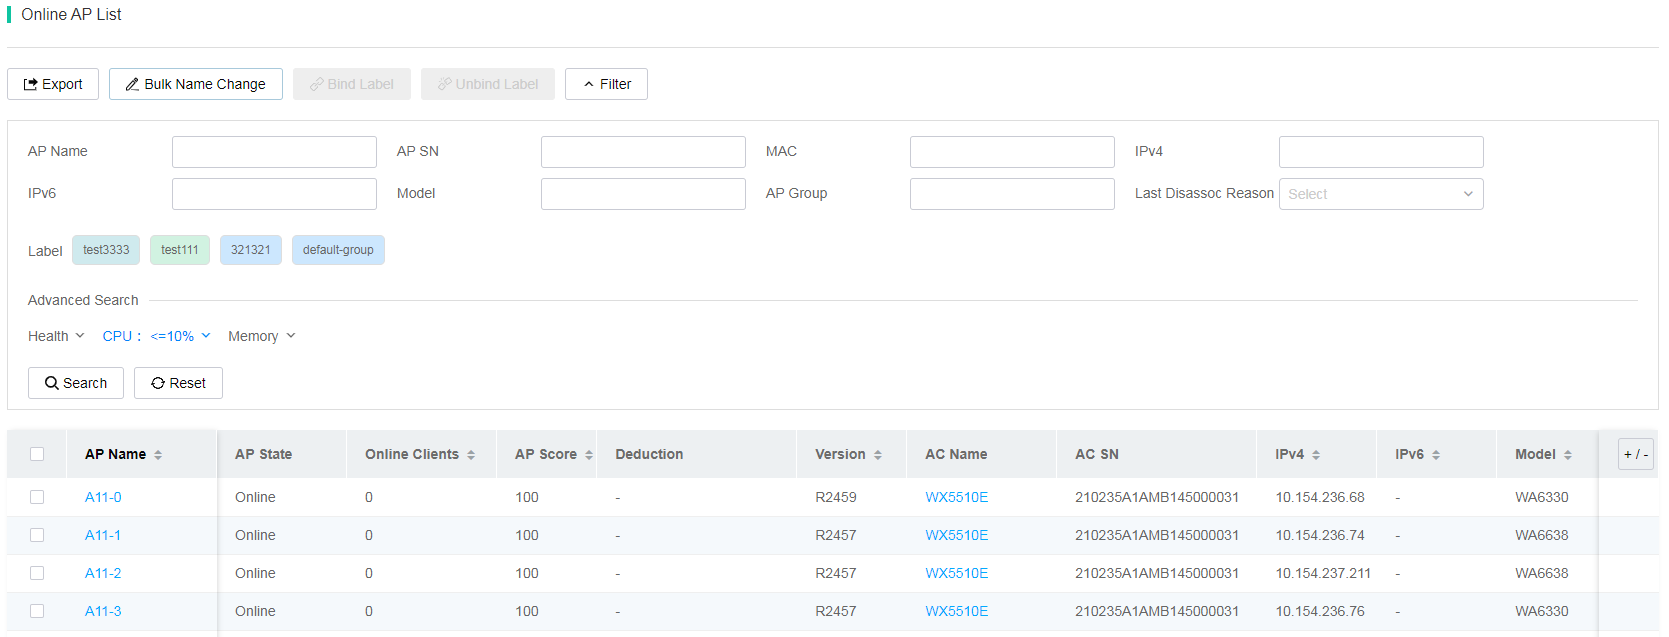
· AP filtering
To view detailed information about online APs by indicator, click a color segment for an indicator in the AP area. For example, if you click the color segment for CPU usage range 0% to 10% as shown in Figure 52, you will be redirected to the Network > APs page. In the Online AP List area of the page, detailed information about APs whose CPU usage is in the range of 0% to 10% are displayed, as shown in Figure 53.
Figure 53 Filtering by AP details
Wireless clients
To view health, online clients, access analysis, and summary, click Smart O&M on the top navigation bar, and then select Clients > Wireless from the left navigation pane.
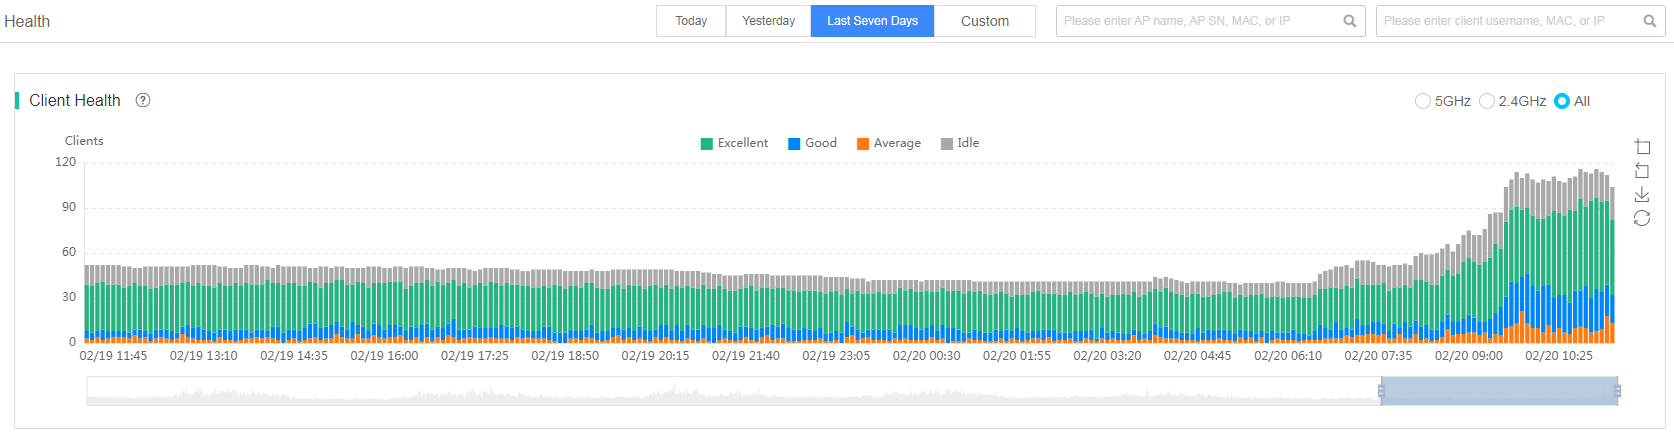
Client health
The Client Health area displays health information about online clients on the specified devices at the current site over a time range.
Table 3 Client health scoring criteria
|
Level |
Scoring range |
|
Excellent |
≥ 85 |
|
Good |
65 (included) to 85 |
|
Average |
< 65 |
|
Idle |
Clients whose uplink traffic and downlink traffic is too small to be ignored during the collection period. |
The client health trend chart displays the numbers of clients with a health level of excellent, good, average, and idle at each sampling point. To display statistics about clients associated with the 2.4 GHz and 5 GHz radios at a specific time, hover over the time instance on the chart. To display or hide the trend of a health level for clients, click the icon of the health level. In addition, you can display the radio heath trend by frequency band (5 GHz or 2.4 GHz).
Figure 54 Client health trend chart
To view detailed information about clients associated with 5 GHz, 2.4 GHz, or all radios, click the bar for a specific moment in the client health trend chart.
Figure 55 Client health details

In the client health details list, you can perform the following tasks as needed:
· To view details about a client, click the MAC address of that client.
· To edit the VIP level of a client, click the VIP level of that client.
· To view detailed information about the AP associated with a client, click the associated AP name in the Associated AP column or the associated radio name in the Associated Radio column for that client.
· To view detailed information about the AC associated with a client, click the associated AC name in the Associated AC column for that client.
Online client list
The online client list displays detailed information about online clients on the specified devices at the current site. You can specify filtering criteria to filter clients as needed.
Figure 56 Online client list
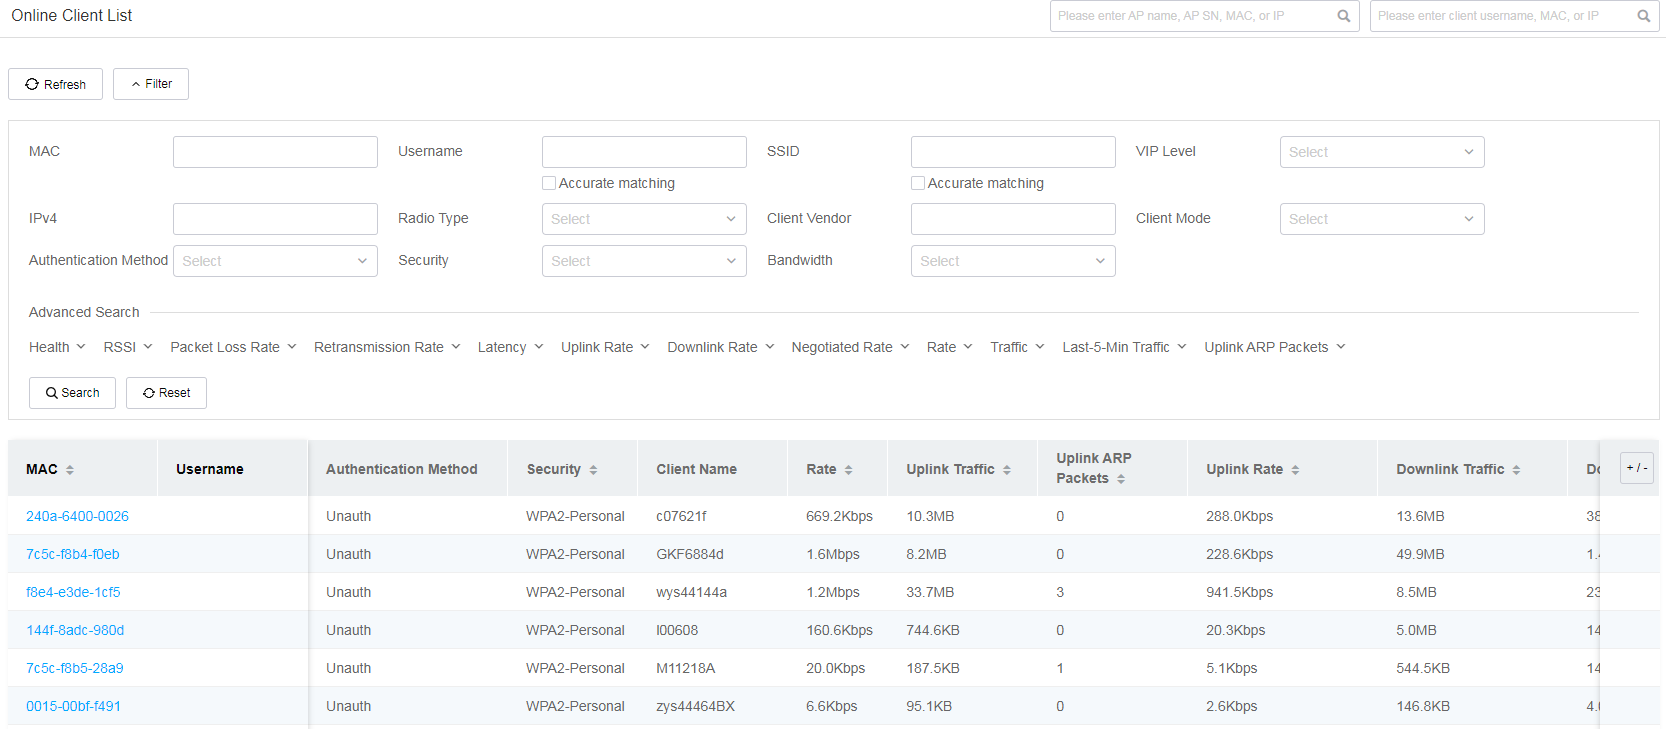
Except for the default columns, you can click the + / - icon to display or hide the following columns in the online client list:
· Uplink Traffic Distribution/Downlink Traffic Distribution—Displays the size and percentage of unicast traffic, broadcast traffic, and multicast traffic.
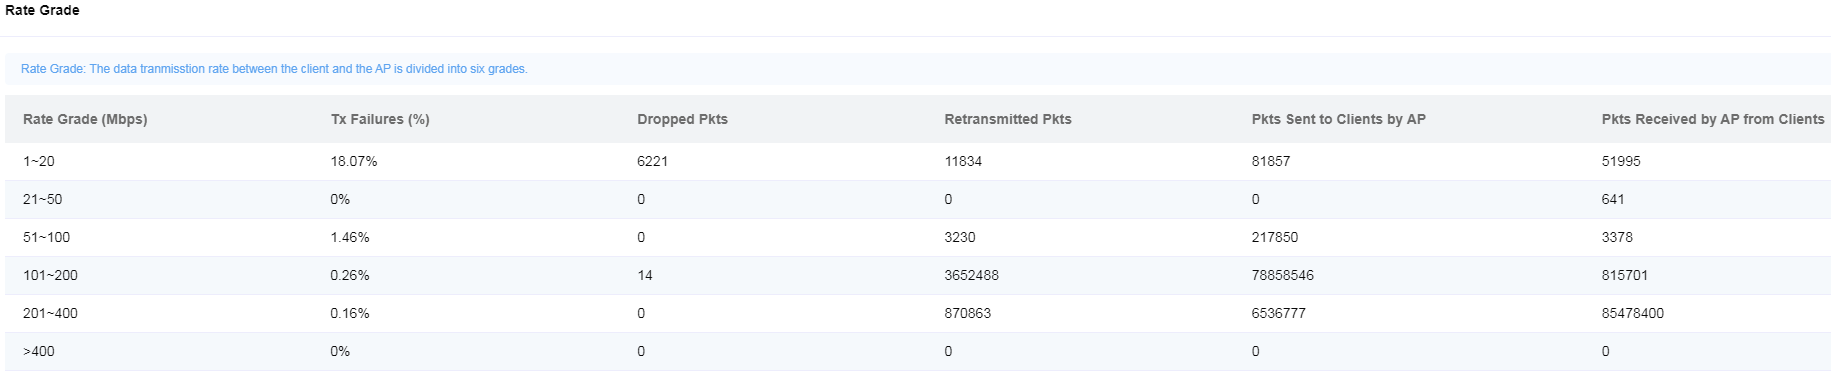
· Rate Grade—Displays packet transmission information between an AP and a client by rate grade range. You can view details about the rate grade on the current radio.
Figure 57 Rate grade
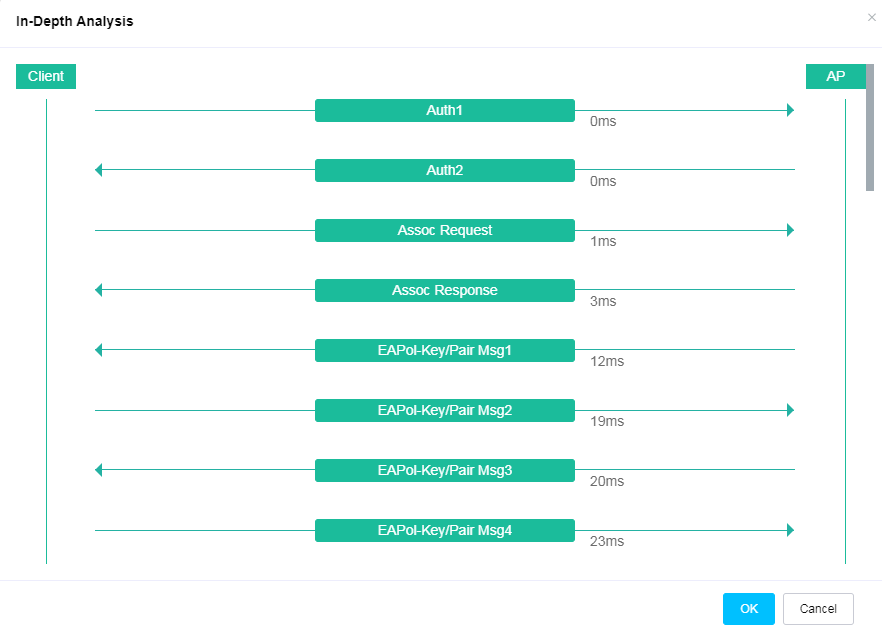
· In-Depth Analysis—Displays packet exchange details between an AP and a client when the client comes online.
Figure 58 In-depth analysis
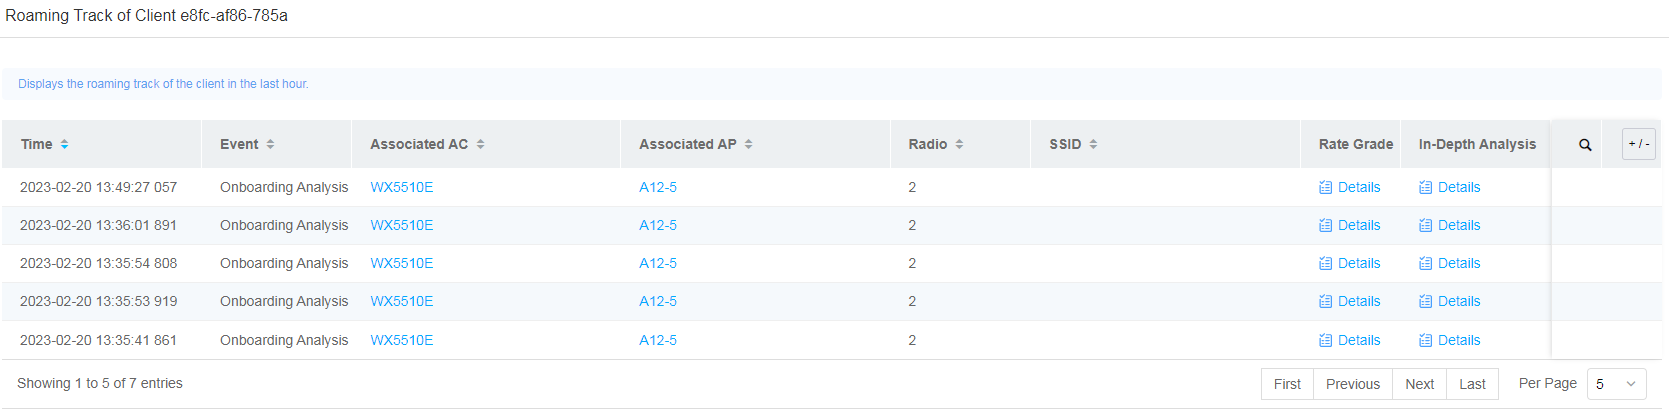
· Roaming Path—Displays the roaming path of a client within 1 hour. The roaming path list displays detailed roaming records of the client within 1 hour, in-depth analysis details for client online events, rate grade details for client offline events, and rate grade details for the most recent online event of the client.
Figure 59 Roaming path
Client details
To access the client details page, click Smart O&M on the top navigation bar, select Clients > Wireless > Online Clients from the left navigation pane, and then click the MAC address of a client.
The client details page displays client information, expert mode, and issue analysis. For more information, see "View client information."
Access analysis
To view information about authentication analysis results, association and disassociation analysis results, and IP monitoring results, click Smart O&M on the top navigation bar, and then select Clients > Wireless > Access Analysis from the left navigation pane.
· Authentication—Displays client access information and authentication durations.
Figure 60 Authentication
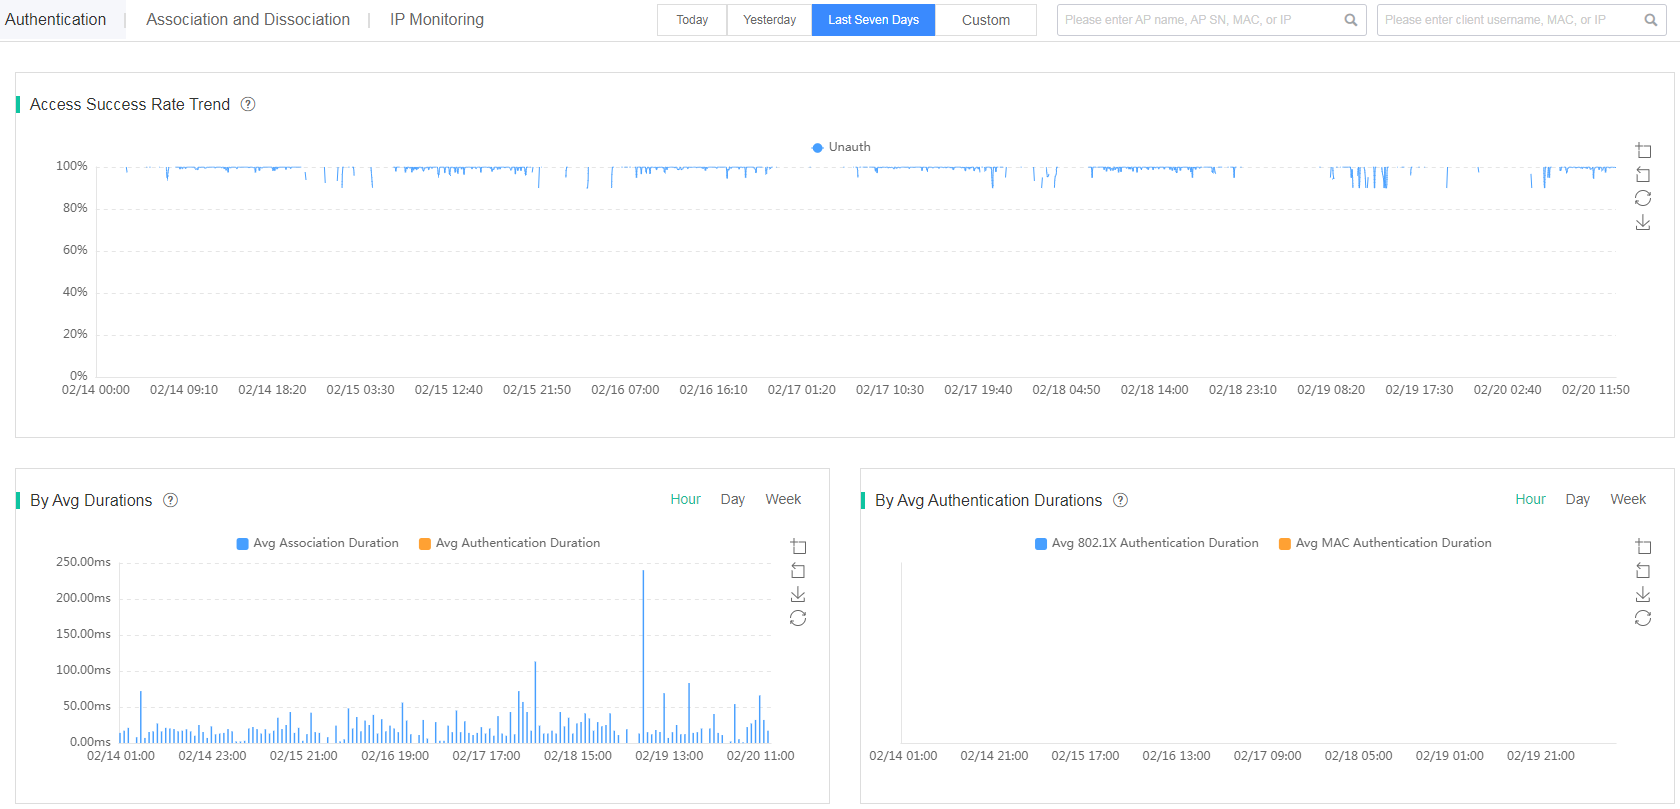
¡ Access Success Rate Trend—Displays distribution of clients by access success rate on the specified devices at the current site over a time range. Authentication methods include open-system, PSK, and MAC authentication.
¡ By Avg Durations—Displays distribution of clients by average association and authentication durations every hour, every day, or every week on the specified devices at the current site over a time range.
- Avg Association Duration—Time consumed for a successful association by a client to the total number of successfully associated clients within the statistics collection interval.
- Avg Authentication Duration—Time consumed for a successful MAC and 802.1X authentication by a client to the total number of successfully authenticated clients within the statistics collection interval.
¡ By Avg Authentication Durations—Displays distribution of clients by average 802.1X and MAC authentication durations every hour, every day, or every week on the specified devices at the current site over a time range.
- Avg 802.1X Authentication—Time consumed for a successful 802.1X authentication by all clients to the total number of 802.1X authentication clients within the statistics collection interval.
- Avg MAC Authentication—Time consumed for a successful MAC authentication by all clients to the total number of MAC authentication clients within the statistics collection interval.
· Association and Disassociation–By Abnormal Accesses—Displays distribution of clients by abnormal accesses over a time range. The system collects statistics every hour. Only reasons about clients with the top 10 abnormalities are displayed.
Figure 61 By Abnormal Accesses chart
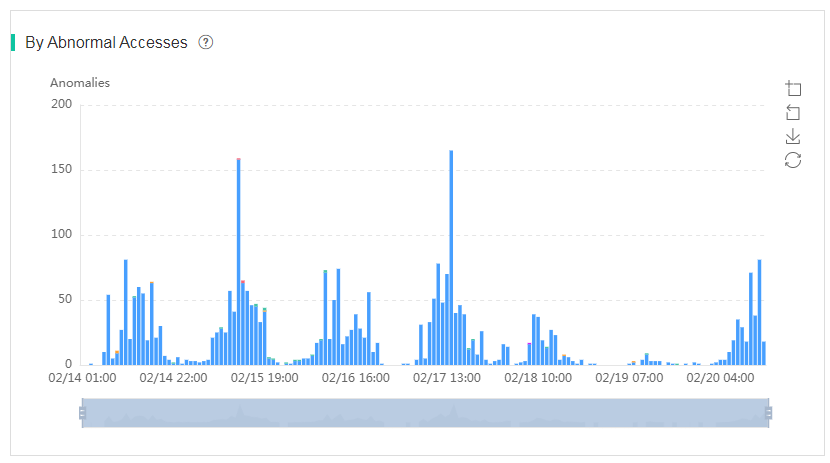
You can click a color segment in the By Abnormal Accesses chart to refresh the data in the following charts below this chart:
¡ Abnormal Access Clients Top 100—Displays statistics about clients with access exceptions. To view detailed information about a client, click the MAC address of that client in the list.
¡ APs with Most Abnormal Access Clients Top 100—Displays statistics about APs with which clients with access exceptions. To view detailed information about an AP, click the AP name in the list.
· Association and Disassociation–By Disassociations—Displays distribution of clients by disassociations over a time range. The system collects statistics every hour. Only reasons about clients with the top 10 disassociations are displayed.
Figure 62 By Disassociations chart
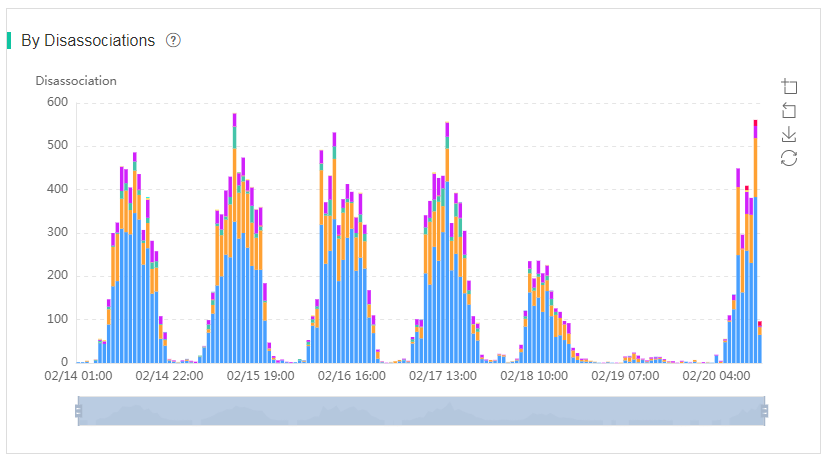
You can click a color segment in the By Disassociations chart to refresh the data in the following charts below this chart:
¡ Disassociated Clients Top 100—Displays statistics about disassociated clients. To view detailed information about a client, click the MAC address of that client in the list.
¡ APs with Most Disassociated Clients Top 100—Displays statistics about APs with disassociated clients. To view detailed information about an AP, click the AP name in the list.
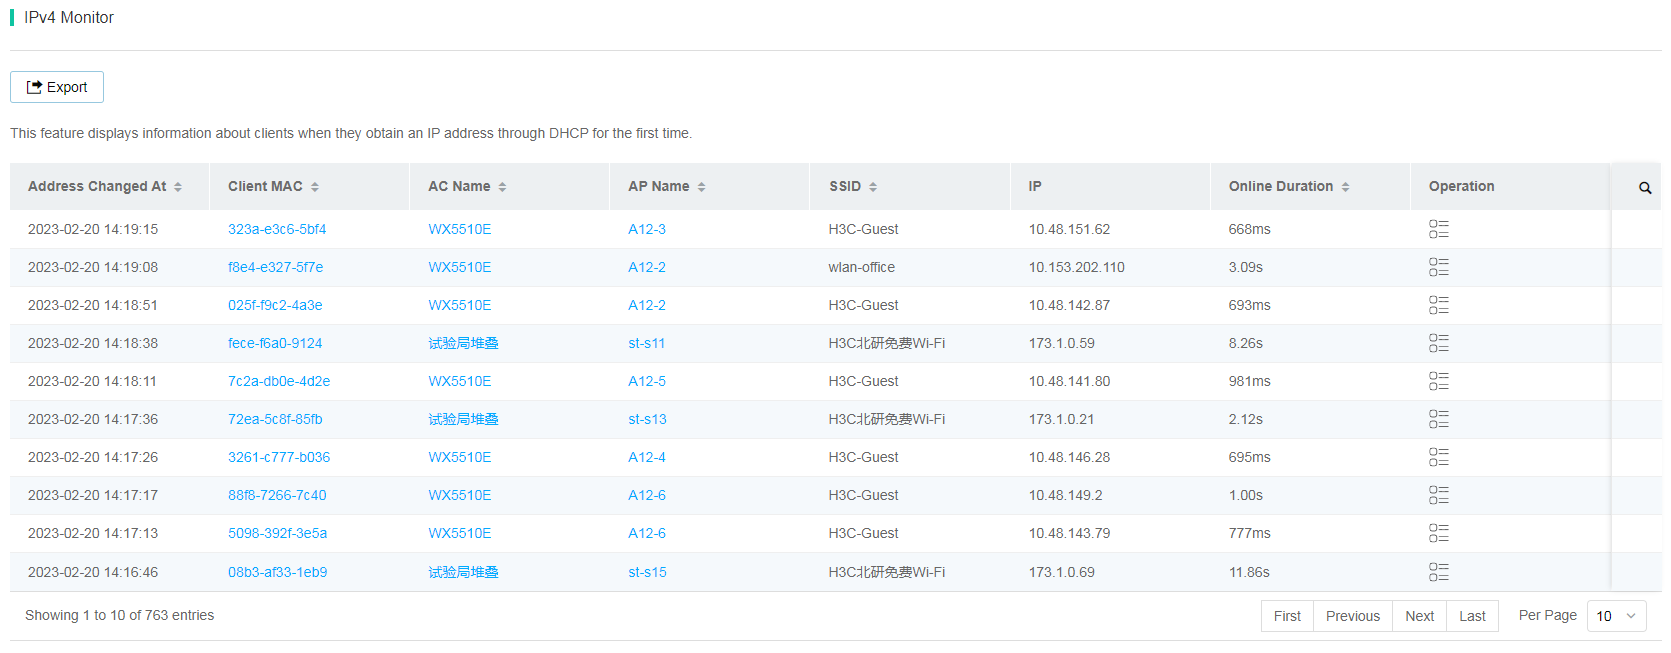
· IP Monitoring–IPv4 Monitor—Displays information about clients on the specified devices when they obtain an IPv4 address through DHCP for the first time at the current site over a time range. The Online Duration parameter represents the time used for IP address acquisition by a client for the first time since the client came online. If the time is long for all clients, the network is busy or the DHCP server responds slowly.
Figure 63 IPv4 Monitor page
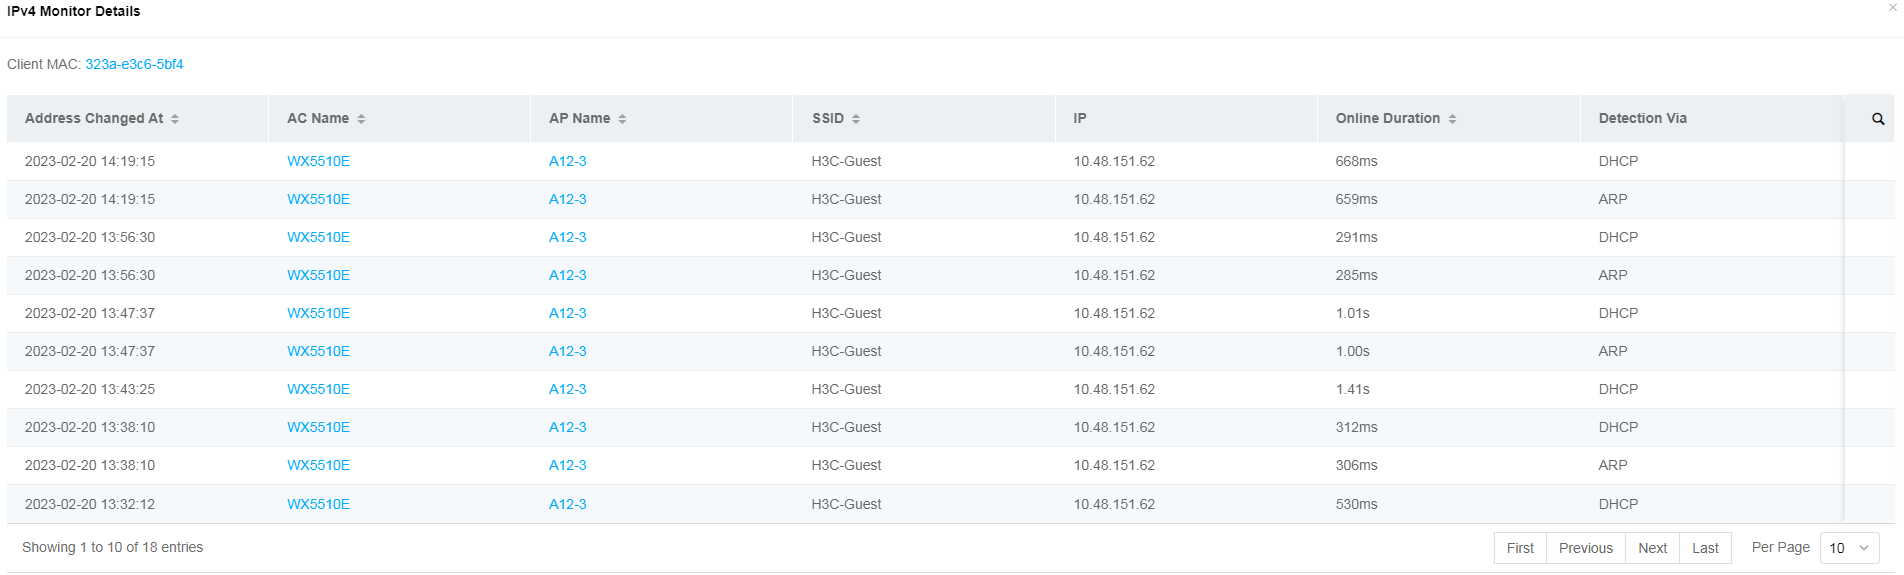
To view detailed information about IPv4
monitoring, click the IPv4 Monitor
Details icon ![]() in the Actions column for the target client. IPv4 monitor statistics are IP events in client logs.
in the Actions column for the target client. IPv4 monitor statistics are IP events in client logs.
Figure 64 IPv4 monitor details
· IP Monitoring–IPv6 Monitor—Displays information about clients on the specified devices when they obtain an IPv6 address through DHCP for the first time at the current site over a time range. The Online Duration parameter represents the time used for IP address acquisition by a client for the first time since the client came online. If the time is long for all clients, the network is busy or the DHCP server responds slowly.
IPv6 monitor is disabled by default. First enable the client to obtain IPv6 addresses through DHCPv6.
To view detailed information about IPv6
monitoring, click the IPv6 Monitor
Details icon ![]() in the Actions column for the target client. IPv6 monitor statistics are IP events in client logs.
in the Actions column for the target client. IPv6 monitor statistics are IP events in client logs.
Summary
The Summary page displays access information for 2.4 GHz and 5 GHz clients on the specified devices or all devices at the current site. This page provides summary client statistics from multiple perspectives and trend charts, and supports export of CSV files.
To access the Summary page, click Smart O&M on the top navigation bar, and then select Clients > Wireless > Summary from the left navigation pane.
Figure 65 Summary page
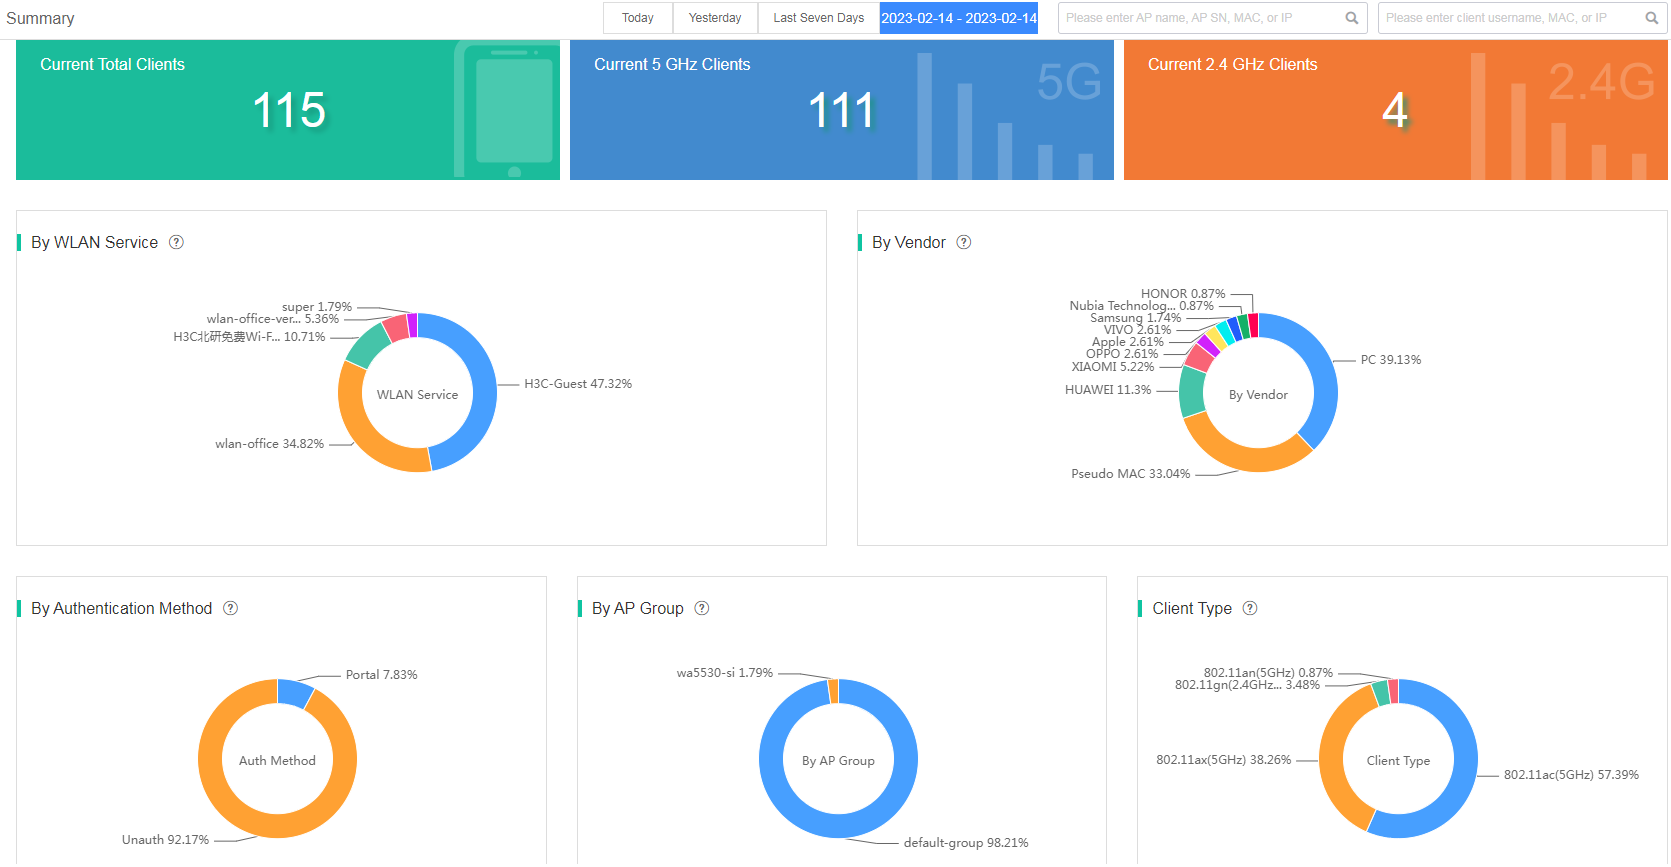
On the Summary page, you can view the following statistics:
· Current Clients—Displays the total number of online clients, 5 GHz online clients, and 2.4 GHz online clients on the specified devices at the site on top of the Summary page.
· By WLAN Service—Displays distribution of clients by associated wireless services on the specified devices at the site. You can view the SSID name, and the number and percentage of clients associated with each wireless service. To view the client access trend chart for a wireless service, click the color segment for that wireless service.
· By Vendor—Displays distribution of clients by vendor on the specified devices at the site. You can view the vendor name, and the number and percentage of clients from each vendor. To view detailed information about all associated clients from a vendor, click the color segment for that vendor.
· By Authentication Method—Displays distribution of clients by authentication method on the specified devices at the site. You can view the authentication method, and the number and percentage of clients authenticated by each authentication method.
· By AP Group—Displays distribution of clients by AP group on the specified devices at the site. You can view the AP group name and the number and percentage of clients associated with each AP group.
· Client Type—Displays distribution of clients by client type on the specified devices at the site. You can view the client type, and the number and percentage of clients of each type.
· Client Association Trend (By AP Group)—Displays top 32 AP groups with the most associated clients on the specified devices at the site or the specified devices in the area over a time range. To display or hide the trend of an AP group, click the target icon on the trend chart.
· Client Association Trend (By Wireless Service)—Displays top 16 wireless services with the most associated clients on the specified devices at the current site over a time range. To display or hide the trend of a wireless service, click the target icon on the trend chart.
· Client Association Trend (By Frequency Band)—Displays distribution of 2.4 GHz and 5 GHz clients by quantity on the specified devices at the current site over a time range. To display or hide the trend of an associated client, click the target icon on the trend chart.
· Client Traffic Trend (By Frequency Band): Displays distribution of clients by total uplink and downlink traffic on the specified devices at the current site over a time range. To display or hide the traffic trend of an associated client, click the target icon on the trend chart.
APs
To view information about AP health, channel analysis, and AP statistics, click Smart O&M on the top navigation bar, and then select Network > APs from the left navigation pane.
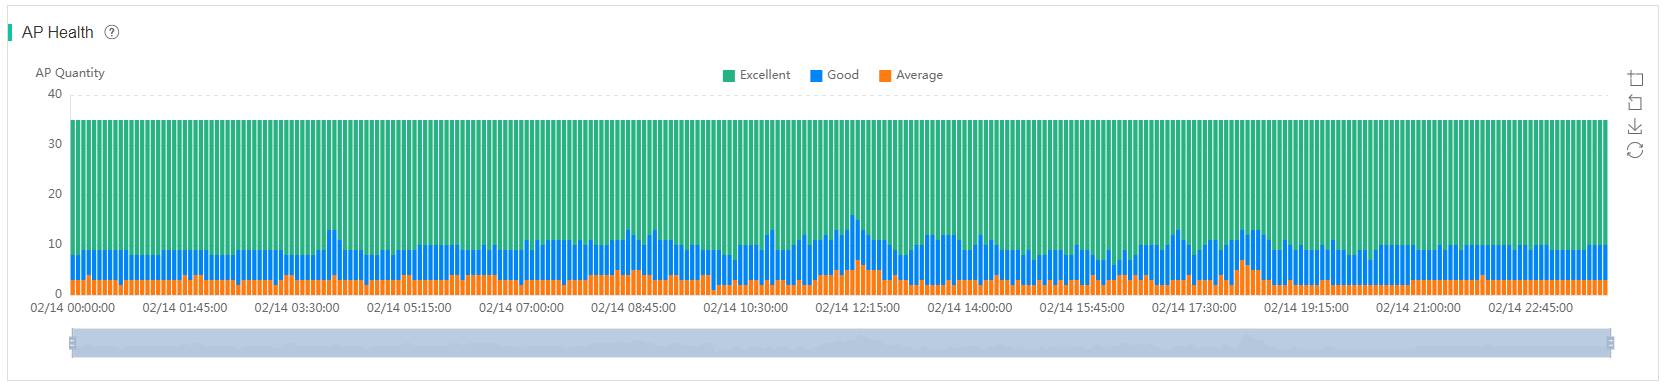
AP health
The AP Health area displays health information about online APs associated with specific ACs at the current site over a time range.
Table 4 AP health scoring criteria
|
Level |
Scoring range |
|
Excellent |
≥ 85 |
|
Good |
65 (included) to 85 |
|
Average |
< 65 |
The AP health trend chart displays the numbers of APs with a health level of excellent, good, and average at each sampling point. To display statistics about APs with a health level of excellent, good, and average at a specific time, hover over the time instance on the chart. To display or hide the trend of a health level for APs, click that health level.
Figure 66 AP health trend chart
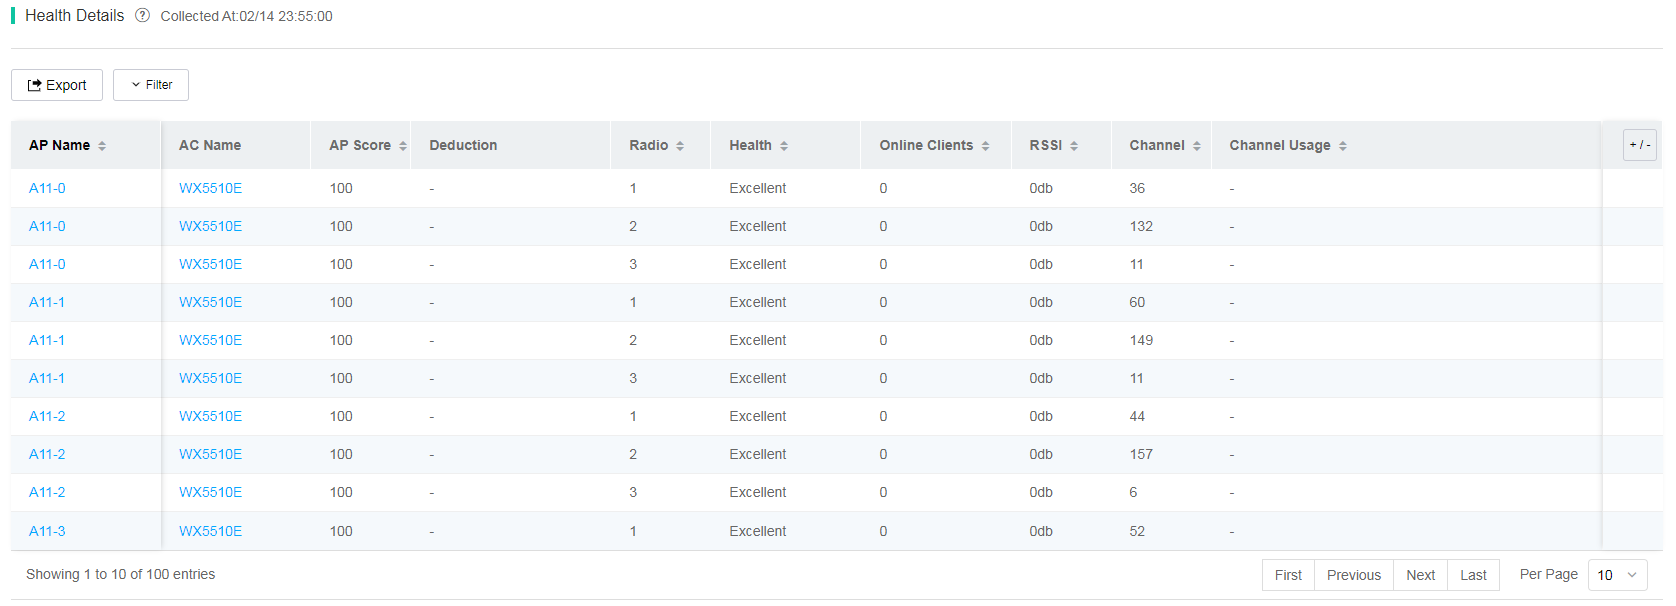
To view health details for online APs at a time point, click the bar for the time point in the AP health trend chart. The AP health details list displays the AP name, AC name, radio ID, health, online clients, client RSSI, channel, channel usage, latency, packet loss rate, and retransmission rate.
To view detailed AP information, click the name of an AP in the Health Details list.
To view detailed information about the AC associated with an AP, click the AC name in the AC Name column for that AP.
Figure 67 AP health details
AP details
The AP details page displays the following information:
· Basic AP Info—For more information, see "Basic AP information."
· Radio Info—For more information, see "AP radio information."
· Application Analysis—Displays application analysis statistics for the current AP over a time range. Other information on the AP Application Analysis page is consistent with that on the Application Analysis page.
· Issue Analysis—Displays issues detected on the current AP over a time range. Other information on the AP Issue Analysis page is consistent with that on the Issue Analysis page. For more information, see "Issue analysis."
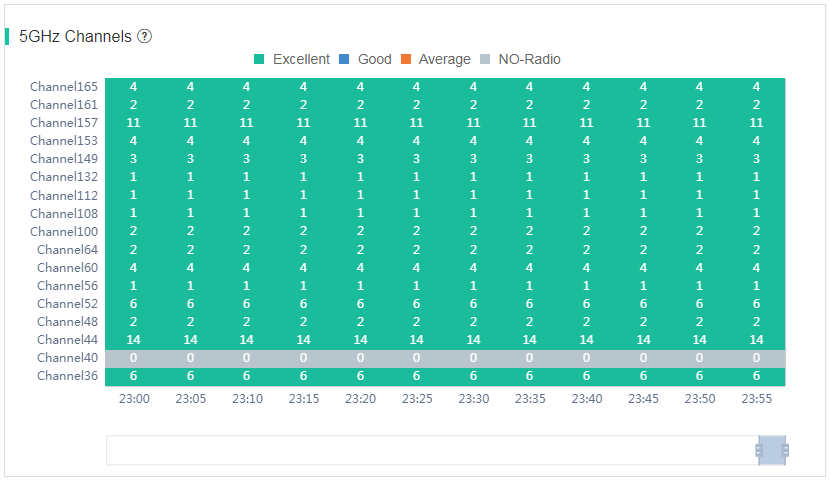
Channel analysis
The channel analysis page displays the 5 GHz and 2.4 GHz channel usage information at the current site.
· 5 GHz Channels—Displays the numbers of radios running at the 5 GHz channels and the usage of each channel.
Figure 68 5 GHz channel analysis
· 2.4 GHz Channels—Displays the numbers of radios running at the 2.4 GHz channels and the usage of each channel.
Figure 69 2.4 GHz channel analysis
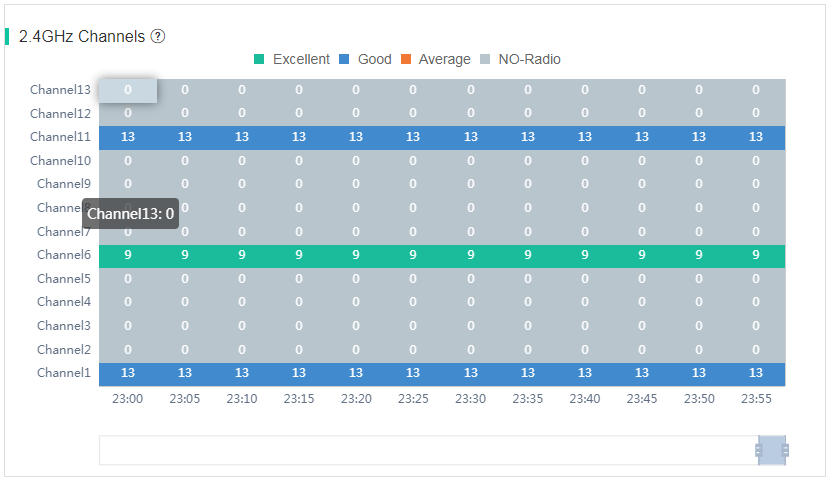
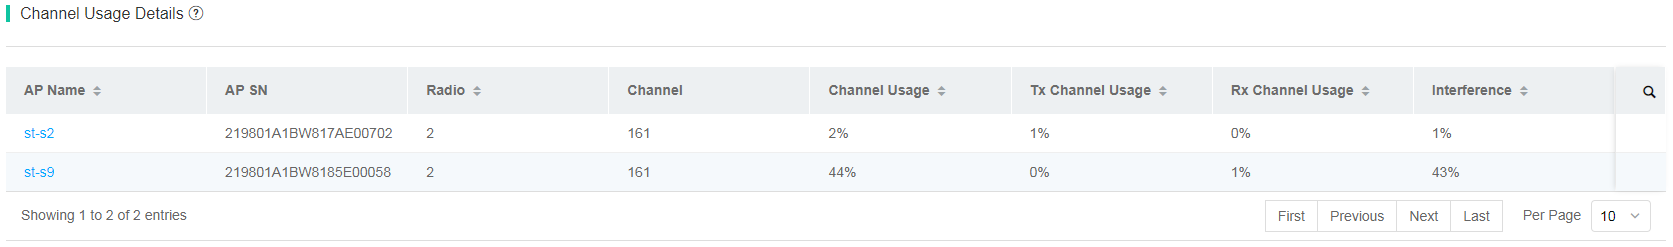
To view the channel usage details, click the color segment for a specific channel at a specific moment in the 5 GHz Channels or 2.4 GHz Channels area. The Channel Usage Details area displays the channel usage details at that moment, such as total channel usage, sending channel usage, and receiving channel usage.
Figure 70 Channel usage details
AP statistics
The AP statistics page displays information such as associations, disassociations, and association failures for APs managed at the site.
· APs
Click Smart O&M on the top navigation bar, and then select Network > APs > AP Statistics from the left navigation pane. You are placed on the APs tab. The tab displays AP statistics by AP model and client quantity.
¡ By AP Model—Displays statistics by AP model for online, offline, or all APs associated with the specified devices at the site.
¡ By Client Quantity—Displays statistics by the number of clients associated with APs at the site.
¡ Online/Offline/All AP List—Displays detailed information about APs on the specified devices at the site. You can specify the filtering criteria to search the APs that meet the criteria.
To display or hide columns in an AP list, click the + / - icon, and then select or clear the target columns.
Figure 71 Online AP list
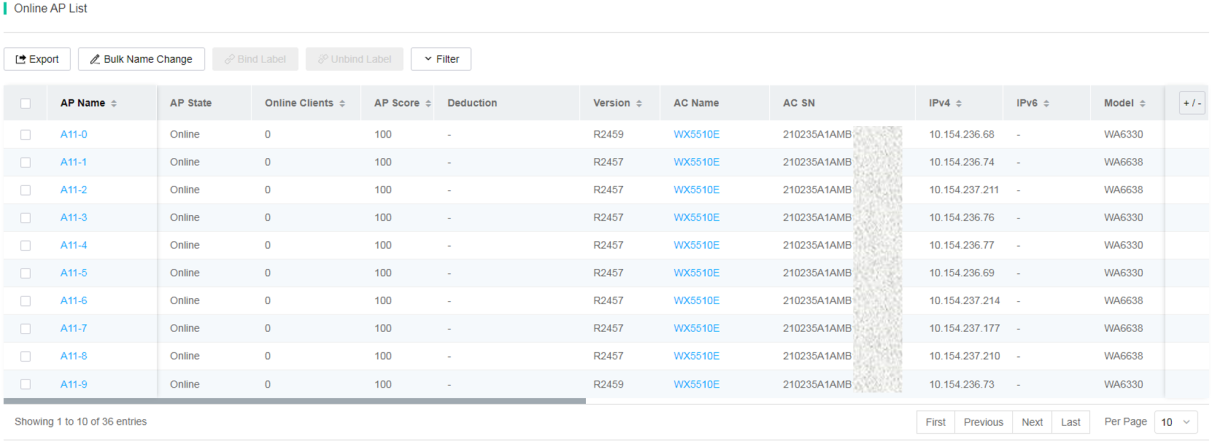
Figure 72 Offline AP list
· Radios
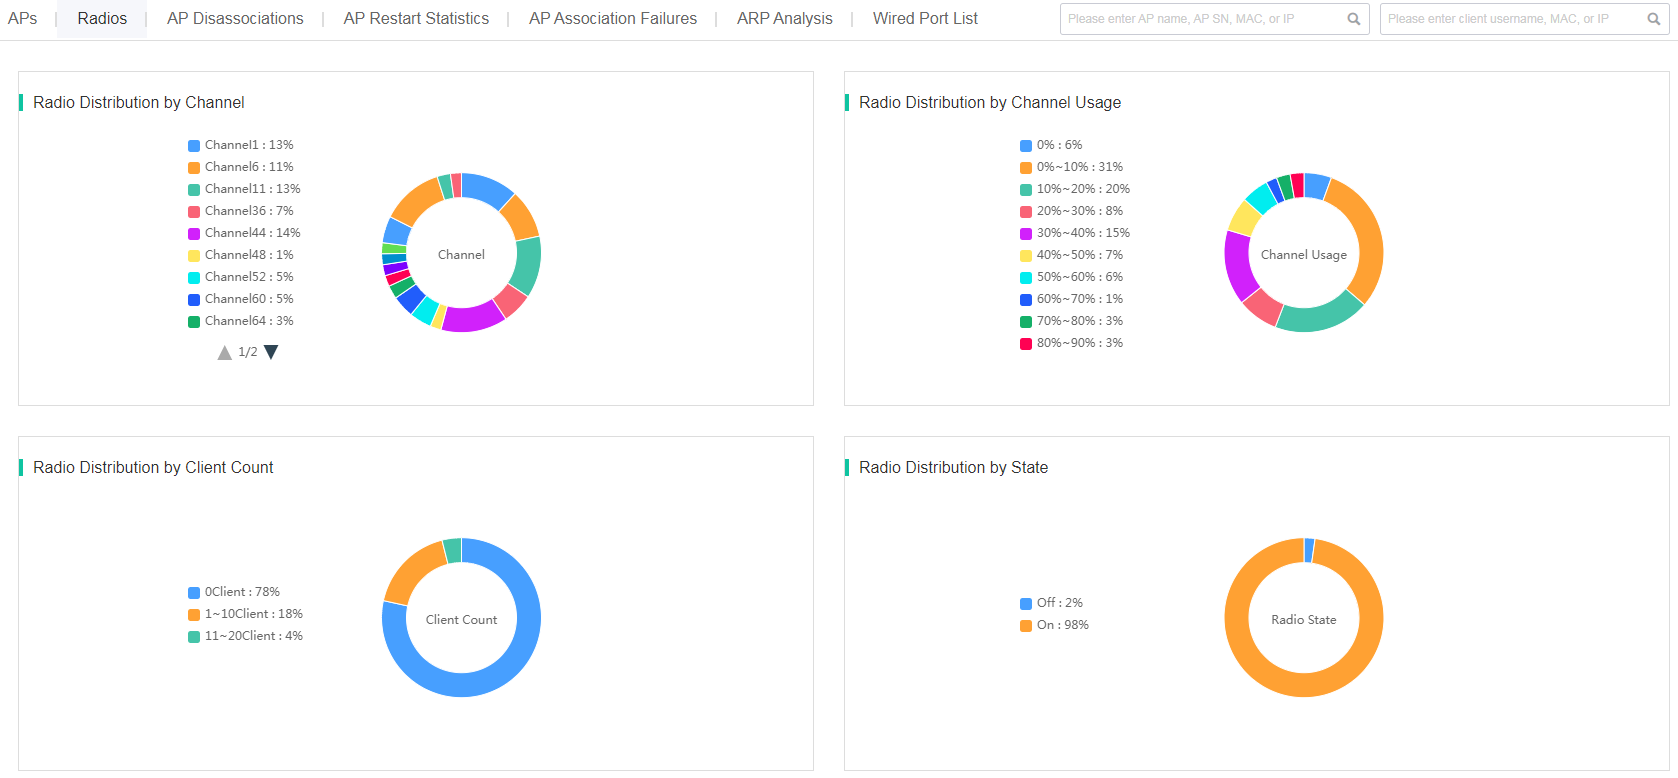
Click Smart O&M on the top navigation bar, and then select Network > APs > AP Statistics from the left navigation pane. Click the Radios tab to view statistics about AP radios on specified devices at the current site over a time range.
¡ Radio distribution charts—Display radio statistics by channel, channel usage, client count, and state.
Figure 73 Radio distribution charts
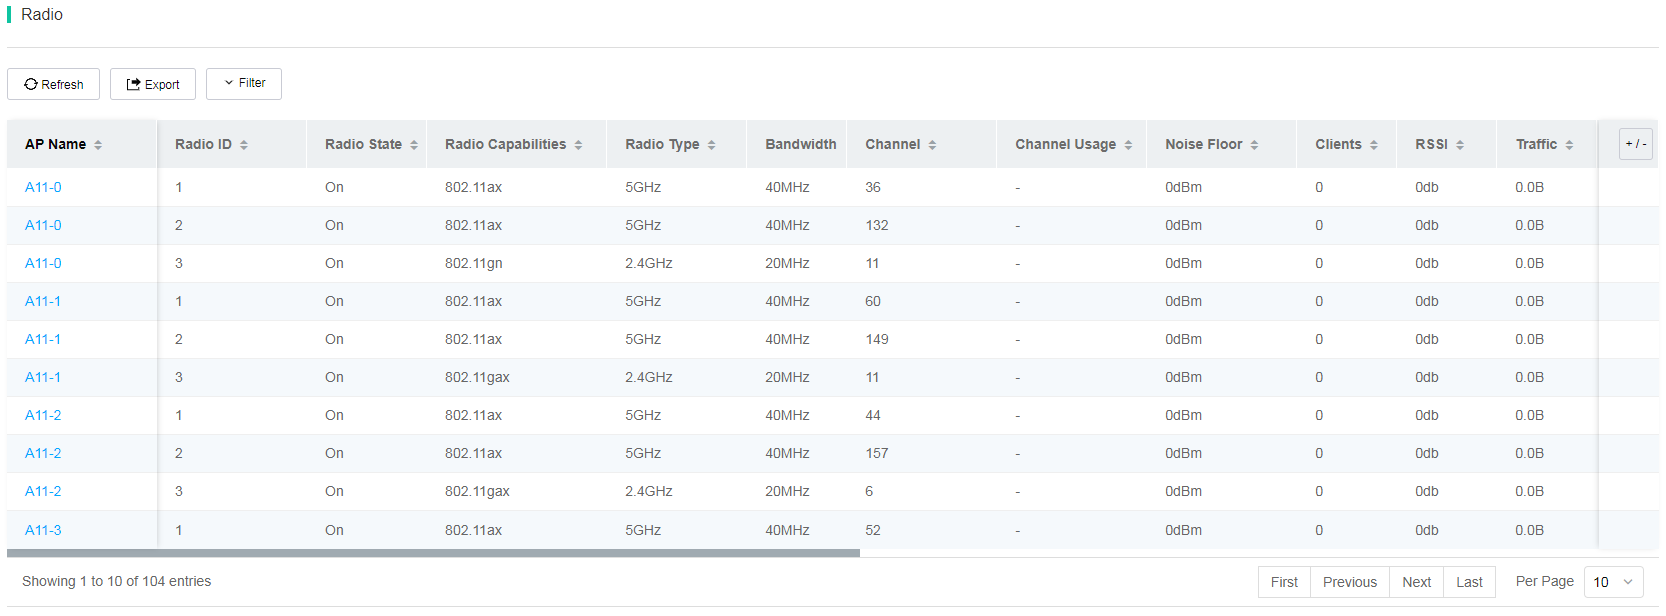
¡ Radio details list—Displays detailed AP radio information at the current site. To display or hide columns in a radio details list, click the + / - icon, and then select or clear the target columns.
Figure 74 Radio details list
· AP Disassociations
For more information, see "View AP disassociation statistics."
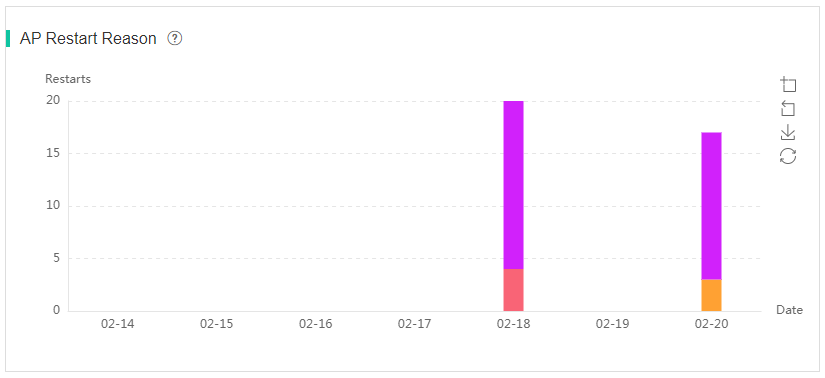
· AP Restart Statistics—Displays AP restart reasons and counts in the past 7 days at the current site.
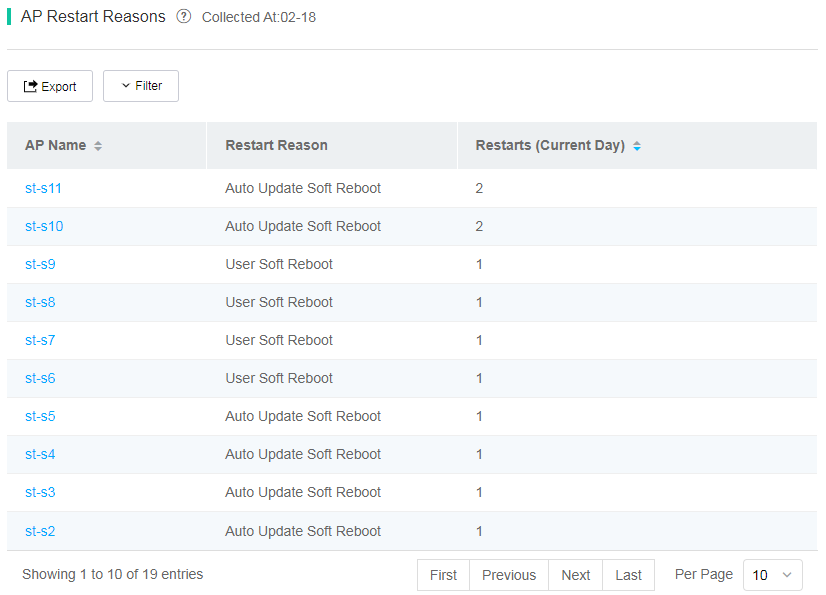
¡ AP Restart Reason—Displays AP statistics by restart reason in the past 7 days and restart counts for different reasons.
Figure 75 AP restart reason chart
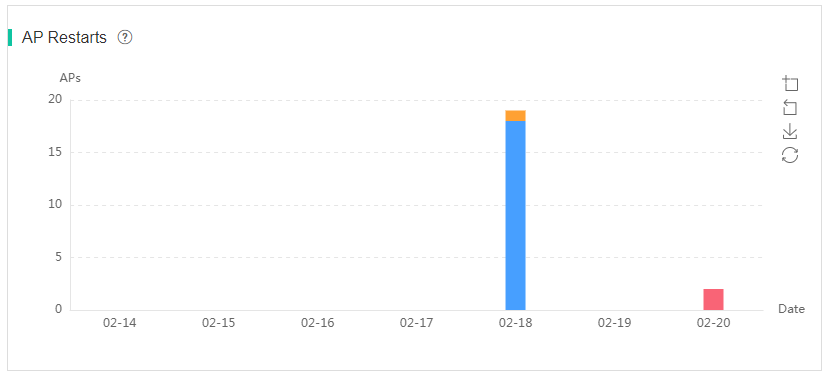
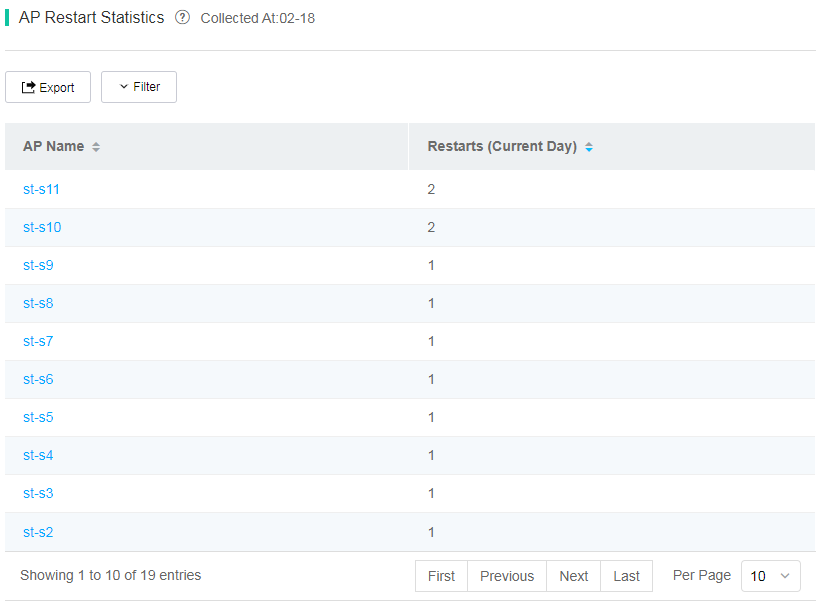
¡ AP Restarts—Displays AP statistics by restart count in the past 7 days.
Figure 76 AP restart counts chart
¡ AP Restart Details
To view information about all APs that restarted on a day by restart reason, click the bar for that day in the AP restart reason chart. The AC is the AC with which the AP is associated after the AP restarts and comes online again.
Figure 77 AP restart details
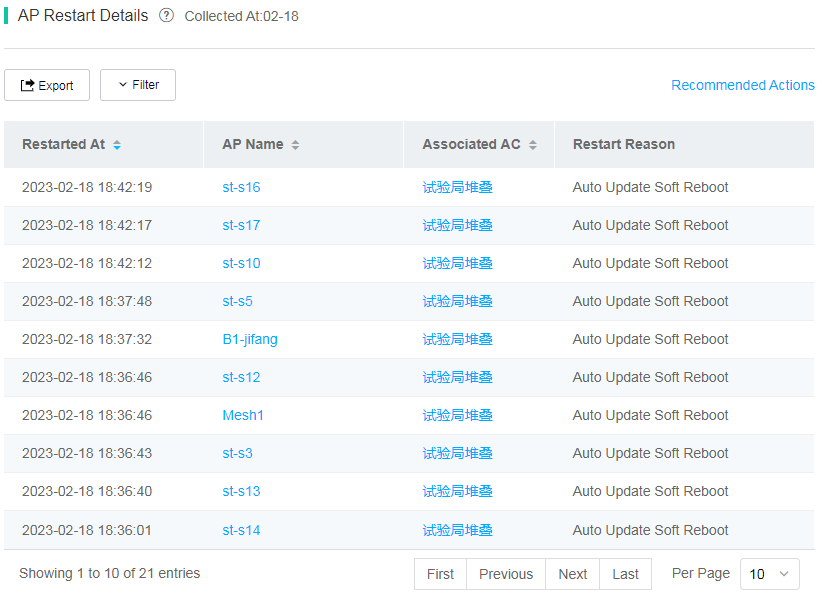
Figure 78 AP restart reasons
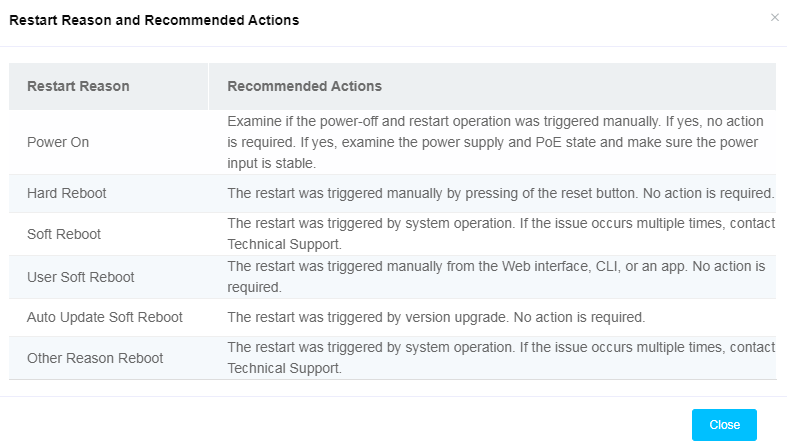
To view AP restart reasons and recommended actions, click the Recommended Actions link, as shown in Figure 77.
Figure 79 Restart reasons and recommended actions
¡ AP Restart Counts
To view information about all APs that restarted on a day by restart count, click the bar for that day in the AP restart counts chart.
Figure 80 AP restart counts
· AP Association Failures—For more information, see "View AP association failure statistics."
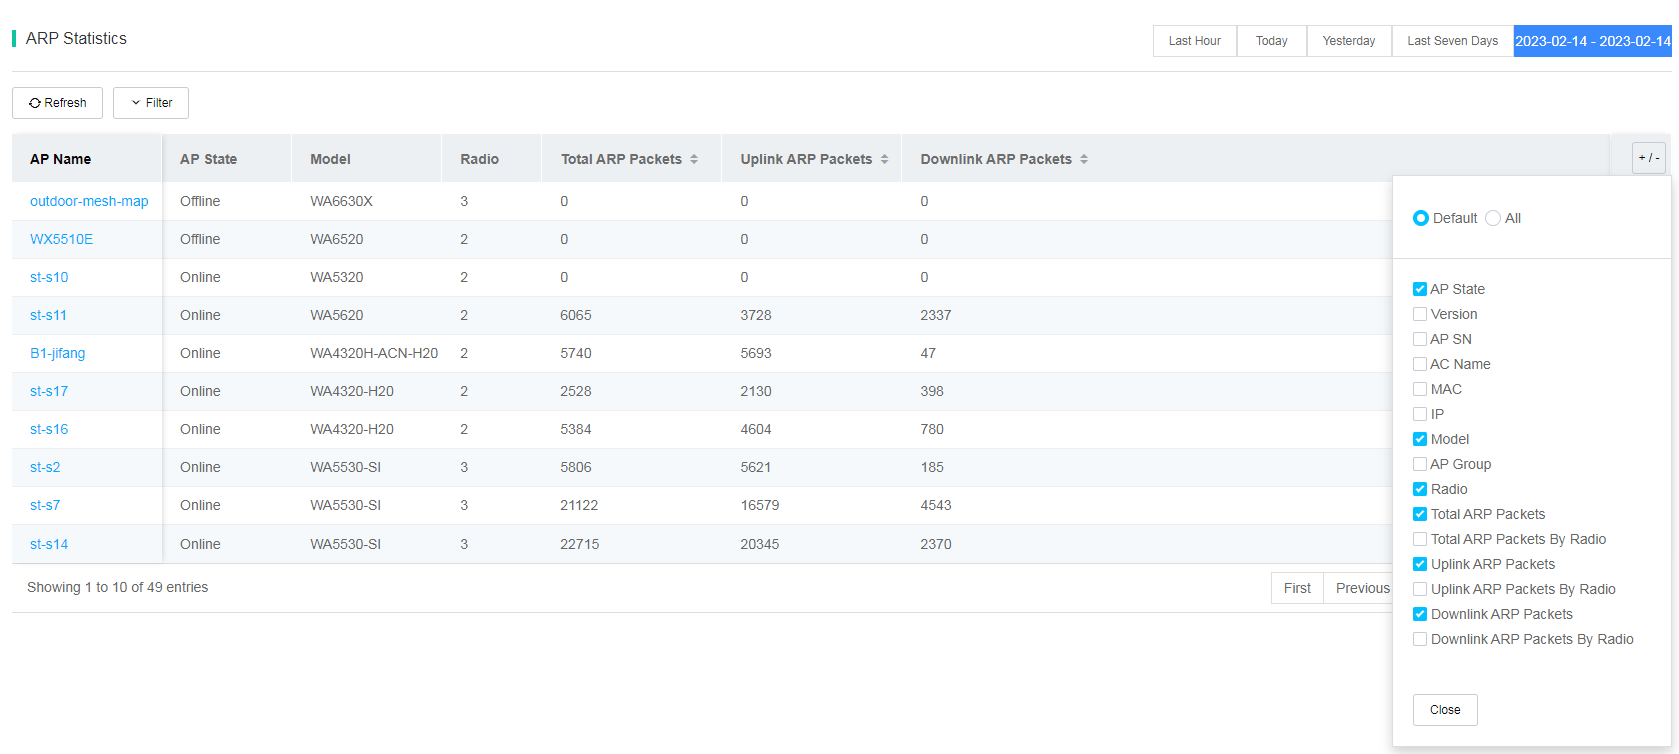
· ARP Analysis—Displays ARP statistics such as the number of AP radios, total ARP packets, total ARP packets by radio, the number of uplink ARP packets, uplink ARP packets by radio, the number of downlink ARP packets, and downlink ARP packets by radio.
Figure 81 ARP analysis
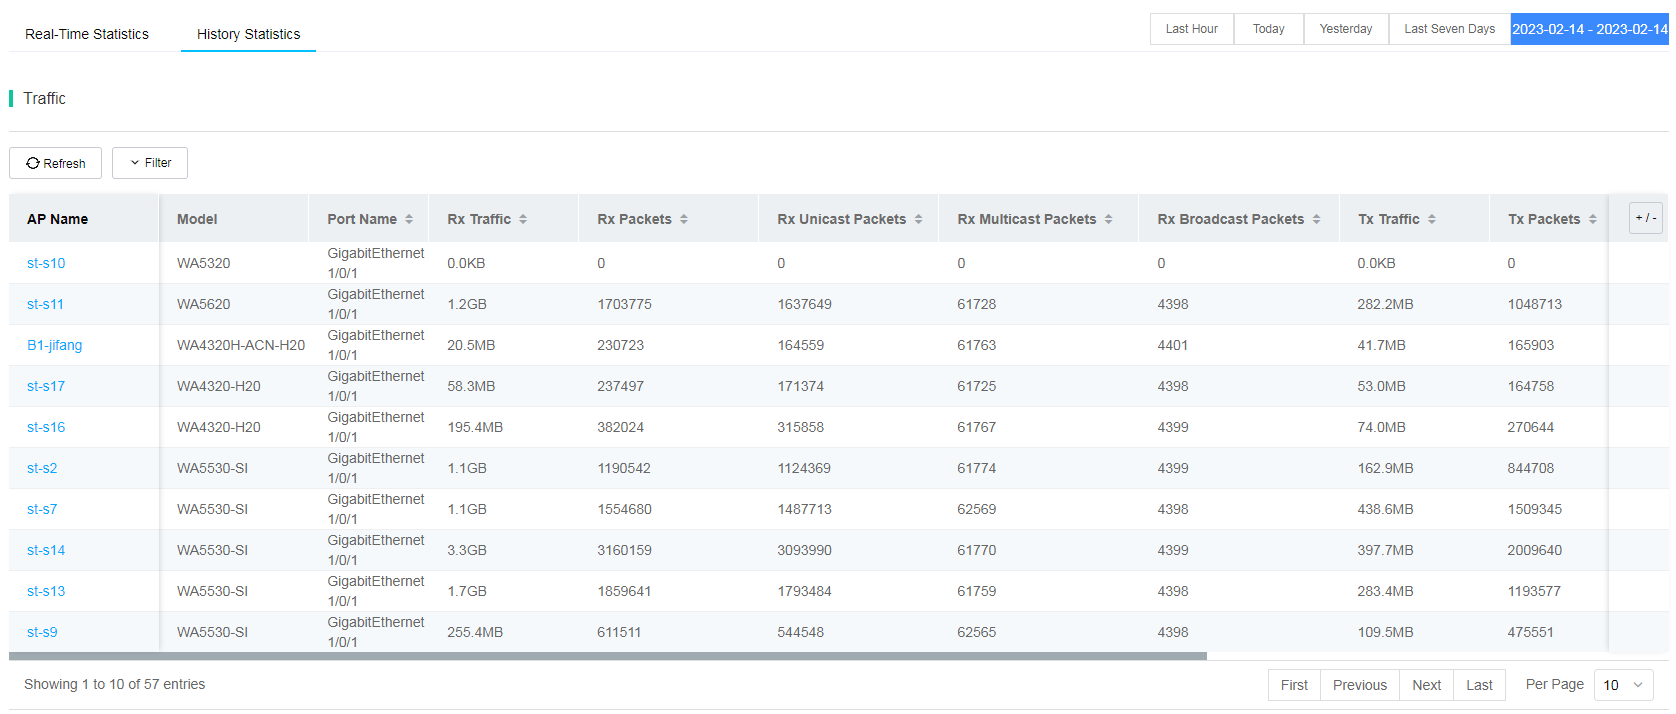
· Wired Port List—Displays the following statistics:
¡ Real-time rate and traffic statistics, as shown in Figure 82 and Figure 83.
¡ History traffic statistics, as shown in Figure 84.
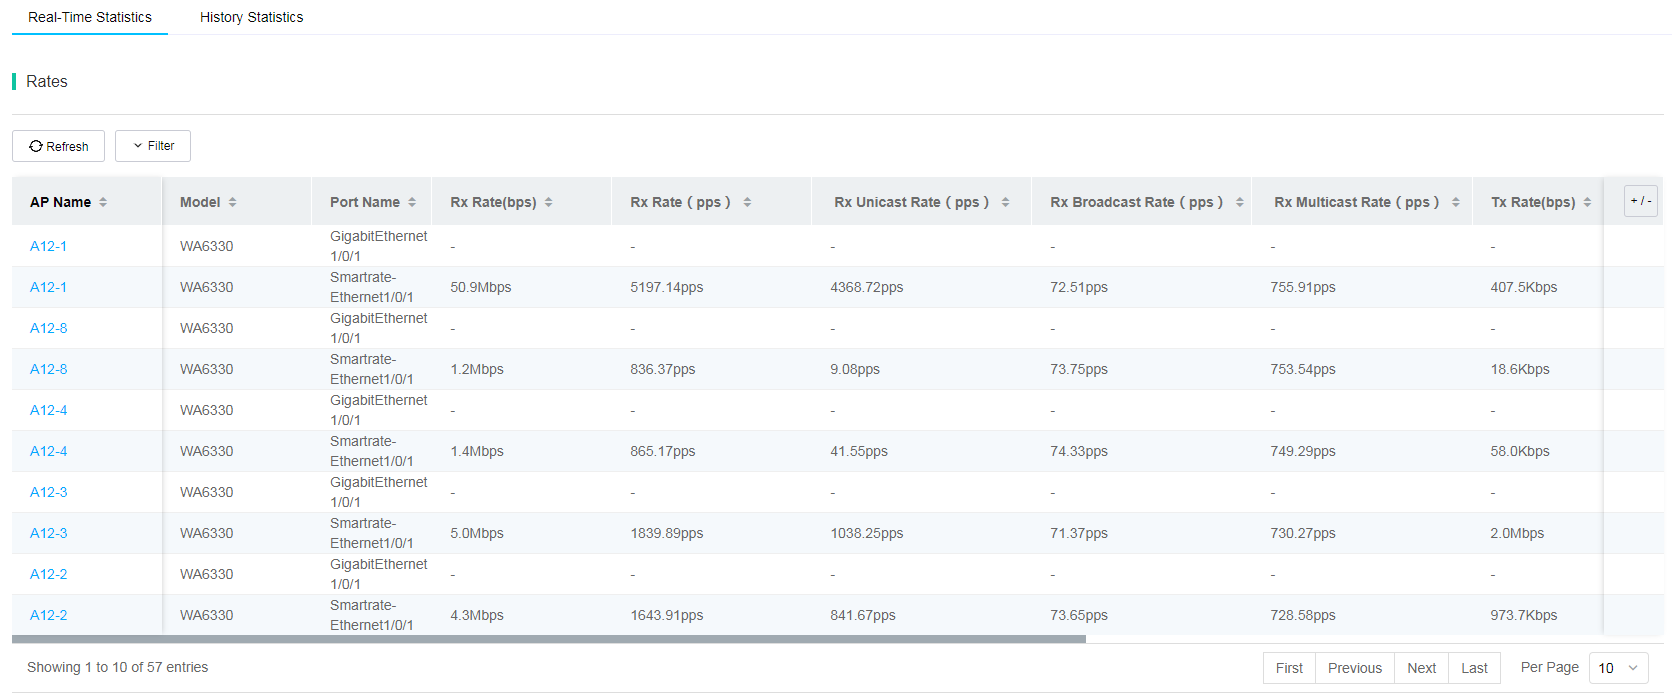
Figure 83 Real-time traffic list
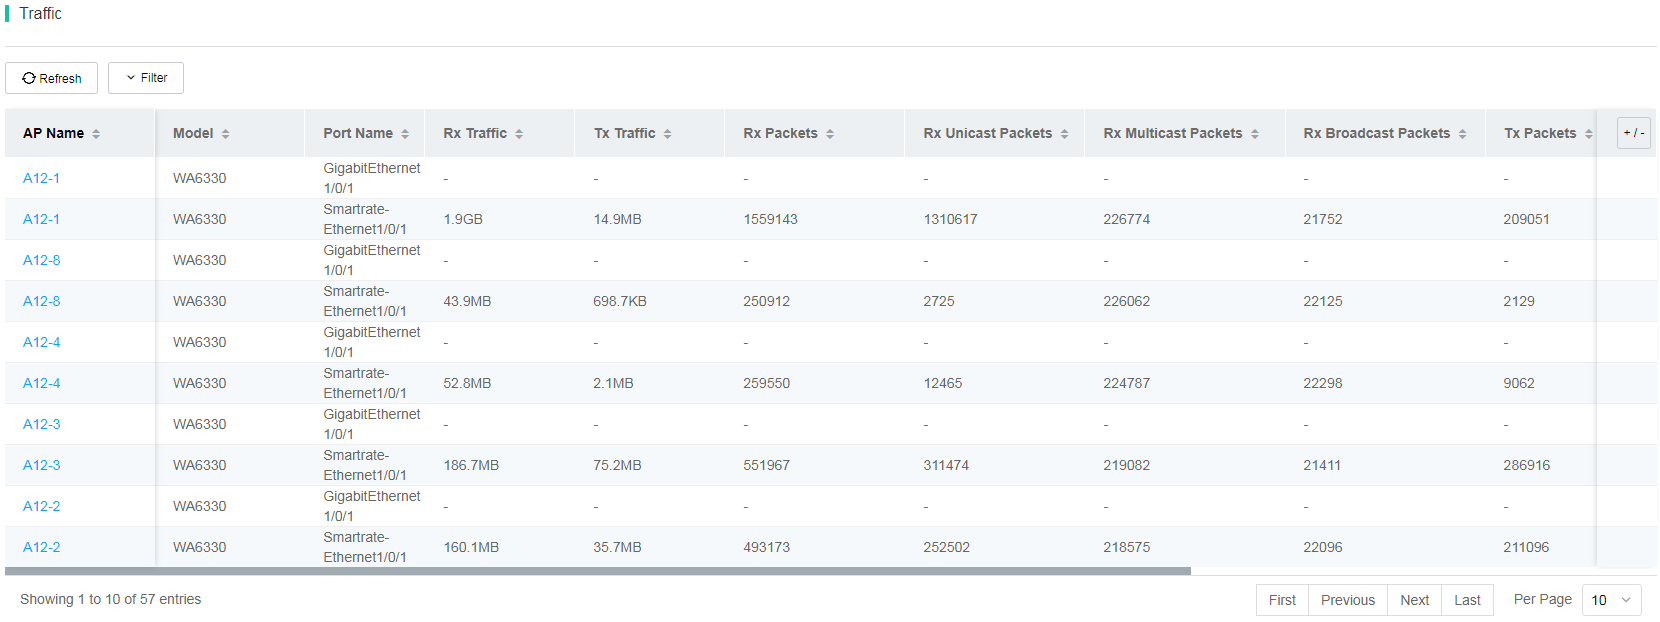
Figure 84 History traffic list
ACs
To view AC summary or details, click Smart O&M on the top navigation bar, and then select Network > ACs from the left navigation pane.
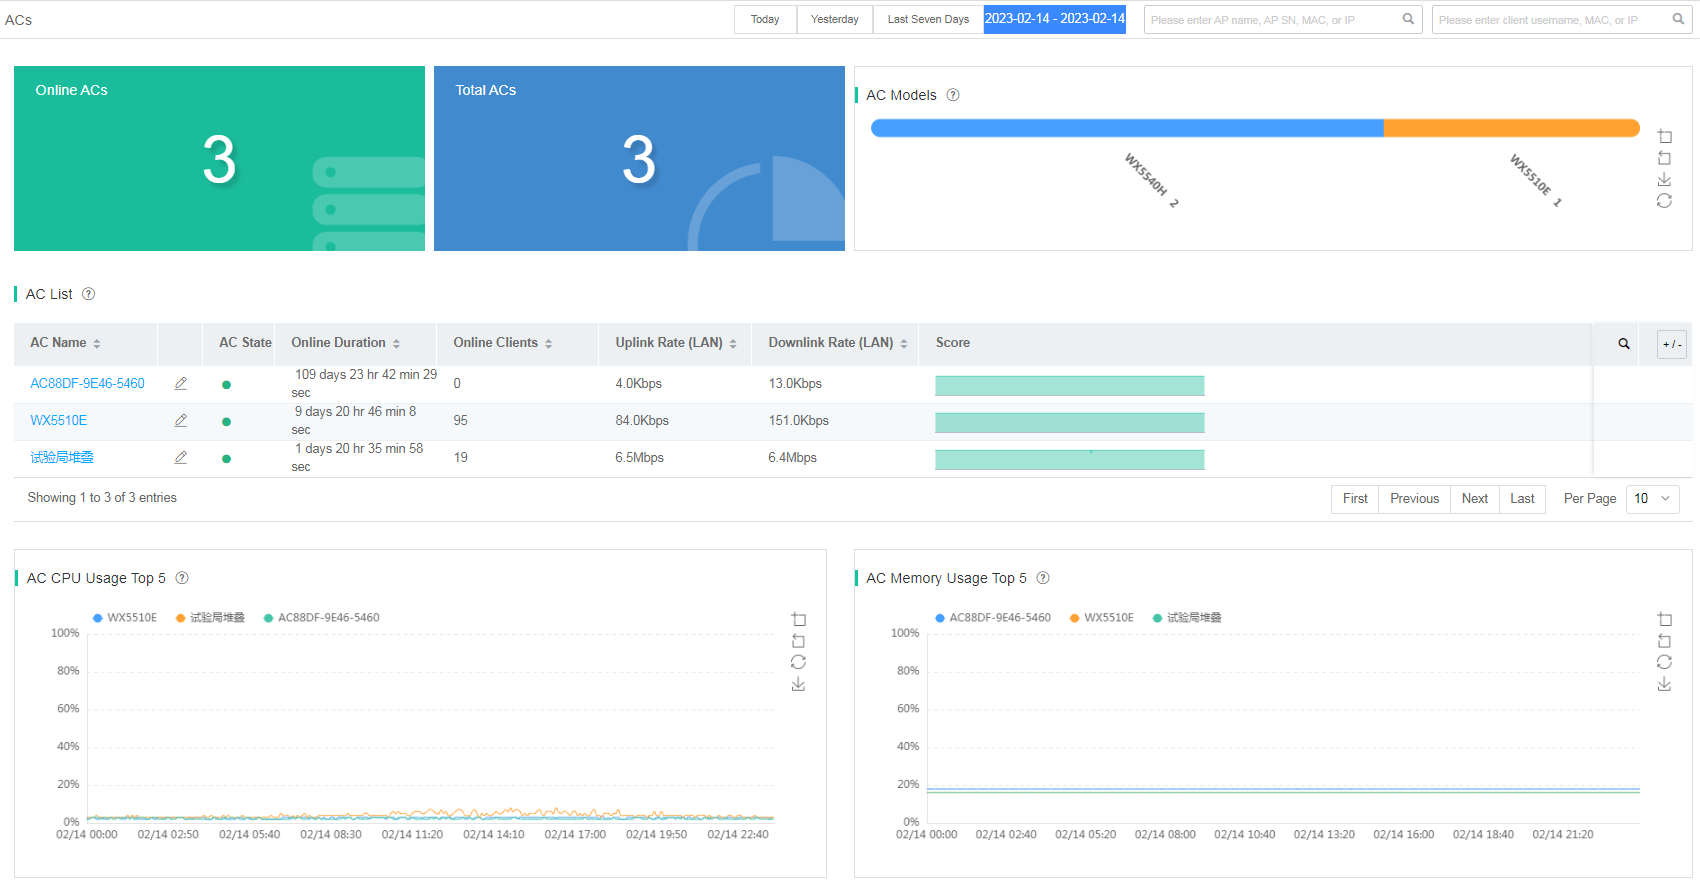
AC summary
The AC summary displays the following information:
· Statistics—Online ACs, total ACs, AC models, and the number of ACs of each model.
· AC List—Information about all ACs at the current site, including AC name, AC state, online duration, uptime, total APs, online clients, port rate, and score. To display or not display items on the AC list, click <+/->, and then select the target items.
¡Uplink Rate (LAN)—Transmission rate of packets received on all LAN interfaces.
¡Downlink Rate (LAN)—Transmission rate of packets sent from all LAN interfaces.
¡Uplink Rate (WAN)—Transmission rate of packets sent from all WAN interfaces.
¡Downlink Rate (WAN)—Transmission rate of packets received on all WAN interfaces.
¡Score—Score of the AC at the current day.
· AC CPU Usage Top 5—Top 5 ACs with the highest CPU usage at the current site over a time range.
· AC Memory Usage Top 5—Top 5 ACs with the highest memory usage at the current site over a time range.
Figure 85 AC summary
AC details
To view AC details, use the following methods:
· Method 1
a. Click Smart O&M on the top navigation bar, and then select Network > ACs from the left navigation pane.
b. Click the name of an AC on the AC list.
· Method 2
a. Click Smart O&M on the top navigation bar, and then select Network > APs > Health from the left navigation pane.
b. Click the name of an AC associated with an AP in the Health Details area.
· Method 3
a. Click Smart O&M on the top navigation bar, and then select Network > APs > AP Statistics from the left navigation pane.
b. Click the name of an AC associated with an AP in the Online AP List area.
The AC details page displays the following information:
· Basic AC Info—AC name, MAC, SN, model, software version, and reason for the last reboot.
If an AC forms an IRF fabric with other ACs, the MAC, SN, and reason for the last reboot fields have multiple values.
· AC Capabilities—Maximum numbers of APs and clients supported by the AC, and license information for the AC.
· AC Score—Score of the AC over a time range. If the score is not 100, the score deduction reason and the deducted points are displayed. ACs are graded based on CPU usage, memory usage, inbound and outbound traffic, and alarms.
· CPU Usage—CPU usage of the AC over a time range, including maximum, average, and minimum CPU usage.
· Memory Usage—Memory usage of the AC over a time range, including maximum, average, and minimum memory usage.
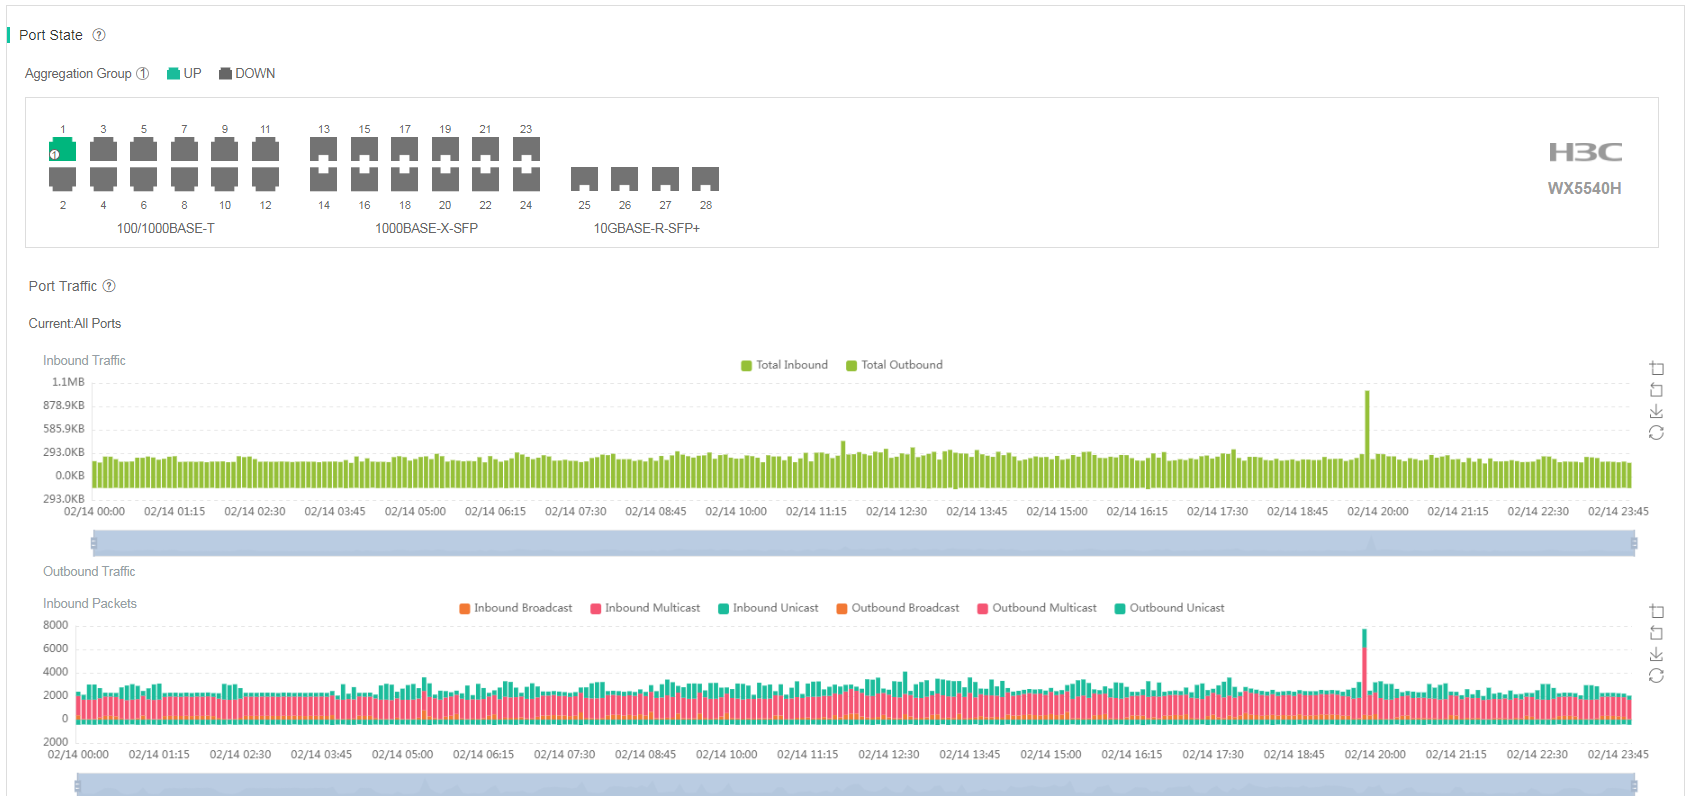
· Port State—Real-time port state. To view the inbound and outbound rates of a port, hover over that port. The outbound rate is the actual transmission rate divided by the negotiated rate on the port and the inbound rate is the actual receiving rate divided by the negotiated rate on the port.
· Port Traffic—Inbound and outbound traffic and packet statistics on the specified port over a time range. The system can collect unicast, multicast, and broadcast statistics respectively.
Figure 86 AC details (1)
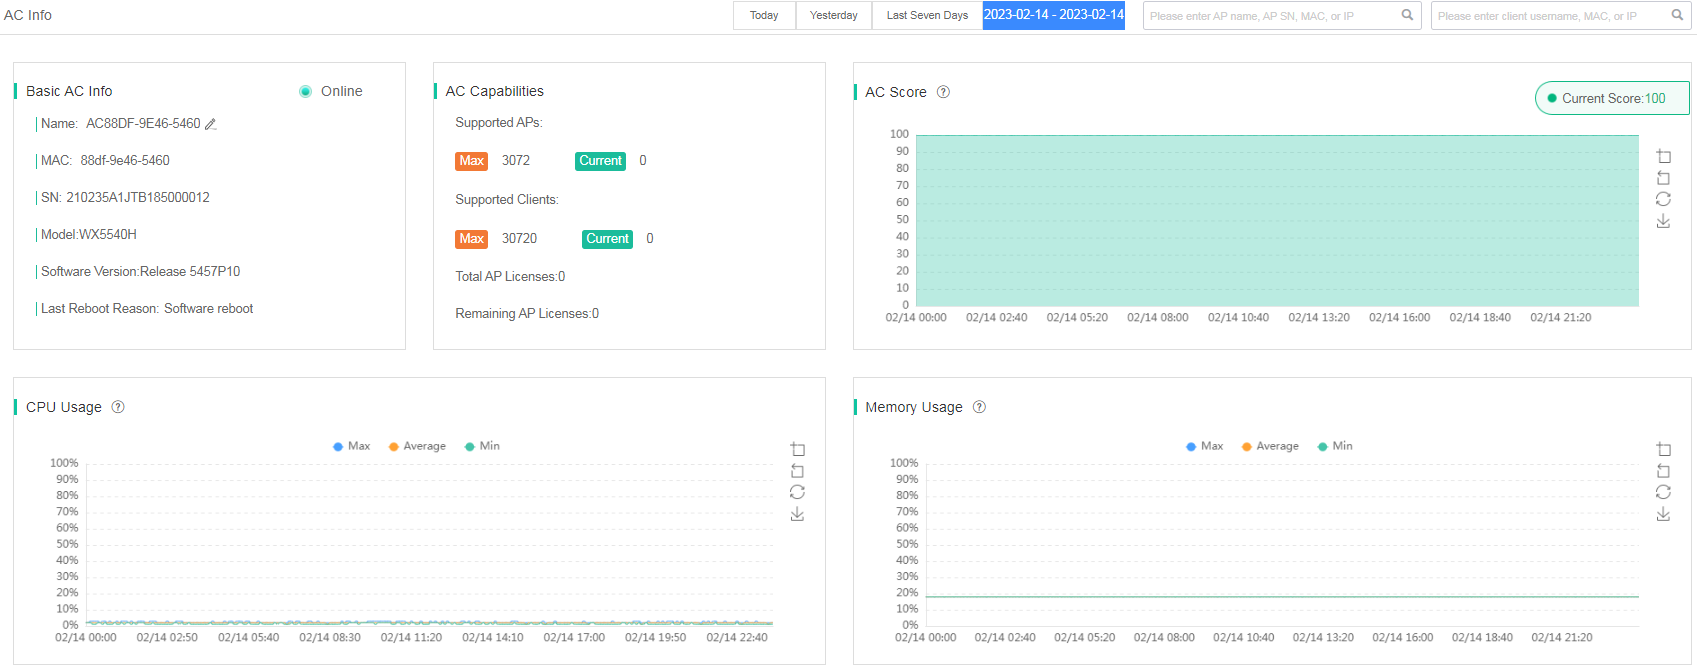
Figure 87 AC details (2)
Issues
Issue analysis
Issue analysis displays issues detected on clients or APs at the current site over a time range, such as client access, roaming, and network environment, allowing you to analyze the issues and take actions accordingly.
|
Category |
Sub category |
Reference |
|
Dashboard |
N/A |
|
|
Association |
· Slow access · Access failure · 5G not preferred · Access error |
|
|
Authentication |
· 802.1X authentication failure · Packet exchange failure in 802.1X authentication · Slow 802.1X authentication · Slow MAC authentication · MAC authentication failure · Packet exchange failure in MAC authentication · Portal authentication failure |
|
|
IP |
· IP acquisition failure · IP acquisition timeout · Slow IP acquisition |
|
|
Roaming |
· Ping pong roaming · Sticky client |
|
|
Wireless signal |
Weak signal |
|
|
Access failure |
· Insufficient radio resource · No ARP response from gateway · DNS resolution failure |
|
|
Slow response |
· Low rate · Low negotiated rate · Hibernation error · Large ARP traffic |
|
|
Wireless condition |
· Too many clients · Severe interference · High channel usage · Large ratio of multicast packets · High packet loss rate · High retransmission rate |
|
|
Device |
· AP offline · Device offline · High CPU usage · High memory usage · High CPU usage in forwarding |
Alarms
The system provides a full range of device monitoring and alarming mechanisms, abundant alarm items, and it supports custom alarm parameters and flexible alarm policies. You can view alarms generated on all devices at a site at the current day to gain insight into system failures and take actions accordingly based on the alarm severity.
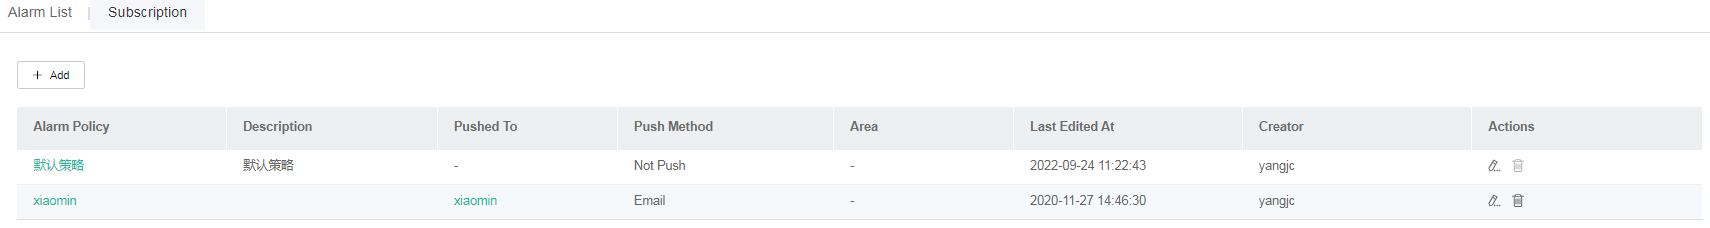
Subscribe to alarms
1. Click Smart O&M on the top navigation bar, and then select Issues > Alarms from the left navigation pane.
2. Click the Subscription tab.
3. To add an alarm policy, click Add and then configure policy settings as needed.
4. To edit an alarm policy, click the Edit icon ![]() in
the Actions column for that policy. Then, configure policy settings as needed.
in
the Actions column for that policy. Then, configure policy settings as needed.
5. To delete an alarm policy, click the Delete icon ![]() in
the Actions column for that policy. The default alarm policy cannot be deleted.
in
the Actions column for that policy. The default alarm policy cannot be deleted.
Figure 88 Subscribing to alarms
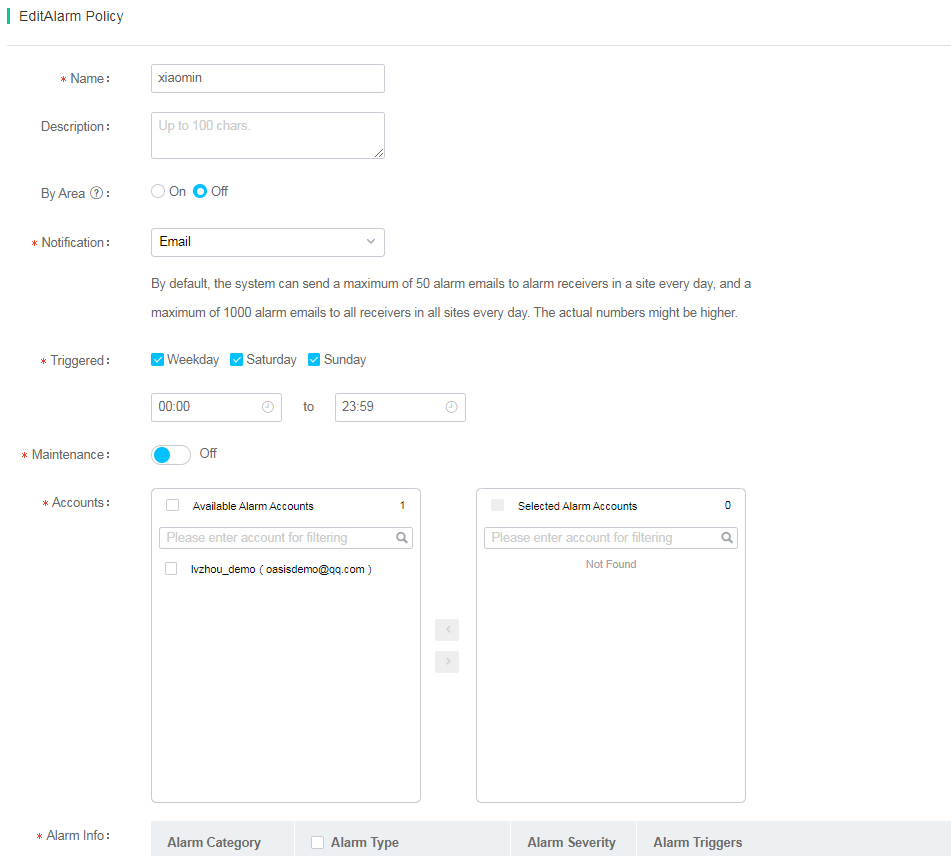
On the page for adding or editing an alarm policy, you can configure the following parameters:
· By Area—Enable or disable alarm generation by area. After you enable this function, the system generates alarms only for devices in the selected areas. High channel usage and large access client quantity alarms can be generated by area.
· Notification—Select an alarm notification method. Options include WeChat, WeCom, Dingding, SMS, Email, and Display but Not Push.
· Triggered: Select the time during which alarms can be notified.
· Maintenance—Select a time range within which alarm notification or generation is forbidden, and then select Generate alarms but not push alarms or Do not generate alarms.
· Info Sync—With info sync enabled, the system adds CPU usage, memory usage, channel usage, and online client quantity to the log for the following types of logs: high channel usage, too many access clients, high AP CPU usage, high AP memory usage, high transmission latency on radios, high retransmission rate on radios, and high packet loss rate on radios.
· Alarm Info—Alarm categories such as device state, device operation, smart O&M, router, autodeploy, security, clients, fault reports, and Doctor AP. Each category is divided into multiple sub categories. You can select types and severity levels of alarms to be notified and can change the alarm severity level.
Figure 89 Configuring an alarm policy
Alarm list
To view the alarm list, click Smart O&M on the top navigation bar, and then select Issues > Alarms from the left navigation pane. You are placed on the Alarm List tab, where you can view the following information:
· Trend—Alarm quantity trend at the site over a time range.
· Severity—Numbers of generated and cleared alarms of each severity level at the site over a time range.
· Type Top 5—Top 5 alarm types by alarm quantity at the site over a time range.
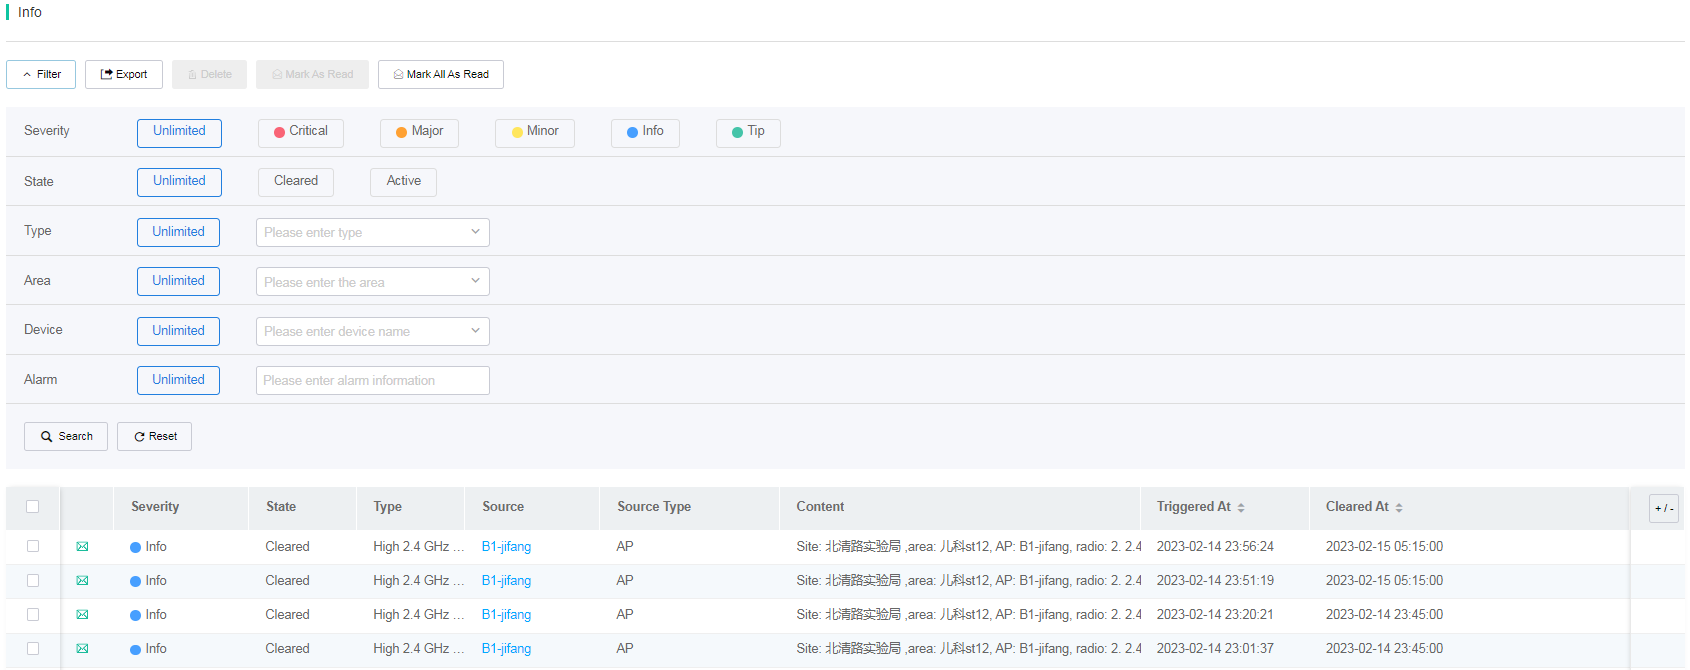
· Info—Detailed information about all alarms generated over a time range at the current site. To process the alarms, contact Technical Support.
¡You can filter alarms by severity level, alarm removal state, alarm type, alarm area, and device where alarms are generated. In addition, you can export alarms as CSV files.
¡ To mark specific alarms as read, select the alarms, and then click Mark as Read. To mark all alarms as read, click Mark All as Read.
¡ To view detailed information about a device, click the device name on the list.
Figure 90 Alarm list (1)
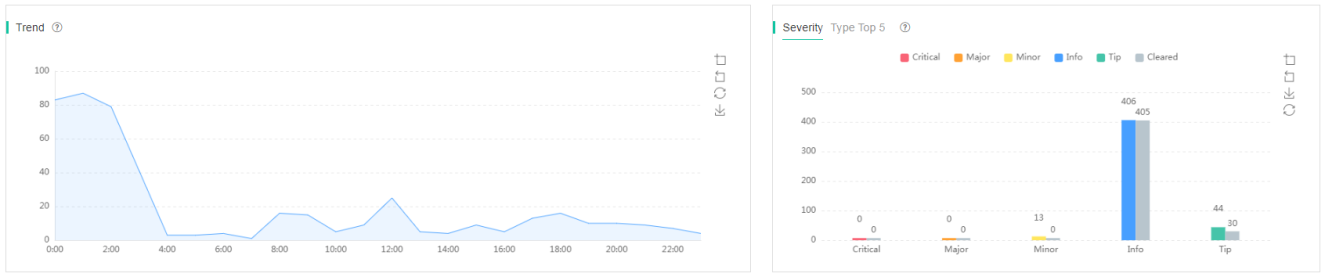
Figure 91 Alarm list (2)
Deep analysis
Deep analysis digitizes and visualizes the message interaction process during client access. Deep analysis shows the process that a wireless client goes through when using the network, including wireless access, user authentication, IP address application, ARP detection, DNS detection, and data traffic transmission, as well as the time consumption of each stage and server address. This helps users pinpoint network problems.
For more information about this feature, see "View packet interaction for client access."
WLAN security
WLAN security enables deployment of detecting APs on the network to detect behaviors or devices that threat network security, interfere with network services, and affect network performance. Wireless security provides a rich set of defense policies, and supports 20 detection items and 11 countermeasure policies. You can view the detection results on the Smart O&M > Security page.
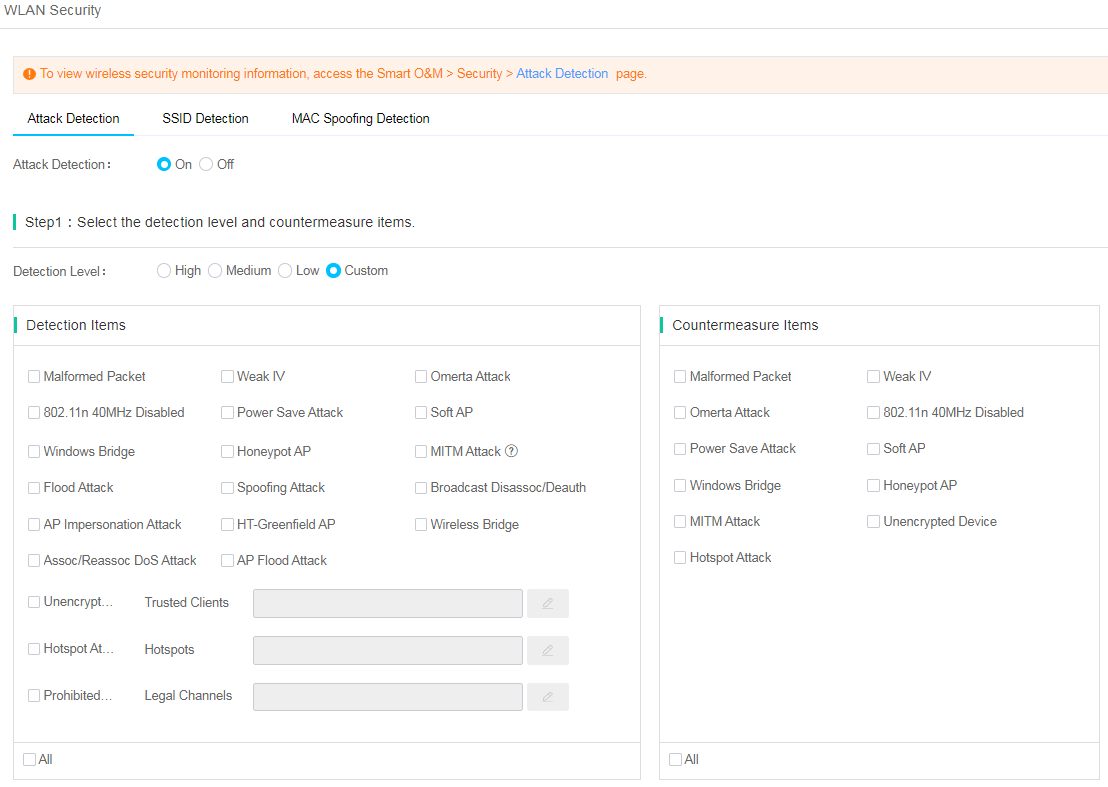
Attack detection
Attack detection enables you to detect attacks such as malformed packets, flooding, and honeypot AP and take countermeasures against rogue devices.
1. Click Network on the top navigation bar, and then select Settings > ACs > WLAN Security from the left navigation pane.
2. Click the Attack Detection tab.
3. Enable attack detection.
4. Specify the detection level.
¡ If
you specify High, Medium,
or Low for the detection level, the system provides predefined detection items. The ![]() icon represents that the detection item supports countermeasures.
icon represents that the detection item supports countermeasures.
¡ If you specify Custom for the detection level, configure the detection items and countermeasure items as needed.
Figure 92 Attack detection items
5. Select sensor APs. Select APs in the Available list and click the ![]() icon to add the APs to the Selected
list. You can select a maximum of 128 APs.
icon to add the APs to the Selected
list. You can select a maximum of 128 APs.
6. To view wireless security monitoring information, access the Smart O&M > Security > Attack Detection page.
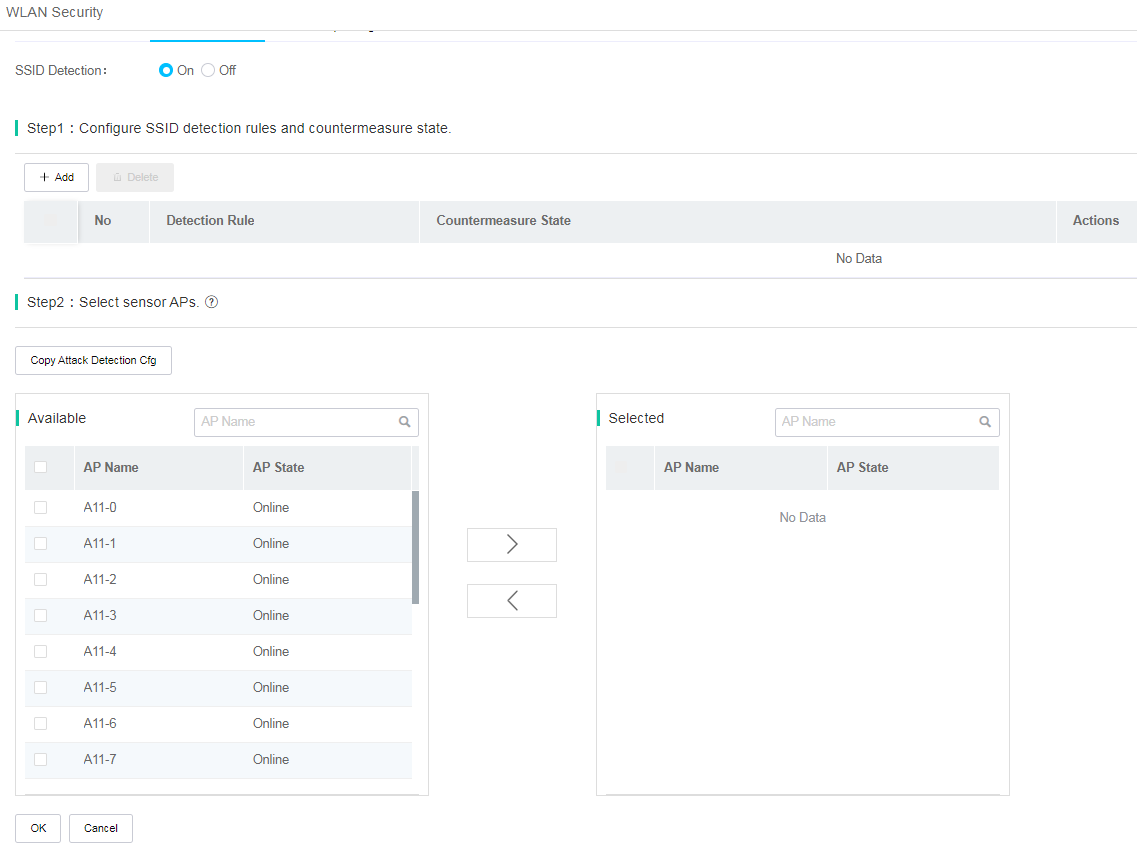
SSID detection
1. Click Network on the top navigation bar, and then select Settings > ACs > WLAN Security from the left navigation pane.
2. Click the SSID Detection tab.
3. Configure detection rules and countermeasure state. Click Add. In the window that opens, select an SSID rule or MAC rule, specify the matching criterion, and enable countermeasure as needed.
4. Select sensor APs. Select APs in the Available list and click the ![]() icon to add the APs into the Selected
list. You can select a maximum of 128 APs.
icon to add the APs into the Selected
list. You can select a maximum of 128 APs.
Figure 93 SSID detection
5. To view wireless security monitoring information, access the Smart O&M > Security > Attack Detection page.
MAC spoofing detection
1. Click Network on the top navigation bar, and then select Settings > ACs > WLAN Security from the left navigation pane.
2. Click the MAC Spoofing Detection tab.
3. Click Sync from Device to synchronize configured wireless services from the local device to Cloudnet.
4. To enable MAC spoofing detection for all wireless services, click Enable All. To enable MAC spoofing detection for a specific wireless service, click the enabling icon for that service.
Figure 94 MAC spoofing detection
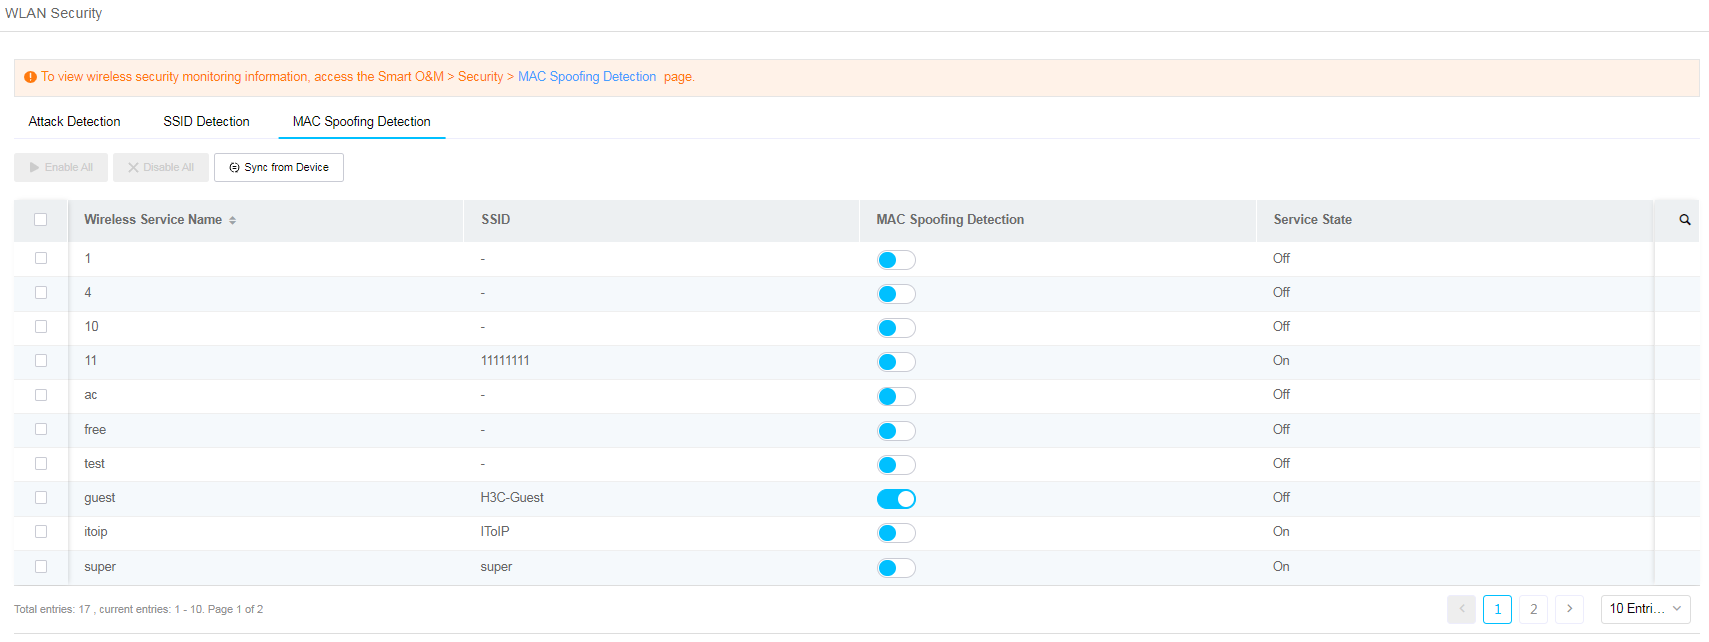
5. To view wireless security monitoring information, access the Smart O&M > Security > MAC Spoofing Detection page.
Doctor AP
Doctor AP is a diagnostic mode of an AP. In this mode, an AP can be simulated as a client to access an AP to fully experience the user's connection process. This helps O&M personnel to remotely diagnose network experience problems to achieve intelligent detection of the network.
|
|
NOTE: · Make sure the AC uses a R54XX version and the version number is R5442 or higher. · Make sure the AP version is R2442 or higher. Support for the Doctor AP feature varies by AP model. · Enabling Doctor AP on an AP affects wireless services provided by the AP. |
Doctor AP tests
In the left navigation pane, select Advanced > Doctor APs > Tests.
Auto test
Perform this task to perform network-side tests for critical networks. Before performing an auto test, click Sync to synchronize data.
· Add Auto Test Item: Configure an auto test task.
Table 6 Auto test description
|
Field |
Description |
|
Select AC |
Select an AC by its name. |
|
APs to Be Tested |
Specify APs to be tested by SSID. Options include: · All APs Bound to SSIDs: If you select this option, the system selects a maximum of 128 online APs automatically. · Specified APs: You can specify a maximum of 128 APs. |
|
SSIDs Under Test |
Specify SSIDs to be tested. You can specify a maximum of three SSIDs. |
|
Diagnosis Items |
Diagnosis items. Options include: · Default Settings: Use the system-defined diagnosis items. · Custom Settings: Specify user-defined diagnosis items. |
|
Set Critical APs |
When an AP is selected as a Doctor AP, clients connected to the AP are logged off. You can specify critical APs excluded from Doctor AP selection in this field. To view or configure critical APs, click View Critical APs. |
|
Doctor AP Selection Policy |
Specify the Doctor AP selection policy. Options include: · Default Policy: Select APs with no client connected as Doctor APs. If all APs have connected clients, the system selects APs with 10 MB or less uplink and downlink traffic within the past hour as Doctor APs. If no APs meet the requirements, the system skips the test. · Custom Policy: Specify the maximum number of connected clients and maximum traffic in the past hour. The system selects an AP as a Doctor AP only when the number of connected clients and traffic in the past hour on the AP are lower than the specified thresholds, respectively. |
|
Time Settings |
Select the test execution time. Options include: · Run Now: Execute the test immediately after you click OK. · One-Off: Execute the test once at the specified time point. · Scheduled: Execute the test periodically as scheduled during the specified time range. |
· Details: To view or modify the details of an auto test task, click the details icon in the Actions column for the task.
· Test Result: To view the result of an auto test task, click the result icon in the Actions column for the task.
· Suspend Task: To suspend an ongoing test task, click the suspend icon in the Actions column for the task.
· Delete: To delete a task, click the delete icon in the Actions column for the task.
· Bulk Delete: To delete auto test tasks in bulk, select the tasks, and then click Bulk Delete.
Manual test
Perform this task to perform a network-wide test for a single network . Before performing a manual test, click Sync to synchronize data.
· Add Manual Test Item: Add a manual test task.
Table 7 Manual test description
|
Field |
Description |
|
Doctor AP Mode |
· Intelligent: Enable the system to automatically select Doctor APs. ¡ Set Critical AP: When an AP is selected as a Doctor AP, clients connected to the AP are logged off. You can specify critical APs excluded from Doctor AP selection in this field. To view or configure critical APs, click View Critical APs. ¡ Select AP Under Test: Specify the AC, AP, and radio to be tested. ¡ Signal: Specify the SSID to be tested. · Manual: Specify a Doctor AP manually. ¡ Doctor AP Info: Select an online AP as the Doctor AP. ¡ WLAN Access: Specify the SSID, AP, and radio for the test. |
|
Doctor AP Selection Policy |
This field is available only in intelligent mode. Specify the Doctor AP selection policy. Options include: · Default Policy: Select APs with no client connected as Doctor APs. If all APs have connected clients, the system selects APs with 10 MB or less uplink and downlink traffic within the past hour as Doctor APs. If no APs meet the requirements, the system skips the test. · Custom Policy: Specify the maximum number of connected clients and maximum traffic in the past hour. The system selects an AP as a Doctor AP only when the number of connected clients and traffic in the past hour on the AP are lower than the specified thresholds, respectively. |
|
Test Item Settings |
Configure the test items. · Default: Use the system-defined test items. · Custom: Specify user-defined diagnosis items. |
· Details: To view or modify the details of a manual test task, click the details icon in the Actions column for the task.
· Test Result: To view the result of a manual test task, click the result icon in the Actions column for the task.
· Suspend Task: To suspend an ongoing test task, click the suspend icon in the Actions column for the task.
· Delete: To delete a task, click the delete icon in the Actions column for the task.
· Bulk Delete: To delete manual test tasks in bulk, select the tasks, and then click Bulk Delete.
Summary
Perform this task to view the test result statistics for tests performed in the specified time range.
· Test Result: Numbers of successful tests and failed tests.
· Test Statistics: Numbers of wireless access successes, wireless access failures, network connection successes, network connection failures, application test successes, and application test failures.
· Auto Test Result: Displays auto test records.
¡ To display only failure records, enable Show Failures Only.
¡ The list contains the following information: test start time, test end time, AC, SSID, test state, and result. If the test state is Testing, no test result is displayed. To filter the test records, click the query icon. Records in the list are sorted by test start time.
¡ To
expand information about a test record, click the right chevron icon ![]() for
the record. The detailed information include the test time, SSID, AP, radio ID,
Doctor AP name, Doctor AP model, Doctor AP MAC address, test state, and test
details. To view the details, click the details link.
for
the record. The detailed information include the test time, SSID, AP, radio ID,
Doctor AP name, Doctor AP model, Doctor AP MAC address, test state, and test
details. To view the details, click the details link.
¡ The system saves a test record for 7 days and automatically deletes the record after 7 days.
· Manual Test Result: Displays manual test records.
¡ To display only failure records, enable Show Failures Only.
¡ The list contains the following information: test start time, test end time, AC, Doctor AP, radio, test state, and result. If the test state is Testing, no test result is displayed. To filter the test records, click the query icon. Records in the list are sorted by test start time.
¡ To
expand information about a test record, click the right chevron icon ![]() for
the record. The detailed information include the test time, SSID, AP, radio ID,
Doctor AP name, Doctor AP model, Doctor AP MAC address, test state, and test
details. To view the details, click the details link.
for
the record. The detailed information include the test time, SSID, AP, radio ID,
Doctor AP name, Doctor AP model, Doctor AP MAC address, test state, and test
details. To view the details, click the details link.
¡ The system saves a test record for 7 days and automatically deletes the record after 7 days.
Critical APs
When an AP is selected as a Doctor AP, clients connected to the AP are logged off. You can specify critical APs excluded from Doctor AP selection.
To view critical AP information and manage critical APs, navigate to Advanced > Doctor APs > Critical APs.
· AP List
Display information about all APs in the site, including AP state, number of online clients, version, and AC. To specify APs as critical APs, select the APs and then click Configure As Critical AP.
· Critical AP List
Display information about all critical APs in the site, including AP state, number of online clients, version, and AC. To remove critical APs, select the APs and then click Delete.
Maintenance
The system provides a set of O&M tools for you to locate issues and increase O&M efficiency.
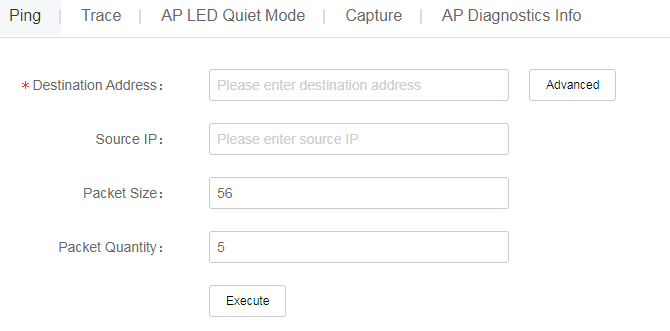
Ping
Use the ping utility to determine if an address is reachable.
To use the ping tool:
· Method 1
Click Network on the top navigation bar, and then select Maintain > Tools from the left navigation pane.
· Method 2
a. Click Network on the top navigation bar, and then select Monitor > ACs > Summary from the left navigation pane.
b. Click the Tools tab.
c. Select the ping tool.
To perform a ping operation, enter the destination address, and then click Execute on the Ping tab. To use the advanced ping function, click Advanced, specify the destination IP address, source IP address, packet size, and packet quantity, and then click Execute. The ping results will be displayed on the execution result list.
Figure 95 Ping tool
To view details about a successful ping operation, click View Details in the View Details column for that ping operation. To view the details in a graph, click Graph View. To view the details in a table, click Table View.
Trace
Tracert enables retrieval of the IP addresses of Layer 3 devices in the path to a destination.
To use the tracert tool:
· Method 1
a. Click Network on the top navigation bar, and then select Maintain > Tools from the left navigation pane.
b. Click the Trace tab.
· Method 2
a. Click Network on the top navigation bar, and then select Monitor > ACs > Summary from the left navigation pane.
b. Click the Tools tab.
c. Select the trace tool.
To perform a tracert operation, click the Trace tab, enter the destination address, and then click Execute. To use the advanced tracert function, click Advanced, specify the destination IP address, source IP address, destination port, initial TTL, max TTL, timeout, and packet quantity, and then click Execute. The tracert results will be displayed on the execution result list.
Figure 96 Trace tool
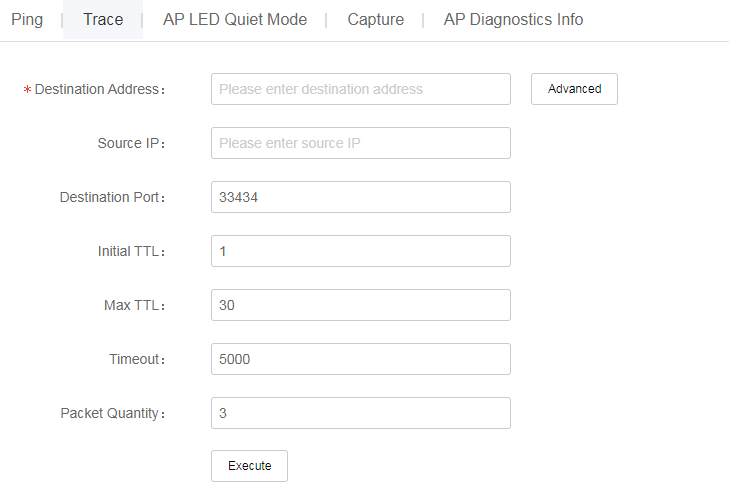
To view details about a successful tracert operation, click View Details in the View Details column for that tracert operation. To view the details in a graph, click Graph View. To view the details in a table, click Table View.
Packet capture
Packet capture is available only for fit APs associated with an AC.
To use the packet capture tool:
· Method 1
a. Click Network on the top navigation bar, and then select Maintain > Tools from the left navigation pane.
b. Click the Capture tab.
Figure 97 Using the packet capture tool
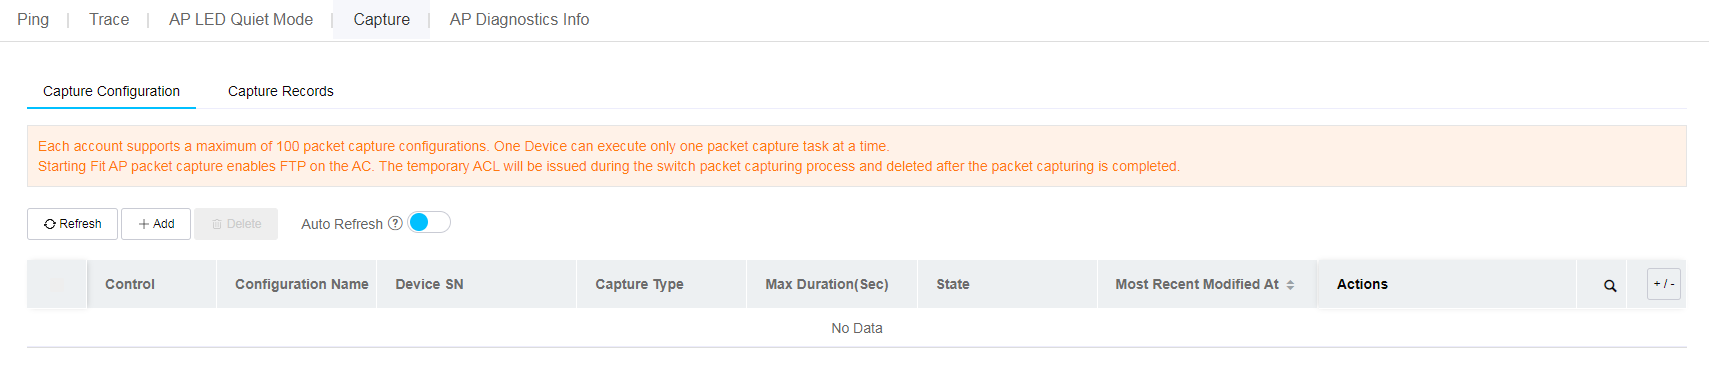
· Method 2
Click Smart O&M on the top navigation bar, and then access the AP radio information page. Click Capture to capture packets. For how to access the AP radio information page, see "AP radio information."
Figure 98 Using the packet capture tool
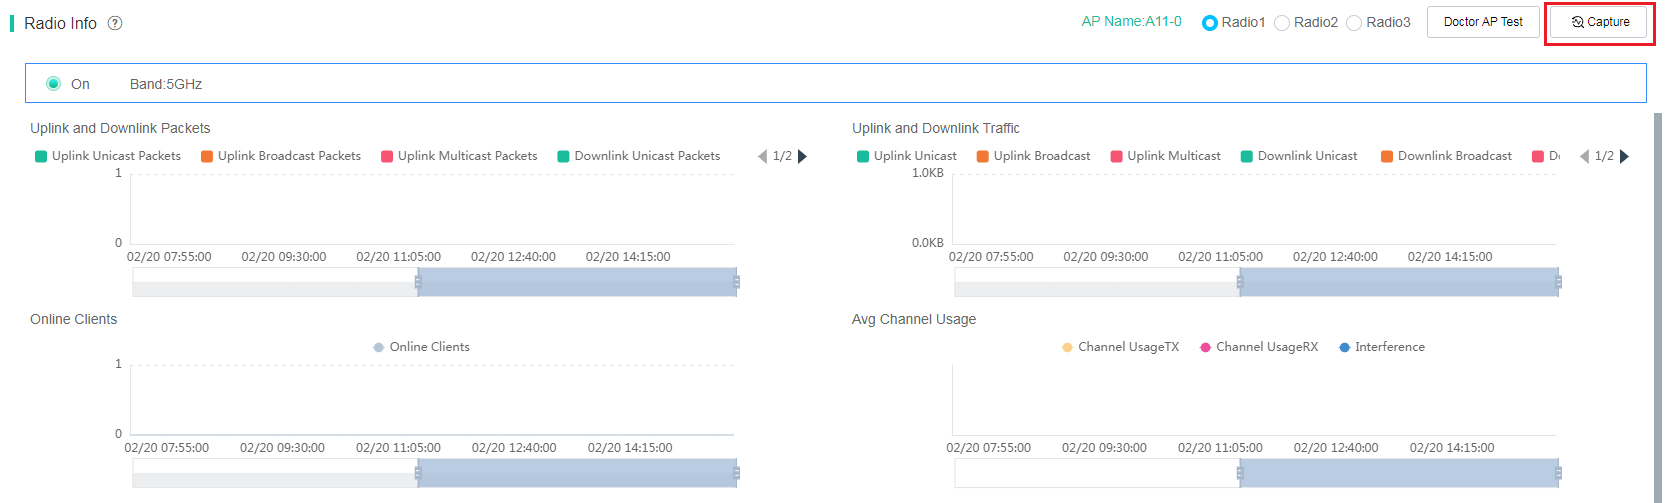
To add a packet capture configuration, click Add on the Capture Configuration tab and then configure the following parameters.
· Configuration Name—Specify a name for the packet capture configuration.
· Capture Type—The default is Use Fit AP.
· Capture Mode—Only Mirroring is available. In this mode, the system captures only packets transmitted on the current working channel, without wireless service interruption.
· AP—Click this field to select an AP, or click Advanced Filter to select an AP, and then click OK.
· Radio—Select a radio on the AP.
· Channel—The system automatically selects the working channel of the AP after you select a radio on the AP.
· Duration—Specify the packet capture duration. Packet capture stops automatically when the maximum capture duration is reached or the total size of captured packets exceeds 65536 KB.
· Filter Rule—Specify a filter rule. For more information, see the description to the right of this field.
To save the configuration only, click Save. To save the configuration and start packet capture, click Save and Start.
Figure 99 Configuring packet capturing
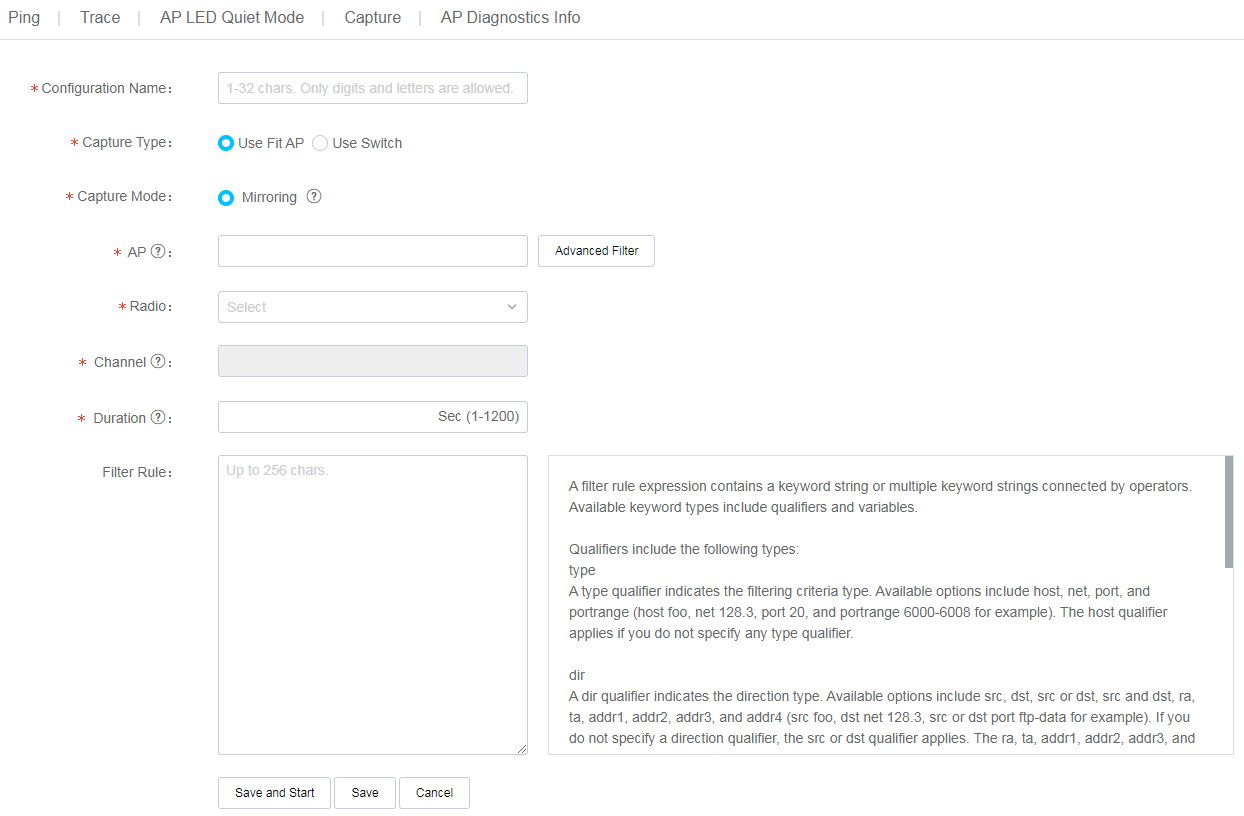
On the Capture Configuration tab, you can view the packet capture state.
To view packet capture records, click the Capture Records tab. To download a capture record, click
the Download icon ![]() in
the Actions column for that record.
in
the Actions column for that record.
Figure 100 Packet capture records
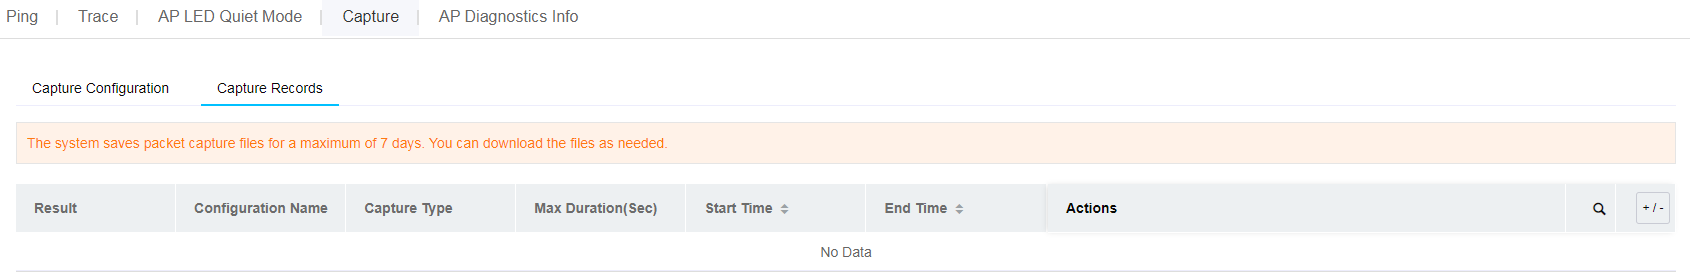
CLI helper
To access the CLI helper:
· Method 1
Click Network on the top navigation bar, and then select Maintain > CLI Helper from the left navigation pane.
· Method 2
a. Click Network on the top navigation bar, and then select Network > Devices from the left navigation pane.
b. Select a device, and then click the CLI Helper button.
Figure 101 Accessing the CLI helper (method 2)
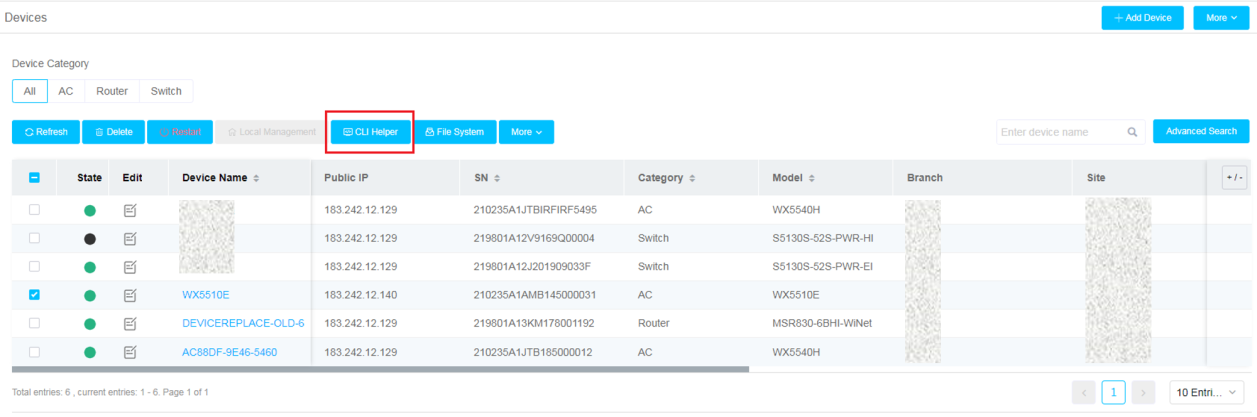
· Method 3
a. Click Network on the top navigation bar, and then select Network > Devices from the left navigation pane.
b. Click the name of a device, and then click the CLI Helper button on the page that opens.
Figure 102 Accessing the CLI helper (method 3)
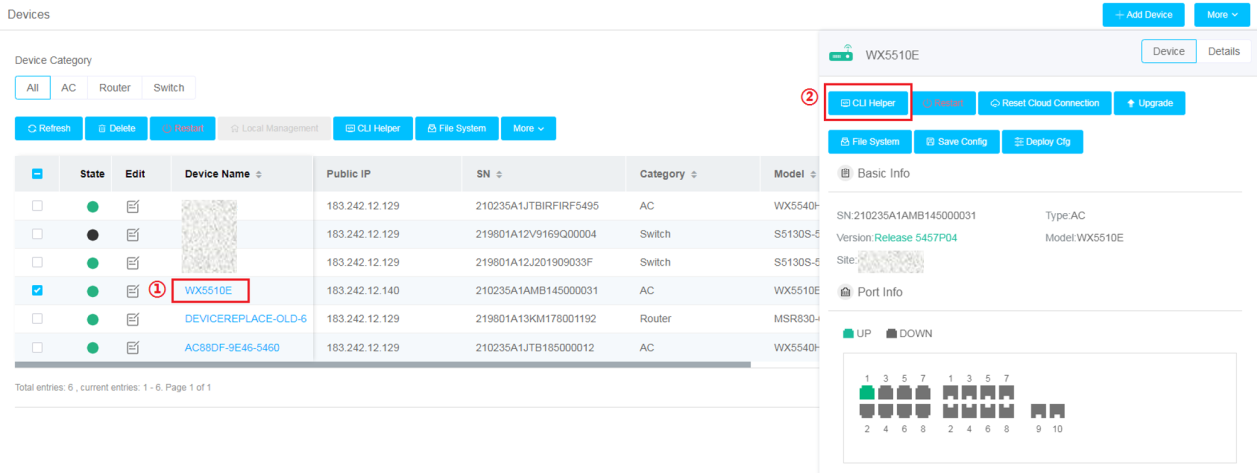
· Method 4
a. Click Network on the top navigation bar, and then select Monitor > ACs > Summary from the left navigation pane.
b. Click the CLI Helper button.
c. Enter the username and password.
Figure 103 Accessing the CLI helper (method 4)
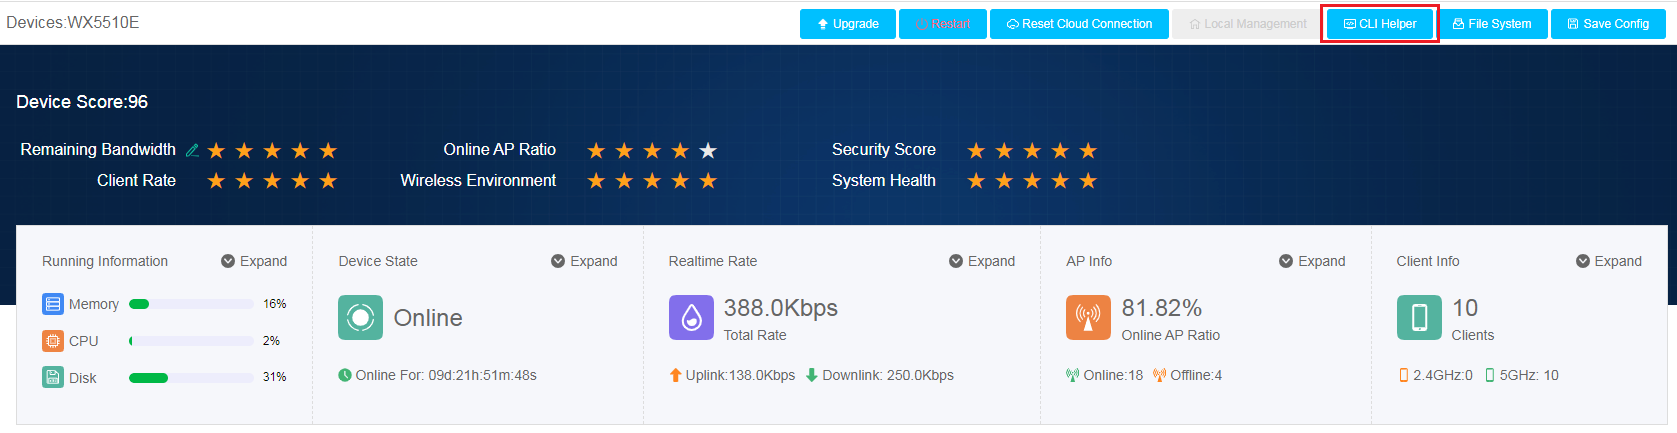
Using the CLI helper to access a device is more continent. In a complicated network that requires VPN operations or many jump operations, the CLI helper can issue commands to the device through Cloudnet. This saves time and improves efficiency.
To use the CLI helper:
· To use this function, please first enable the Telnet service on the device and set the user name and password with high security. The initial weak password will not connect successfully.
· To view basic device information, network information, or monitoring information, click Basic Info, Network Info, or Monitoring Info in the Common Commands area to the right of the page.
· To set the cache size and export operation records, select Export Records.
Remote Web management
Remote Web management provides a shortcut to access the local Web interface of a device through Cloudnet.
To access the local Web interface of a device:
a. Click Network on the top navigation bar, and then select Network > Devices from the left navigation pane.
b. Select a device, and then click the Local Management button.
Figure 104 Accessing the local Web interface of a device (method 1)
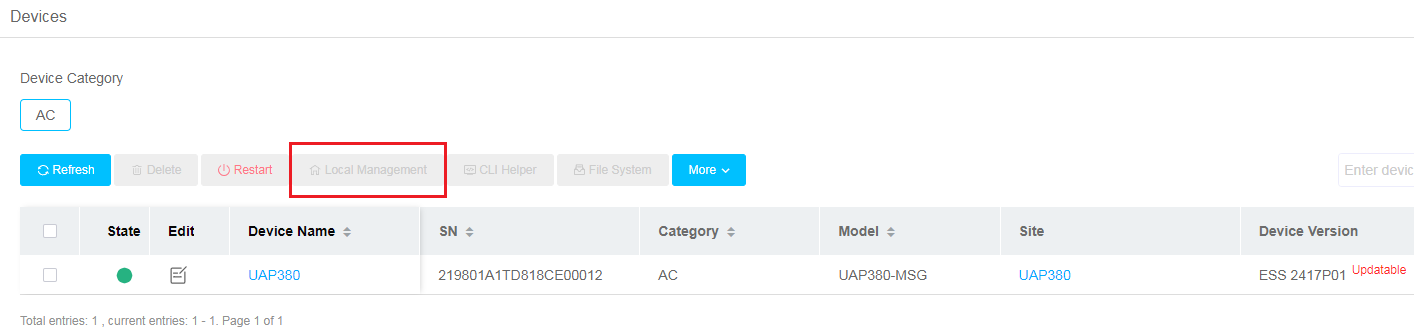
Fault reports
The system allows users to scan a QR code and report faults during network operation. You can perform this task to view, export, and processor the reported faults and configure fault report subscription.
Export the QR code for fault reporting
1. Click Network on the top navigation bar, and then select Messages > Fault Reports from the left navigation pane.
2. Click Export QR Code for Fault Reporting.
3. Select the site, and then click Export.
You can send the QR code to users or print the QR code and paste it in a wireless site for users to scan the QR code.
Figure 105 Export the QR code for fault reporting
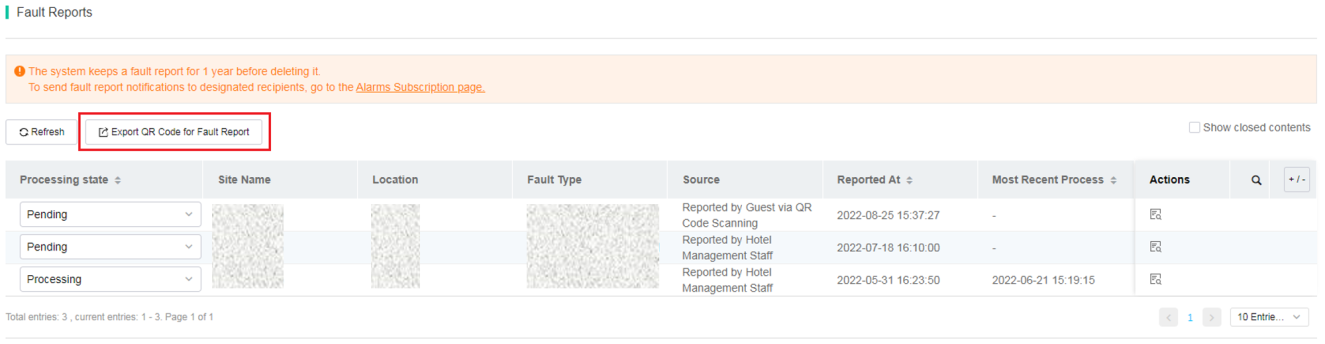
Perform alarms subscription
1. Click Network on the top navigation bar, and then select Messages > Fault Reports from the left navigation pane.
2. Click the Alarms Subscription link in the notes area.
For more information, see "Subscribe to alarms."
Figure 106 Alarms subscription
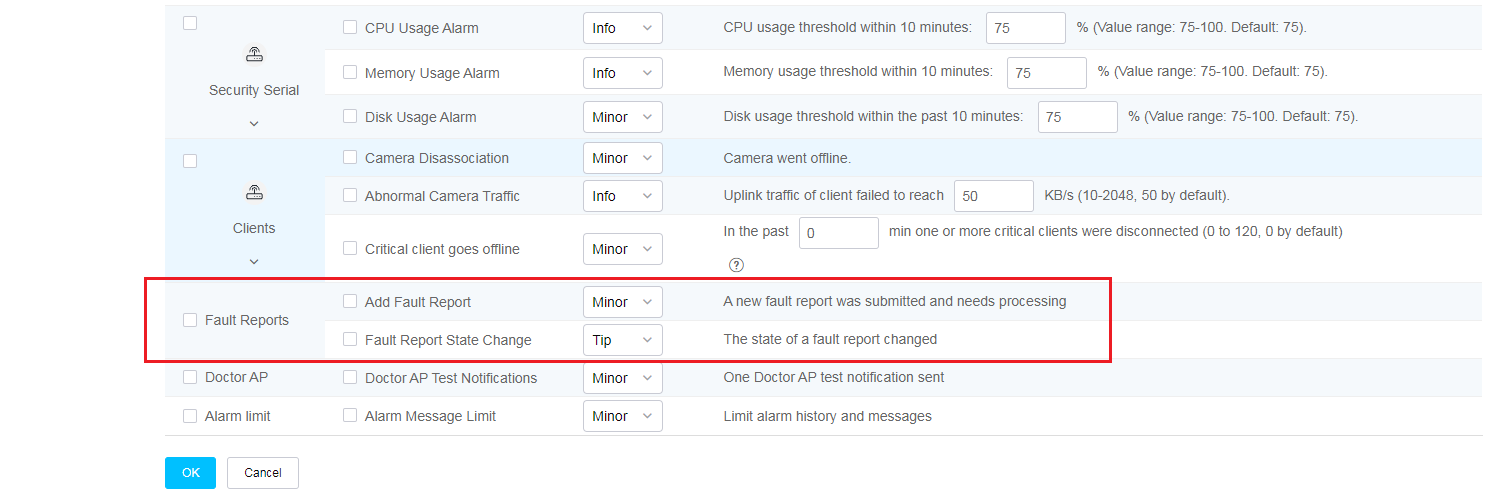
Report faults in real time
1. Use WeChat or other software to scan the QR code for fault reporting.
2. Fill in information as required, and then click Submit.
Figure 107 Reporting faults
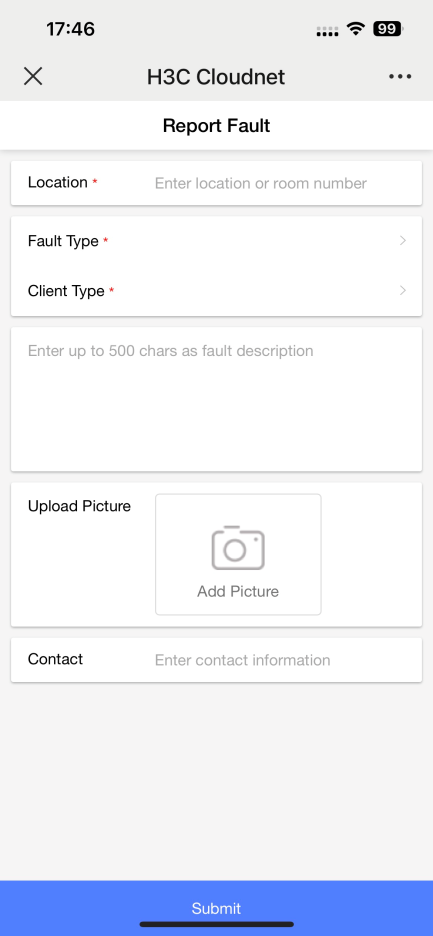
Process a fault report
1. Click Network on the top navigation bar, and then select Messages > Fault Reports from the left navigation pane.
2. To process a report on the fault report list, select a processing state for the report.
3. To process fault reports from the detailed information page:
Click the Details
icon ![]() for a fault report.
for a fault report.
Specify the processing state and fill in the processing record.
Click Submit.
Figure 108 Fault report list
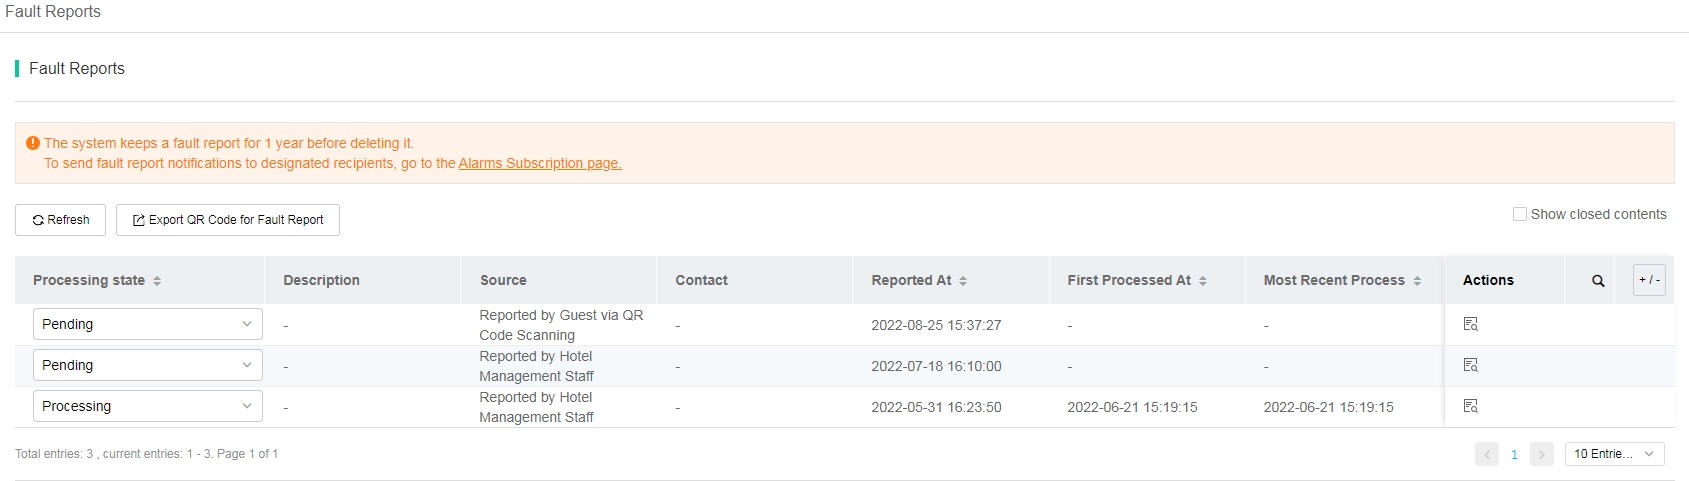
View detailed fault report information
1. Click Network on the top navigation bar, and then select Messages > Fault Reports from the left navigation pane.
The page that opens displays brief information about fault reports, including site name, location, fault type, source, report time, and time of the most recent process.
2. Click the Details icon ![]() for
a fault report.
for
a fault report.
The page that opens displays detailed information about the report. You can specify the processing state and fill in the processing record for the report.
If you select Fault Report Processing State Change for alarms subscription, other administrators can also receive notifications to obtain report processing status.
Locate APs
The AP locating tool cannot locate offline APs or auto APs.
You can use the AP locating tool to locate the physical locations of cloud-managed APs.
To locate APs:
1. Click Network on the top navigation bar, and then select Monitor > ACs > Summary from the left navigation pane.
2. Select Locate APs from the Select Tool filed on the Tools tab.
3. Select an AP, and then click the Locate APs button.
4. Change the status of the LED for the AP, for example, to flashing.
5. Locate the AP in the actual physical site.
The LED status will restore to the previous default state after you leave the AP locating page.
Figure 109 AP locating tool
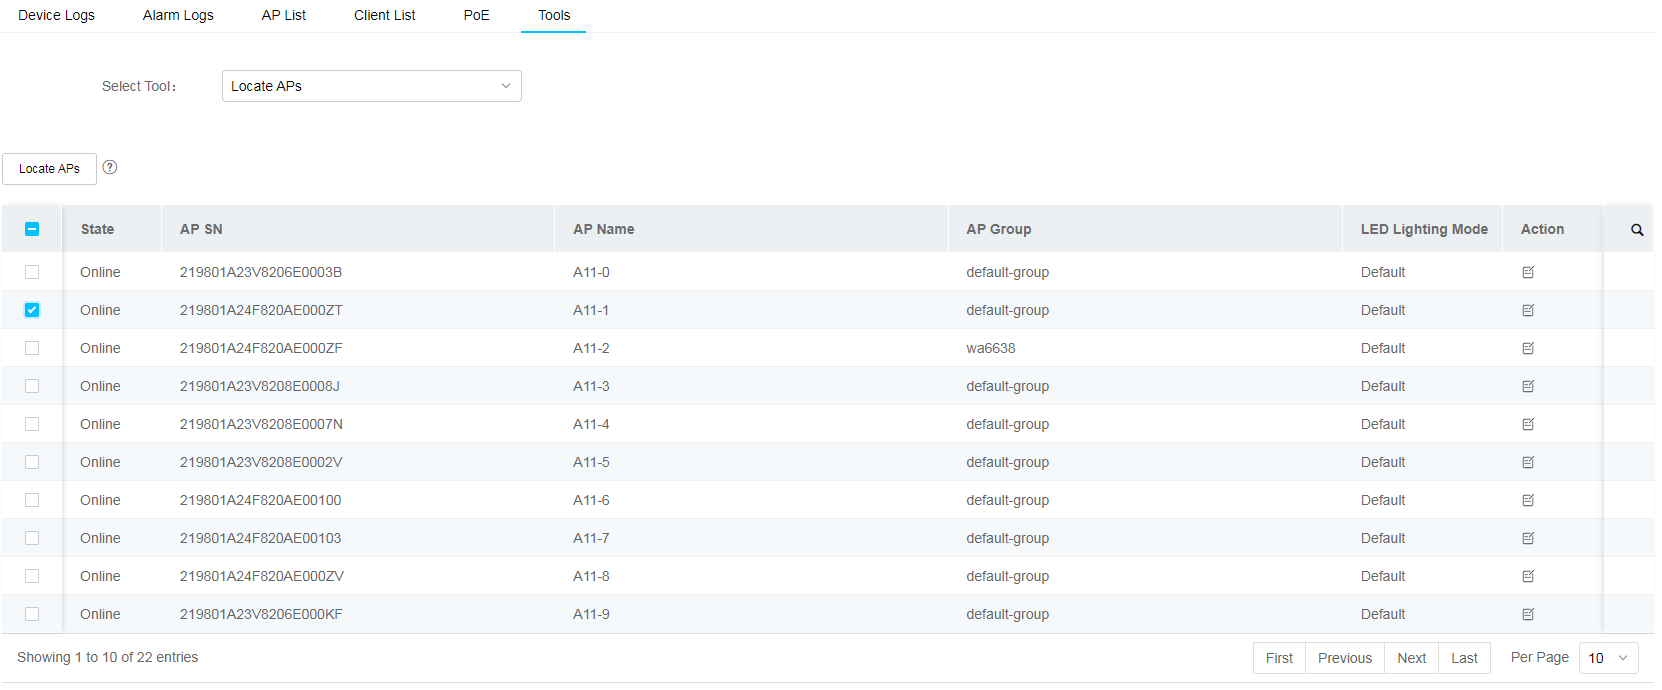
Schedule the AP reboot
1. Click Smart O&M on the top navigation bar, and then select Network > APs > AP Reboot from the left navigation pane.
2. Select APs in the AP List area.
3. Click the Scheduled Reboot button, and then configure the reboot time.
Figure 110 AP List area
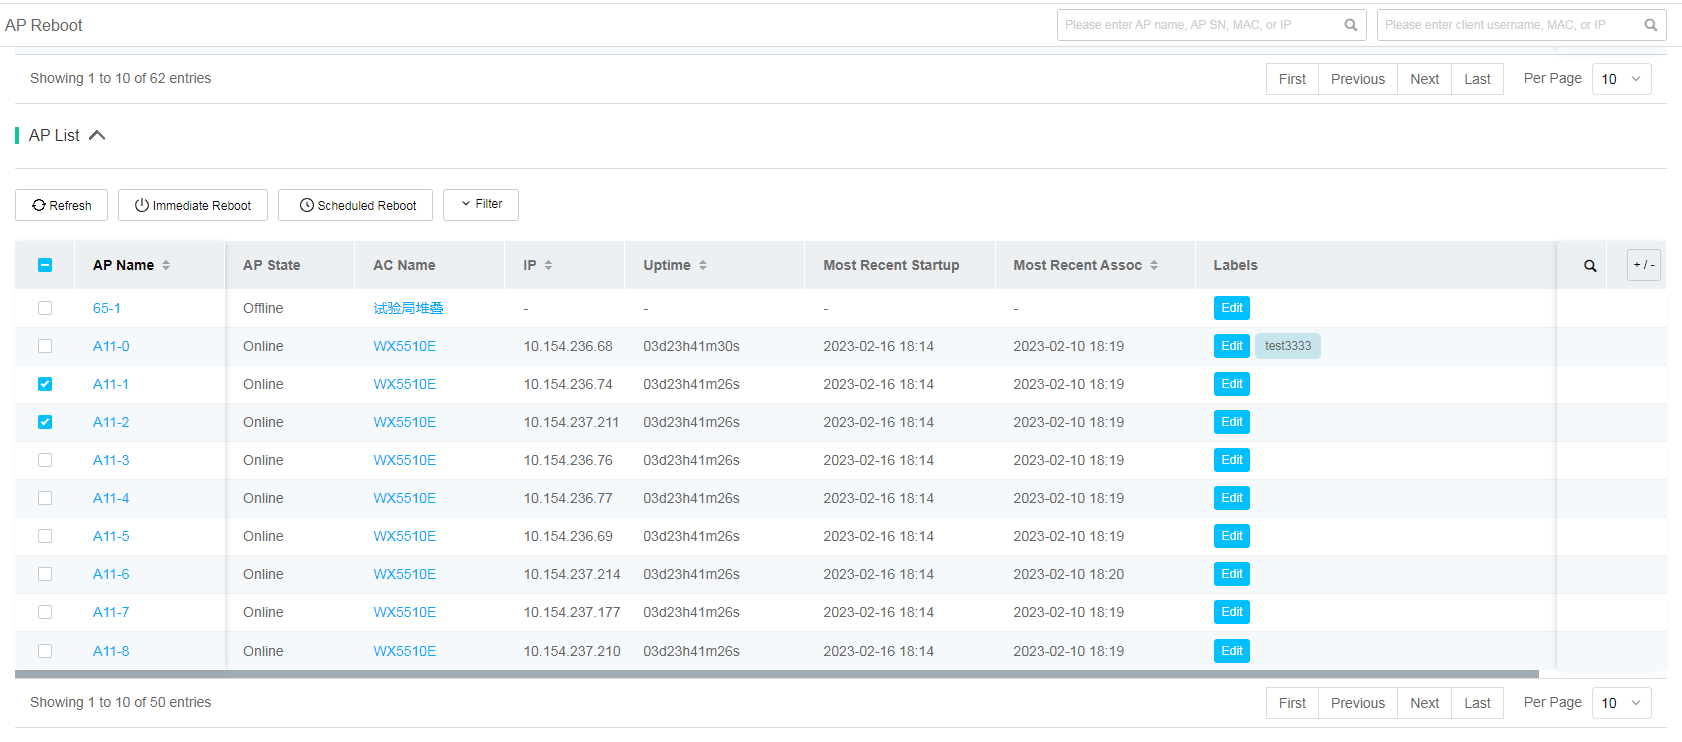
Figure 111 Configuring the reboot time
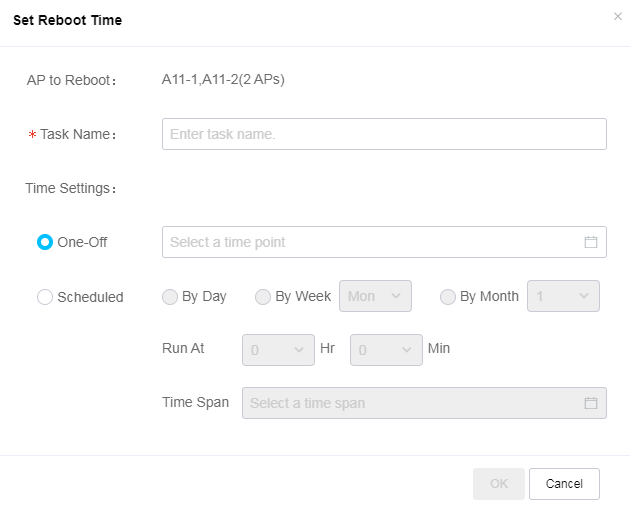
4. To filter APs, click Filter, select labels and an AP state.
Figure 112 Filtering APs
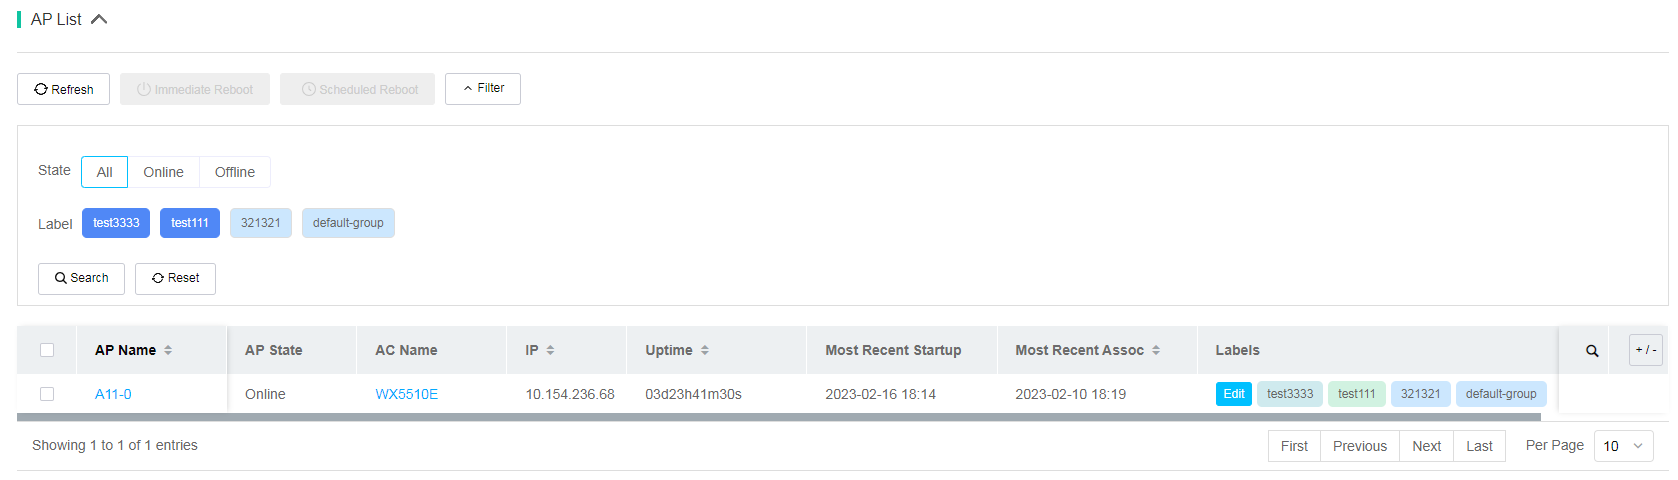
5. To view detailed information about scheduled AP reboot tasks, view the Task List or AP Reboot Task area on the AP Reboot page.
Figure 113 Task List area
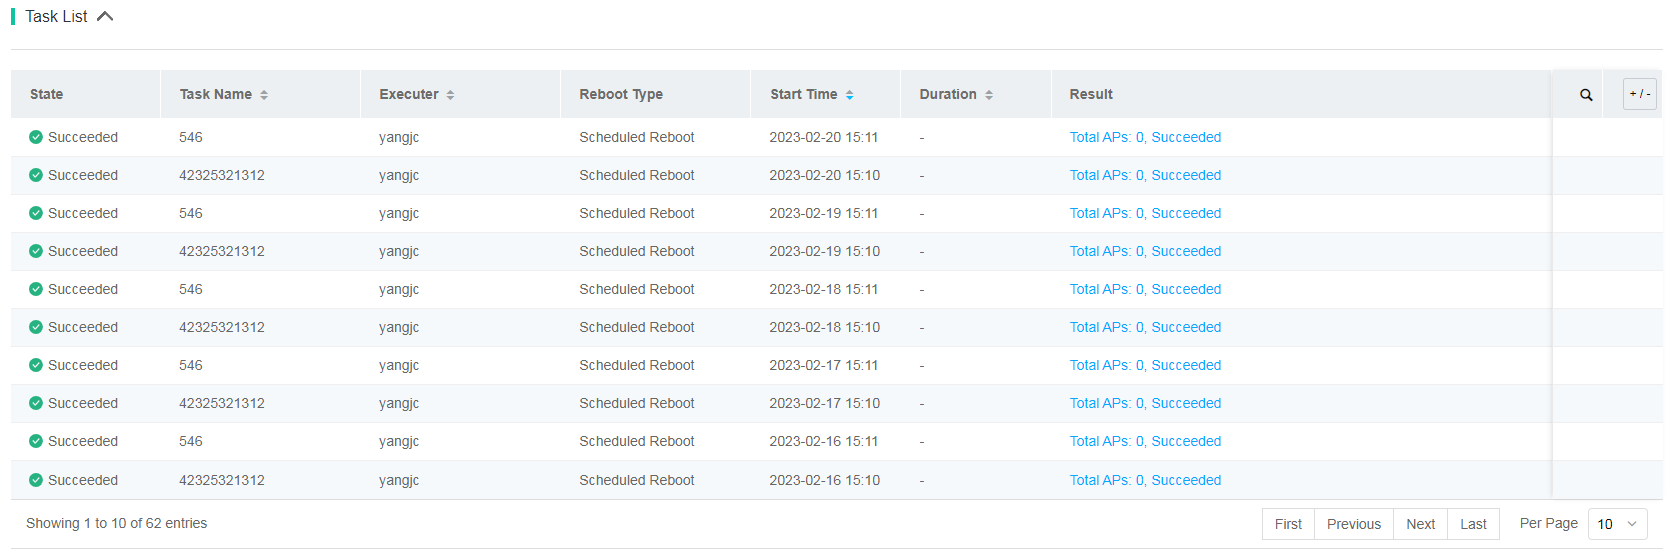
Figure 114 AP Reboot Tasks area
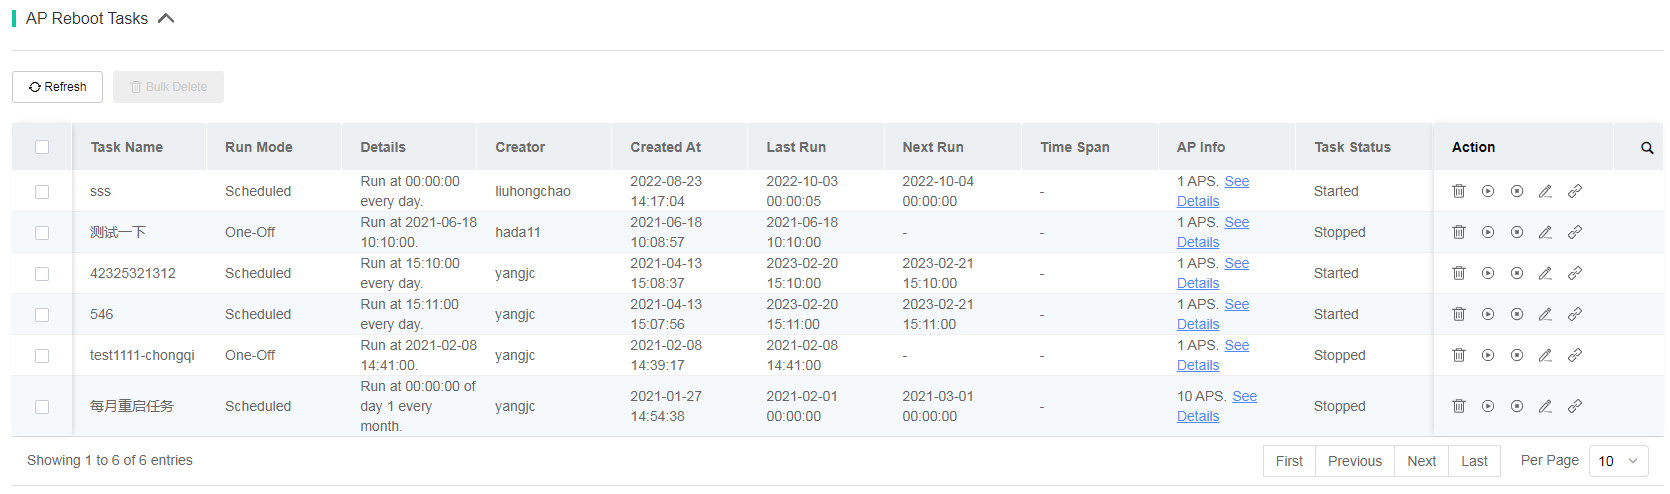
Optimization
One-key optimization
One-key optimization allows you to optimize commonly used AP parameters in bulk for APs to operate in optimal state. This feature is applicable to deployment and manual optimization.
Perform one-key optimization
One-key optimization is implemented based on spaces. Each site has a default space named Global Optimization. The default space in a site is automatically created with the site and cannot be deleted. One-key optimization in the default space can optimize all APs in the site. The system also supports custom spaces.
To perform one-key optimization:
1. Click Smart O&M on the top navigation bar, and then select Optimization > One-Key Optimize from the left navigation pane.
You are placed on the Optimization Settings tab.
2. Select a branch and a site from the top of the page.
3. (Optional.) Add or edit a space.
¡ To add a space, click Click to Add Space and configure the space parameters as needed.
¡ To
edit a space, click the Edit icon ![]() at
the upper right corner of the space tile.
at
the upper right corner of the space tile.
4. Click the Optimization Progress tab.
5. Click Optimize for the target space.
Figure 115 Managing spaces
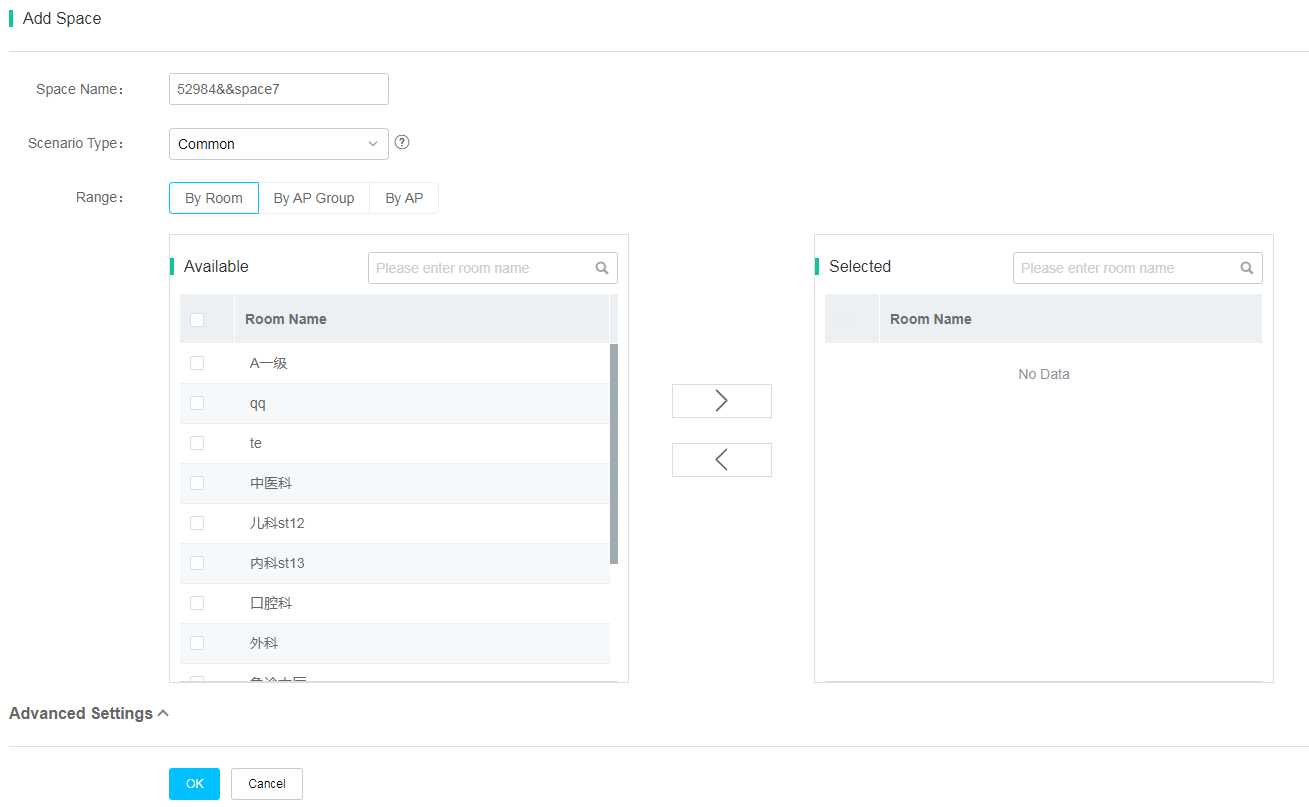
View the optimization process
A one-key optimization process includes the Check, Scan, Optimize, and Complete phases. You can view one-key optimization processes on the Optimization Progress tab.
Figure 116 Viewing the one-key optimization progress
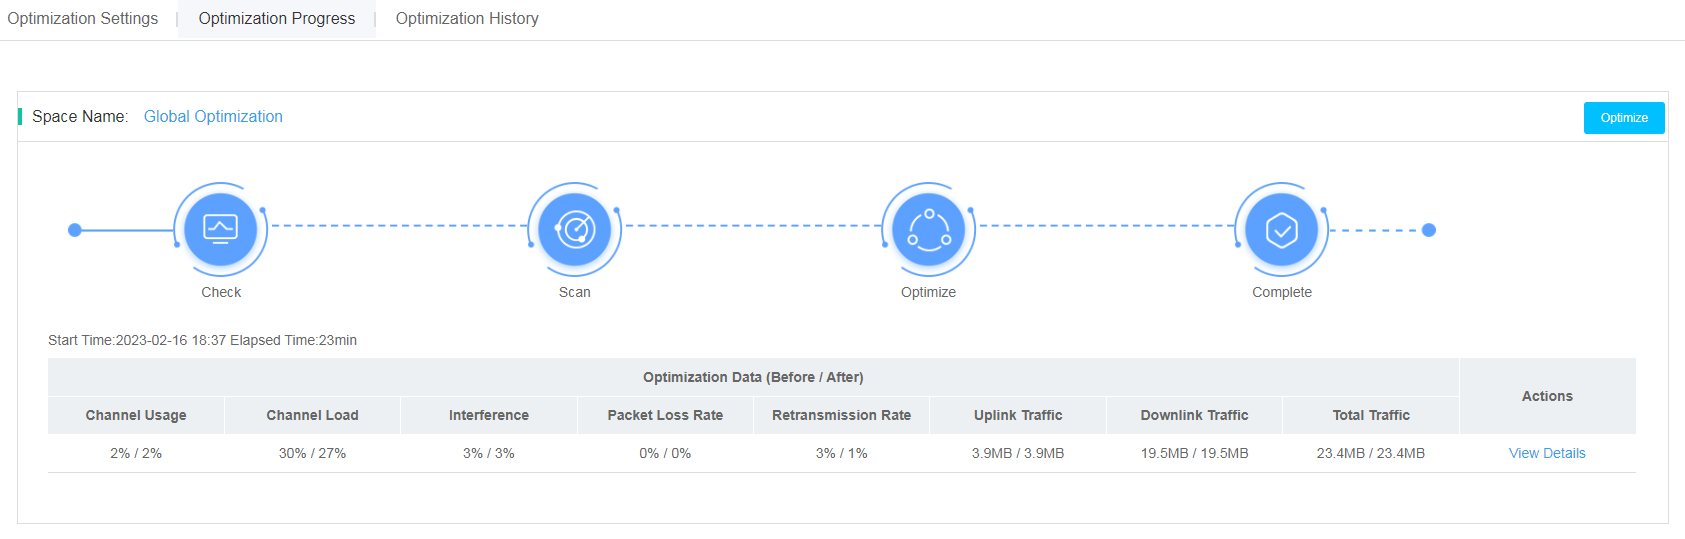
View the optimization result
After the optimization finishes, the system displays information about the optimization, including optimized AP quantity, start time, duration, and comparison of the original parameters and new parameters.
If the optimization fails, the page displays reasons for the failure.
You can view optimization records of the past 7 days, including the following:
· Neighbor APs and Their Channel Usage—Displays the channel relationship between neighbor APs at 2.4 GHz or 5 GHz radios in the current space. A gray line indicates that the APs are neighbors and a red line indicates that the APs are running at the same channel. This graph displays radio frequency channel conflicts of neighbor APs on the entire network.
Figure 117 Displaying neighbor APs and their channel usage
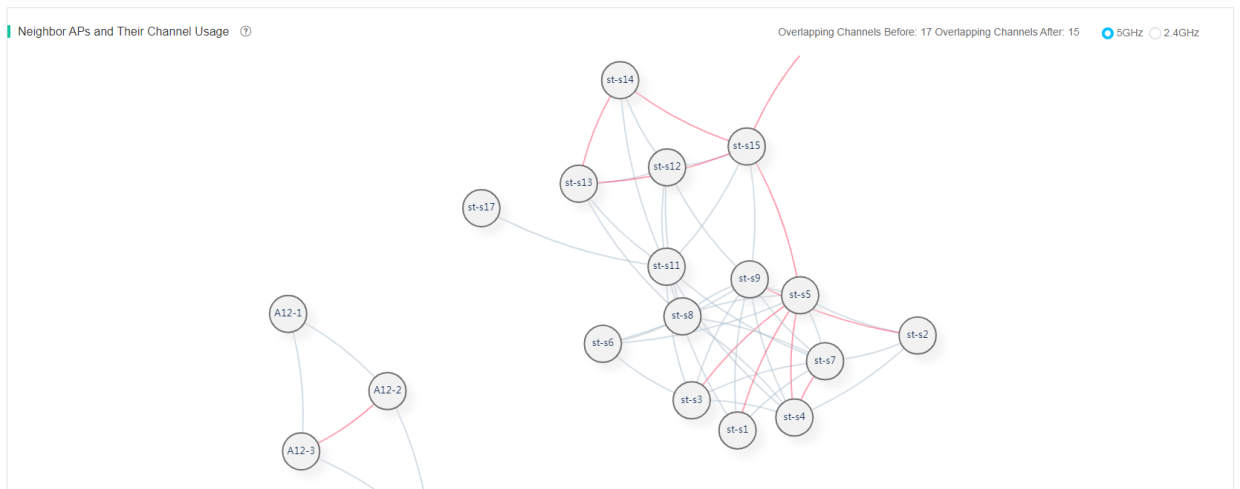
· AP Distribution by Channel—Displays the number of APs running at each channel and channel usage before and after optimization.
Figure 118 Displaying AP distribution by channel
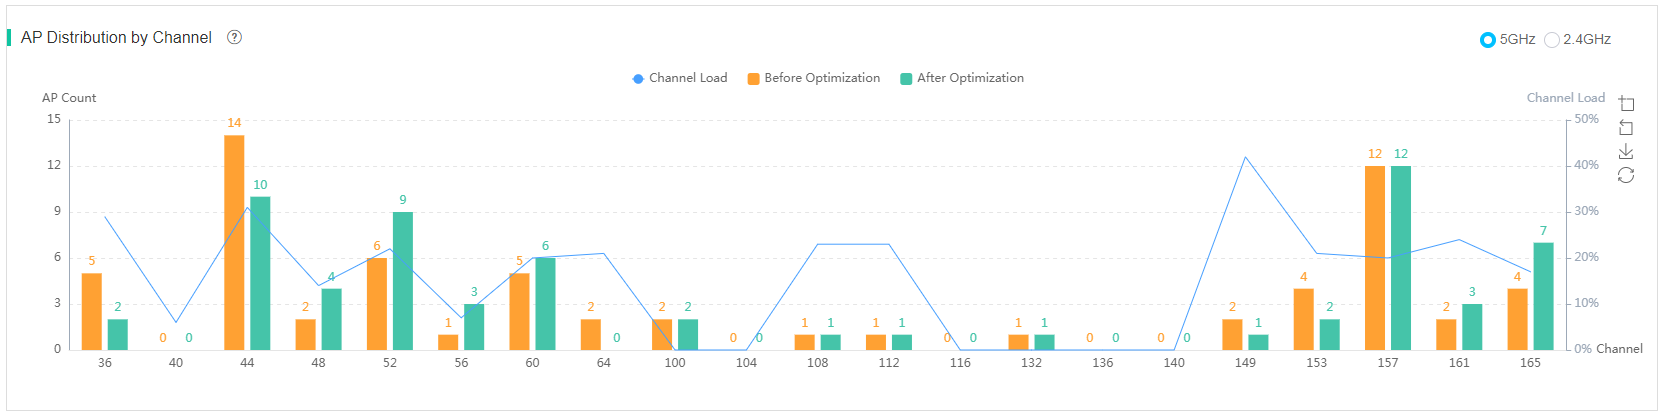
· Power Adjustment Statistics—Displays power adjustment before and after optimization.
Figure 119 Displaying power adjustment statistics
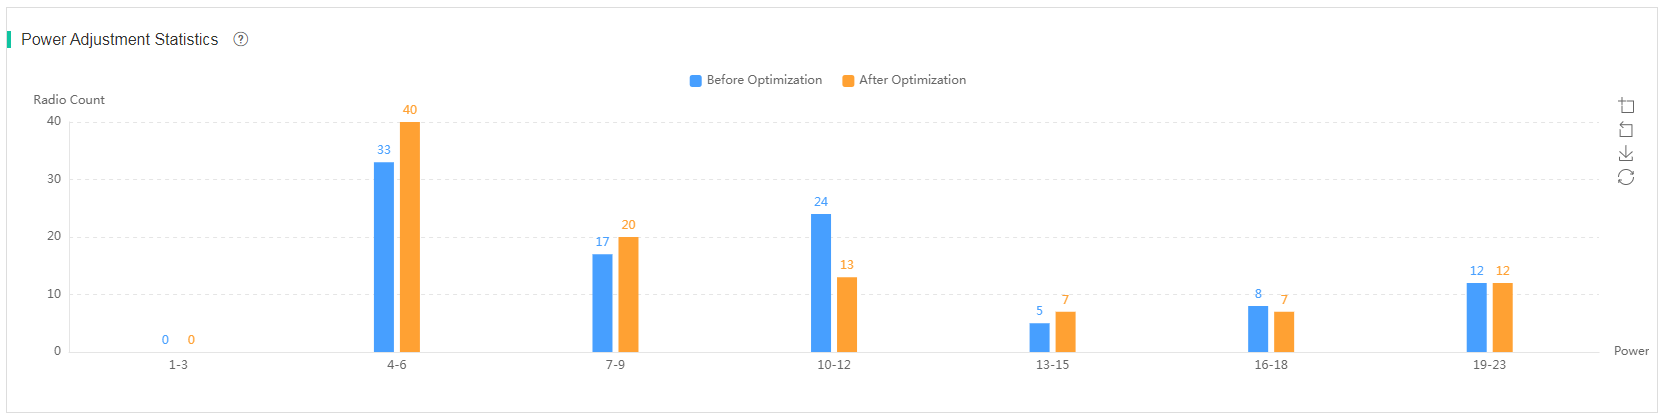
· Optimized APs—Displays detailed information and optimization parameters of each optimization.
Figure 120 Displaying optimized APs
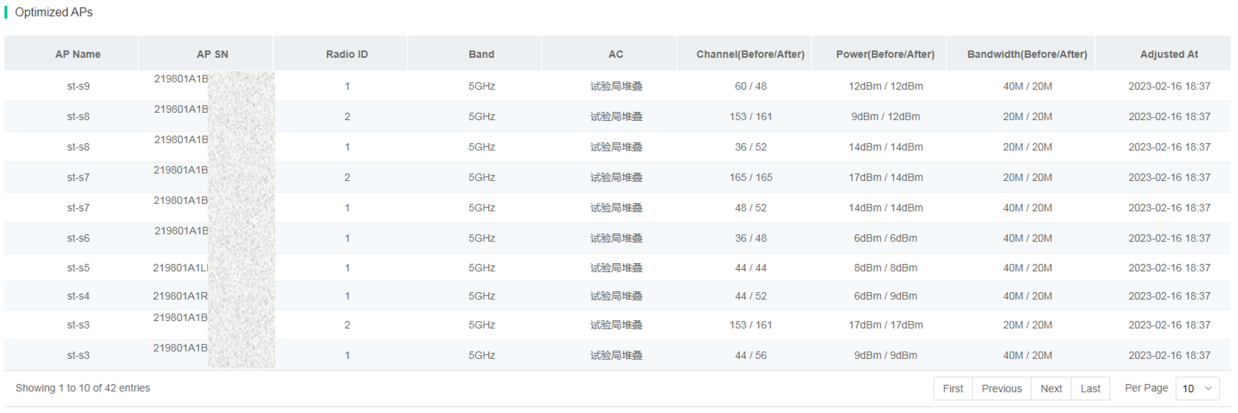
View optimization history
1. Click Smart O&M on the top navigation bar, and then select Optimization > One-Key Optimize from the left navigation pane.
2. Click the Optimization History tab.
You can view the optimization history of only the past 7 days.
Figure 121 Viewing optimization history
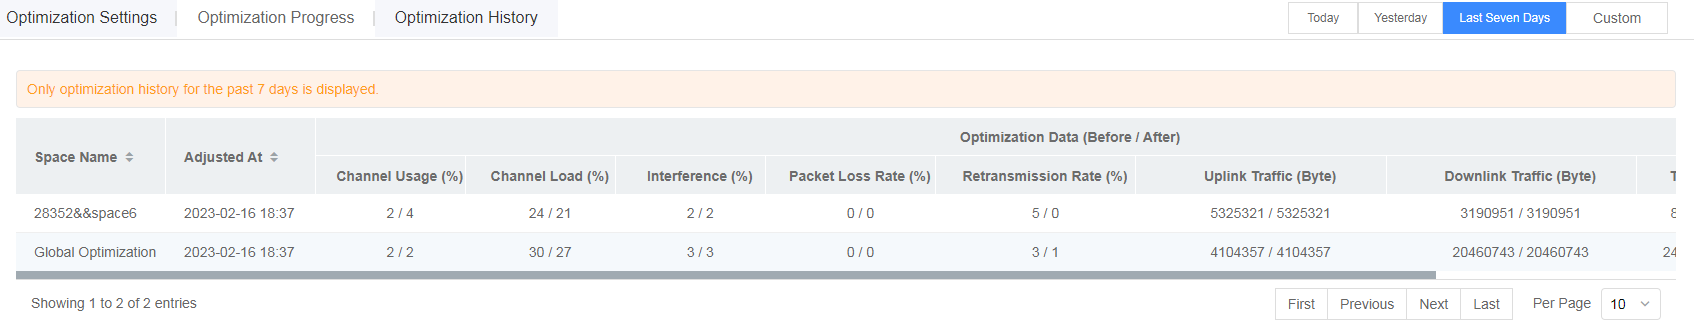
One-key diagnosis
One-key diagnosis performs a thorough health check of all ACs in the site to discover potential issues. The system also provides suggestions against discovered issues.
Prerequisites
Before performing one-key diagnosis in a site, enable smart O&M for the site.
Restrictions and guidelines
Cloud-managed APs do not support one-key diagnosis.
For ACs, only ACs of version 5412 or higher support one-key diagnosis.
You can customize health check items.
Perform one-key diagnosis
1. Click Smart O&M on the top navigation bar, and then select Optimization > One-Key Diagnosis from the left navigation pane.
2. Select a site and a device from the top of the page.
3. Click View Check Items, select items to check as needed, and then click OK.
The required items cannot be cleared.
Figure 122 Viewing check items
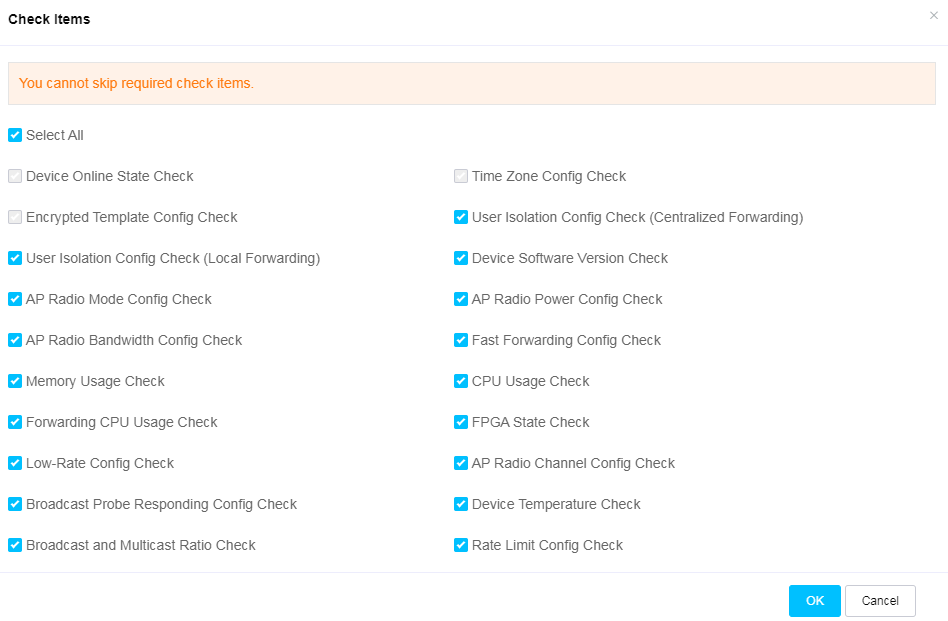
4. Click Diagnose.
Figure 123 Start diagnosis

View diagnosis results
After the diagnosis finishes, the page displays the numbers of items marked as follows:
· Passed—Marks an item that has passed the check.
· Failed—Marks a required item that has failed to pass the check. For a site with multiple devices, an item is marked failed if one device fails to pass the item check. For a device associated with multiple APs, the device is marked failed for an item check if one AP fails to pass the item check.
· Optimizable—Marks an optional item that has failed to pass the check.
· Undiagnosable—Marks an item for which the system failed to obtain the required data.
· Skipped—Marks an item that the system has actively skipped.
To view detailed items of a type, click the item quantity. To view all items, click the total item quantity.
You optimize the network according to diagnosis results.
· For failed items and optimizable items, click Expand Repair Suggestions to view the optimization suggestions. To manually configure the devices, click CLI Helper in the list. To troubleshoot the potential issues, click the details to access the Alarms page.
· For undiagnosable items, verify that the corresponding devices are connected to the network correctly.
Figure 124 Viewing diagnosis results
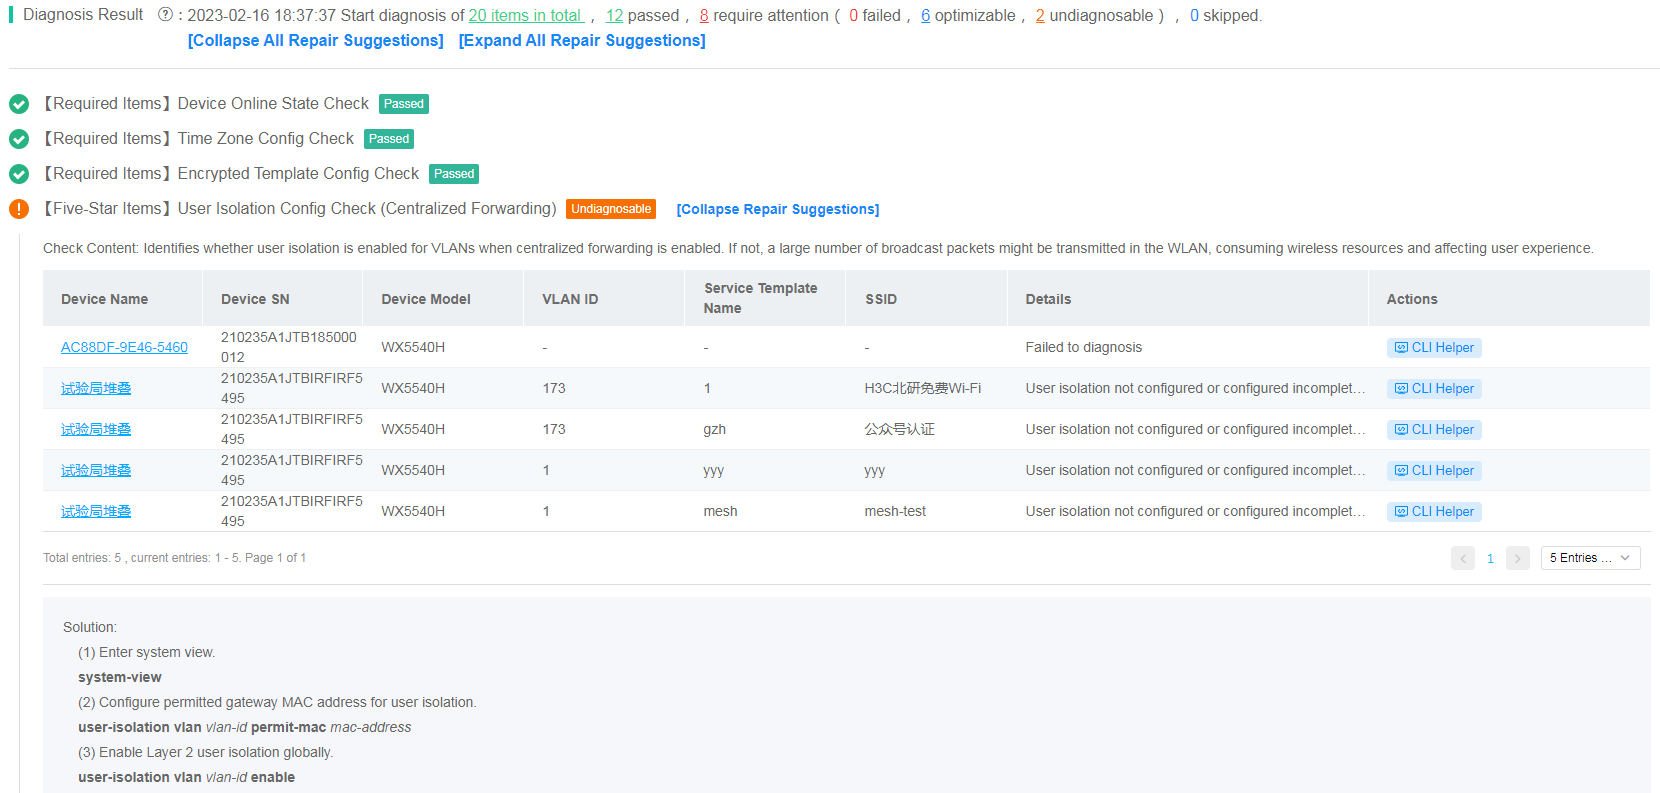
View diagnosis records
1. Click Smart O&M on the top navigation bar, and then select Optimization > One-Key Diagnosis from the left navigation pane.
2. Select a site and a device from the top of the page.
3. Click History Diagnosis Info.
4. To view information about a diagnosis, click its diagnosis result.
The system can save a maximum of 16 diagnosis records and save a record for a maximum of 6 days. These diagnosis records can be used for analysis after network optimization.
Figure 125 Viewing history diagnosis records
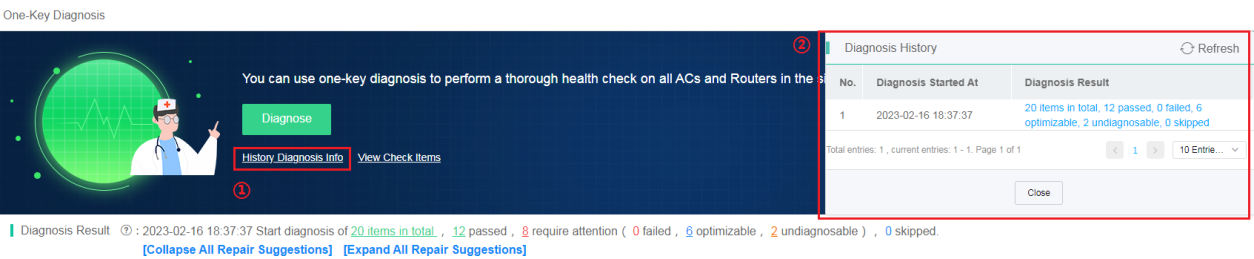
Service assurance
VIP users
Compared to common users, VIP users can enjoy a higher-quality wireless network with lower network latency, higher network bandwidth, and better network experience.
View VIP client summary
To view the VIP client summary, click Smart O&M on the top navigation bar, and then select VIP > VIP Clients from the left navigation pane. The Summary tab displays the following:
· VIP Client Count
This area displays the quantity of VIP clients and non-VIP clients that are associated with the specified devices over a time range in the current site.
· Client Distribution by Health State
This area displays distribution of VIP clients by health state that are associated with the specified devices over a time range in the current site. The VIP client health is graded as shown in Table 8. VIP clients are graded based on channel usage, RSSI, and uplink/downlink rate.
Table 8 VIP client health grading
|
Client health state |
Health score |
|
Excellent |
>=80 |
|
Good |
65 (included) to 80 |
|
Average |
<65 |
· Client Distribution by Issue Count
This area displays issue statistics of level-1 VIP users and level-2 VIP users for the specified devices over a time range in the current site.
· Client Type
This area displays distribution of online level-1 and level-2 VIP users by client type for the specified devices in the current site.
Figure 126 VIP client summary
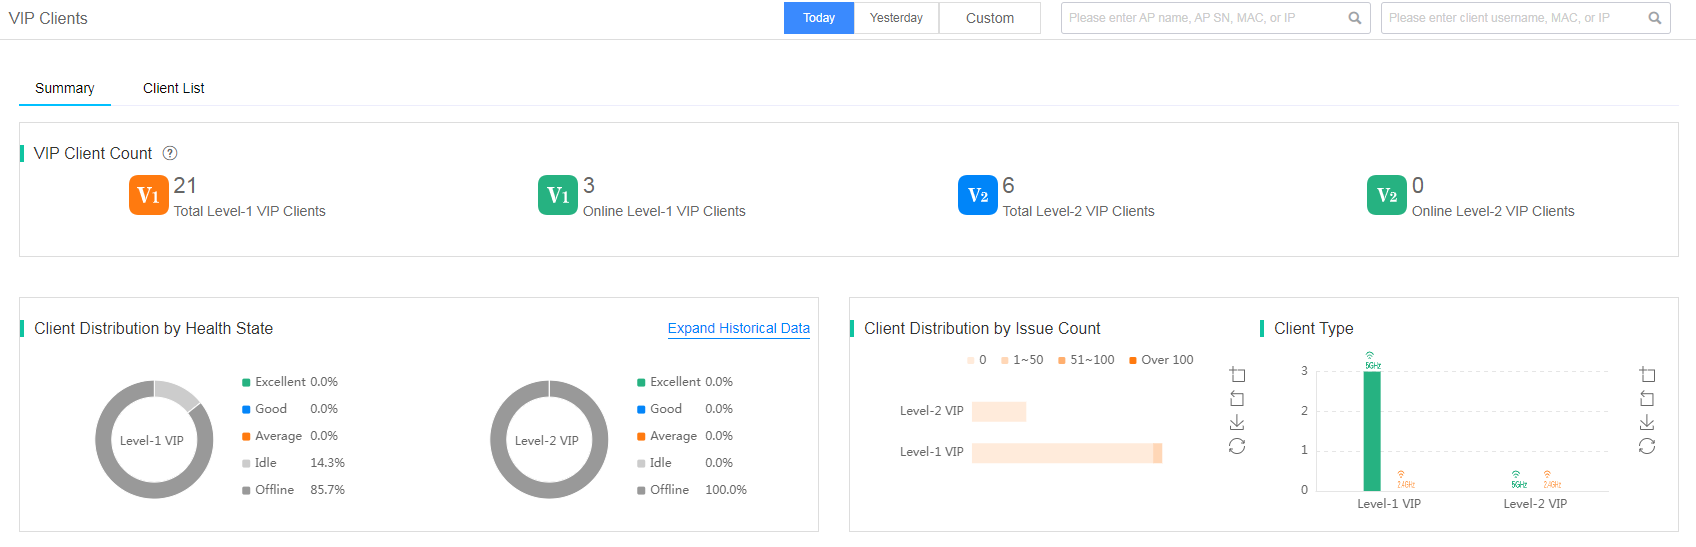
To view trends for level-1 and level-2 VIP client distribution by health state, click Expand Historical Data in the Client Distribution by Health State area.
Figure 127 Trend for level-1 VIP client distribution by health state
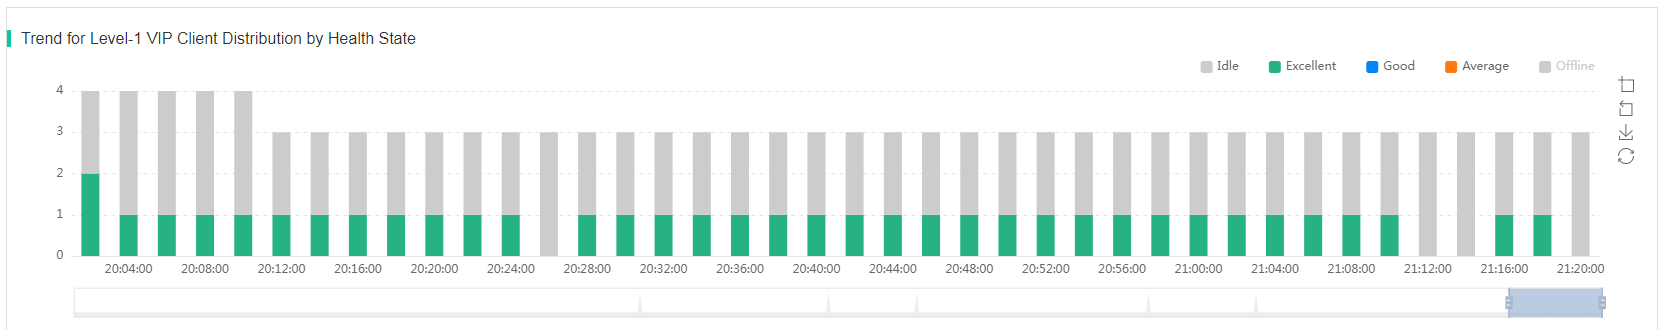
Figure 128 Trend for level-2 VIP client distribution by health state
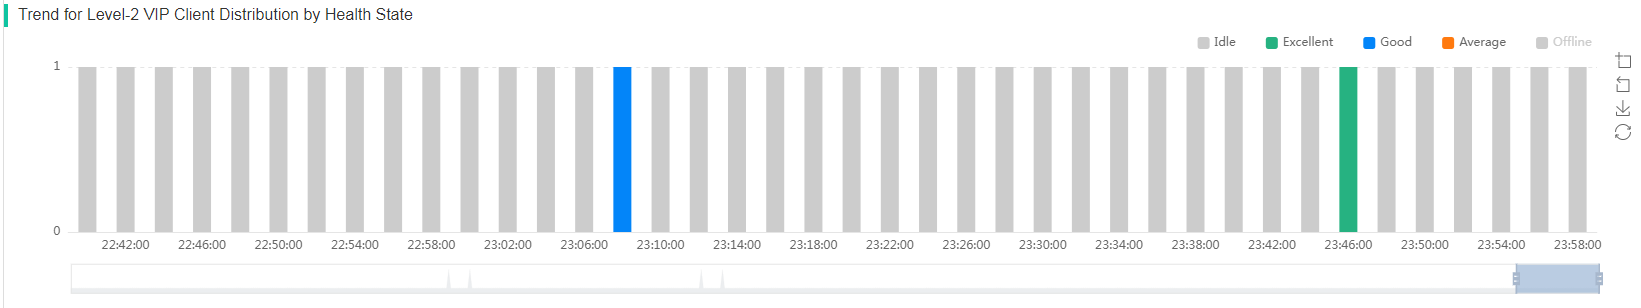
To view details of VIP users in a status, click the color for the status in a bar of the corresponding trend chart. Then, the VIP client list is displayed at the bottom of the page.
Figure 129 VIP client list
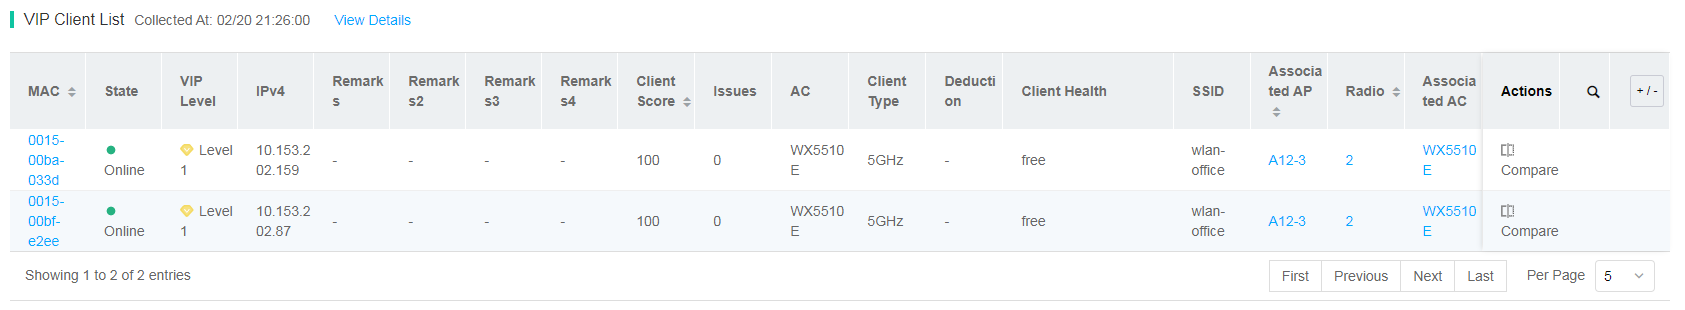
Manage VIP clients
Only ACs of version 5436 or higher support VIP client list management.
To view VIP clients:
1. Click Smart O&M on the top navigation bar, and then select VIP > VIP Clients from the left navigation pane.
2. Click the Client List tab.
The page displays information about VIP clients in real time, including:
¡ Client Score—Score of a client given based on channel usage, RSSI, and uplink/downlink rate.
¡ Remarks—Remarks of a VIP client. To add remarks for a VIP client, click the Remark column for the VIP client.
To view detailed information about a VIP client, click the link in the MAC column for the client on the Client List tab.
To view detailed information about the AP associated with a VIP client, click the link in the Associated AP or Radio column for the client on the Client List tab.
To view detailed information about the AC associated with a VIP client, click the link in the Associated AC column for the client on the Client List tab.
Figure 130 Managing VIP clients
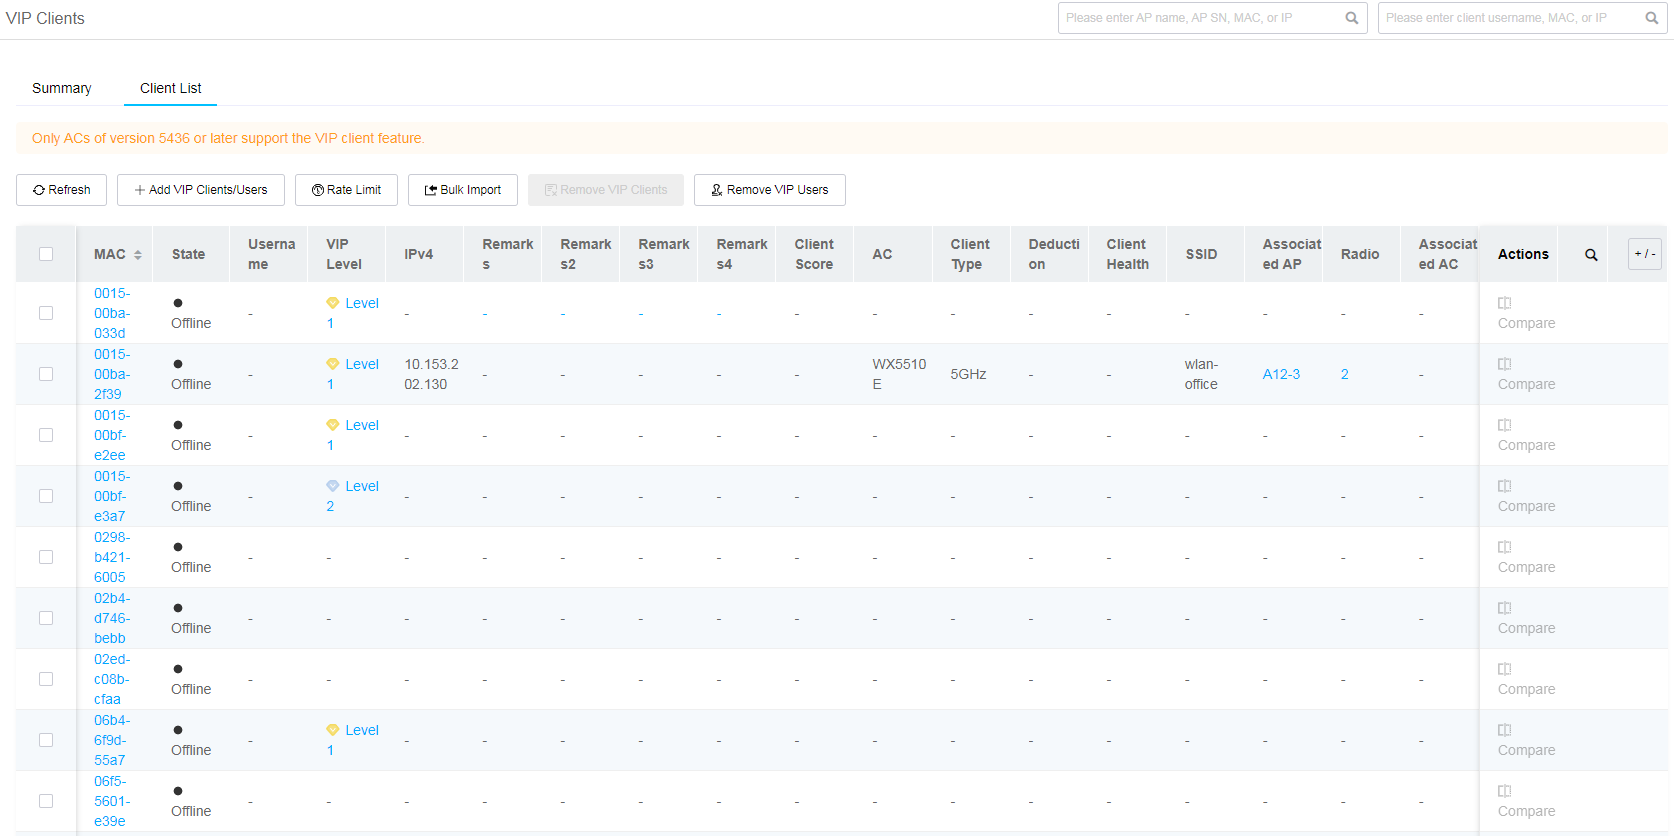
The priorities of level-1 VIP clients, level-2 VIP clients, and non-VIP clients are in descending order. You can rate limit only level-2 VIP clients and non-VIP clients. When resources are insufficient, APs might log off clients with a low priority to ensure service continuity for clients with a higher priority.
To edit the VIP level of a client, use one of the following methods:
· Click the link in the level link in the VIP Level column for the client on the Client List tab.
· Edit the VIP levels bulk after click Bulk Import on the Client List tab.
· Edit the VIP level for the client on the client health details page.
To configure rate limit for level-2 VIP clients and non-VIP clients in bulk, select clients, click Rate Limit on the Client List tab.
Figure 131 Configuring rate limit
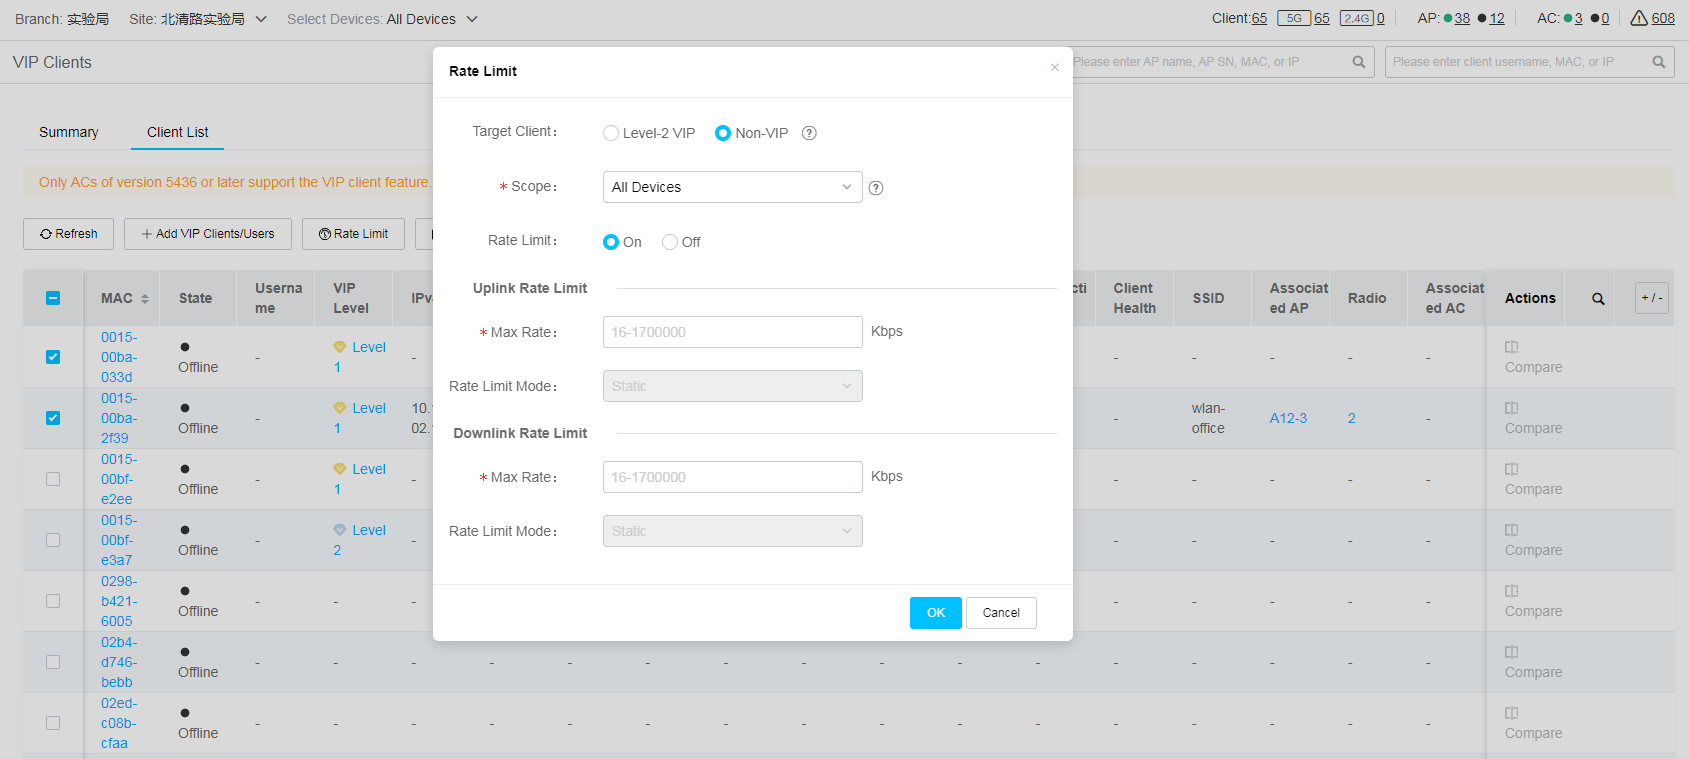
Add VIP clients or VIP users
To add VIP clients or VIP users:
1. Click Smart O&M on the top navigation bar, and then select VIP > VIP Clients from the left navigation pane.
2. Click Add VIP Clients/Users.
3. Add VIP clients or VIP users as needed on the Add VIP Clients or Add VIP Users tab, respectively.
Figure 132 Adding VIP clients
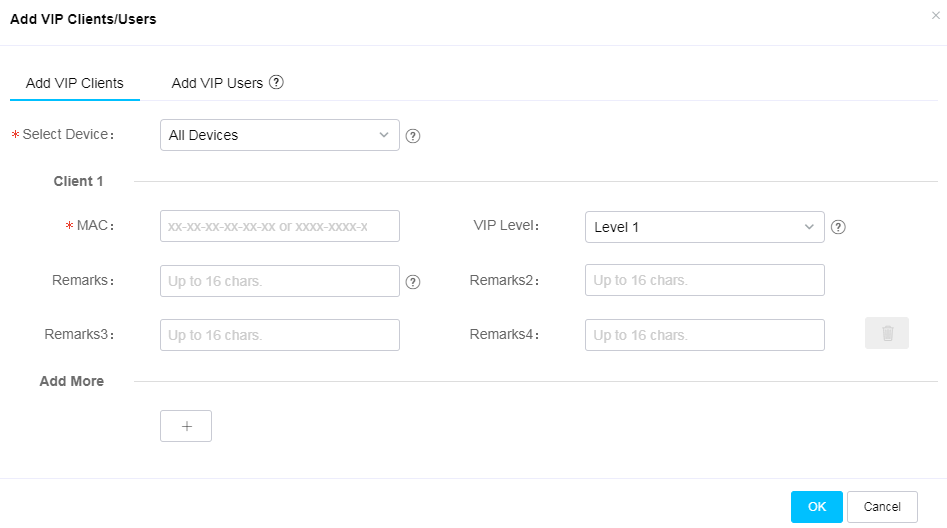
Figure 133 Adding VIP users