- Table of Contents
- Related Documents
-
| Title | Size | Download |
|---|---|---|
| 03-Diagnostic troubleshooting configuration | 175.58 KB |
Configuring diagnostic troubleshooting
About diagnostic troubleshooting
Diagnostic troubleshooting based on history data
Diagnostic troubleshooting based on running data
Diagnostic troubleshooting based on history or running data
Diagnostic troubleshooting based on the results of one-time actions
Service modules that support diagnostic troubleshooting
Diagnostic troubleshooting tasks at a glance
Configuring CPU diagnostic troubleshooting
Configuring diagnostic troubleshooting for CPU usage threshold exceeding events
Configuring diagnostic troubleshooting for CPU overload events
Configuring memory diagnostic troubleshooting
Configuring diagnostic troubleshooting for insufficient free memory events
Configuring diagnostic troubleshooting for memory overload events
Configuring LDP diagnostic troubleshooting
Configuring health diagnostic troubleshooting for the LDP module
Configuring diagnostic troubleshooting for LDP session setup failure events
Configuring diagnostic troubleshooting for LDP peer down events
Configuring MPLS TE diagnostic troubleshooting
Configuring health diagnostic troubleshooting for the MPLS TE module
Configuring diagnostic troubleshooting for MPLS TE tunnel setup failure events
Configuring diagnostic troubleshooting for MPLS TE tunnel down and path switchover events
Configuring MPLS L2VPN diagnostic troubleshooting
Configuring health diagnostic troubleshooting for the MPLS L2VPN module
Configuring diagnostic troubleshooting for PW setup failure events
Configuring diagnostic troubleshooting for PW down events.
Configuring ping diagnostic troubleshooting
Configuring SNMP diagnostic troubleshooting
Configuring diagnostic troubleshooting for SNMP packet processing failure events
Configuring diagnostic troubleshooting for long SNMP packet processing duration events
Configuring diagnostic troubleshooting for SNMP trap sending failure events
Configuring BGP diagnostic troubleshooting
Configuring health diagnostic troubleshooting for the BGP module
Configuring diagnostic troubleshooting for BGP session setup failure events
Configuring diagnostic troubleshooting for BGP session down events
Configuring diagnostic troubleshooting for BGP flowspec route adding and deletion events
Configuring diagnostic troubleshooting
About diagnostic troubleshooting
Diagnostic troubleshooting enables the device to automatically discover and diagnose failures on various service modules all day all round. You can enable or disable diagnostic troubleshooting as needed.
Diagnostic troubleshooting provides the following features:
· Health diagnostic troubleshooting for service modules
This feature identifies whether a service module can provide services correctly. If exceptions or abnormal running status disable the service module from providing services correctly, the system determines that the service module has an unhealthy event and records the relevant information to help you obtain the running status of the service module.
· Diagnostic troubleshooting for features
This feature identifies whether a service module is running correctly to help you locate issues. For example, diagnostic troubleshooting for SNMP trap sending failure events is used to identify whether SNMP trap sending failure events have occurred and the reason for the failure.
Mechanism
This section describes the operating mechanism for diagnostic troubleshooting of features. Health diagnostic troubleshooting for service modules uses the current running data in the service template to determine whether the service modules are running correctly and healthy.
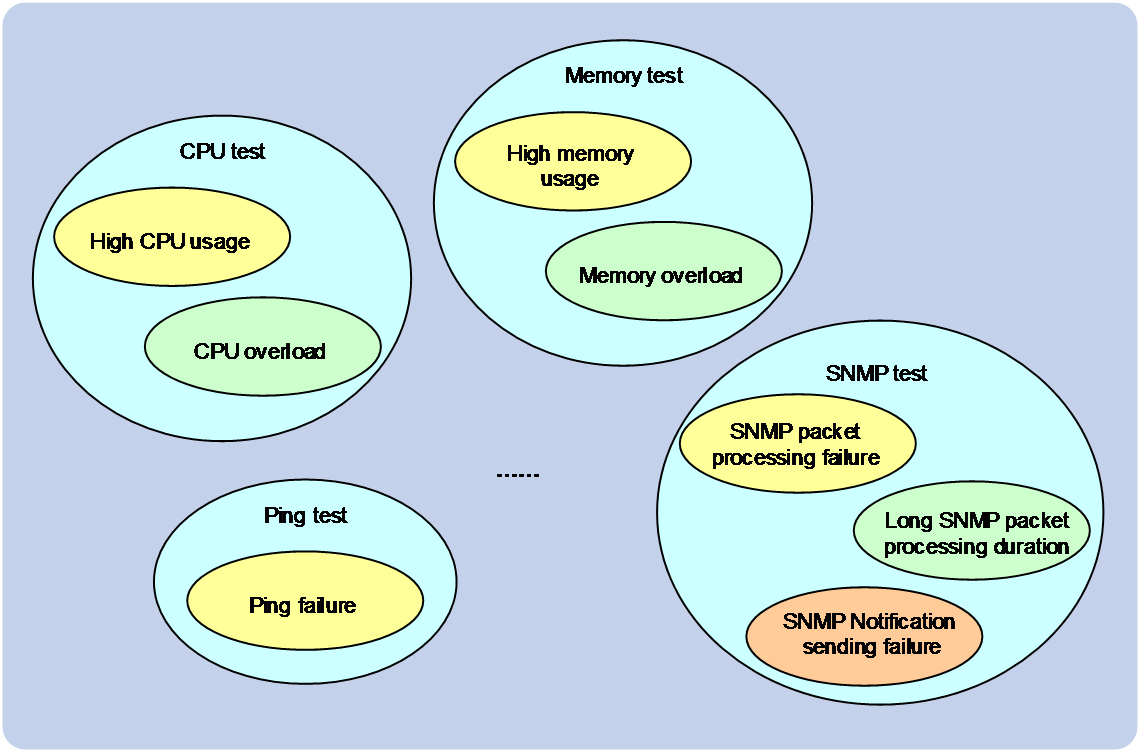
Tests and test items
The device provides tests and test items for diagnostic troubleshooting.
· A test is a script file in the device startup software package used to test the device hardware and software features.
· A test might contain multiple test items, each representing a component or feature in the device hardware.
Figure 1 Diagram of tests and test items
Overview
You run the test items on the device, and the device runs the script corresponding to the test items to automatically sample the running data of the device and obtain the running status of the device and the features. Then, the device automatically analyzes and diagnoses the data, provides diagnostic results and processing suggestions.
Diagnostic troubleshooting is a sub-function of the GOLD module. It can cooperate with the GOLD module to perform diagnostic troubleshooting for service modules. To address the diagnostic troubleshooting requirements of different service modules, the device provides the following diagnostic troubleshooting methods:
· Diagnostic troubleshooting based on history data.
· Diagnostic troubleshooting based on running data.
· Diagnostic troubleshooting based on history or running data.
· Diagnostic troubleshooting based on the results of one-time actions.
Diagnostic troubleshooting based on history data
Some tests can perform troubleshooting for a service module based on the history running data of that service module. As shown in Figure 2, diagnostic troubleshooting based on history data proceeds as follows:
1. After you enable diagnostic troubleshooting for a test item and complete service module configuration, the service module samples objects monitored by the test item periodically and records the samples in the database of the GOLD module.
The objects and sampling interval might differ depending on diagnostic troubleshooting features. The objects and sampling interval have been defined in the script and are not configurable from the CLI.
2. You execute a diagnostic troubleshooting command.
3. The GOLD module obtains the history data for the test from the database and the test analyzes the history data and obtains the result.
4. The device outputs the diagnostic troubleshooting results.
Figure 2 Diagnostic troubleshooting based on history data
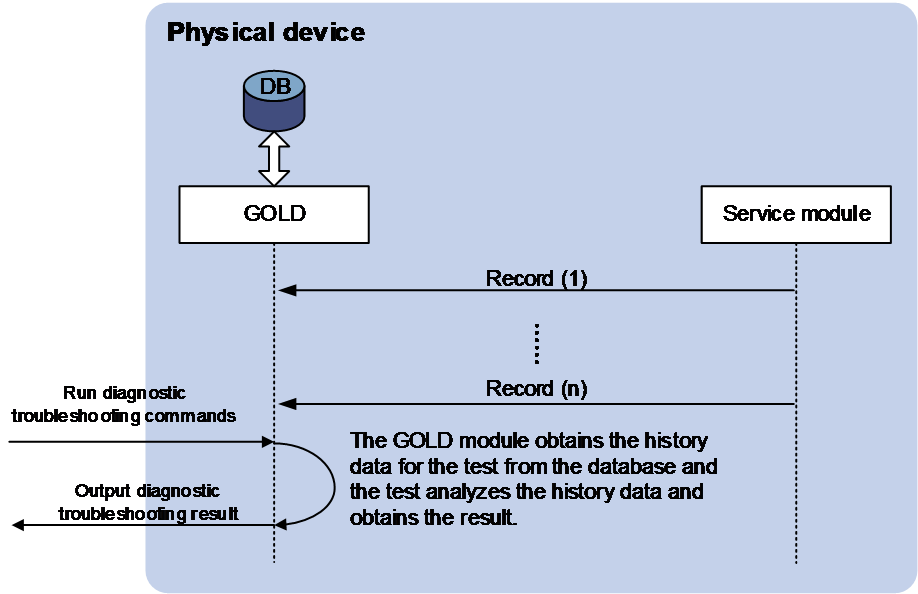
For example, if you enable diagnostic troubleshooting for SNMP trap sending failure events, the SNMP trap sending failure test item will save the relevant information to the GOLD module during device operation. The information includes the IP address of the NMS, the sending time of the traps, and the security keys used. The device displays all trap sending failure information saved in the GOLD module to help you locate the issue.
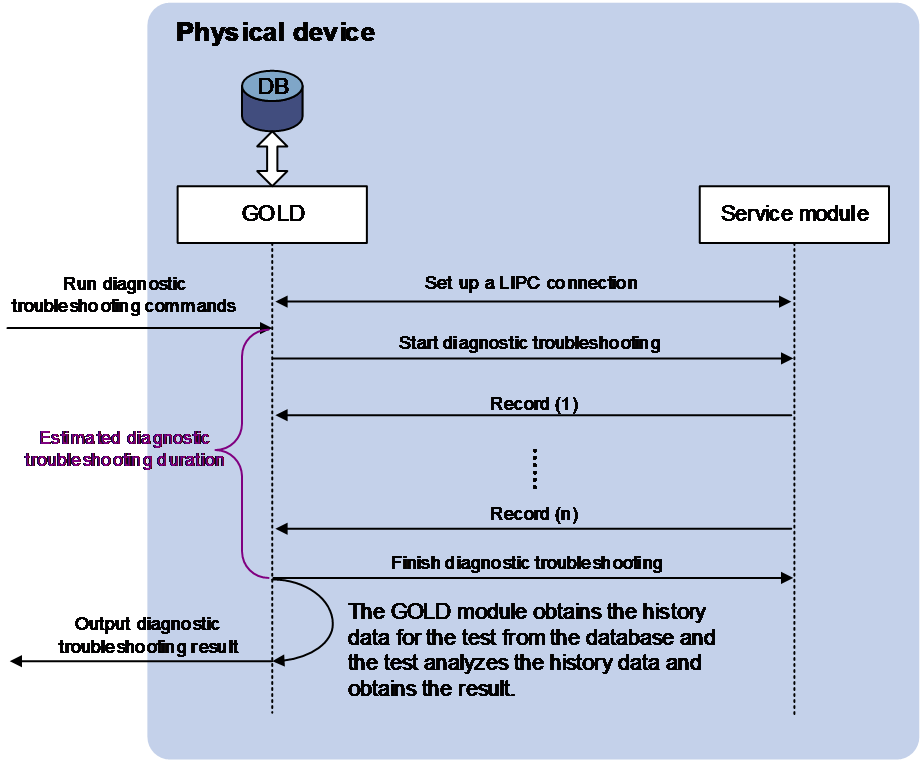
Diagnostic troubleshooting based on running data
For some features, only their running status needs to be monitored. The test items of these features will collect the running data for a period of time after diagnostic troubleshooting is enabled, and perform diagnostic troubleshooting for the service modules based on the collected data. As shown in Figure 3, diagnostic troubleshooting based on running data proceeds as follows:
1. After you enable diagnostic troubleshooting and complete configuration for a service module, the service module will establish an LIPC connection with the GOLD module.
2. You execute a diagnostic troubleshooting command.
3. The GOLD module notifies the service module to start diagnostic troubleshooting and notifies it of parameters such as diagnostic troubleshooting duration.
4. The service module samples objects monitored by the test item periodically and records the samples in the database of the GOLD module. The sampling interval has been defined when the device is shipped.
5. The GOLD module notifies the service module when the estimated diagnostic troubleshooting period is reached.
6. The test notifies the GOLD module to obtain data from the database, analyze the data, and obtain the result.
7. The device outputs the diagnostic troubleshooting results.
Figure 3 Diagnostic troubleshooting based on running data
Diagnostic troubleshooting based on history or running data
For some test items, you can configure parameters from the CLI to perform diagnostic troubleshooting by using history data or running data.
Diagnostic troubleshooting based on the results of one-time actions
For some service modules, you execute one or multiple diagnostic troubleshooting commands to trigger the service modules to perform one or multiple actions for failure analysis and diagnosis.
For example, if you perform diagnostic troubleshooting for ping failure events, the device uses the parameters specified from the CLI to ping a specific IP address and displays the ping result. If the ping operation fails, the device displays the failure reason to help you locate the failure reason.
Service modules that support diagnostic troubleshooting
Service modules that support diagnostic troubleshooting include NETCONF, SNMP, CPU, MEMORY, and OSPF. To obtain service modules that support diagnostic troubleshooting, use the diagnostic troubleshooting test ? command. To obtain features that support diagnostic troubleshooting, use the diagnostic troubleshooting test test-name ? command.
Service modules that support health diagnostic troubleshooting include VXLAN. To obtain service modules that support health diagnostic troubleshooting, use the diagnostic troubleshooting health module ? command.
Diagnostic troubleshooting tasks at a glance
All diagnostic troubleshooting tasks in this document are optional. Select tasks as needed.
Configuring CPU diagnostic troubleshooting
Configuring diagnostic troubleshooting for CPU usage threshold exceeding events
About this task
The system samples the CPU usage at 1-minute intervals. If the sample is greater than the CPU usage threshold configured using the monitor cpu-usage threshold command, the device logs a CPU usage threshold exceeding event in the memory of the GOLD module.
With this feature enabled, the device displays the following information to help you locate the high CPU usage issue:
· A maximum of seven CPU usage samples.
· A maximum of seven CPU usage threshold exceeding events.
· Information about the top five processes with the highest CPU usage when the most recent CPU usage threshold exceeding event occurred.
For more information about CPU usage alarms, see “Managing hardware resources” in Device Management Configuration Guide.
Procedure
1. Enter system view.
system-view
2. Enable diagnostic troubleshooting for CPU usage threshold exceeding events.
diagnostic troubleshooting test cpu high-ratio enable
By default, diagnostic troubleshooting is enabled for CPU usage threshold exceeding events.
3. Perform diagnostic troubleshooting for CPU usage threshold exceeding events.
diagnostic troubleshooting test cpu high-ratio
Configuring diagnostic troubleshooting for CPU overload events
About this task
The system samples the CPU usage every time it runs the CPU overload monitoring diagnostic test. The sample is used for CPU overload diagnostic troubleshooting.
If the different between the current sample and the previous sample is greater than 10%, the device logs a CPU overload event in the memory of the GOLD module.
With this feature enabled, the device displays the following information to help you locate the CPU overload issue:
· A maximum of seven CPU overload events.
· Information about the top five processes with the highest CPU usage when the most recent CPU overload event occurred.
Restrictions and guidelines
To enable the CPU overload diagnostic test, use the diagnostic monitor enable command. The CPU overload diagnostic test is enabled by default. The default execution interval for the CPU overload monitoring diagnostic test is 30 minutes. To set the interval, execute the diagnostic monitor interval command. For more information about the diagnostic monitor enable and diagnostic monitor interval commands, see Network Management and Monitoring Command Reference.
Procedure
1. Enter system view.
system-view
2. Enable diagnostic troubleshooting for CPU overload events.
diagnostic troubleshooting test cpu overload enable
By default, diagnostic troubleshooting is enabled for CPU overload events.
3. Perform diagnostic troubleshooting for CPU overload events.
diagnostic troubleshooting test cpu overload
Configuring memory diagnostic troubleshooting
Configuring diagnostic troubleshooting for insufficient free memory events
About this task
The system samples the free memory usage at 5-second intervals. If the sample is greater than the free memory usage threshold configured using the memory-threshold command, the device logs a free memory threshold exceeding event in the memory of the GOLD module.
With this feature enabled, the device displays the memory usage and the most recent insufficient free memory usage events to help you locate the insufficient free memory issue.
For more information about memory usage alarms, see “Managing hardware resources” in Device Management Configuration Guide.
Procedure
1. Enter system view.
system-view
2. Enable diagnostic troubleshooting for insufficient free memory events.
diagnostic troubleshooting test memory high-ratio enable
By default, diagnostic troubleshooting is enabled for insufficient free memory events.
3. Perform diagnostic troubleshooting for insufficient free memory events.
diagnostic troubleshooting test memory high-ratio
Configuring diagnostic troubleshooting for memory overload events
About this task
The system samples the memory usage every time it runs the memory overload monitoring diagnostic test. The sample is used for memory overload diagnostic troubleshooting.
If the difference between the current sample and the previous sample is greater than 50M, the device logs a memory overload event in the memory of the GOLD module.
With this feature enabled, the device displays the following information to help you locate the memory overload issue:
· A maximum of seven memory overload events.
· Information about the top five processes with the highest memory usage when the most recent memory overload event occurred.
Restrictions and guidelines
To enable the memory overload diagnostic test, use the diagnostic monitor enable command. The memory overload diagnostic test is enabled by default. The default execution interval for the memory overload monitoring diagnostic test is 12 hours. To set the interval, execute the diagnostic monitor interval command. For more information about the diagnostic monitor enable and diagnostic monitor interval commands, see Network Management and Monitoring Command Reference.
Procedure
1. Enter system view.
system-view
2. Enable diagnostic troubleshooting for memory overload events.
diagnostic troubleshooting test memory overload enable
By default, diagnostic troubleshooting is enabled for memory overload events.
3. Perform diagnostic troubleshooting for memory overload events.
diagnostic troubleshooting test memory overload
Configuring LDP diagnostic troubleshooting
Configuring health diagnostic troubleshooting for the LDP module
About this task
With health diagnostic troubleshooting enabled for the LDP module and LDP configuration completed, the system starts to monitor the running status of the LDP module. The LDP module records unhealthy events detects in the GOLD module. When you perform health diagnostic troubleshooting for the LDP module, the LDP module obtains the unhealthy events from the GOLD module and determines whether the LDP module is in healthy state.
Procedure
1. Enter system view.
system-view
2. Enable health diagnostic troubleshooting for the LDP module.
diagnostic troubleshooting health module ldp enable
By default, health diagnostic troubleshooting is enabled for the LDP module.
3. Perform health diagnostic troubleshooting for the LDP module.
diagnostic troubleshooting health module ldp
Configuring diagnostic troubleshooting for LDP session setup failure events
About this task
With this feature configured, the LDP module records LDP session setup failure events in the GOLD module for the GOLD module to perform diagnostic troubleshooting for the events.
Restrictions and guidelines
Recording LDP session setup failure events consumes device resources and affects system performance. If you do not concern about the running status of the LDP module, you can disable diagnostic troubleshooting for LDP session setup failure events.
Procedure
1. Enter system view.
system-view
2. Enable diagnostic troubleshooting for LDP session setup failure events.
diagnostic troubleshooting test neighbor-create-abnormal ldp enable
By default, diagnostic troubleshooting is enabled for LDP session setup failure events.
3. Perform diagnostic troubleshooting for LDP session setup failure events.
diagnostic troubleshooting test neighbor-create-abnormal ldp { local [ vpn-instance vpn-instance-name ] peer peer-lsr-id interface interface-type interface number | remote peer peer-lsr-id } [ diagnostic-time diagnostic-time ]
Configuring diagnostic troubleshooting for LDP peer down events
About this task
With this feature configured, the LDP module records LDP peer down events in the GOLD module for the GOLD module to perform diagnostic troubleshooting for the events.
Restrictions and guidelines
Recording LDP peer down events consumes device resources and affects system performance. If you are not concerned about the running status of the LDP module, you can disable diagnostic troubleshooting for LDP peer down events.
Procedure
1. Enter system view.
system-view
2. Enable diagnostic troubleshooting for LDP peer down events.
diagnostic troubleshooting test neighbor-flap ldp enable
By default, diagnostic troubleshooting is enabled for LDP peer down events.
3. Perform diagnostic troubleshooting for LDP peer down events.
diagnostic troubleshooting test neighbor-flap ldp [ [ vpn-instance vpn-instance-name ] peer peer-id ]
Configuring MPLS TE diagnostic troubleshooting
Configuring health diagnostic troubleshooting for the MPLS TE module
About this task
With health diagnostic troubleshooting enabled for the MPLS TE module and MPLS TE configuration completed, the system starts to monitor the running status of the MPLS module. The MPLS TE module records unhealthy events detects in the GOLD module. When you perform health diagnostic troubleshooting for the MPLS TE module, the MPLS TE module obtains the unhealthy events from the GOLD module and determines whether the MPLS TE module is in healthy state.
Procedure
1. Enter system view.
system-view
2. Enable health diagnostic troubleshooting for the MPLS TE module.
diagnostic troubleshooting health module te enable
By default, health diagnostic troubleshooting is enabled for the MPLS TE module.
3. Perform health diagnostic troubleshooting for the MPLS TE module.
diagnostic troubleshooting health module te
Configuring diagnostic troubleshooting for MPLS TE tunnel setup failure events
About this task
With this feature configured, the MPLS TE module records MPLS TE tunnel setup failure events in the GOLD module for the GOLD module to perform diagnostic troubleshooting for the events.
Restrictions and guidelines
Recording MPLS setup failure events consumes device resources and affects system performance. If you are not concerned about the running status of the MPLS TE module, you can disable diagnostic troubleshooting for MPLS TE tunnel setup failure events.
Procedure
1. Enter system view.
system-view
2. Enable diagnostic troubleshooting for MPLS TE tunnel setup failure events.
diagnostic troubleshooting test te-tunnel establish-abnormal enable
By default, diagnostic troubleshooting is enabled for MPLS TE tunnel setup failure events.
3. Perform diagnostic troubleshooting for MPLS TE tunnel setup failure events.
diagnostic troubleshooting test te-tunnel establish-abnormal tunnel tunnel-id [ diagnostic-time diagnostic-time ]
Configuring diagnostic troubleshooting for MPLS TE tunnel down and path switchover events
About this task
With this feature configured, the MPLS TE module records MPLS TE tunnel down and path switchover events in the GOLD module for the GOLD module to perform diagnostic troubleshooting for the events.
When you perform diagnostic troubleshooting, the device displays the most recent five MPLS TE tunnel down events and most recent five path switchover events to help you locate the issue.
Restrictions and guidelines
Recording MPLS TE tunnel down and path switchover events consumes device resources and affects system performance. If you are not concerned about the running status of the MPLS TE module, you can disable diagnostic troubleshooting for MPLS TE tunnel down and path switchover events.
This task is applicable only to MPLS TE tunnels set up using segment routing.
Procedure
1. Enter system view.
system-view
2. Enable diagnostic troubleshooting for MPLS TE tunnel down and path switchover events.
diagnostic troubleshooting test te-tunnel lsp-event enable
By default, diagnostic troubleshooting is enabled for MPLS TE tunnel down and path switchover events.
3. Perform diagnostic troubleshooting for MPLS TE tunnel down and path switchover events.
diagnostic troubleshooting test te-tunnel lsp-event [ flap | switch ] tunnel tunnel-id
Configuring MPLS L2VPN diagnostic troubleshooting
Configuring health diagnostic troubleshooting for the MPLS L2VPN module
About this task
With health diagnostic troubleshooting enabled for the MPLS L2VPN module and MPLS L2VPN configuration completed, the system starts to monitor the running status of the MPLS L2VPN module. The MPLS L2VPN module records unhealthy events detects in the GOLD module. When you perform health diagnostic troubleshooting for the MPLS L2VPN module, the MPLS L2VPN module obtains the unhealthy events from the GOLD module and determines whether the MPLS L2VPN module is in healthy state.
Procedure
1. Enter system view.
system-view
2. Enable health diagnostic troubleshooting for the MPLS L2VPN module.
diagnostic troubleshooting health module l2vpn enable
By default, health diagnostic troubleshooting is enabled for the MPLS L2VPN module.
3. Perform health diagnostic troubleshooting for the MPLS L2VPN module.
diagnostic troubleshooting health module l2vpn
Configuring diagnostic troubleshooting for PW setup failure events
About this task
With this feature configured, the MPLS L2VPN module records PW setup failure events in the GOLD module for the GOLD module to perform diagnostic troubleshooting for the events.
Restrictions and guidelines
Recording PW setup failure events consumes device resources and affects system performance. If you are not concerned about the running status of the MPLS L2VPN module, you can disable diagnostic troubleshooting for PW setup failure events.
Procedure
1. Enter system view.
system-view
2. Enable diagnostic troubleshooting for PW setup failure events.
diagnostic troubleshooting test l2vpn-pw
establish-abnormal enable
By default, diagnostic troubleshooting is enabled for PW setup failure events.
3. Perform diagnostic troubleshooting for PW setup failure events.
diagnostic troubleshooting test l2vpn-pw establish-abnormal { vsi vsi-name | xconnect-group-name group-name connection connection-name } peer ip-address pw-id pw-id
Configuring diagnostic troubleshooting for PW down events.
About this task
With this feature configured, the MPLS L2VPN module records PW down events in the GOLD module for the GOLD module to perform diagnostic troubleshooting for the events.
Restrictions and guidelines
Recording PW down events consumes device resources and affects system performance. If you are not concerned about the running status of the MPLS L2VPN module, you can disable diagnostic troubleshooting for PW down events.
Procedure
1. Enter system view.
system-view
2. Enable diagnostic troubleshooting for PW down events.
diagnostic troubleshooting test l2vpn-pw flap enable
By default, diagnostic troubleshooting is enabled for PW down events.
3. Perform diagnostic troubleshooting for PW down events.
diagnostic troubleshooting test l2vpn-pw flap { vsi vsi-name | xconnect-group-name group-name connection connection-name } peer ip-address pw-id pw-id
Configuring ping diagnostic troubleshooting
About this task
With this feature configured, the device uses the parameters specified from the CLI to ping a specific IP address and displays the ping result. If the ping operation fails, the device displays the failure reason to help you locate the failure reason.
For more information about the ping utility, see Network Management and Monitoring Configuration Guide.
Procedure
1. Enter system view.
system-view
2. Enable diagnostic troubleshooting for ping failure events.
diagnostic troubleshooting test ping failed-reason enable
By default, diagnostic troubleshooting is enabled for ping failure events.
3. Perform diagnostic troubleshooting for ping failure events.
diagnostic troubleshooting test ping failed-reason [ -a source-ip | -f | -i interface-type interface-number | -s packet-size | -t timeout ] [ vpn-instance vpn-instance-name ] { ip-address ipv4-address | ipv6-address ipv6-address }
Configuring SNMP diagnostic troubleshooting
Configuring diagnostic troubleshooting for SNMP packet processing failure events
About this task
With feature configured, the device records SNMP packet sending and receiving failure events within the diagnostic troubleshooting period. When the period is reached, the device displays the events for you to locate the failure reason.
For more information about configuring SNMP, see Network Management and Monitoring Configuration Guide.
Procedure
1. Enter system view.
system-view
2. Enable diagnostic troubleshooting for SNMP packet processing failure events.
diagnostic troubleshooting test snmp-agent packet-process-failure enable
By default, diagnostic troubleshooting is enabled for SNMP packet processing failure events.
3. Perform diagnostic troubleshooting for SNMP packet processing failure events.
diagnostic troubleshooting test snmp-agent packet-process-failure [ ip-address ipv4-address | ipv6-address ipv6-address ] [ vpn-instance vpn-instance-name ] [ diagnose-time diagnostic-time ]
Configuring diagnostic troubleshooting for long SNMP packet processing duration events
About this task
With this feature configured, the device records SNMP packet processing durations within the diagnostic troubleshooting period. When the period is reached, the device displays the durations for you to locate the failure reason.
For more information about configuring SNMP, see Network Management and Monitoring Configuration Guide.
Procedure
1. Enter system view.
system-view
2. Enable diagnostic troubleshooting for long SNMP packet processing duration events.
diagnostic troubleshooting test snmp-agent packet-process-time enable
By default, diagnostic troubleshooting is enabled for long SNMP packet processing duration events.
3. Perform diagnostic troubleshooting for long SNMP packet processing duration events.
diagnostic troubleshooting test snmp-agent packet-process-time [ ip-address ipv4-address | ipv6-address ipv6-address ] [ vpn-instance vpn-instance-name ] [ diagnose-time diagnostic-time ]
Configuring diagnostic troubleshooting for SNMP trap sending failure events
About this task
With diagnostic troubleshooting for SNMP trap sending failure events enabled, the device records the relevant information in the GOLD module. When you perform diagnostic troubleshooting for SNMP trap sending failure events, the device displays the information to help you locate the issue.
For more information about configuring SNMP, see Network Management and Monitoring Configuration Guide.
Procedure
1. Enter system view.
system-view
2. Enable diagnostic troubleshooting for SNMP trap sending failure events.
diagnostic troubleshooting test snmp-agent trap-send-failure enable
By default, diagnostic troubleshooting is enabled for SNMP trap sending failure events.
3. Perform diagnostic troubleshooting for SNMP trap sending failure events.
diagnostic troubleshooting test snmp-agent trap-send-failure [ ip-address ipv4-address | ipv6-address ipv6-address ]
Configuring BGP diagnostic troubleshooting
Configuring health diagnostic troubleshooting for the BGP module
About this task
With health diagnostic troubleshooting enabled for the BGP module and BGP configuration completed, the system starts to monitor the running status of the BGP module. The BGP module records unhealthy events in the GOLD module. When you perform health diagnostic troubleshooting for the BGP module, the BGP module obtains the unhealthy information from the GOLD module and determines whether the BGP module is in healthy state.
Procedure
1. Enter system view.
system-view
2. (Optional.) Enable health diagnostic troubleshooting for the BGP module.
diagnostic troubleshooting health module bgp enable
By default, health diagnostic troubleshooting is enabled for the BGP module.
3. Perform health diagnostic troubleshooting for the BGP module.
diagnostic troubleshooting health module bgp
Configuring diagnostic troubleshooting for BGP session setup failure events
About this task
Perform this task to configure diagnostic troubleshooting for BGP session setup failure events in a BGP instance or for a BGP peer.
· With diagnostic troubleshooting for BGP session setup failure events enabled in a BGP instance, the device records the failure information in the memory of the GOLD module automatically. After you configure this feature, the device displays the diagnostic troubleshooting information stored in the GOLD module to help you locate the failure reason.
· With diagnostic troubleshooting for BGP session setup failure events enabled for a BGP peer, the device tries to reestablish a BGP session with a BGP peer before the diagnostic troubleshooting period times out and displays the diagnostic troubleshooting information to help you locate the failure reason.
Procedure
1. Enter system view.
system-view
2. (Optional.) Enable diagnostic troubleshooting for BGP session setup failure events.
¡ Enable diagnostic troubleshooting for BGP session setup failure events in a BGP instance.
diagnostic troubleshooting test establish-abnormal bgp enable
By default, diagnostic troubleshooting is enabled for BGP session setup failure events in a BGP peer.
¡ Enable diagnostic troubleshooting for BGP session setup failure events for a BGP peer.
diagnostic troubleshooting test peer-establish-abnormal bgp enable
By default, diagnostic troubleshooting is enabled for BGP session setup failure events for a BGP peer.
3. Perform diagnostic troubleshooting for BGP session setup failure events.
¡ Perform diagnostic troubleshooting for BGP session setup failure events in a BGP instance.
diagnostic troubleshooting test establish-abnormal bgp [ instance instance-name ] [ vpn-instance vpn-instance-name ]
¡ Perform diagnostic troubleshooting for BGP session setup failure events for a BGP peer.
diagnostic troubleshooting test peer-establish-abnormal bgp [ instance instance-name ] [ vpn-instance vpn-instance-name ] peer { ip-address ipv4-address | ipv6-address ipv6-address } [ diagnostic-time diagnostic-time ]
Configuring diagnostic troubleshooting for BGP session down events
About this task
With diagnostic troubleshooting for BGP session down events enabled, the device records the session down information in the memory of the GOLD module automatically. After you execute this command, the device displays the failure information stored in the GOLD module to help you locate the failure reason.
Procedure
1. Enter system view.
system-view
2. (Optional.) Enable diagnostic troubleshooting for BGP session down events.
¡ Enable diagnostic troubleshooting for BGP session down events in a BGP instance.
diagnostic troubleshooting test flap bgp enable
By default, diagnostic troubleshooting for BGP session down events is enabled for all BGP peers.
¡ Enable diagnostic troubleshooting for BGP session down events for a BGP peer.
diagnostic troubleshooting test peer-flap bgp enable
By default, diagnostic troubleshooting for BGP session down events is enabled for a BGP peer.
3. Perform diagnostic troubleshooting for BGP session down events.
¡ Perform diagnostic troubleshooting for BGP session down events in a BGP instance.
diagnostic troubleshooting test flap bgp [ instance instance-name ] [ vpn-instance vpn-instance-name ]
¡ Perform diagnostic troubleshooting for BGP session down events for a BGP peer.
diagnostic troubleshooting test peer-flap bgp [ instance instance-name ] [ vpn-instance vpn-instance-name ] peer { ip-address ipv4-address | ipv6-address ipv6-address }
Configuring diagnostic troubleshooting for BGP flowspec route adding and deletion events
About this task
With diagnostic troubleshooting for BGP flowspec route adding and deletion events enabled, the device records the flowspec route adding and deletion information in the memory of the GOLD module automatically. After you perform this task, the device displays the flowspec route adding and deletion information stored in the GOLD module.
Procedure
1. Enter system view.
system-view
2. (Optional.) Enable diagnostic troubleshooting for BGP flowspec route adding and deletion events.
diagnostic troubleshooting test test route-record bgp enable
By default, diagnostic troubleshooting is enabled for BGP flowspec route adding and deletion events.
3. Perform diagnostic troubleshooting for BGP flowspec route adding and deletion events.
diagnostic troubleshooting test route-record bgp [ instance instance-name ] flowspec
Displaying information about diagnostic tests
Execute the following command in any view.
display diagnostic content [ slot slot-number ] [ verbose ]
For more information about this command, see System Management Command Reference.
Displaying test results
Execute the following command in any view.
display diagnostic result [ slot slot-number [ test test-name ] ] [ verbose ]
For more information about this command, see System Management Command Reference.
Clearing test results
Execute the following command in user view.
reset diagnostic result [ slot slot-number [ test test-name ] ]
For more information about this command, see System Management Command Reference.
