- Table of Contents
- Related Documents
-
| Title | Size | Download |
|---|---|---|
| 01-BRAS Services Troubleshooting Guide | 1.58 MB |
Contents
General troubleshooting flow and diagnostic information collection for BRAS services
General BRAS troubleshooting procedures by plane
General troubleshooting procedure for the control plane
General troubleshooting procedure for the data plane
Collecting information about online users
Collecting information about abnormally logged-off users
BRAS service troubleshooting procedures at a glance
Troubleshooting procedures for campus networks
Troubleshooting procedures for carrier networks
Troubleshooting user online failures and abnormal offline events
PPPoE user online failures and abnormal offline events
PPPoE agency user online failures and abnormal offline events
Campus user failures to access the external network on a PPPoE agency network
L2TP user online failures and abnormal offline events
IPoE user online failures and abnormal offline events
IPoE DHCP user online failures and abnormal offline events
IPoE NDRS user online failures and abnormal offline events
IPoE static user online failure or abnormal offline event
Web authentication page not showing up
Access failure to the Web authentication page
Troubleshooting issues specific to a CUPS network
CP-UP connection management issues
Management channel establishment failure
Packet forwarding failure for the management channel
Control channel establishment failure
Packet forwarding failure for the control channel
Protocol channel establishment failure
Packet forwarding failure for the protocol channel
Master/backup interface failure or master/backup switchover
Long master/backup interface switchover
Data inconsistency between CP and UP
VM creation or startup failure due to insufficient resources
VM startup failure due to version file issues
Subnet request and release failure of BRAS-VMs
High CPU control core usage on a VM
Memory alarm threshold crossings caused by high memory usages of VMs on a vBRAS-CP
DHCP flood attack protection issues
DHCP starvation attack protection issues
Appendix A Reasons for user login failures and abnormal logouts
Identifying login failure reasons
Identifying abnormal logout reasons
Reasons for user login failures and abnormal logouts
AAA forces the PPPoEA user offline
AAA with Authentication no response
AAA with authorization data error
AAA with realtime accounting fail
AAA with start accounting fail
Add nat user data fail(IP Alloc Fail)
Add no backlist no Sub IfMaster
All prefix ranges in the DHCPv6 address pool group have been allocated
All prefix ranges in the DHCPv6 address pool have been allocated
All subnets in the DHCP address pool group have been allocated
All subnets in the DHCP address pool have been allocated
All subnets in the DHCPv6 address pool group have been allocated
All subnets in the DHCPv6 address pool have been allocated
Base service address alloc failed
Cancelled PPPoE agency configuration
CP change from master to backup in cold mode
DHCP allocating IP from local pool failed
DHCP configuration synchronization between CTRL-VM and BRAS-VM failed
DHCP generate request pkt fail
DHCP packet info did not match
DHCP retrieved unexpected IP address
DHCP VSRP status changed to Down
DHCP wait client packet timeout
Enable/disable VSRP Instance command
failed to add nat user data(invalid private network address)
failed to add nat user data(license invalid)
Failed to associate the PPPoEA user with the BRAS user
Failed to authenticate for ldap configuration changed
Failed to authenticate for no ldap binding user's DN
Failed to come online by using CGN because service-instance-group is invalid
Failed to compose tacacs request packet
Failed to connect with the ldap server
Failed to connect with the tacacs server
Failed to create a PPPoEA session
Failed to deliver PPPoEA user information to the kernel
Failed to encode the request packet
Failed to fill the authentication attributes
Failed to get user’s DN from the ldap search result
Failed to inherit user information from PPPoE
Failed to obtain user group information
Failed to parse AAA request message
Failed to smooth the PPPoEA session
Failed to switch workslot for user is not up
Failed to update the PPPoEA session
failover group becomes invalid
Flow-triggered port block assignment does not support CGN
Force user offline by CUSP aging
Going online failed because matching CGN doesn't support port block
Hardware not support IPV6 PD prefix with mask longer than 120
Inherited PPPoE user went offline
Insufficient hardware resources
IP address is not a valid user address
IPoE access mode or authentication method error
IPoE lease sub-user without the main user
L2TP session wait for time out
LAC too many session in mid state tunnel
Ldap admin-binding operation failed
Ldap server connection error occurred while authenticating
Logged out by the RADIUS proxy
Maximum concurrent users for the account has been reached
nat online failed because of match config failed
nat online failed because of match session-service-location failed
NAT Online failed by not bind vsrp
NAT Online failed by vsrp channel state error
No AAA response during realtime accounting
No AAA response for accounting start
No response of control packet from peer
On-line user with the same mac exists
Only static leased users are permitted
PPP authentication method error
PPP recv ip6cp Protocol Reject
PPP wait chap response time out
PPP wait pap response time out
PPPoE agency failed to start PPP
PPPoEA session information failed to be synchronized between slots
Radius authentication and authorization do not same
RADIUS authentication rejected
Re-DHCP for IPoE Web authentication
Service-type mismatch with local-user's
TACACS authentication rejected
Tacacs continue authentication failed
Tacacs follow authentication failed
Tacacs restart authentication failed
The address state is incorrect
The BRAS user associated with the PPPoEA user is offline
The IPoE lease user is conflict with the static user
The memory reached the restart threshold
The NAT instance was unbound from CGN-UP backup profile
The non-static user is kicked off the line by the static user
The number of terminals on this interface exceeds limit
The number of terminals on this machine exceeds limit
The number of users exceeds limit
The PPPoEA user already exists
The PPPoEA user already exists
The PPPoEA user does not exist in the PPPoE module
The PPPoEA user failed to select an access interface
The PPPoEA user failed to select an access interface because agency is not enabled
The PPPoEA user failed to select an access interface because the interface is physically down
The PPPoEA user failed to switch the negotiation slot
The protocol stack on which the base service depends is IPv4
The protocol stack on which the base service depends is IPv6
The source IP address of the L2TP tunnel does not support backup
The user conflicts with an online user with the same DHCP client ID
The user group of the BRAS user changed
The user with the same MAC address already exists on the backup interface
The user with the same IP address already exists on the backup interface
The user's 802.1X client has not come online
The VPN bound to the IPoE static user and the authorized VPN are different
The VPN to which the subscriber belongs has been deleted
UCM notifies the PPPoEA user to go offline
User binding attributes mismatch with local-user's
About this guide
This document provides information about troubleshooting common software and hardware issues with broadband remote access server (BRAS) services.
Applicable products
This document is applicable to the products in Table 1.
Table 1 Applicable products and software versions
|
Product series |
Software version |
|
SR8800-X |
R8380PXX |
|
SR8800-X-S |
R8385PXX |
|
SR8800-F |
R8385PXX |
|
CR16000-F |
R8385PXX |
|
CR16000-M |
R8385PXX |
|
vBRAS1000-CP |
E2021P20 or higher |
|
vBRAS1000-vUP |
E3021P20 or higher |
Prerequisites
This document provides generic BRAS services troubleshooting procedures for H3C BRAS devices. Some of the information might not apply to your device depending on its software and hardware version.
The interface numbers in this documentation are for illustration only. They might differ from the interface numbers available on your device.
The following information is provided based on the assumption that you have basic knowledge of BRAS services and are familiar with H3C BRAS devices.
General troubleshooting flow and diagnostic information collection for BRAS services
General troubleshooting flow
The following information provides a general high-level troubleshooting procedure for quick isolation of the problematic module and failure cause. You can modify this procedure based on your expertise and experience for effective troubleshooting of issues that differ in severity and complexity.
1. Identify the service impact scope of the failure.
Identify the following items:
¡ Affected subscriber services (for example, broadband and IPTV).
¡ The access services (for example, PPPoE and IPoE) used on the BRAS device to deliver the subscriber services.
¡ The number of affected users.
2. Identify the network topology.
This step is essential to troubleshooting BRAS issues, which are typically pertinent to the network.
3. Identify manual operations done on the network before and after the issue occurs.
Manual operations include configuration change and business cutover. This step helps narrow down the triggers of the issue quickly.
4. Analyze the characteristics of the affected users to find out if they have anything in common.
Examples of commonalities include the same access mode and the same Layer 2 switch.
5. Identify the point of failure.
Many times, network issues are caused by non-BRAS devices on the network. After you rule out the BRAS device, assist the customer in identifying the point of failure by using tools such as QoS flow statistics and port mirroring.
6. Identify the severity of the issue impact.
This step determines the action to take.
¡ If the impact is severe, quickly gather user information and take prompt action to restore services.
¡ If the impact is trivial, preferentially identify the cause of the issue and then remove the issue.
General BRAS troubleshooting procedures by plane
BRAS troubleshooting is divided into control plane troubleshooting and data plane troubleshooting.
· Control plane—Establishes, controls, and maintains network connectivity. It contains routing, signaling, and control protocols for routing, MPLS, and link layer connectivity. The protocols in the control plane generate and issue forwarding entries to the data plane to control its forwarding behaviors.
· Data plane—Also called the forwarding plane. It contains functionalities for receiving packets (including packets destined for the local node), forwarding data packets destined for remote nodes, and sending locally generated packets. Examples of data plane functionalities include the IPv4 and IPv6 protocol stacks, sockets, and functionalities that forward packets based on the forwarding tables at different layers.
General troubleshooting procedure for the control plane
Figure 1 shows the components used for BRAS user authentication and access. The User Connection Management (UCM) component is the bridge between the other components. It facilitates interaction between the components and assists in the establishment, maintenance, and termination of user connections.
Figure 1 Basic components used for BRAS user authentication and access
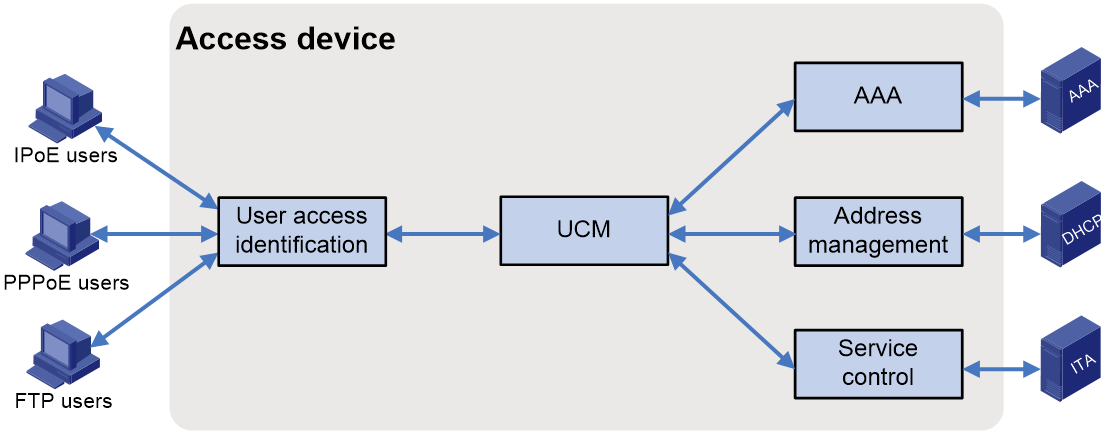
The following information describes the basic functionality of each component:
· User access identification component—Identifies and processes various user access protocol packets and obtains important user information such usernames, passwords, and physical locations during authentication. This information helps ensure secure and legitimate user access.
· UCM—Connects the other components to facilitate interaction between them and assists in the establishment, maintenance, and termination of user connections.
· AAA—Works with the AAA server to provide authentication, authorization, and accounting for users.
· Address management component—Allocates IP addresses to access users, and ensure proper use of IP resources through unified IP address management.
· Service control component—Controls the privileges, bandwidth, and QoS policies for the users to access basic services and value-added services.
The following information provides the general procedure to troubleshoot the control plane:
1. Collect information about the affected users, including their usernames, MAC addresses, and VLANs.
Execute the trace access-user command to trace the network access flow for an affected user, from login and authentication to address allocation. You can use the debugging output from this command to identify the phase in which the failure occurred.
[bras] trace access-user object 1 ?
access-mode Specify users by access mode
c-vlan Specify users by Customer-VLAN
calling-station-id Specify users by calling station ID
interface Specify users by interface
ip-address Specify a user by IP address
mac-address Specify users by MAC address
s-vlan Specify users by Service-VLAN
tunnel-id Specify users by tunnel ID
username Specify a user by username
2. Examine the configuration for the identified erroneous point and correct the misconfiguration, if any.
3. If the configuration is correct, examine the related modules such as the access, AAA (or RADIUS), address allocation, portal, and L2TP modules for errors.
|
|
NOTE: After you specify a traced object by using the trace access-user command, you can use the display trace access-user command to view the configuration for the traced object. This command also displays the remaining amount of time for the trace session. When the remaining amount of time becomes 0, the trace session expires. To trace the same object, you must reconfigure it. |
General troubleshooting procedure for the data plane
H3C BRAS devices provide hardware-based forwarding. The data plane is not error prone. If you receive reports on data traffic issues such as inaccurate rate limiting, packet loss, or loss of connectivity, take the following actions:
1. Verify that the user is online.
2. Verify that the rate limit and other authorization attributes assigned by the server to the user are correct.
3. Verify that data traffic from the user can arrive at the BRAS device.
4. If the issue persists, collect fault information and contact technical support for help.
Collecting user information
Service restoration is the top priority in dealing with a service outage while troubleshooting typically takes time. It is not always possible to promptly identify the cause of service outage solely based on debugging information. To assist in later troubleshooting, you must collect user information while restoring services.
The following are the best practices for user information collection:
· If only one user is affected, collect data that each module has for the affected user and some of the unaffected users to do a comparative analysis.
· If multiple users are affected, collect information about all affected users as soon as possible and contact technical support.
User information collection is to collect information about online users and users that were logged off abnormally. H3C BRAS devices offer a broad set of commands for you to collect user information. The following information describes only those used most commonly.
Support for the parameters in the commands described in this document differs depending on the hardware platform and software version.
Collecting information about online users
This task collects information about normal online users and temporary users, as well residual user information that should have been deleted.
Before you use the commands in this document to collect user information for troubleshooting purposes, read the command reference for the device to identify what information each parameter can produce. This will help you collect useful information efficiently.
For example, to collect complete information about a single user, execute the commands with the verbose keyword.
Collecting information for troubleshooting the PPPoE module
1. Execute the following command to collect information about PPP users that use the PPPoE access service. This command is the primary command you use to collect information about PPP users.
<Sysname> display access-user user-type pppoe ?
> Redirect it to a file
>> Redirect it to a file in append mode
auth-type Specify a user by authentication type
count Display the total number of users
domain Specify users by ISP domain
interface Specify users by interface
ip-pool Specify users by an IP pool
ip-pool-group Specify users by an IP pool group
ip-type Specify users by IP type
ipv6-address-protocol Specify users by IPv6 address protocol
ipv6-pool Specify users by an IPv6 pool
ipv6-pool-group Specify users by an IPv6 pool group
lac-ip Specify users by the IP address of an LAC
lns-ip Specify users by the IP address of an LNS
mac-address Specify a user by MAC address
remote-name Specify users by the tunnel name
slot Specify the slot number
start-time Specify users by the start time of coming online
user-address-type Specify users by address type
user-group Specify users by a user group
username Specify a user by username
verbose Display detailed information about users
vpn-instance Specify a VPN instance
vxlan Specify users by a range of VXLANs
| Matching output
<cr>
2. Execute the following command to collect statistics and information on the PPPoE server for online users.
<Sysname> display pppoe-server ?
chasten PPPoE connection blocking
packet Packet statistics
session PPPoE session information
throttled-mac Throttled MAC information
Collecting information for troubleshooting the IPoE module
1. Execute the following command to collect information about IPoE users, including IPoE Web users.
<Sysname> display access-user auth-type ?
admin Admin authentication
bind Bind authentication
dot1x 802.1X authentication
dvpn Dynamic VPN authentication
ike IKE authentication
mac-auth Mac authentication
portal Portal authentication
ppp PPP authentication
pre-auth Pre web authentication
sslvpn SSL VPN authentication
web-auth Web authentication
2. Execute the following command to collect information about IPoE bind authentication users.
<Sysname> display access-user auth-type bind ?
> Redirect it to a file
>> Redirect it to a file in append mode
count Display the total number of users
domain Specify users by ISP domain
interface Specify users by interface
ip-pool Specify users by an IP pool
ip-pool-group Specify users by an IP pool group
ip-type Specify users by IP type
ipv6-address-protocol Specify users by IPv6 address protocol
ipv6-pool Specify users by an IPv6 pool
ipv6-pool-group Specify users by an IPv6 pool group
lac-ip Specify users by the IP address of an LAC
lns-ip Specify users by the IP address of an LNS
mac-address Specify a user by MAC address
remote-name Specify users by the tunnel name
slot Specify the slot number
start-time Specify users by the start time of coming online
user-address-type Specify users by address type
user-group Specify users by a user group
user-type Specify users by type
username Specify a user by username
verbose Display detailed information about users
vpn-instance Specify a VPN instance
vxlan Specify users by a range of VXLANs
| Matching output
<cr>
Collecting information for troubleshooting the portal module
The device provides IPoE Web service in place of portal Web service. You collect information about IPoE Web service users through the commands for the IPoE module.
Collecting information for troubleshooting the L2TP module
1. Execute the following command to collect information about L2TP sessions.
<Sysname> display l2tp session ?
> Redirect it to a file
>> Redirect it to a file in append mode
lac Display L2TP session information of LAC
lns Display L2TP session information of LNS
local-address Specify sessions by the local IP address
remote-address Specify sessions by the remote IP address
statistics Statistics information
temporary L2TP temporary session information
tunnel-id Specify sessions by the specified local tunnel ID
username Specify sessions by the username
verbose Display detailed L2TP session information
| Matching output
<cr>
2. Execute the following command to collect information about temporary L2TP sessions.
<Sysname> display l2tp session temporary ?
> Redirect it to a file
>> Redirect it to a file in append mode
| Matching output
<cr>
3. Execute the following command to collect information about L2TP tunnels.
<Sysname> display l2tp tunnel ?
> Redirect it to a file
>> Redirect it to a file in append mode
group-name Specify tunnels by the group name
group-number Specify tunnels by the group number
lac Display L2TP tunnel information of LAC
lns Display L2TP tunnel information of LNS
local-address Specify tunnels by the local IP address
remote-address Specify tunnels by the remote IP address
statistics Statistics information
tunnel-id Specify tunnels by the local L2TP tunnel ID
tunnel-name Specify tunnels by the remote tunnel name
verbose Display detailed L2TP tunnel information
vsrp L2TP VSRP tunnel information
| Matching output
<cr>
4. Execute the following command on the LAC to collect information about PPP users that access the network through L2TP.
<Sysname> display access-user user-type lac ?
> Redirect it to a file
>> Redirect it to a file in append mode
auth-type Specify a user by authentication type
count Display the total number of users
domain Specify users by ISP domain
interface Specify users by interface
ip-pool Specify users by an IP pool
ip-pool-group Specify users by an IP pool group
ip-type Specify users by IP type
ipv6-address-protocol Specify users by IPv6 address protocol
ipv6-pool Specify users by an IPv6 pool
ipv6-pool-group Specify users by an IPv6 pool group
lac-ip Specify users by the IP address of an LAC
lns-ip Specify users by the IP address of an LNS
mac-address Specify a user by MAC address
remote-name Specify users by the tunnel name
slot Specify the slot number
start-time Specify users by the start time of coming online
user-address-type Specify users by address type
user-group Specify users by a user group
username Specify a user by username
verbose Display detailed information about users
vpn-instance Specify a VPN instance
vxlan Specify users by a range of VXLANs
| Matching output
<cr>
5. Execute the following command on the LNS to collect information about PPP users that access the network through L2TP.
<Sysname> display access-user user-type lns ?
> Redirect it to a file
>> Redirect it to a file in append mode
auth-type Specify a user by authentication type
count Display the total number of users
domain Specify users by ISP domain
interface Specify users by interface
ip-pool Specify users by an IP pool
ip-pool-group Specify users by an IP pool group
ip-type Specify users by IP type
ipv6-address-protocol Specify users by IPv6 address protocol
ipv6-pool Specify users by an IPv6 pool
ipv6-pool-group Specify users by an IPv6 pool group
lac-ip Specify users by the IP address of an LAC
lns-ip Specify users by the IP address of an LNS
mac-address Specify a user by MAC address
remote-name Specify users by the tunnel name
slot Specify the slot number
start-time Specify users by the start time of coming online
user-address-type Specify users by address type
user-group Specify users by a user group
username Specify a user by username
verbose Display detailed information about users
vpn-instance Specify a VPN instance
vxlan Specify users by a range of VXLANs
| Matching output
<cr>
Collecting information for troubleshooting the DHCP module
1. Collect information about the idle IP addresses available for allocation on the DHCP server.
<Sysname> display dhcp server free-ip ?
> Redirect it to a file
>> Redirect it to a file in append mode
pool Specify a DHCP pool
vpn-instance Specify a VPN instance
| Matching output
<cr>
2. Collect information about the allocated IP addresses that are in use on the DHCP server.
<Sysname> display dhcp server ip-in-use ?
> Redirect it to a file
>> Redirect it to a file in append mode
interface Specify the interface
ip Specify an IP address
pool Specify a DHCP pool
subnet Specify s subnet
up-backup-group Specify a UPBACKUPGROUP
up-id Specify a UP Id
vpn-instance Specify a VPN instance
vxlan Specify a VXLAN
| Matching output
<cr>
3. Collect information about IP and MAC bindings in expired leases on the DHCP server.
<Sysname> display dhcp server expired ?
> Redirect it to a file
>> Redirect it to a file in append mode
interface Specify the interface
ip Specify an IP address
mac Specify a MAC address
pool Specify a DHCP pool
up-backup-group Specify a UPBACKUPGROUP
up-id Specify a UP Id
verbose Detailed information
vpn-instance Specify a VPN instance
vxlan Specify a VXLAN
| Matching output
<cr>
4. Collect information about IP and MAC bindings recorded for IP address conflict on the DHCP server.
<Sysname> display dhcp server conflict ?
> Redirect it to a file
>> Redirect it to a file in append mode
interface Specify the interface
ip Specify an IP address
up-backup-group Specify a UPBACKUPGROUP
up-id Specify a UP Id
vpn-instance Specify a VPN instance
vxlan Specify a VXLAN
| Matching output
<cr>
5. Collect information about client address entries recorded on the DHCP relay agent.
<Sysname> display dhcp relay client-information ?
> Redirect it to a file
>> Redirect it to a file in append mode
interface Specify the interface
ip Specify an IP address
| Matching output
<cr>
Collecting information for troubleshooting the AAA module
No commands are available for the AAA module to record user information. To obtain information about AAA users, use the information recorded by the access modules.
Collecting information about abnormally logged-off users
You collect information about abnormally logged-off users for analysis of the recorded logoff reasons and message exchanges between modules to identify the root cause of the abnormal logoffs.
Before you use the commands in this document to collect user information for troubleshooting purposes, read the command reference for the device to identify what information each parameter can produce. This will help you collect useful information efficiently.
Collecting information for troubleshooting the PPPoE module
1. Collect PPPoE server negotiation packet statistics.
<Sysname> display pppoe-server packet statistics ?
> Redirect it to a file
>> Redirect it to a file in append mode
slot Specify the slot number
| Matching output
<cr>
2. Collect PPP negotiation packet statistics.
<Sysname> display ppp packet statistics ?
> Redirect it to a file
>> Redirect it to a file in append mode
slot Specify the slot number
| Matching output
<cr>
3. Collect the offline records for login users.
<Sysname> display aaa offline-record access-type ppp ?
> Redirect it to a file
>> Redirect it to a file in append mode
brief Display brief information
count Specify the number of records to be displayed
domain Specify an ISP domain
interface Specify an interface
ip Specify an IPv4 address
ipv6 Specify an IPv6 address
mac-address Specify a MAC address
s-vlan Specify a service provider network VLAN
slot Specify the slot number
username Specify a username
| Matching output
<cr>
Collecting information for troubleshooting the IPoE module
1. Collect information about abnormally logged-off DHCP clients.
<Sysname> display ip subscriber abnormal-logout ?
> Redirect it to a file
>> Redirect it to a file in append mode
interface Specify an interface
ip Specify the IP address
ip-type Specify users by IP type
ipv6 Specify the IPv6 address
mac Specify a MAC address
slot Specify the slot number
verbose Detailed information
| Matching output
<cr>
2. Collect the offline records for IPoE users.
<Sysname> display aaa offline-record access-type ipoe ?
> Redirect it to a file
>> Redirect it to a file in append mode
brief Display brief information
count Specify the number of records to be displayed
domain Specify an ISP domain
interface Specify an interface
ip Specify an IPv4 address
ipv6 Specify an IPv6 address
mac-address Specify a MAC address
s-vlan Specify a service provider network VLAN
slot Specify the slot number
username Specify a username
| Matching output
<cr>
3. Collect statistics for IPoE users.
<Sysname> display access-user count ?
> Redirect it to a file
>> Redirect it to a file in append mode
| Matching output
<cr>
Collecting information for troubleshooting the L2TP module
1. Collect L2TP protocol packet statistics.
<Sysname> display l2tp control-packet statistics ?
> Redirect it to a file
>> Redirect it to a file in append mode
summary Summary L2TP control packet statistics
tunnel L2TP control packet statistics of each tunnel
| Matching output
<cr>
2. Collect L2TP statistics.
<Sysname> display l2tp statistics ?
all All L2TP statistics
rdbm RedisDBM statistics
vsrp VSRP statistics
Collecting information for troubleshooting the DHCP module
1. Collect DHCP server statistics.
<Sysname> display dhcp server statistics ?
> Redirect it to a file
>> Redirect it to a file in append mode
pool Specify a DHCP pool
vpn-instance Specify a VPN instance
| Matching output
<cr>
2. Collect DHCP relay statistics.
<Sysname> display dhcp relay packet statistics ?
> Redirect it to a file
>> Redirect it to a file in append mode
interface Specify the interface
| Matching output
<cr>
Collecting information for troubleshooting the AAA module
1. Collect the abnormal offline records maintained by the AAA module.
<Sysname> display aaa abnormal-offline-record ?
> Redirect it to a file
>> Redirect it to a file in append mode
access-type Specify an access type
domain Specify an ISP domain
interface Specify an interface
ip Specify an IPv4 address
ipv6 Specify an IPv6 address
mac-address Specify a MAC address
offline-reason Specify a user offline reason
s-vlan Specify a service provider network VLAN
slot Specify the slot number
time Specify a time range
username Specify a username
| Matching output
<cr>
2. Collect the normal offline records maintained by the AAA module.
<Sysname> display aaa normal-offline-record ?
> Redirect it to a file
>> Redirect it to a file in append mode
access-type Specify an access type
domain Specify an ISP domain
interface Specify an interface
ip Specify an IPv4 address
ipv6 Specify an IPv6 address
mac-address Specify a MAC address
s-vlan Specify a service provider network VLAN
slot Specify the slot number
time Specify a time range
username Specify a username
| Matching output
<cr>
3. Collect the offline records maintained by the AAA module.
<Sysname> display aaa offline-record ?
> Redirect it to a file
>> Redirect it to a file in append mode
access-type Specify an access type
domain Specify an ISP domain
interface Specify an interface
ip Specify an IPv4 address
ipv6 Specify an IPv6 address
mac-address Specify a MAC address
s-vlan Specify a service provider network VLAN
slot Specify the slot number
time Specify a time range
username Specify a username
| Matching output
<cr>
4. Collect the user online failure records maintained by the AAA module.
<Sysname> display aaa online-fail-record ?
> Redirect it to a file
>> Redirect it to a file in append mode
access-type Specify an access type
domain Specify an ISP domain
interface Specify an interface
ip Specify an IPv4 address
ipv6 Specify an IPv6 address
mac-address Specify a MAC address
s-vlan Specify a service provider network VLAN
slot Specify the slot number
time Specify a time range
username Specify a username
| Matching output
<cr>
5. Collect the RADIUS packet statistics maintained by the AAA module.
<Sysname> display radius statistics ?
> Redirect it to a file
>> Redirect it to a file in append mode
server Specify a RADIUS server
| Matching output
<cr>
6. Collect load statistics for all RADIUS servers.
<Sysname> display radius server-load statistics ?
> Redirect it to a file
>> Redirect it to a file in append mode
| Matching output
<cr>
7. Collect the statistics maintained by the RADIUS module for the online access users in ISP domains.
<Sysname> display domain access-user statistics ?
> Redirect it to a file
>> Redirect it to a file in append mode
| Matching output
<cr>
BRAS service troubleshooting procedures at a glance
Troubleshooting procedures for campus networks
The troubleshooting procedures listed in Table 2 apply to the following router series:
· SR8800-X.
· SR8800-X-S.
· SR8800-F.
· CR16000-F.
· CR16000-M.
Support for the listed procedures differs depending on the router series.
Use Table 2 to quickly locate the troubleshooting procedure of interest by failure type.
Table 2 BRAS service troubleshooting procedures for campus networks
Troubleshooting procedures for carrier networks
Table 3 lists the troubleshooting procedures for the following router series:
· CR16000-F.
· SR8800-F.
· vBRAS1000-CP.
· vBRAS1000-vUP.
Support for the listed procedures differs depending on the router model.
Control-/user plane separation (CUPS) networks use the same troubleshooting procedures as non-CUPS networks. This document uses a non-CUPS network for example to describe the troubleshooting procedures.
|
|
IMPORTANT: · Before you use this guide to troubleshoot BRAS services on a CUPS network, make sure you are familiar with the CUPS network architecture and the configuration for service modules, especially the configuration specific to service modules such as PPPoE and L2TP. This will help you troubleshoot BRAS issues more quickly. · On a CUPS network, execute the commands in this document on the control plane (CP) devices unless otherwise stated. |
For information about the CUPS network architecture, see CP and UP separation basics in the CP and UP separation configuration guide for the BRAS device. For information about configuring a service module, see the configuration guide that come with the BRAS device for that module.
Use Table 3 to quickly locate the troubleshooting procedure of interest by failure type on a telecom network.
Table 3 BRAS service troubleshooting procedures for carrier networks
Troubleshooting user online failures and abnormal offline events
PPPoE user online failures and abnormal offline events
Symptom
A PPPoE user fails to come online or abnormally goes offline.
Common causes
The following are the common causes of this type of issue:
· A user enters an incorrect username or password.
· The number of consecutive authentication failures of a user exceeds the maximum number allowed, and the user is blocked. The blocking period has not expired.
· The configuration is incorrect. For example, no IP address pool is configured, or the IP addresses in the configured IP address pool are exhausted. As a result, a user cannot obtain an IP address.
· A user owes fees.
Troubleshooting flow
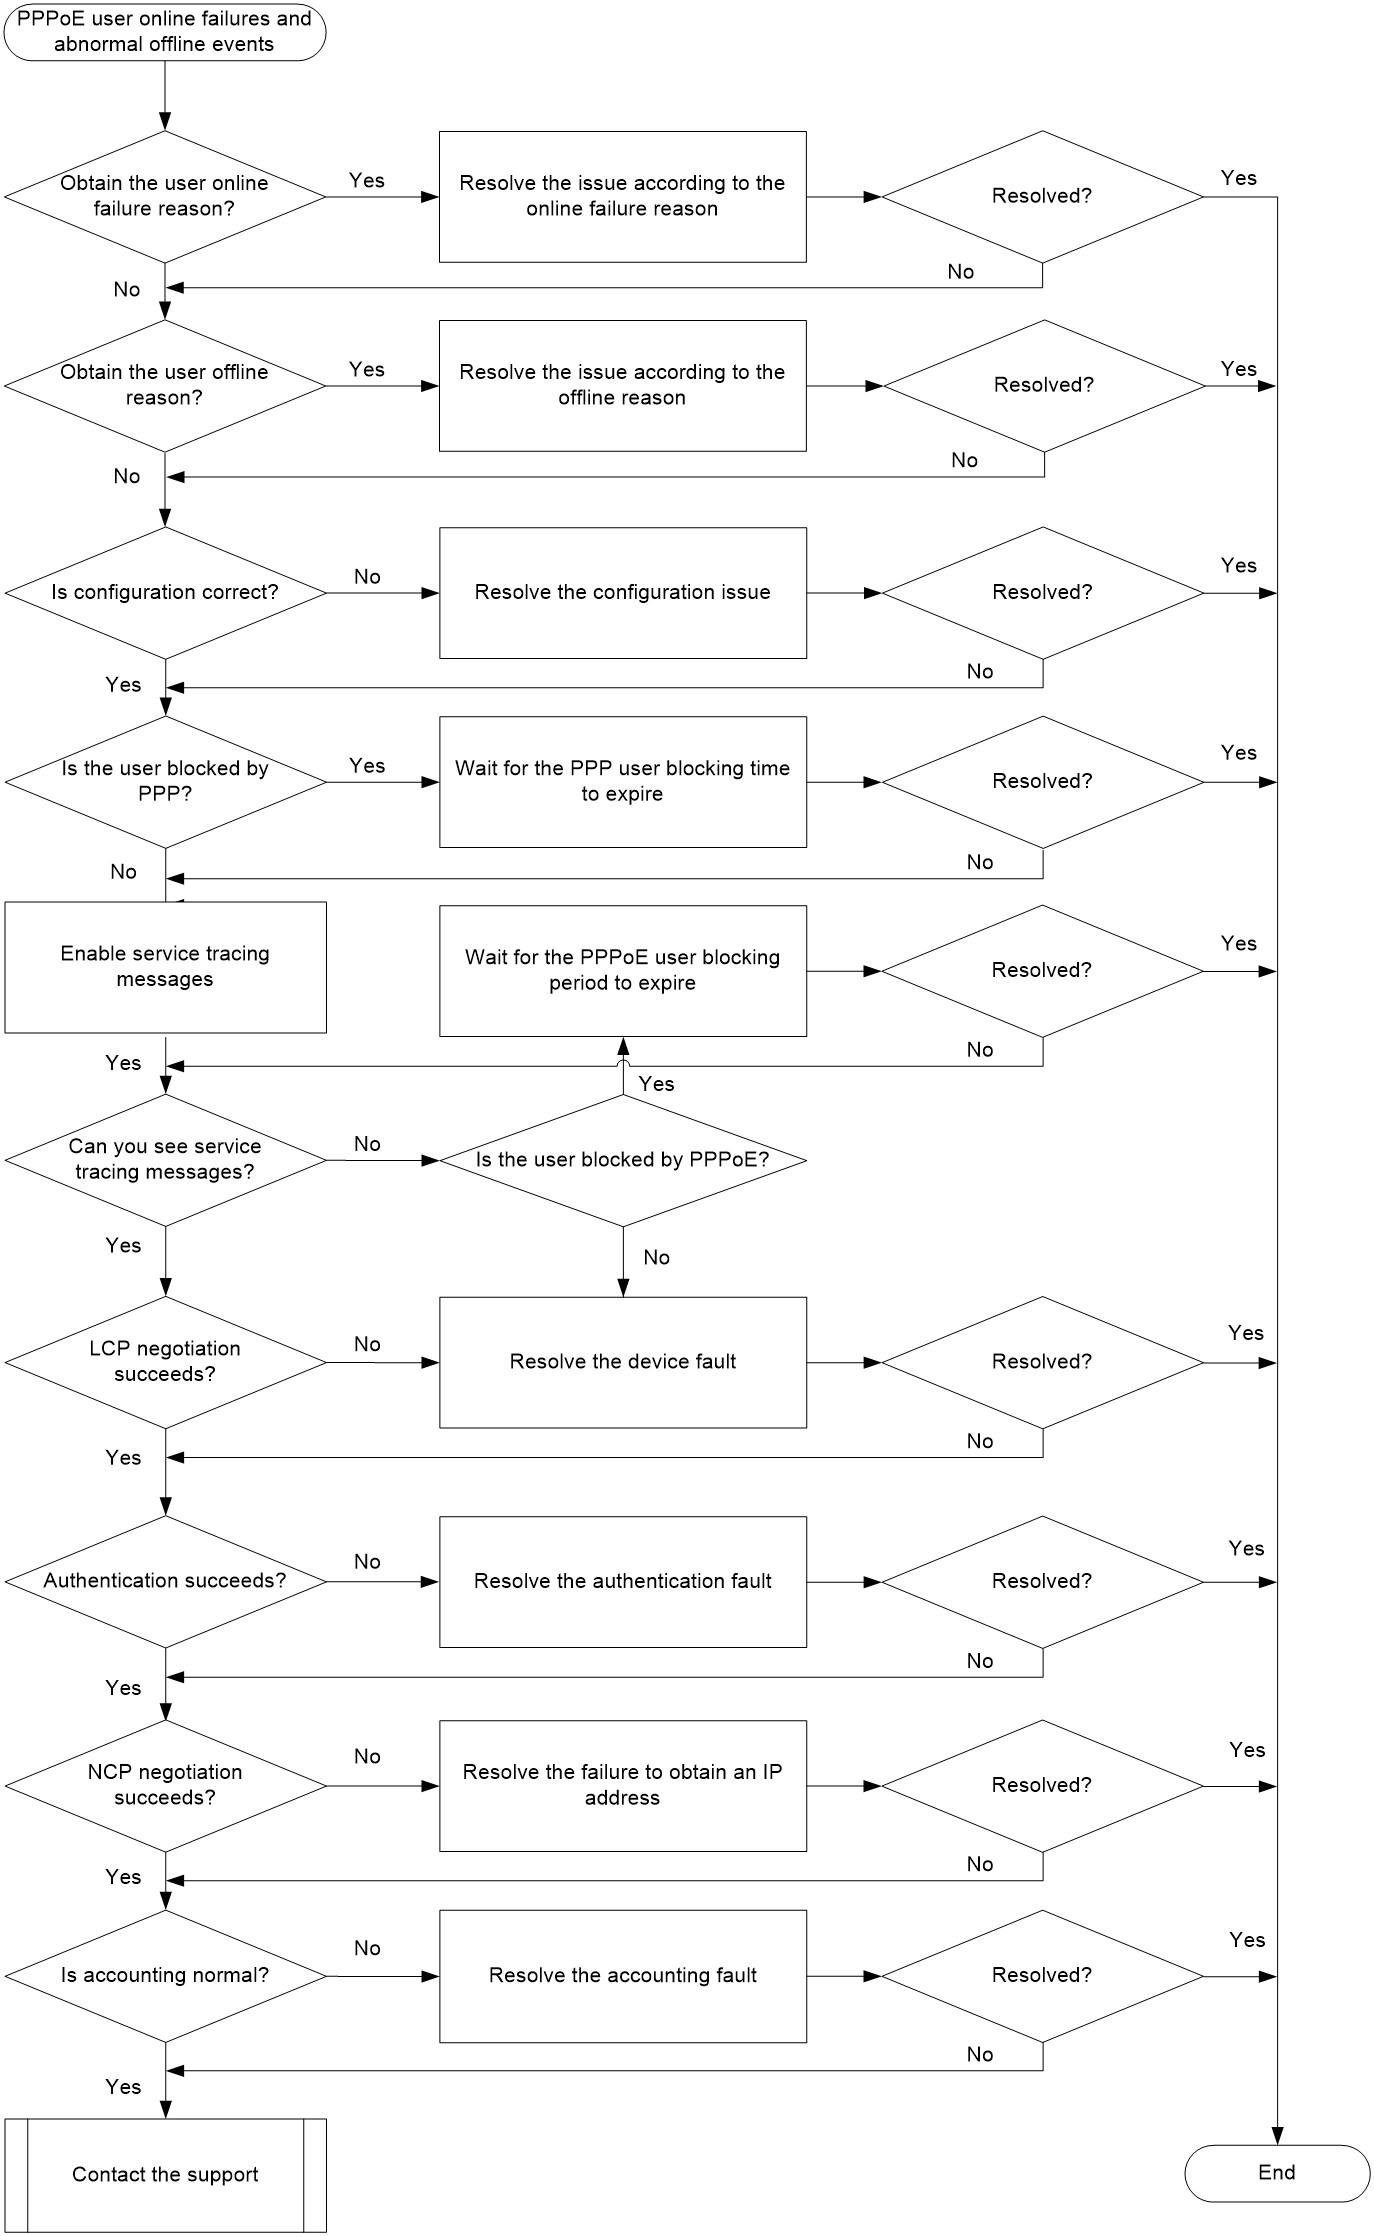
Figure 2 shows the troubleshooting flowchart.
Figure 2 Flowchart for troubleshooting PPPoE user online failures and abnormal offline events
Solution
1. View the PPPoE user online failure reasons.
Execute the display aaa online-fail-record command to display user online failure reasons.
<Sysname> display aaa online-fail-record username aaa
Username: aaa
Domain: test
MAC address: 0010-9400-0007
Access type: PPPoE
Access interface: Ten-GigabitEthernet3/1/1
SVLAN/CVLAN: -/-
IP address: -
IPv6 address: -
Online request time: 2019/09/23 14:57:06
Online failure reason: PPP negotiation terminated.
The Online failure reason field in the command output displays the user online failure reason. You can roughly locate the fault based on the failure reason, which provides guidance for later troubleshooting. Search for the displayed reason in “Appendix A Reasons for user login failures and abnormal logouts” and troubleshoot according to the corresponding solution.
You can resolve the issues caused by some failure reasons (for example, Authentication method error or Local authentication request was rejected) by checking the configuration. If you cannot see the failure records for some failure reasons, proceed with the next step.
2. View the PPPoE user offline reasons.
If you cannot obtain the online failure reasons for a user in step 1, the user might come online successfully and then go offline. In this case, use the display aaa offline-record command to display user offline records.
<Sysname> display aaa offline-record
Total count: 1
Username: jay
Domain: dm1
MAC address: -
Access type: Telnet
Access interface: GigabitEthernet1/0/1
SVLAN/CVLAN: -/-
IP address: 19.19.0.2
IPv6 address: -
Online request time: 2020-01-02 15:20:33
Offline time: 2020-2-28 15:20:56
Offline reason: User request
If a user first comes online successfully and then goes offline, the Offline reason field in the command output displays the offline reason. You can roughly locate the fault based on the failure reason, which provides guidance for later troubleshooting.
Search for the displayed reason in “Appendix A Reasons for user login failures and abnormal logouts” and troubleshoot according to the corresponding solution.
If you cannot use the display aaa offline-record command to obtain the user offline reasons, proceed with the next step.
3. Verify that the PPPoE user settings are correct.
Troubleshoot the settings according to the manuals for BRASs. For example, see tasks at a glance or configuration examples in the corresponding manuals.
¡ If configuration errors exist, correct the configuration and then try to come online again.
¡ If the configuration is correct but the issue persists, proceed with the next step.
4. Identify whether the user is blocked by PPP.
Execute the display ppp chasten user command to identify whether the user is blocked by PPP.
¡ If the user is blocked, redial after the remaining blocking time expires according to the command output.
¡ If the user is not blocked, proceed with the next step.
5. Enable the service tracing messages.
Execute the trace access-user command to enable the service tracing feature for users to test user online events. After the user online process is completed, view the service tracing messages. If the device does not receive PADI or PADR packets, identify whether the Layer 2 network is reachable, the port state is normal, the access type is Layer 2, the authentication method contains PPP, and the interface is bound to a virtual-template interface.
6. Identify whether the user is blocked by PPPoE.
Execute the display pppoe-server chasten user command to identify whether the user is blocked by PPPoE.
¡ If the user is blocked, redial after the remaining blocking time expires according to the command output.
¡ If the user is not blocked, proceed with the next step.
7. Check the device failures.
If you cannot view any service tracing message for the user, check the following configurations:
¡ Make sure the physical connections of the device are correct.
¡ Make sure the configuration on the device is correct.
¡ Make sure the Layer 2 network configuration is correct.
¡ Make sure packets can reach the device.
In probe view, execute the display hardware internal rxtx packet statistic command to view statistics of packets received/sent by the device driver. Identify whether the user packets are sent to the BRAS. (non-vBRAS-CPs.)
On a CUPS network, identify whether the user packets are sent to the BRAS. For more information, see “User online failure.”
<Sysname> system-view
[Sysname-probe] probe
[Sysname-probe] display hardware internal rxtx packet statistic slot 3 cpu 0
Net port packet loss count:
code counter
Rx packets statistic:
counter success rate
NET ->RXTX : 171883335 171554546 342 pps
Cpu code input list:(Mgment to L1 queue)
code counter success(whitelist/normal)
5 14475 14475(0/14475)
6 2308 2308(0/2308)
17 262 262(0/262)
26 1013133 986703(0/986703)
30 6014064 6014064(0/6014064)
35 282 282(0/282)
37 79280 79280(0/79280)
43 2423 2423(0/2423)
44 44438 44438(0/44438)
45 1181 1181(0/1181)
49 60638 60638(0/60638)
50 25 25(0/25)
51 60361 60361(0/60361)
52 496 496(0/496)
53 115767 115767(115726/41)
54 83228 83228(83228/0)
61 191235 191235(0/191235)
77 12007 11988(0/11988)
99 6041569 6041569(0/6041569)
106 30 30(0/30)
149 158129148 157826808(0/157826808)
175 16985 16985(16979/6)
Callback function packets statistic:
total(r) success(r) total(c) success(c)
MACL: 0 0 0 0
NATL: 0 0 0 0
BFD: 0 0 0 0
(null): 0 0 0 0
Task input pkt statistics:
Task name total success
Main Task : 165540452 165540452
Icmp Task : 30 30
Cpu code input list:(L2 queue to platform)
code counter success drop rate
5 14475 14475 0 0
6 2308 2308 0 0
17 262 262 0 0
26 986703 986703 0 1
35 282 282 0 0
37 79280 79280 0 0
43 2423 2423 0 0
44 44438 44438 0 0
45 1181 1181 0 0
49 60638 60638 0 0
50 25 25 0 0
51 60361 60361 0 0
52 496 496 0 0
53 115767 115767 0 0
54 83228 83228 0 0
61 191235 191235 0 0
77 11988 11988 0 0
99 6041569 6041569 0 12
106 30 30 0 0
149 157826808 157826808 0 314
175 16985 16985 0 0
Cpu code to protocol:
5 ARP_REQ_LOCAL
6 ARP_REL
17 ARP_REQ
26 PPPOE
30 DIAG
35 ND_NA
37 LLDP,CDP
43 ND_NS
44 ND_RS
45 ND_RA
49 OSPF_HELLO,OSPF_LSU,OSPF_LSACK
50 OSPF_DD,OSPF_LSR
51 OSPFV3_HELLO,OSPFV3_LSU,OSPFV3_LSACK
52 OSPFV3_DD,OSPFV3_LSR
53 LDP_HELLO
54 LDP_NOTIF,LDP_INIT,LDP_KPALV,LDP_ADDR,LDP_LABEL
61 DHCP_IPOE,DHCP_SNOOPING,DHCP,DHCPv6_RELAY,DHCPv6_RELS,DHCPv6_SERV
77 IP_SUBNET
99 PPPOE_PPP
106 ICMP,ICMPV6
149 L2TP
175 APP_TELNET
Debug packets statistic:
counter counter rate
NET->RXTX->SERVICE: 0 0 0 pps
SERVICE->RXTX->NET: 0 0 0 pps
failed
MbufTrSend: 0
FoundIfindex: 0
SaveCoreSta: 0
MainCoreSta: 0
TxFailedSta: 0
The 26 and 99 fields represent PPPoE and PPPoE_PPPP, respectively. If the received packet counts for 26 and 99 increase, it means that the device has received PPP/PPPoE packets and sent them to the platform. You can use debugging for the forwarding function to check the layer on which packets are dropped step by step. If the counts do not increase, execute the display hardware internal np pktcnt drop command to identify whether the driver has dropped packet count.
<Sysname> system-view
[Sysname-probe] probe
[Sysname-probe] display hardware internal np pktcnt drop slot 3 (the command for viewing the packet count varies by device model)
Current Mcode Type: SIRIUS_RELEASE
The NP 0 is Both NP
Drop packet statistics
32B7 116497 TOPparse total discarded pkts
350F 916677 TOPresolve total discarded pkts
51A 66 PRS Ingress route interface deny L2 forward
56B 384 PRS Ingress Route interface deny L2 forward
63C 403633 RSV Ingress ARP packet FTN or BROADCAST table no ma
tch
63E 372789 RSV Ingress PROTOCOL_MAC and BROADCAST table no mat
ch
641 161878 RSV Ingress PROTOCOL_MAC.THB is set, but BROADCAST
table no match
645 149489 RSV Ingress multicast, MULTICAST.DROP is set
646 144150 RSV Ingress multicast, match MULTICAST default entr
y, but BROADCAST table no match
663 4 RSV Ingress broadcast packets from route port, PROT
OCOL_PORT table no match
- If the dropped packet count keeps increasing, analyze the possible issues according to the packet drop reasons.
- If the dropped packet count does not increase and the number of packets sent to the CPU also does not increase, it means that packets are not successfully sent to the BRAS. In this case, collect the failure information and contact Technical Support.
Only if the preceding configurations are all correct, you can use the service tracing function to see the tracing messages.
If you determine that the user online failure reason is incorrect configuration, check the local configuration according to the tracing messages.
¡ For a RADIUS authentication user, you must identify whether the RADIUS server is correctly configured and the RADIUS server state is normal.
¡ For a local authentication user, identify whether the local account configuration is correct, and the number of access users is not limited.
8. Identify whether the LCP negotiation succeeds.
You can obtain the negotiation packet statistics on the BRAS and client separately (on the client, you can capture the negotiation packets). In this way, you can quickly locate what causes the LCP negotiation failure: the device, the client, or the cooperation between devices.
<Sysname> display ppp packet statistics
PPP packet statistics in slot 97:
-----------------------------------LCP--------------------------------------
SEND_LCP_CON_REQ : 6185 RECV_LCP_CON_REQ : 6177
SEND_LCP_CON_NAK : 0 RECV_LCP_CON_NAK : 0
SEND_LCP_CON_REJ : 0 RECV_LCP_CON_REJ : 0
SEND_LCP_CON_ACK : 6177 RECV_LCP_CON_ACK : 6000
SEND_LCP_CODE_REJ : 0 RECV_LCP_CODE_REJ : 0
SEND_LCP_PROT_REJ : 0 RECV_LCP_PROT_REJ : 0
SEND_LCP_TERM_REQ : 0 RECV_LCP_TERM_REQ : 0
SEND_LCP_TERM_ACK : 0 RECV_LCP_TERM_ACK : 0
SEND_LCP_ECHO_REQ : 0 RECV_LCP_ECHO_REQ : 0
SEND_LCP_ECHO_REP : 0 RECV_LCP_ECHO_REP : 0
SEND_LCP_FAIL : 0 SEND_LCP_CON_REQ_RETRAN : 185
-----------------------------------IPCP-------------------------------------
SEND_IPCP_CON_REQ : 0 RECV_IPCP_CON_REQ : 0
SEND_IPCP_CON_NAK : 0 RECV_IPCP_CON_NAK : 0
SEND_IPCP_CON_REJ : 0 RECV_IPCP_CON_REJ : 0
SEND_IPCP_CON_ACK : 0 RECV_IPCP_CON_ACK : 0
SEND_IPCP_CODE_REJ : 0 RECV_IPCP_CODE_REJ : 0
SEND_IPCP_PROT_REJ : 0 RECV_IPCP_PROT_REJ : 0
SEND_IPCP_TERM_REQ : 0 RECV_IPCP_TERM_REQ : 0
SEND_IPCP_TERM_ACK : 0 RECV_IPCP_TERM_ACK : 0
SEND_IPCP_FAIL : 0
-----------------------------------IPV6CP-----------------------------------
SEND_IPV6CP_CON_REQ : 0 RECV_IPV6CP_CON_REQ : 0
SEND_IPV6CP_CON_NAK : 0 RECV_IPV6CP_CON_NAK : 0
SEND_IPV6CP_CON_REJ : 0 RECV_IPV6CP_CON_REJ : 0
SEND_IPV6CP_CON_ACK : 0 RECV_IPV6CP_CON_ACK : 0
SEND_IPV6CP_CODE_REJ : 0 RECV_IPV6CP_CODE_REJ : 0
SEND_IPV6CP_PROT_REJ : 0 RECV_IPV6CP_PROT_REJ : 0
SEND_IPV6CP_TERM_REQ : 0 RECV_IPV6CP_TERM_REQ : 0
SEND_IPV6CP_TERM_ACK : 0 RECV_IPV6CP_TERM_ACK : 0
SEND_IPV6CP_FAIL : 0
-----------------------------------OSICP------------------------------------
SEND_OSICP_CON_REQ : 0 RECV_OSICP_CON_REQ : 0
SEND_OSICP_CON_NAK : 0 RECV_OSICP_CON_NAK : 0
SEND_OSICP_CON_REJ : 0 RECV_OSICP_CON_REJ : 0
SEND_OSICP_CON_ACK : 0 RECV_OSICP_CON_ACK : 0
SEND_OSICP_CODE_REJ : 0 RECV_OSICP_CODE_REJ : 0
SEND_OSICP_PROT_REJ : 0 RECV_OSICP_PROT_REJ : 0
SEND_OSICP_TERM_REQ : 0 RECV_OSICP_TERM_REQ : 0
SEND_OSICP_TERM_ACK : 0 RECV_OSICP_TERM_ACK : 0
SEND_OSICP_FAIL : 0
-----------------------------------MPLSCP-----------------------------------
SEND_MPLSCP_CON_REQ : 0 RECV_MPLSCP_CON_REQ : 0
SEND_MPLSCP_CON_NAK : 0 RECV_MPLSCP_CON_NAK : 0
SEND_MPLSCP_CON_REJ : 0 RECV_MPLSCP_CON_REJ : 0
SEND_MPLSCP_CON_ACK : 0 RECV_MPLSCP_CON_ACK : 0
SEND_MPLSCP_CODE_REJ : 0 RECV_MPLSCP_CODE_REJ : 0
SEND_MPLSCP_PROT_REJ : 0 RECV_MPLSCP_PROT_REJ : 0
SEND_MPLSCP_TERM_REQ : 0 RECV_MPLSCP_TERM_REQ : 0
SEND_MPLSCP_TERM_ACK : 0 RECV_MPLSCP_TERM_ACK : 0
SEND_MPLSCP_FAIL : 0
-----------------------------------AUTH-------------------------------------
SEND_PAP_AUTH_REQ : 0 RECV_PAP_AUTH_REQ : 6000
SEND_PAP_AUTH_ACK : 0 RECV_PAP_AUTH_ACK : 0
SEND_PAP_AUTH_NAK : 0 RECV_PAP_AUTH_NAK : 0
SEND_CHAP_AUTH_CHALLENGE: 0 RECV_CHAP_AUTH_CHALLENGE: 0
SEND_CHAP_AUTH_RESPONSE : 0 RECV_CHAP_AUTH_RESPONSE : 0
SEND_CHAP_AUTH_ACK : 0 RECV_CHAP_AUTH_ACK : 0
SEND_CHAP_AUTH_NAK : 0 RECV_CHAP_AUTH_NAK : 0
SEND_PAP_AUTH_FAIL : 0 SEND_CHAP_AUTH_FAIL : 0
Common symptoms include:
¡ During the LCP negotiation process of a PPPoE client, the PPPoE client sends config-requests, and the device responds and sends config-nak/config-reject packets. In this case, the client must modify the attribute values in the corresponding config-requests according to the replies from the device. However, the client might always not modify the negotiation attributes. As a result, the negotiation fails. In this case, you can capture packets or execute the debugging ppp all command to enable debugging to check the attributes that cause the negotiation failure. According to these attributes, you can check the corresponding configuration and make sure the configuration is correct. If the issue persists, contact Technical Support.
¡ The device is configured with CHAP authentication. However, the client supports only PAP authentication. Therefore, LCP negotiation always fails. In this case, modify CHAP authentication to PAP authentication on the device.
9. Identify whether authentication succeeds.
¡ For local authentication, the authentication failure reason might be:
- The local account does not exist.
- The authentication domain is not activated.
- The account is not activated.
- The account type is inconsistent.
- The access is limited.
¡ For RADIUS authentication, the authentication failure reason might be the device does not receive RADIUS replies or RADIUS authentication is rejected.
10. Identify whether the NCP negotiation succeeds.
Typically, NCP performs only address negotiation in PPPoE. Therefore, NCP negotiation failure means address negotiation failure. You can check the configuration according to the locally allocated address, RADIUS allocated address, and DHCP allocated address.
11. Identify whether accounting is normal.
If the user still cannot come online in this case, accounting might fail. The most common reason is that accounting fails to start. In this case, you must identify whether the device and AAA server can reach each other at Layer 3 and whether the AAA server’s accounting function is configured correctly.
12. If the issue persists, collect the following information and contact Technical Support:
¡ Results of each step.
¡ The configuration file, log messages, and alarm messages.
PPPoE agency user online failures and abnormal offline events
Symptom
A PPPoE agency user fails to come online or abnormally goes offline.
Common causes
The following are the common causes of this type of issue:
· The campus BRAS user corresponding to a PPPoE agency user fails to come online or abnormally goes offline.
· The PPPoE agency configuration is incorrect. For example:
¡ The interface connecting the campus BRAS to the service provider BRAS is not enabled with PPPoE agency. As a result, a PPPoE agency user fails to come online.
¡ The PPPoE agency group name configured for the PPPoE agency interface on the campus BRAS is different from the PPPoE agency group name deployed through COA messages by the campus AAA server. As a result, a PPPoE agency user fails to come online.
¡ The undo pppoe-agency forward command is executed in user group view of a campus BRAS user to delete the PPPoE agency forwarding policy. As a result, the corresponding PPPoE agency user goes offline.
¡ The COA messages are used on the campus AAA server to modify the user-group attribute of a campus BRAS user to a user group that does not support PPPoE agency, or the undo user-group command is executed in system view on the campus BRAS to delete the user group of a campus BRAS user. As a result, the corresponding PPPoE agency user goes offline.
· The link between the campus BRAS and the service provider BRAS fails. For example, the PPPoE agency interface is down.
· The campus AAA server forcibly logs out a PPPoE agency user.
· A PPPoE agency user is forcibly logged out by the service provider because the user traffic is exhausted or the user owes fees.
Troubleshooting flow
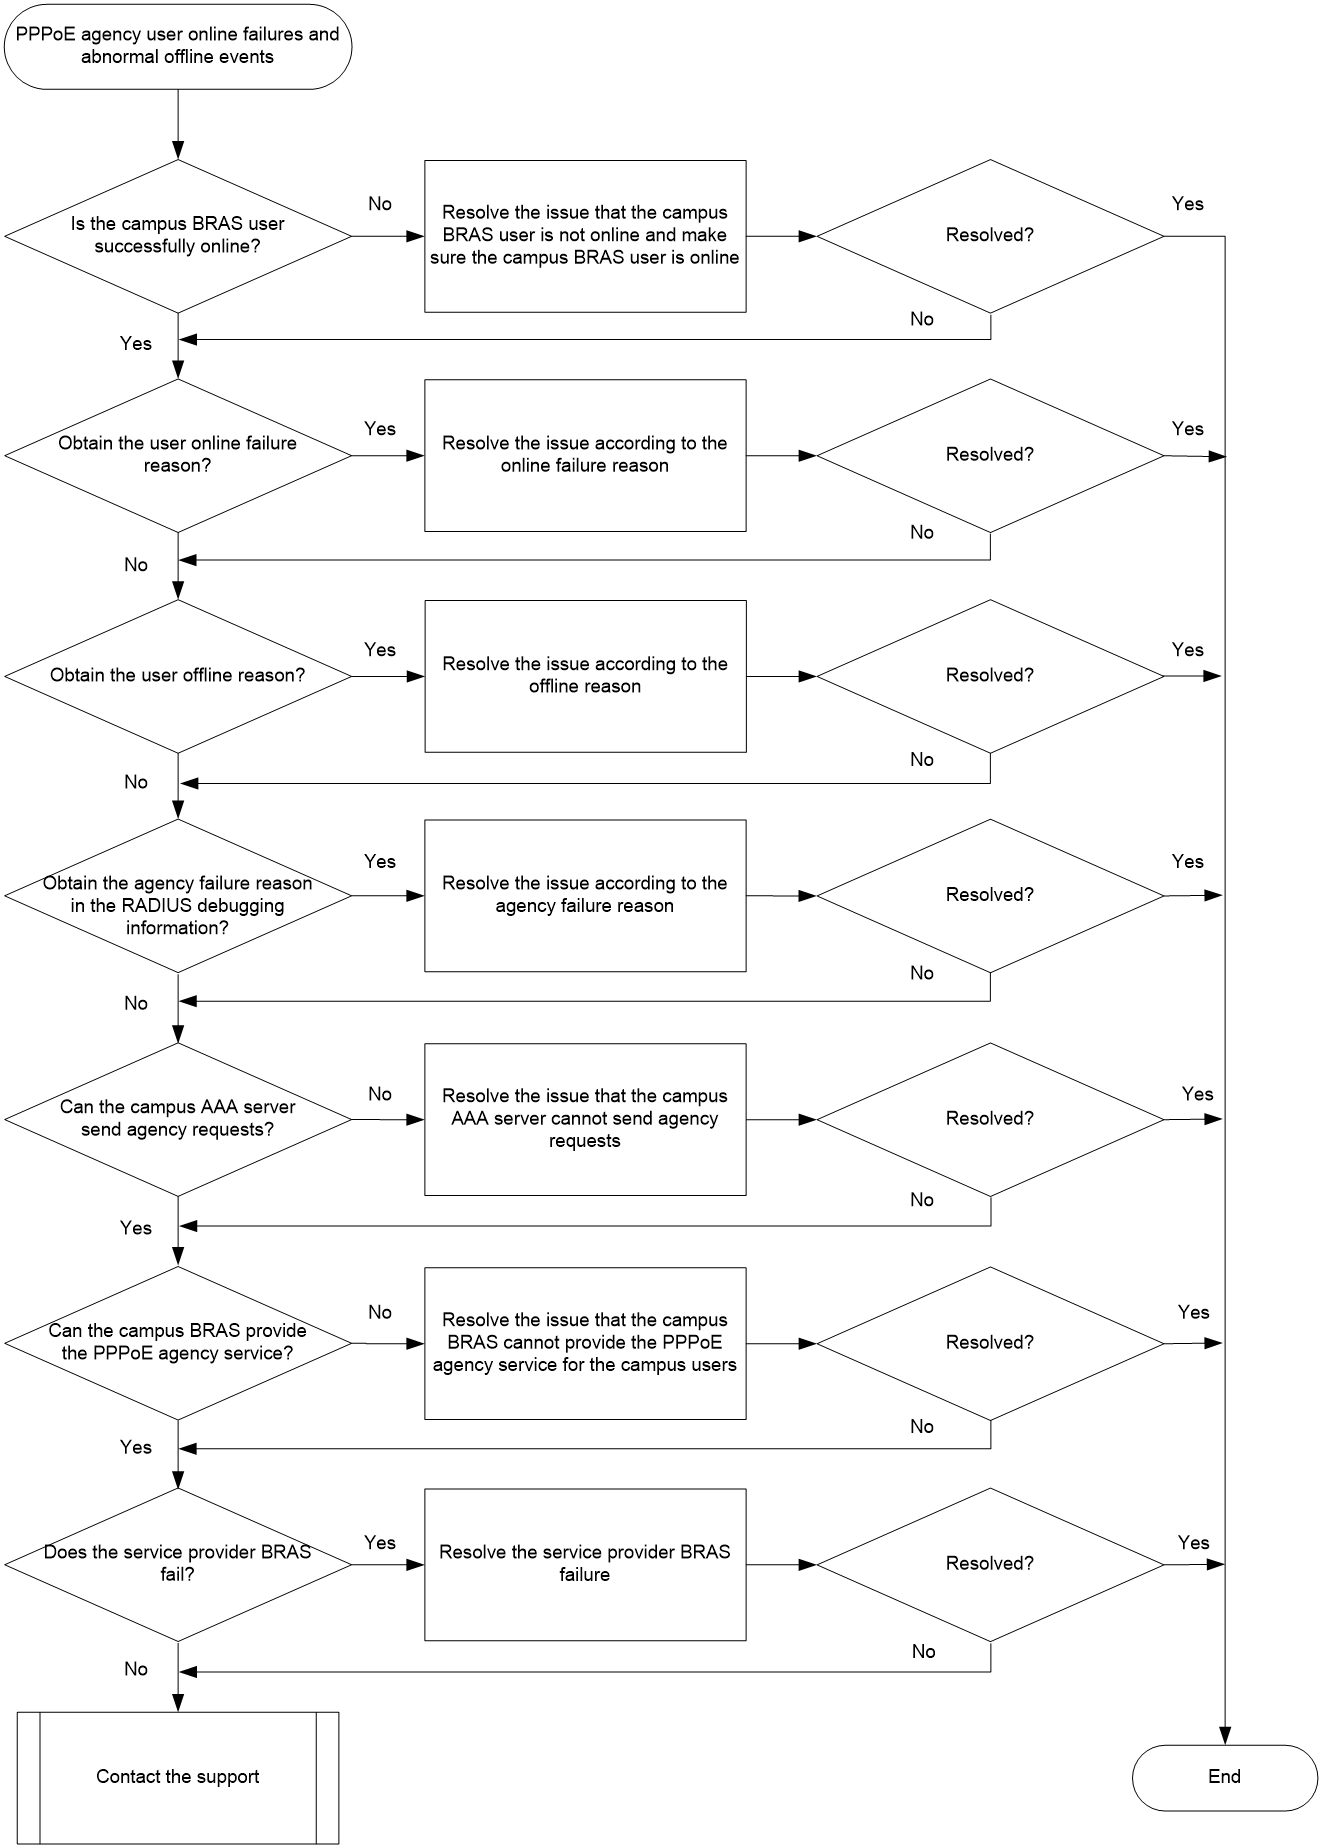
Figure 3 shows the troubleshooting flowchart.
Figure 3 Flowchart for troubleshooting PPPoE agency user online failures and abnormal offline events
Solution
1. Identify whether the campus BRAS user corresponding to a PPPoE agency user has come online successfully.
Execute the display access-user command in any view on the campus BRAS to identify whether the campus BRAS user corresponding to a PPPoE agency user has come online successfully.
¡ If the campus BRAS user fails to come online or abnormally goes offline after coming online, resolve the issue according to the access authentication method (IPoE or PPPoE) used by the campus BRAS user and the online failure and abnormal offline failure troubleshooting flow for the user type in “Troubleshooting user online failures and abnormal offline events.”
¡ If the campus BRAS user comes online normally, proceed with the next step.
2. View the PPPoE agency user online failure reasons.
Execute the display aaa online-fail-record command in any view on the campus BRAS to identify the PPPoE agency user online failure reasons.
<Sysname> display aaa online-fail-record username aaa
Username: aaa
Domain: test
MAC address: 0010-9400-0007
Access type: PPPoEA
Access interface: Ten-GigabitEthernet3/1/1
SVLAN/CVLAN: -/-
IP address: -
IPv6 address: -
Online request time: 2022/04/23 14:57:06
Online failure reason: Disabled PPPoE agency.
The Online failure reason field in the command output displays the user online failure reason. You can roughly locate the fault based on the failure reason. Search for the displayed reason in “Appendix A Reasons for user login failures and abnormal logouts” and troubleshoot according to the corresponding solution.
If you cannot see the failure records for some failure reasons, proceed with the next step.
3. View the PPPoE agency user offline reasons.
If you cannot obtain the online failure reasons for a user in the display aaa online-fail-record command output, the user might come online successfully and then go offline. In this case, use the display aaa offline-record command to display user offline records.
<Sysname> display aaa offline-record
Total count: 1
Username: jay
Domain: dm1
MAC address: -
Access type: Telnet
Access interface: GigabitEthernet1/0/1
SVLAN/CVLAN: -/-
IP address: 19.19.0.2
IPv6 address: -
Online request time: 2020-01-02 15:20:33
Offline time: 2020-2-28 15:20:56
Offline reason: User request
If a user first comes online successfully and then goes offline, the Offline reason field in the command output displays the offline reason. You can roughly locate the fault based on the failure reason, which provides guidance for later troubleshooting.
Search for the displayed reason in “Appendix A Reasons for user login failures and abnormal logouts” and troubleshoot according to the corresponding solution.
If you cannot use the display aaa offline-record command to obtain the user offline reasons, proceed with the next step.
4. Troubleshoot the issue based on the RADIUS debugging information.
If you cannot obtain the failure reasons in the preceding steps, execute the debugging radius all command in user view on the campus BRAS to enable debugging for RADIUS. Troubleshoot the issue according to the Reply-Message field in the debugging information.
The Reply-Message field displays the PPPoE agency failure reason. Search for the displayed reason in “Appendix A Reasons for user login failures and abnormal logouts” and troubleshoot according to the corresponding solution.
5. Identify whether the campus BRAS has received agency requests from the campus AAA server.
Execute the display radius statistics command in any view on the campus BRAS to view statistics of the PPPoE agency packets between the campus BRAS and campus AAA server.
¡ If the value for the COA requests field is 0 (or the value does not change when you view this field multiple times), the campus BRAS does not receive agency requests from the campus AAA server. In this case, verify that the PPPoE agency user settings on the campus AAA server are correct to resolve the issue that the campus AAA server does not send agency requests.
¡ If the value for the COA requests field is not 0 and changes when you view this field multiple times, proceed with the next step.
6. Identify whether the campus BRAS can provide the PPPoE agency service for campus users.
Execute the display pppoe-agency packet statistics command in any view on the campus BRAS to view the negotiation packet statistics for PPPoE agency.
¡ If the value for the SEND_PADI_PKT field is 0 (or the value does not change when you view this field multiple times), the campus BRAS user does not trigger the agency process after coming online. Perform the following checks according to the PPPoE configuration guide to resolve the issue that the agency process cannot be triggered.
- Make sure the interface connecting the campus BRAS to the service provider BRAS is enabled with PPPoE agency.
- Make sure the agency group name that the campus AAA server assigns to campus BRAS user through COA messages can find the corresponding agency interface on the BRAS and the agency interface is up.
- Make sure a correct PPPoE agency forwarding policy is configured in user group view for the campus BRAS user.
¡ The campus BRAS user triggers the PPPoE agency process after coming online, but the campus BRAS does not receive the PPPoE protocol packets replied by the service provider BRAS if the following conditions exist:
- The value for the SEND_PADI_PKT field is not 0 and the value changes when you view this field multiple times.
- The value for the RECV_PADO_PKT field is 0 (or the value does not change when you view this field multiple times),
Perform the following checks according to the PPPoE configuration guide to resolve the issue that the campus BRAS cannot receive replies from the service provider BRAS.
- Make sure the interface connecting the service provider BRAS to the campus BRAS is enabled with the PPPoE server feature.
- Make sure the interface connecting the service provider BRAS to the campus BRAS is up.
¡ If the campus BRAS can send and receive PPPoE negotiation packets for PPPoE agency normally, proceed with the next step.
7. Troubleshoot on the service provider BRAS.
For the service provider BRAS, a campus PPPoE agency user is a common PPPoE user. On the service provider BRAS, troubleshoot this issue.
If the issue persists after troubleshooting, proceed with the next step.
8. If the issue persists, collect the following information and contact Technical Support:
¡ Results of each step.
¡ The configuration file, log messages, and alarm messages.
Related alarm and log messages
Alarm messages
N/A
Log messages
N/A
Campus user failures to access the external network on a PPPoE agency network
Symptom
On a PPPoE agency network, after a campus user that has opened a service provider agency account comes online through IPoE or PPPoE, the user can access only the campus network but cannot access the external network.
Common causes
The following are the common causes of this type of issue:
· The PPPoE agency user corresponding to a campus BRAS user is not online.
· The PPPoE agency forwarding policy configuration is incorrect on the campus BRAS.
· The PPPoE agency forwarding policy configuration is correct on the campus BRAS, but the ACL in the policy fails to be applied.
· The service provider BRAS fails.
Troubleshooting flow
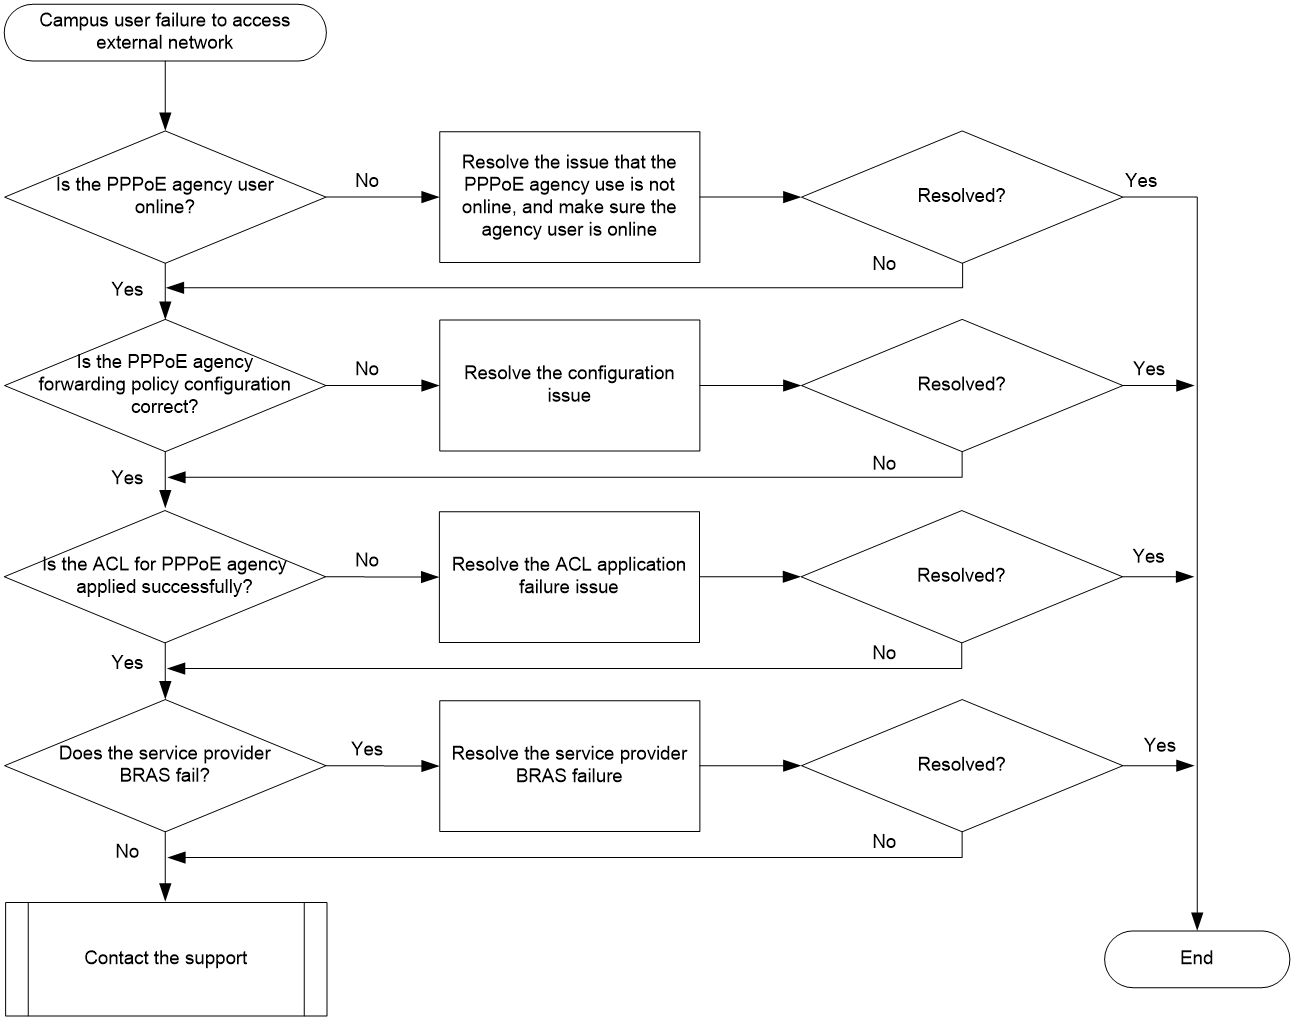
Figure 4 shows the troubleshooting flowchart.
Solution
1. Identify whether the PPPoE agency user corresponding to a campus BRAS user has come online successfully.
Execute the display access-user command in any view on the campus BRAS to identify whether the PPPoE agency user corresponding to the campus BRAS user has come online successfully.
¡ If the PPPoE agency user has not come online, troubleshoot this issue as described in “PPPoE user online failures and abnormal offline events.”
¡ If the PPPoE agency user comes online normally, proceed with the next step.
2. Identify whether the PPPoE agency forwarding policy configuration is correct.
Identify whether a correct ACL is specified in the pppoe-agency forward { ipv4 | ipv6 } acl { acl-number | name acl-name } command in the user group of the agency campus BRAS user on the campus BRAS.
¡ If the ACL is configured incorrectly (for example, the ACL specified in the PPPoE agency forwarding policy does not allow specifying the user-group parameter but the user-group parameter is specified in the ACL), correct the configuration.
¡ If the ACL configuration is correct, proceed with the next step.
3. Identify whether the ACL specified in the PPPoE agency forwarding policy is applied successfully.
Execute the display pppoe-agency { ipv4 | ipv6 } acl statistics command in any view on the campus BRAS to identify whether the ACL specified in the PPPoE agency forwarding policy is successfully applied.
¡ If the ACL fails to be applied, perform one of the following tasks according to the failure reason:
- If the failure reason is Hardware-count (Failed), contact Technical Support.
- If the failure reason is Hardware-count(Not enough resources to complete the operation.), execute the display qos-acl resource command in system view to collect the current ACL usage and contact Technical Support.
- If the failure reason is Hardware-count(The operation is not supported.), identify whether the software and hardware requirements of the device are met according to the product manuals. For example, identify whether the card hosting the access interface of the campus BRAS supports PPPoE agency.
¡ If the ACL is applied successfully, proceed with the next step.
4. Troubleshoot on the service provider BRAS
For the service provider BRAS, a campus PPPoE agency user is a common PPPoE user. On the service provider BRAS, troubleshoot this issue.
If the issue persists after troubleshooting, proceed with the next step.
5. If the issue persists, collect the following information and contact Technical Support:
¡ Results of each step.
¡ The configuration file, log messages, and alarm messages.
Related alarm and log messages
Alarm messages
N/A
Log messages
N/A
L2TP user online failures and abnormal offline events
Symptom
An L2TP user fails to come online or abnormally goes offline.
Common causes
The following the common causes of this type of issue:
· The LAC and the LNS cannot reach each other at Layer 3.
· The service modules that establish the L2TP tunnel between the LAC and the LNS do not support L2TP.
· The LAC or the LNS is not enabled with L2TP.
· The L2TP group settings on the LAC and the LNS do not match.
· The tunnel authentication methods or authentication passwords on the LAC and the LNS are inconsistent.
· PPPoE access fails on the LAC.
· The PPP authentication methods on the LAC and the LNS are inconsistent.
· An LNS is configured with an L2TP group in LAC mode and acts as a Layer 2 tunnel switch (LTS).
· The IP address pool is configured incorrectly, and the L2TP user is not assigned an IP address.
Troubleshooting flow
Figure 5 shows the troubleshooting flowchart.
Figure 5 Flowchart for troubleshooting L2TP user online failures and abnormal offline events
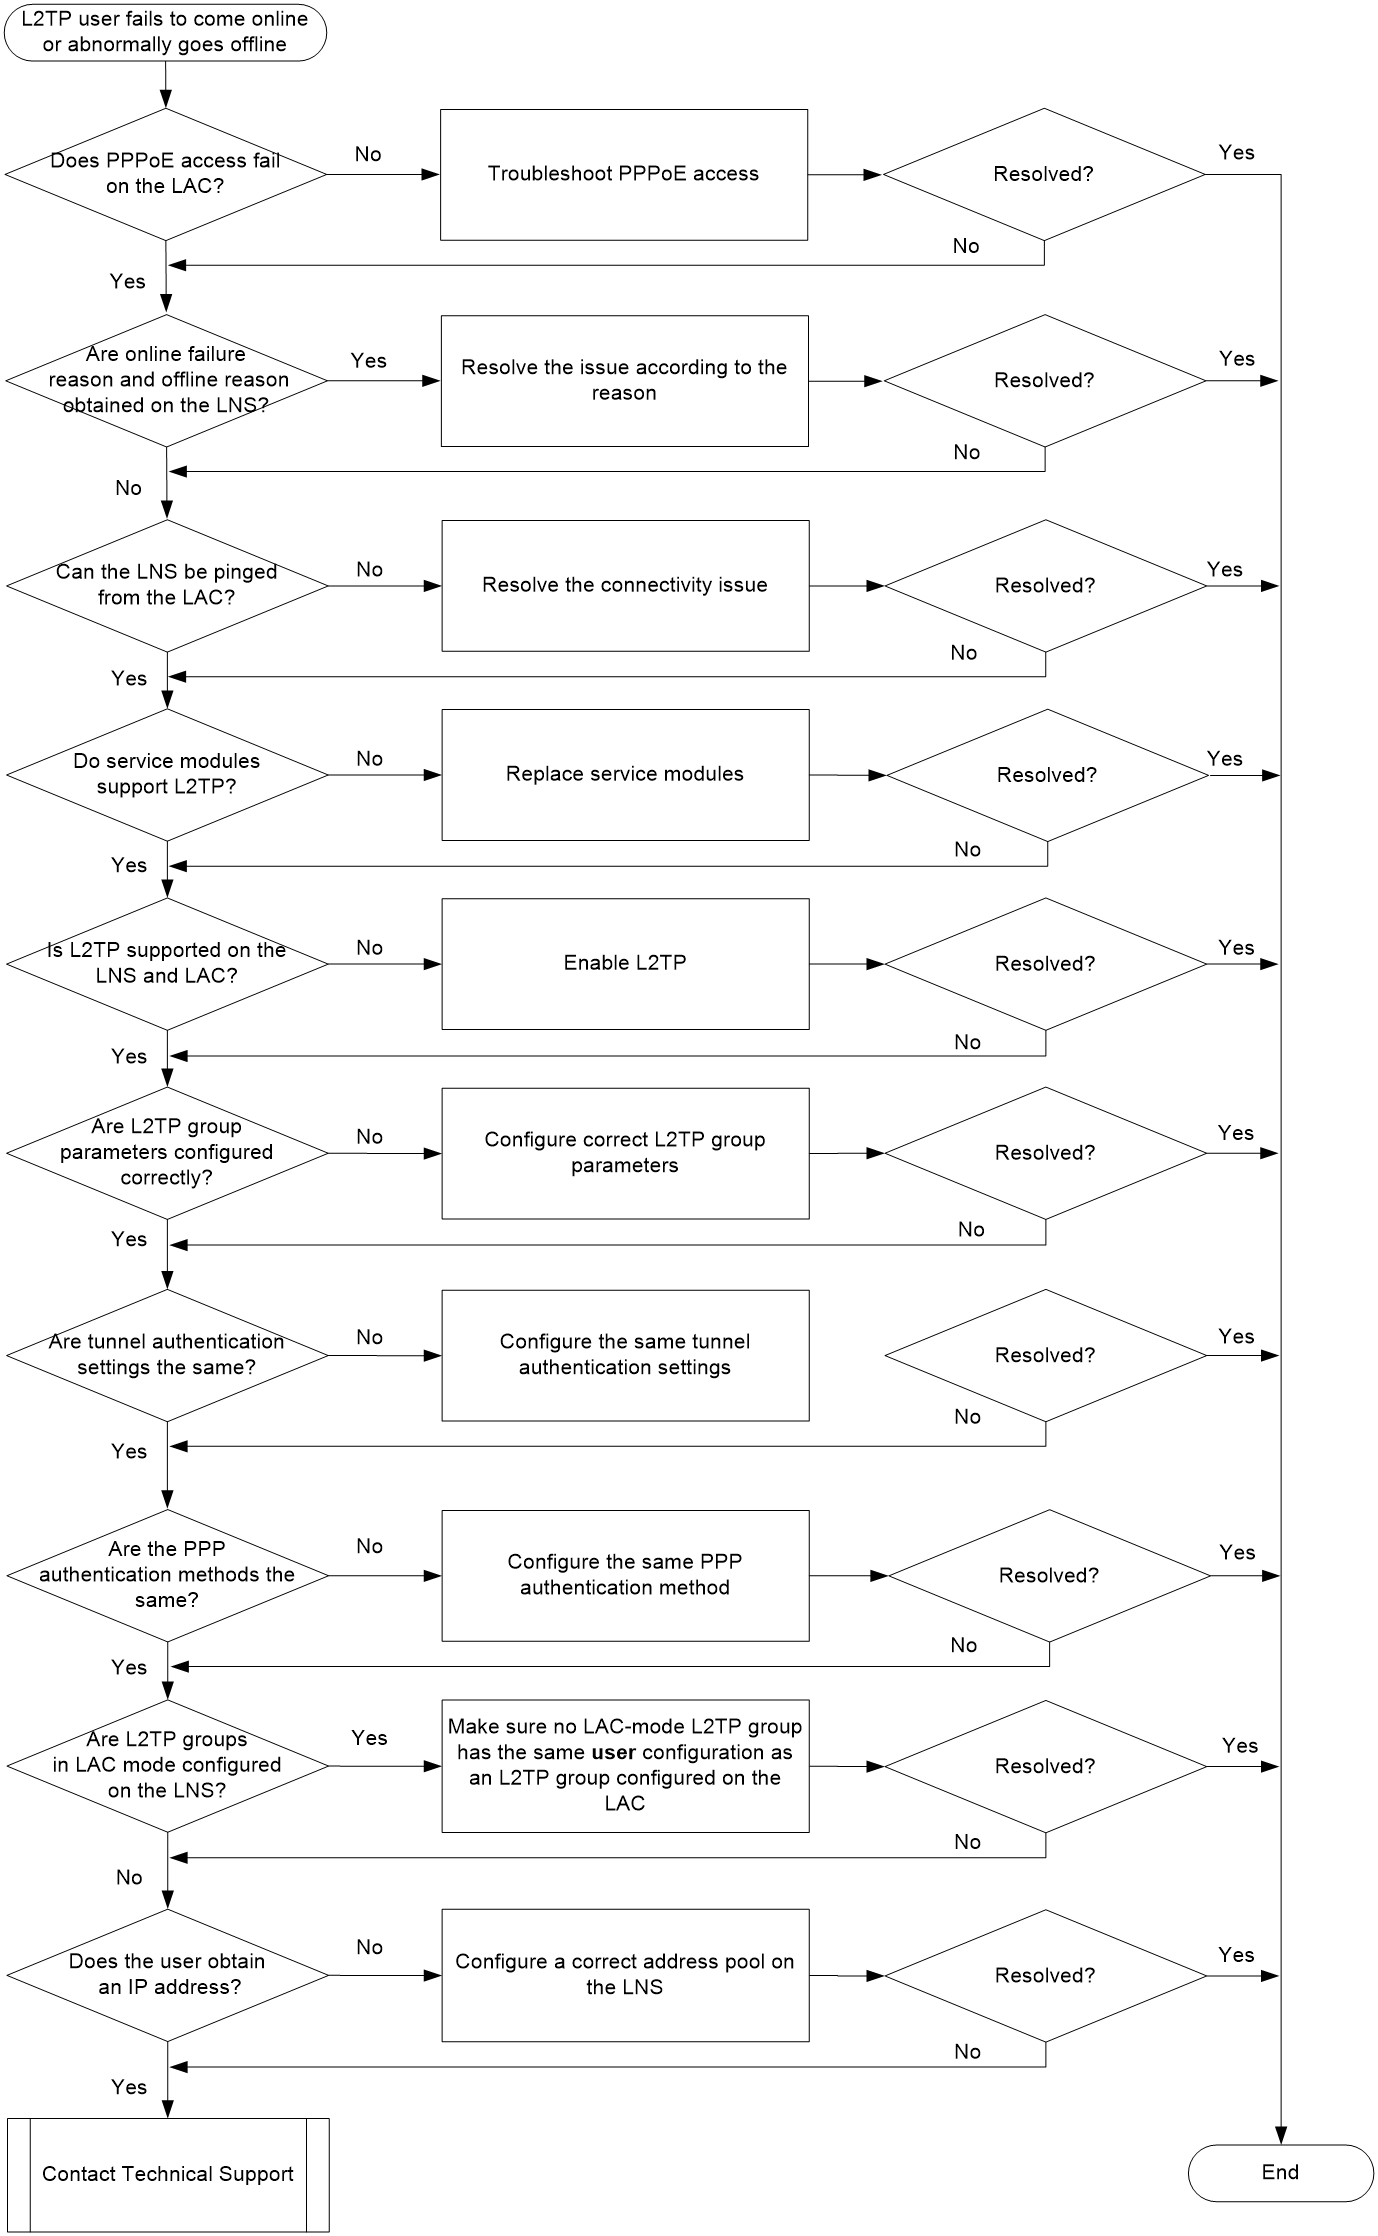
Solution
1. Check whether PPPoE access services are correct on the LAC.
For more information, see "PPPoE user online failures and abnormal offline events."
If PPPoE access services are correct, proceed to the next step.
2. Identify the online failure reason and offline reason on the LNS.
¡ Use the display aaa online-fail-record command to identify the online failure reason. The Online failure reason field in the command output displays the user online failure reason. You can roughly locate the fault based on the failure reason, which provides guidance for later troubleshooting.
¡ If you cannot obtain the online failure reasons for a user in step 1, the user might come online successfully and then go offline. In this case, use the display aaa offline-record command to display user offline records. If you cannot use the display aaa offline-record command to obtain the user offline reasons, proceed to the next step.
3. Check whether the LNS can be pinged from the LAC.
¡ If yes, proceed to the next step.
¡ If not, solve the connectivity issue.
4. Use the display device command on the LAC and the LNS to check whether the service modules used to establish the L2TP tunnel support L2TP.
¡ If yes, proceed to the next step.
¡ If not, evaluate whether the service modules can be replaced. If the issue persists after the service modules are replaced, proceed to the next step.
5. Use the display current-configuration command on the LAC and the LNS to check whether L2TP is enabled.
¡ If yes (the l2tp enable field is displayed), proceed to the next step.
¡ If not (the l2tp enable field is not displayed), use the l2tp enable command to enable L2TP. If the issue persists after L2TP is enabled, proceed to the next step.
6. Check whether the L2TP parameters in the L2TP group are configured correctly on the LAC and the LNS.
¡ On the LAC, use the display l2tp-group verbose command to check whether the LNS IP address (LNS IP field) is the same as the actual LNS IP address. If not, use the lns-ip command to change the LNS IP address.
¡ On the LNS, use the display l2tp-group verbose command to check the following items:
- Verify that the remote tunnel name is the same as the tunnel name configured on the LAC.
- Verify that the local tunnel IP address is the same as the IP address configured by the lns-ip command on the LAC.
If the issue persists after all L2TP parameters in the L2TP group are configured correctly, proceed to the next step.
7. Use the display l2tp-group verbose command on the LAC and the LNS to check whether the tunnel authentication settings are the same.
¡ Check whether the tunnel authentication states (Tunnel auth field) on the LAC and the LNS are the same. If not, use the tunnel authentication command to change the tunnel authentication status on the LAC or the LNS.
¡ If both the LAC and the LNS are enabled with tunnel authentication, verify that the tunnel authentication passwords configured on the LAC and the LNS are the same. To change the tunnel authentication password, use the tunnel password command.
¡ If the issue persists after the authentication settings are configured correctly, proceed to the next step.
8. Use the display current-configuration interface virtual-template command on the LAC and the LNS to check whether the PPP authentication methods (ppp authentication-mode field) are the same.
¡ If not, use the ppp authentication-mode command in VT interface view to configure the PPP authentication method.
¡ If yes, proceed to the next step.
9. Check whether an LAC-mode L2TP group has the same user configuration as an L2TP group configured on the LAC.
¡ If not, proceed to the next step.
¡ If yes, execute the undo user command to delete the configuration. If the issue persists after the configuration is deleted, proceed to the next step.
10. Check whether the user has been assigned an IP address.
¡ If not, configure a correct address pool on the LNS.
¡ If yes, proceed to the next step.
11. If the issue persists, collect the following information and contact Technical Support:
¡ Results of each step.
¡ The configuration file, log messages, and alarm messages.
IPoE user online failures and abnormal offline events
This section describes the common troubleshooting method for IPoE users. For the more specific troubleshooting methods for IPoE DHCP users, IPoE NDRS users, IPoE static users, and IPoE Web users, see their respective sections.
Symptom
An IPoE user fails to come online or abnormally goes offline.
Common causes
The following the common causes of this type of issue:
· The authentication domain is configured incorrectly, which leads to authentication failure.
· The IP address pool or DHCP server is configured incorrectly, which causes the user to fail to obtain an IP address.
Troubleshooting flow
Figure 6 shows the troubleshooting flowchart.
Figure 6 Flowchart for troubleshooting IPoE user online failures and abnormal offline events

Solution
1. Use the display aaa online-fail-record command to identify the online failure reason.
<Sysname> display aaa online-fail-record username aaa
Username: aaa
Domain: test
MAC address: 0010-9400-0007
Access type: IPoE
Access interface: Ten-GigabitEthernet3/1/1
SVLAN/CVLAN: -/-
IP address: -
IPv6 address: -
Online request time: 2019/09/23 14:57:06
Online failure reason: DHCP with server no response
The Online failure reason field in the command output displays the user online failure reason. You can roughly locate the fault based on the failure reason, which provides guidance for later troubleshooting. Search for the displayed reason in "Appendix A Reasons for user login failures and abnormal logouts" and troubleshoot according to the corresponding solution.
2. Use the display aaa offline-record command to identify the offline reason.
If you cannot obtain the online failure reasons for a user in step 1, the user might come online successfully and then go offline. In this case, use the display aaa offline-record command to display user offline records.
If a user first comes online successfully and then goes offline, the Offline reason field in the command output displays the offline reason. You can roughly locate the fault based on the failure reason, which provides guidance for later troubleshooting.
Search for the displayed reason in "Appendix A Reasons for user login failures and abnormal logouts" and troubleshoot according to the corresponding solution.
If you cannot use the display aaa offline-record command to obtain the user offline reasons, proceed with the next step.
3. Check whether the user has passed authentication.
¡ If not, examine the authentication domain configuration based on the IPoE authentication method.
¡ If yes, proceed to the next step.
4. Check whether the user has obtained an IP address.
¡ If not, examine the IP address pool or DHCP server configuration (for example, whether the DHCP service is enabled).
¡ If yes, proceed to the next step.
5. Enable service tracing to troubleshoot the issue.
6. If the issue persists, collect the following information and contact Technical Support:
¡ Results of each step.
¡ The configuration file, log messages, and alarm messages.
IPoE DHCP user online failures and abnormal offline events
Symptom
An IPoE DHCP user fails to come online or abnormally goes offline.
Common causes
The following the common causes of this type of issue:
· Configuration errors exist. For example, the managed address configuration flag (M) is set to 0 for DHCPv6 users on an interface.
· User authentication fails.
· The user is logged out after coming online due to reasons such as timeout.
· The user is blocked.
· No DHCP messages are received.
Troubleshooting flow
Figure 7 shows the troubleshooting flowchart.
Figure 7 Flowchart for troubleshooting IPoE DHCP user online failures and abnormal offline events
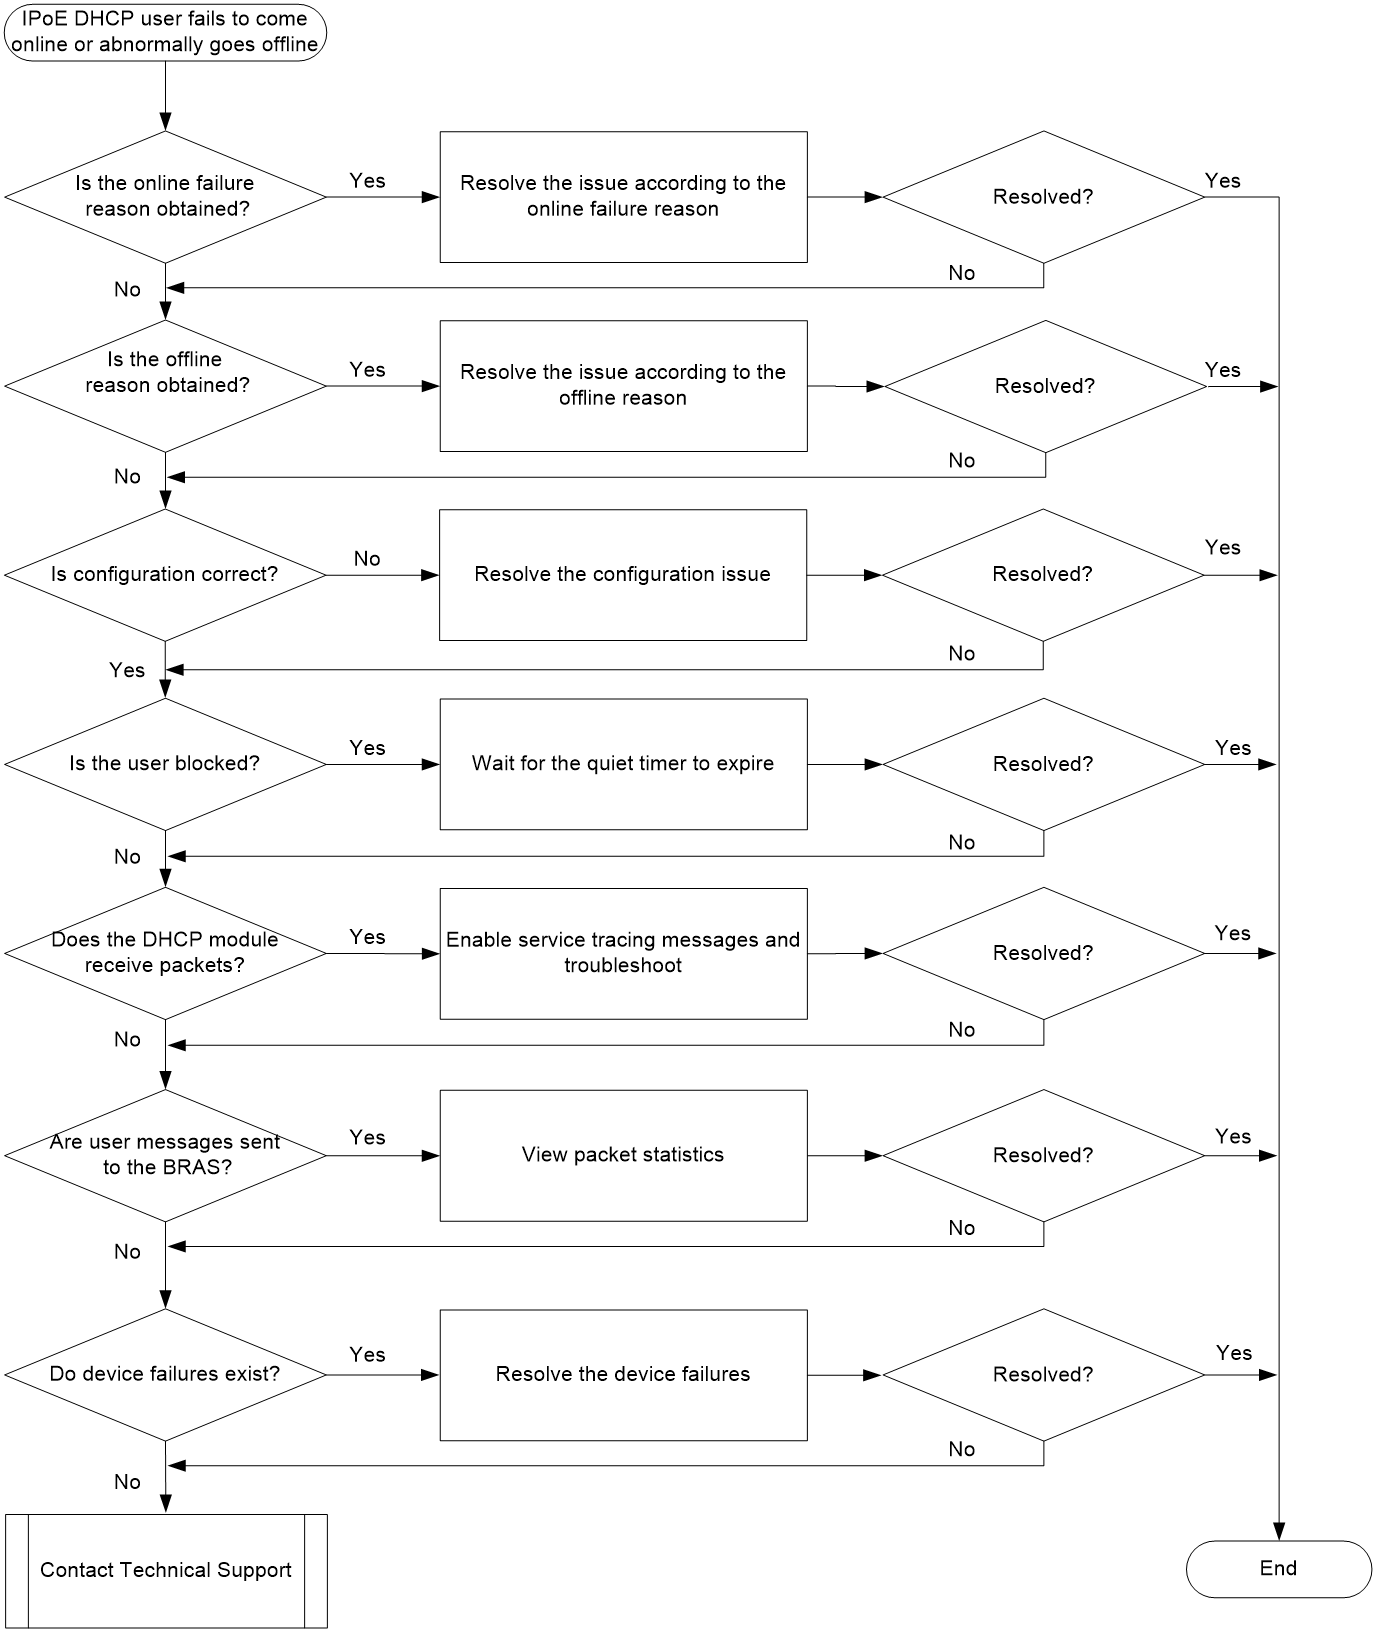
Solution
1. Use the display aaa online-fail-record command to identify the online failure reason.
<Sysname> display aaa online-fail-record
Total count: 108
Username: 001094500021
Domain: dm1
MAC address: 0010-9450-0021
Access type: IPoE
Access UP ID: 1354
Access interface: XGE3/1/1
SVLAN/CVLAN: -/-
IP address: -
IPv6 address: -
Online request time: 2021/08/15 07:38:15
Online failure reason: DHCP with server no response
The Online failure reason field in the command output displays the user online failure reason. You can roughly locate the fault based on the failure reason, which provides guidance for later troubleshooting. Search for the displayed reason in "Appendix A Reasons for user login failures and abnormal logouts" and troubleshoot according to the corresponding solution.
2. Use the display aaa offline-record command to identify the offline reason.
If you cannot obtain the online failure reasons for a user in step 1, the user might come online successfully and then go offline. In this case, use the display aaa offline-record command to display user offline records.
<Sysname> display aaa offline-record
Total count: 4
Username: 001094500021
Domain: dm1
MAC address: 0010-9450-0021
Access type: IPoE
Access UP ID: 1354
Access interface: XGE3/1/1
SVLAN/CVLAN: -/-
IP address: 9.0.3.1
IPv6 address: -
Online request time: 2021/08/15 08:05:17
Offline time: 2021/08/15 08:09:08
Offline reason: DHCP release
If a user first comes online successfully and then goes offline, the Offline reason field in the command output displays the offline reason. You can roughly locate the fault based on the failure reason, which provides guidance for later troubleshooting.
Search for the displayed reason in "Appendix A Reasons for user login failures and abnormal logouts" and troubleshoot according to the corresponding solution.
If you cannot use the display aaa offline-record command to obtain the user offline reasons, proceed with the next step.
If the offline reason cannot be identified, proceed to the next step.
3. Check whether the IPoE DHCP settings are correct.
Troubleshoot the settings according to the manuals for BRASs. For example, see tasks at a glance or configuration examples in the corresponding manuals.
¡ If configuration errors exist, correct the configuration and then try to come online again.
¡ If the configuration is correct but the issue persists, proceed to the next step.
4. Check whether the user has been blocked.
¡ Use the display ip subscriber chasten user quiet command to check whether the user has been blocked by the quiet timer. If yes, wait for the quiet timer to expire.
¡ Use the display dhcp interface-rate-suppression command to check whether the user has been suppressed by interface-based DHCP attack suppression. If the State field is Restrain, the user is suppressed. In this case, use the interface-rate-suppression threshold command to modify the DHCP packet rate threshold.
If the user is not blocked, proceed to the next step.
5. Use the display dhcp-access packet statistics command to check whether the DHCP module receives packets.
<Sysname> display dhcp-access packet statistics
Received packets
Received from clients : 32
DHCPDISCOVER : 24
DHCPREQUEST : 4
DHCPDECLINE : 0
DHCPRELEASE : 4
DHCPINFORM : 0
Received from servers : 8
DHCPOFFER : 4
DHCPACK : 4
DHCPNAK : 0
Sent packets
Send to clients : 8
DHCPOFFER : 4
DHCPACK : 4
DHCPNAK : 0
Send to servers : 148135
DHCPDISCOVER : 148127
DHCPREQUEST : 4
DHCPDECLINE : 0
DHCPRELEASE : 4
In the sample output, the count of the DHCPDISCOVER field increases, which indicates that the device receives DHCP-DISCOVER messages. In this case, execute the following commands and collect service tracing messages.
¡ Execute the trace access-user command to create a service tracing object.
¡ Execute the debugging dhcp server packet command to enable DHCP protocol message debugging.
¡ Execute the terminal debugging and terminal monitor commands to enable output of debugging messages to the current terminal and enable log output to the current terminal.
If the count of the DHCPDISCOVER field does not increase, execute the debugging ip subscriber all command to enable IPoE debugging. If the IPoE module receives DHCP-DISCOVER messages but drops them, analyze the reason according to the debug information. If the IPoE module does not receive DHCP-DISCOVER messages, proceed to the next step.
6. Check whether the device receives user messages.
In probe view, execute the display hardware internal rxtx packet statistic command to view statistics of packets received/sent by the device driver. Identify whether the user packets are sent to the BRAS. (non-vBRAS-CPs.)
On a CUPS network, for information about how to identify whether the user packets are sent to the BRAS, see "Troubleshooting issues specific to a CUPS network."
<Sysname> system-view
[Sysname-probe] probe
[Sysname-probe] display hardware internal rxtx packet statistic slot 3 cpu 0
Net port packet loss count:
code counter
Rx packets statistic:
counter success rate
NET ->RXTX : 3177780 3177780 9 pps
Cpu code input list:(Mgment to L1 queue)
code counter success(whitelist/normal)
5 2057 2057(0/2057)
6 2077 2077(0/2077)
17 98 98(0/98)
18 48 48(0/48)
30 2091197 2091197(0/2091197)
35 573 573(0/573)
43 565 565(0/565)
45 4327 4327(0/4327)
49 79488 79488(0/79488)
50 85 85(0/85)
53 69830 69830(69823/7)
54 46567 46567(46566/1)
57 161707 161707(0/161707)
59 13052 13052(13044/8)
60 26280 26280(13953/12327)
61 30 30(0/30)
153 593518 593518(593513/5)
185 4354 4354(0/4354)
194 81927 81927(0/81927)
Callback function packets statistic:
total(r) success(r) total(c) success(c)
MACL: 0 0 0 0
NATL: 0 0 0 0
BFD: 0 0 0 0
(null): 0 0 0 0
Task input pkt statistics:
Task name total success
Main Task : 1086583 1086583
Icmp Task : 0 0
Cpu code input list:(L2 queue to platform)
code counter success drop rate
5 2057 2057 0 0
6 2077 2077 0 0
17 98 98 0 0
18 48 48 0 0
35 573 573 0 0
43 565 565 0 0
45 4327 4327 0 0
49 79488 79488 0 0
50 85 85 0 0
53 69830 69830 0 0
54 46567 46567 0 0
57 161707 161707 0 0
59 13052 13052 0 0
60 26280 26280 0 0
61 30 30 0 0
153 593518 593518 0 1
185 4354 4354 0 0
194 81927 81927 0 0
Cpu code to protocol:
5 ARP_REQ_LOCAL
6 ARP_REL
17 ARP_REQ
18 ARP_REQ_PROXY
30 DIAG
35 ND_NA
43 ND_NS
45 ND_RA
49 OSPF_HELLO,OSPF_LSU,OSPF_LSACK
50 OSPF_DD,OSPF_LSR
53 LDP_HELLO
54 LDP_NOTIF,LDP_INIT,LDP_KPALV,LDP_ADDR,LDP_LABEL
57 ISIS
59 BGP
60 BGP4P_IPV6
61 DHCP_IPOE,DHCP_SNOOPING,DHCP,DHCPv6_RELAY,DHCPv6_RELS,DHCPv6_SERV
153 IP_VSRP
185 VXLAN_GPE
194 CUSP
Debug packets statistic:
counter counter rate
NET->RXTX->SERVICE: 0 0 0 pps
SERVICE->RXTX->NET: 0 0 0 pps
failed
MbufTrSend: 0
FoundIfindex: 0
SaveCoreSta: 0
MainCoreSta: 0
TxFailedSta: 0
The 61 field represents DHCP_IPOE, DHCP_SNOOPING, and DHCP. If the received packet count for 61 increases, it means that the device has received DHCP messages and sent them to the platform. You can use debugging for the forwarding function to identify the layer on which packets are dropped step by step. If the count does not increase, execute the display hardware internal np pktcnt drop command to identify whether the driver has packet drop count.
<Sysname> system-view
[Sysname-probe] probe
[Sysname-probe] display hardware internal np pktcnt drop slot 3 (the command for viewing the packet count varies by device model)
Current Mcode Type: SIRIUS_RELEASE
The NP 0 is Both NP
Drop packet statistics
32B7 116497 TOPparse total discarded pkts
350F 916677 TOPresolve total discarded pkts
51A 66 PRS Ingress route interface deny L2 forward
56B 384 PRS Ingress Route interface deny L2 forward
63C 403633 RSV Ingress ARP packet FTN or BROADCAST table no ma
tch
63E 372789 RSV Ingress PROTOCOL_MAC and BROADCAST table no mat
ch
641 161878 RSV Ingress PROTOCOL_MAC.THB is set, but BROADCAST
table no match
645 149489 RSV Ingress multicast, MULTICAST.DROP is set
646 144150 RSV Ingress multicast, match MULTICAST default entr
y, but BROADCAST table no match
663 4 RSV Ingress broadcast packets from route port, PROT
OCOL_PORT table no match
If the packet drop count keeps increasing, analyze the possible issues according to the packet drop reasons.
If the packet drop count does not increase and the number of packets sent to the CPU also does not increase, it means that packets are not successfully sent to the BRAS. In this case, proceed to the next step.
7. Check the device failures.
¡ Make sure the physical connections of the device are correct.
¡ Make sure the network configuration is correct.
8. If the issue persists, collect the following information and contact Technical Support:
¡ Results of each step.
¡ The configuration file, log messages, and alarm messages.
IPoE NDRS user online failures and abnormal offline events
Symptom
An IPoE NDRS user fails to come online or abnormally goes offline.
Common causes
The following the common causes of this type of issue:
· Configuration errors exist. For example:
¡ The access interface is not enabled with IPv6.
¡ The IPoE access mode is incorrect.
¡ No IPv6 prefix is authorized.
¡ The ND prefix pool is incorrect.
· User authentication fails.
· The user is blocked.
· No user packets are received.
Troubleshooting flow
Figure 8 shows the troubleshooting flowchart
Figure 8 Flowchart for troubleshooting IPoE NDRS user online failures and abnormal offline events
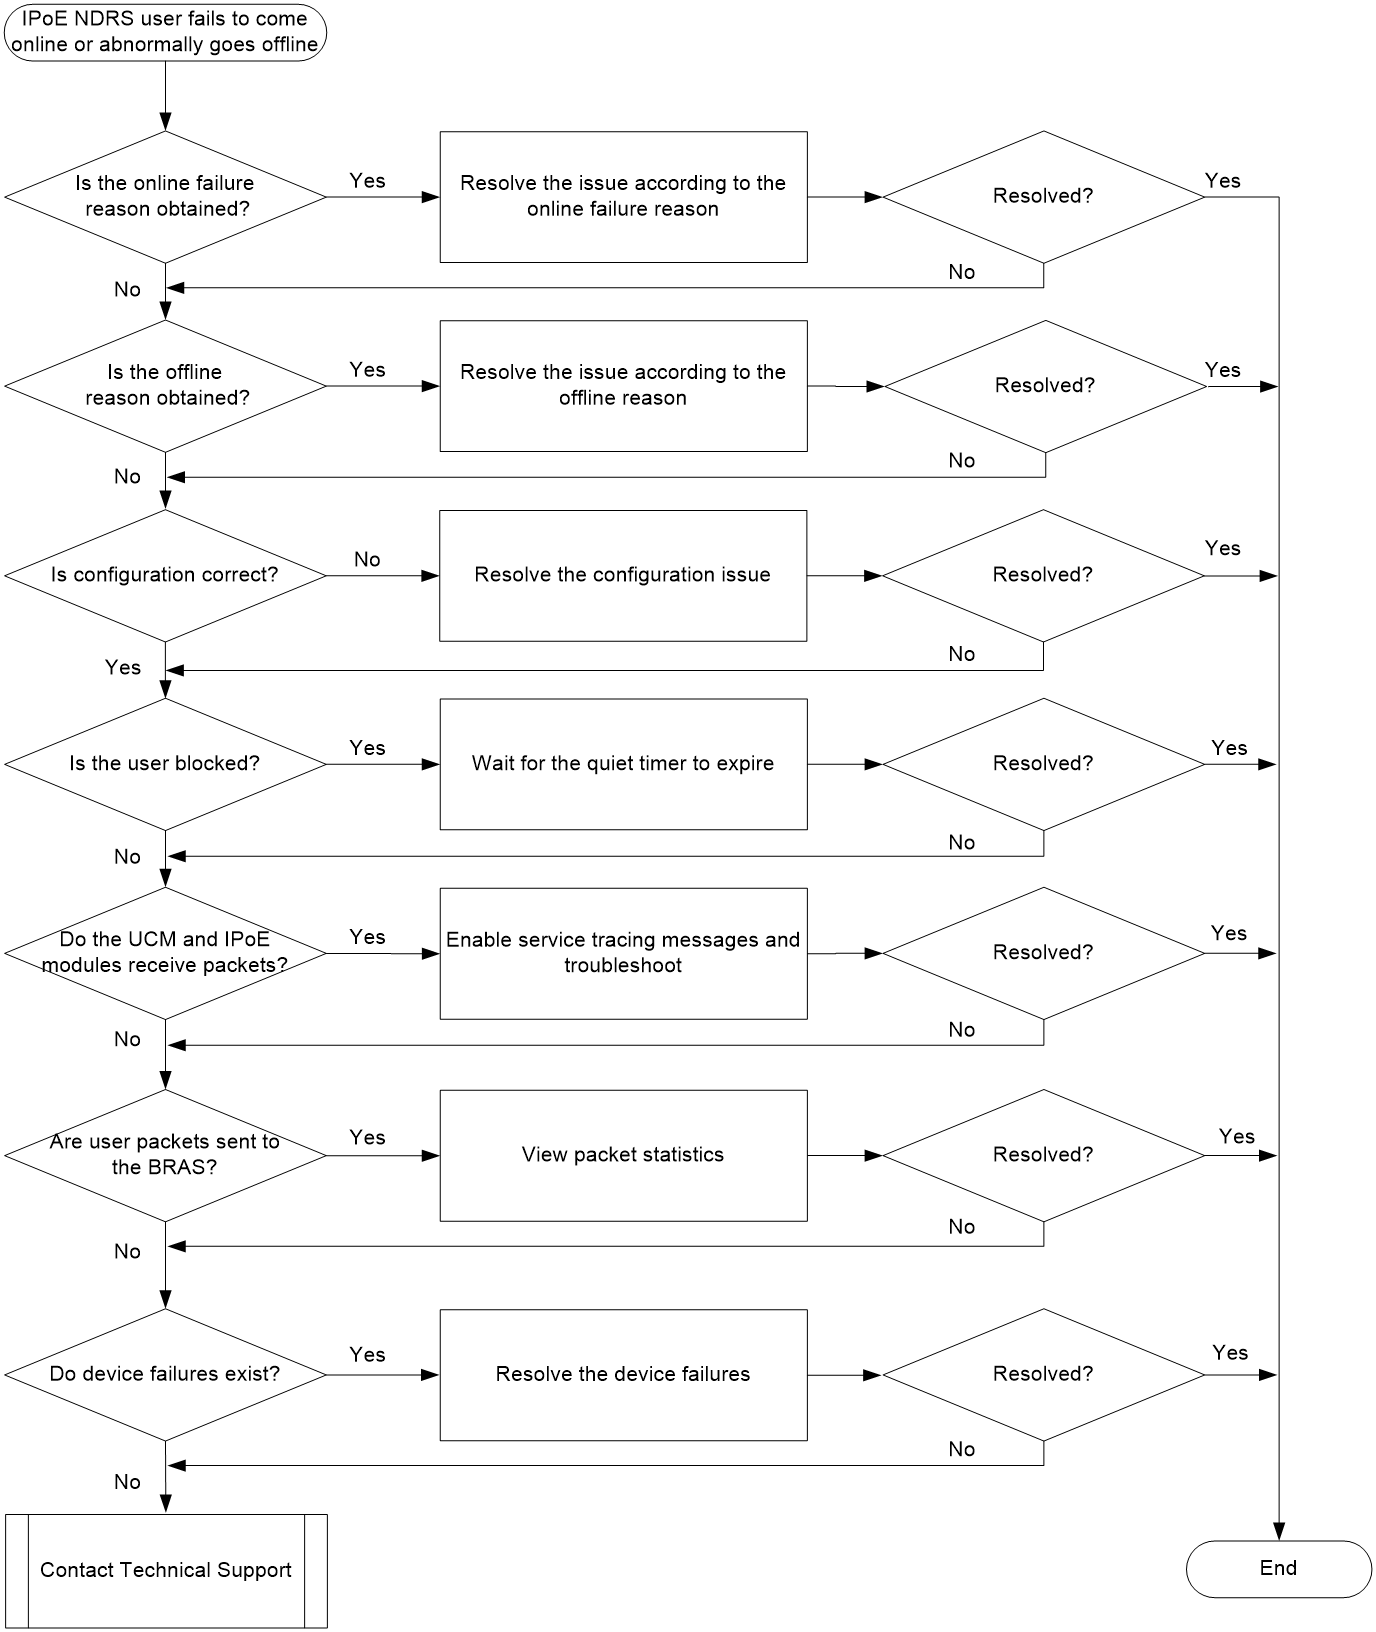
Solution
1. Use the display aaa online-fail-record command to identify the online failure reason.
<Sysname> display aaa online-fail-record
Username: user1
Domain: dm1
MAC address: 0000-5e00-01cc
Access type: IPoE
Access UP ID: 1353
Access interface: XGE3/1/1
SVLAN/CVLAN: -/-
IP address: -
IPv6 address: -
Online request time: 2021/08/15 06:09:54
Online failure reason: No prefix available
The Online failure reason field in the command output displays the user online failure reason. You can roughly locate the fault based on the failure reason, which provides guidance for later troubleshooting. Search for the displayed reason in "Appendix A Reasons for user login failures and abnormal logouts" and troubleshoot according to the corresponding solution.
You can resolve the issues caused by some failure reasons (for example, Authentication method error, Local authentication request was rejected, or No prefix available) by checking the configuration. If you cannot see the failure records for some failure reasons, proceed to the next step.
2. Use the display aaa offline-record command to identify the offline reason.
If you cannot obtain the online failure reasons for a user in step 1, the user might come online successfully and then go offline. In this case, use the display aaa offline-record command to display user offline records.
If a user first comes online successfully and then goes offline, the Offline reason field in the command output displays the offline reason. You can roughly locate the fault based on the failure reason, which provides guidance for later troubleshooting.
Search for the displayed reason in "Appendix A Reasons for user login failures and abnormal logouts" and troubleshoot according to the corresponding solution.
If you cannot use the display aaa offline-record command to obtain the user offline reasons, proceed with the next step.
3. Check whether the IPoE NDRS user settings are correct.
Troubleshoot the settings according to the manuals for BRASs. For example, see tasks at a glance or configuration examples in the corresponding manuals.
¡ If configuration errors exist, correct the configuration and then try to come online again.
¡ If the configuration is correct but the issue persists, proceed to the next step.
4. Execute the display ppp chasten user command to identify whether the user is blocked by IPoE.
If the user is blocked, redial after the remaining blocking time expires according to the command output. If the user is not blocked, proceed to the next step.
5. Check whether the UCM and IPoE modules receive packets.
Execute the following commands for troubleshooting and collect service trace messages:
¡ Execute the trace access-user command to create a service tracing object.
¡ Execute the debugging ip subscriber all command to enable IPoE debugging.
¡ Execute the terminal debugging and terminal monitor commands to enable output of debugging messages to the current terminal and enable log output to the current terminal.
If no packets are received, proceed to the next step.
6. Check whether the BRAS receives user packets.
In probe view, execute the display hardware internal rxtx packet statistic command to view statistics of packets received/sent by the device driver. Identify whether the user packets are sent to the BRAS. (non-vBRAS-CPs.)
On a CUPS network, for information about how to identify whether the user packets are sent to the BRAS, see "Troubleshooting issues specific to a CUPS network."
<Sysname> system-view
[Sysname-probe] probe
[Sysname-probe] display hardware internal rxtx packet statistic slot 3 cpu 0
Net port packet loss count:
code counter
Rx packets statistic:
counter success rate
NET ->RXTX : 3177780 3177780 9 pps
Cpu code input list:(Mgment to L1 queue)
code counter success(whitelist/normal)
5 2057 2057(0/2057)
6 2077 2077(0/2077)
17 98 98(0/98)
18 48 48(0/48)
30 2091197 2091197(0/2091197)
35 573 573(0/573)
43 565 565(0/565)
45 4327 4327(0/4327)
49 79488 79488(0/79488)
50 85 85(0/85)
53 69830 69830(69823/7)
54 46567 46567(46566/1)
57 161707 161707(0/161707)
59 13052 13052(13044/8)
60 26280 26280(13953/12327)
61 30 30(0/30)
153 593518 593518(593513/5)
185 4354 4354(0/4354)
194 81927 81927(0/81927)
Callback function packets statistic:
total(r) success(r) total(c) success(c)
MACL: 0 0 0 0
NATL: 0 0 0 0
BFD: 0 0 0 0
(null): 0 0 0 0
Task input pkt statistics:
Task name total success
Main Task : 1086583 1086583
Icmp Task : 0 0
Cpu code input list:(L2 queue to platform)
code counter success drop rate
5 2057 2057 0 0
6 2077 2077 0 0
17 98 98 0 0
18 48 48 0 0
35 573 573 0 0
43 565 565 0 0
45 4327 4327 0 0
49 79488 79488 0 0
50 85 85 0 0
53 69830 69830 0 0
54 46567 46567 0 0
57 161707 161707 0 0
59 13052 13052 0 0
60 26280 26280 0 0
61 30 30 0 0
153 593518 593518 0 1
185 4354 4354 0 0
194 81927 81927 0 0
Cpu code to protocol:
5 ARP_REQ_LOCAL
6 ARP_REL
17 ARP_REQ
18 ARP_REQ_PROXY
30 DIAG
35 ND_NA
43 ND_NS
45 ND_RA
49 OSPF_HELLO,OSPF_LSU,OSPF_LSACK
50 OSPF_DD,OSPF_LSR
53 LDP_HELLO
54 LDP_NOTIF,LDP_INIT,LDP_KPALV,LDP_ADDR,LDP_LABEL
57 ISIS
59 BGP
60 BGP4P_IPV6
61 DHCP_IPOE,DHCP_SNOOPING,DHCP,DHCPv6_RELAY,DHCPv6_RELS,DHCPv6_SERV
153 IP_VSRP
185 VXLAN_GPE
194 CUSP
Debug packets statistic:
counter counter rate
NET->RXTX->SERVICE: 0 0 0 pps
SERVICE->RXTX->NET: 0 0 0 pps
failed
MbufTrSend: 0
FoundIfindex: 0
SaveCoreSta: 0
MainCoreSta: 0
TxFailedSta: 0
If the received packet counts increase, it means that the device has received ARP, ND, or unknown IP packets and sent them to the platform. You can use debugging for the forwarding function to identify the layer on which packets are dropped step by step. If the counts do not increase, execute the display hardware internal np pktcnt drop command to identify whether the driver has packet drop count.
<Sysname> system-view
[Sysname-probe] probe
[Sysname-probe] display hardware internal np pktcnt drop slot 3 (the command for viewing the packet count varies by device model)
Current Mcode Type: SIRIUS_RELEASE
The NP 0 is Both NP
Drop packet statistics
32B7 116497 TOPparse total discarded pkts
350F 916677 TOPresolve total discarded pkts
51A 66 PRS Ingress route interface deny L2 forward
56B 384 PRS Ingress Route interface deny L2 forward
63C 403633 RSV Ingress ARP packet FTN or BROADCAST table no ma
tch
63E 372789 RSV Ingress PROTOCOL_MAC and BROADCAST table no mat
ch
641 161878 RSV Ingress PROTOCOL_MAC.THB is set, but BROADCAST
table no match
645 149489 RSV Ingress multicast, MULTICAST.DROP is set
646 144150 RSV Ingress multicast, match MULTICAST default entr
y, but BROADCAST table no match
663 4 RSV Ingress broadcast packets from route port, PROT
OCOL_PORT table no match
If the dropped packet count keeps increasing, analyze the possible issues according to the packet drop reasons.
If the dropped packet count does not increase and the number of packets sent to the CPU also does not increase, it means that packets are not successfully sent to the BRAS. In this case, proceed to the next step.
7. Check the device failures.
¡ Make sure the physical connections of the device are correct.
¡ Make sure the network configuration is correct.
8. If the issue persists, collect the following information and contact Technical Support:
¡ Results of each step.
¡ The configuration file, log messages, and alarm messages.
IPoE static user online failure or abnormal offline event
Symptom
An IPoE static user fails to come online or abnormally goes offline.
Common causes
The following are the common causes of this type of issue:
· Incorrect user settings.
· The IP address of the user is assigned dynamically to another user.
· Authentication failure.
· The user is blocked.
· The user packets fail to be sent to the BRAS device.
Troubleshooting flow
Figure 9 shows the troubleshooting flowchart.
Figure 9 Flowchart for troubleshooting IPoE static user online failure or abnormal offline event
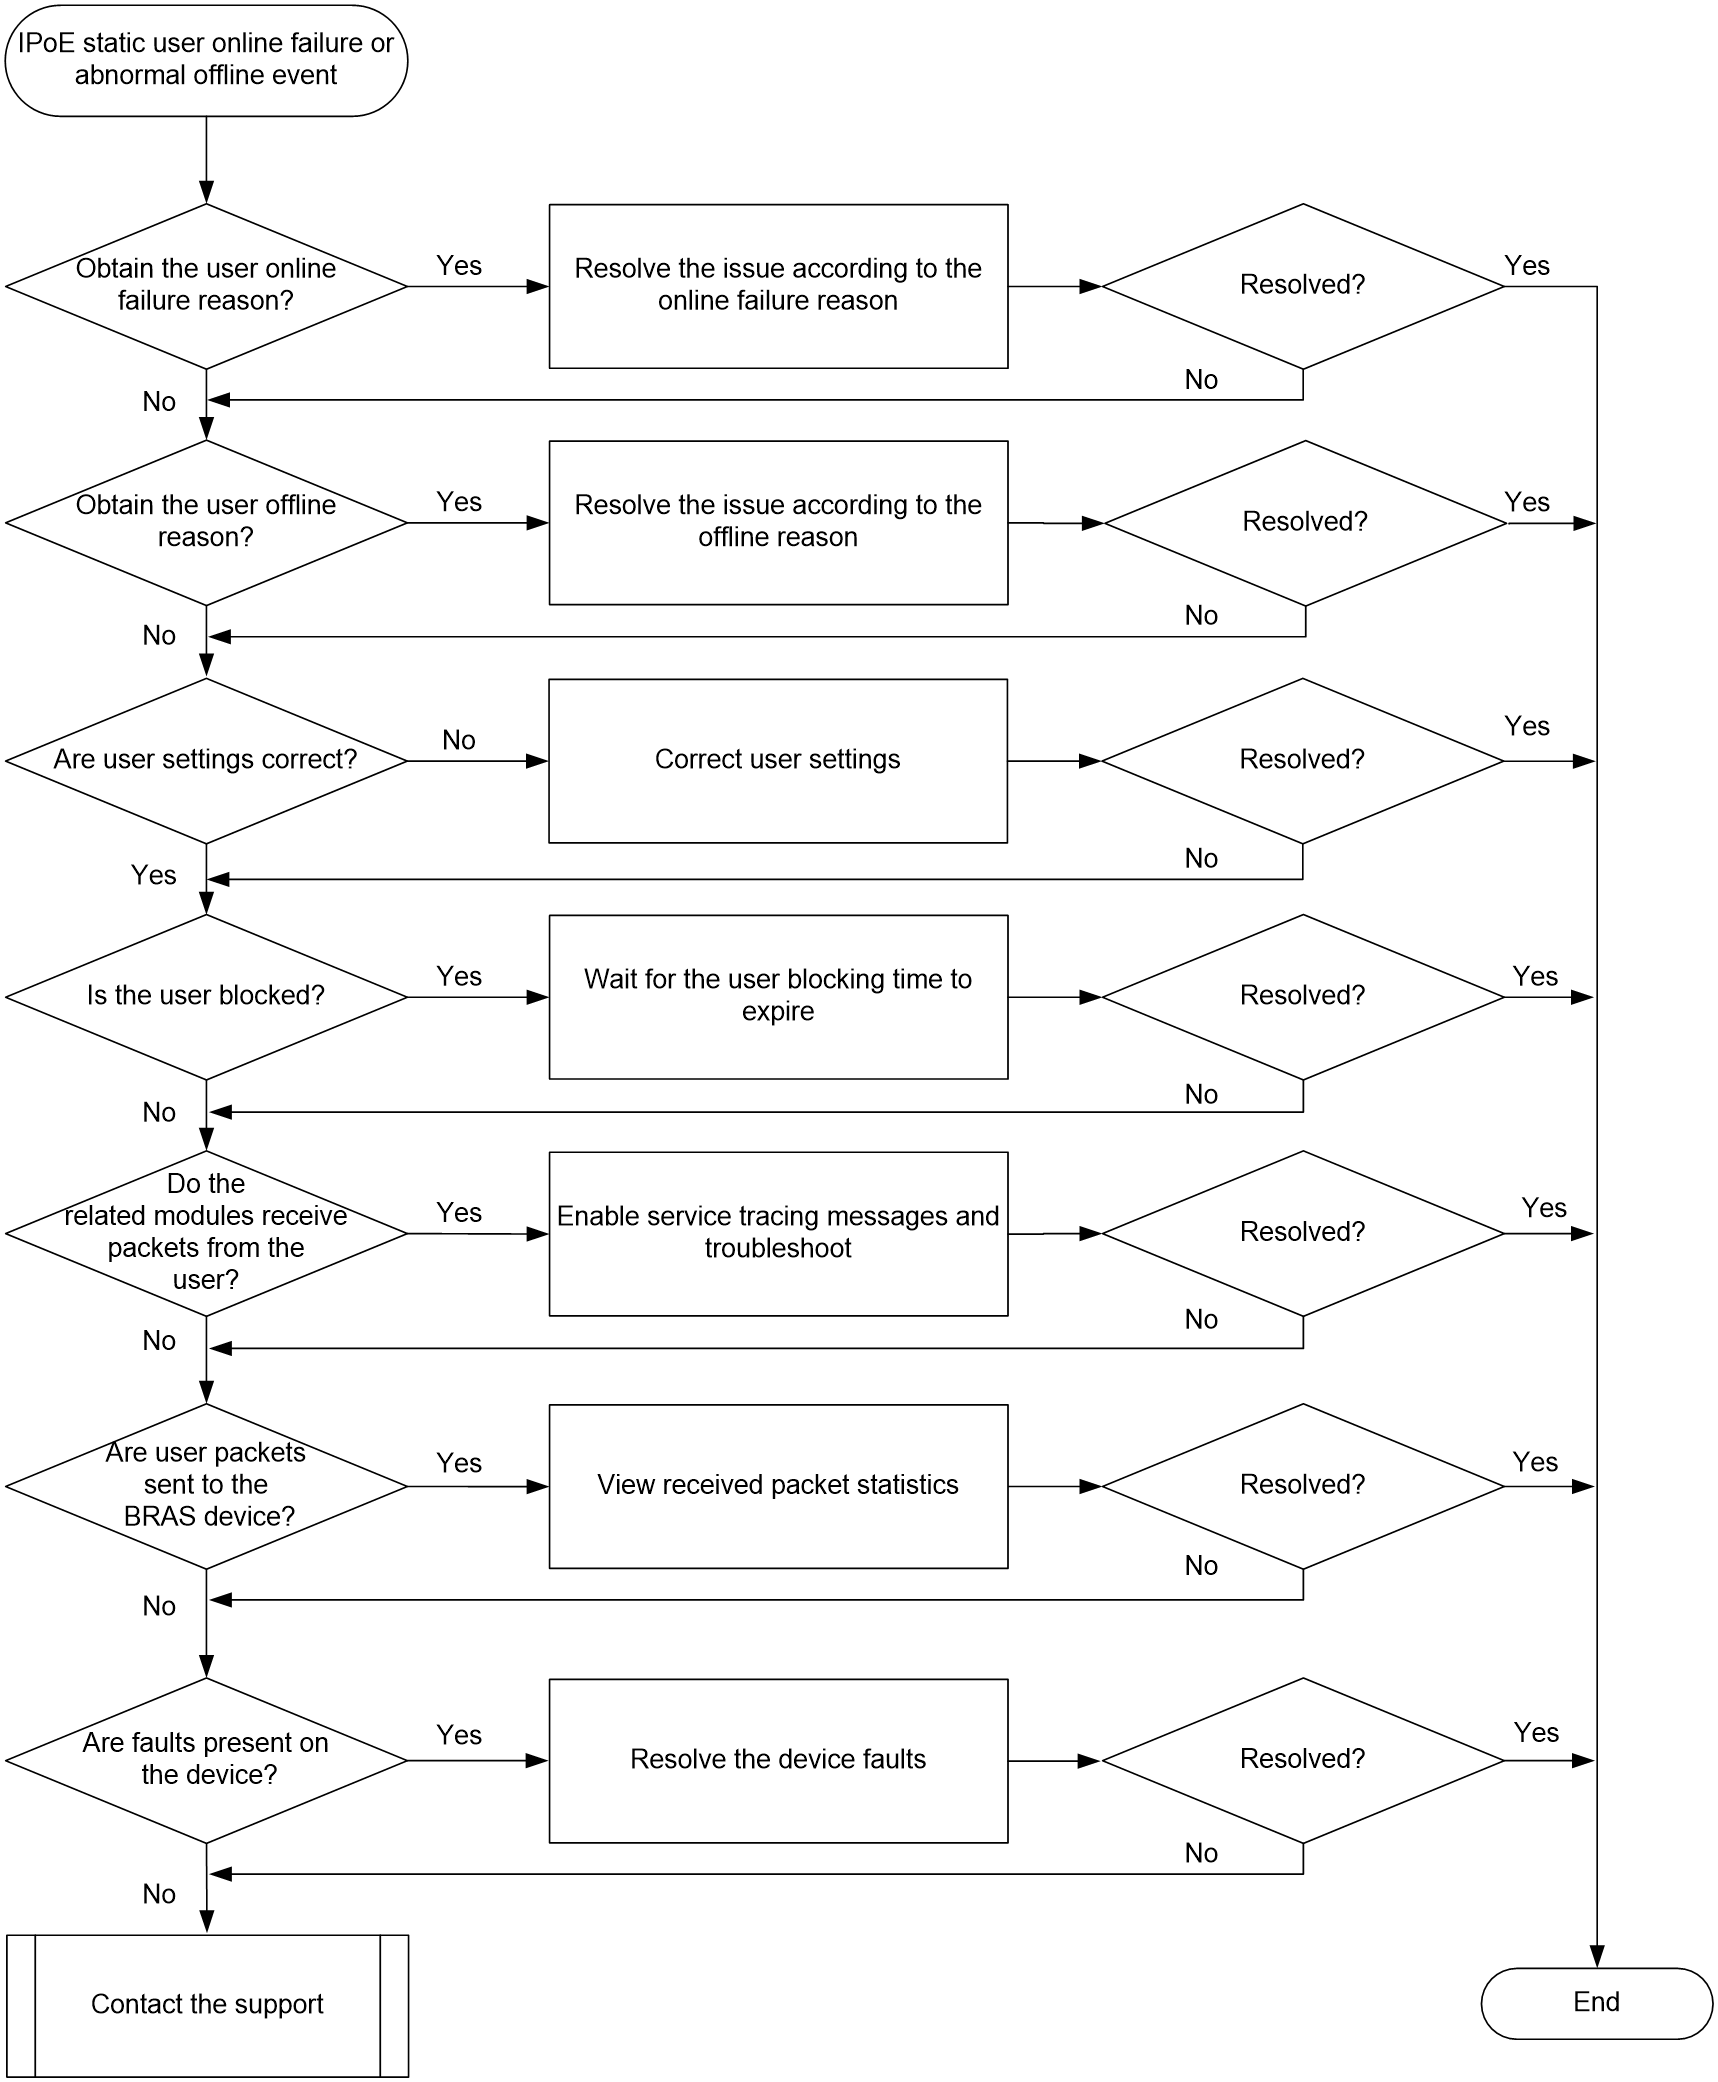
Solution
1. View the reason causing online failure of the IPoE static user.
Execute the display aaa online-fail-record command to display the user online failure reason.
<Sysname> display aaa online-fail-record
Username:
Domain:
MAC address: 0000-5e00-01cc
Access type: IPoE
Access UP ID: 1353
Access interface: XGE3/1/1
SVLAN/CVLAN: -/-
IP address: 2.2.2.9
IPv6 address: -
Online request time: 2021/08/15 06:09:54
Online failure reason: static user not config
The Online failure reason field in the command output displays the user online failure reason. You can roughly locate the fault based on the failure reason, which provides guidance for later troubleshooting. Search for the displayed reason in "Appendix A Reasons for user login failures and abnormal logouts" and troubleshoot according to the corresponding solution.
You can resolve the issues caused by some failure reasons such as Authentication method error, Local authentication request was rejected, and Static user not config by correcting the configuration. If you cannot see the reason for the failure, proceed with the next step.
2. View the IPoE user offline reason.
If you cannot obtain the online failure reason for the user in step 1, the user might come online successfully and then go offline. In this case, use the display aaa offline-record command to display user offline records.
If the user first comes online successfully and then goes offline, the Offline reason field in the command output displays the offline reason. You can roughly locate the fault based on the failure reason, which provides guidance for later troubleshooting.
Search for the displayed reason in "Appendix A Reasons for user login failures and abnormal logouts" and troubleshoot according to the corresponding solution.
If you cannot use the display aaa offline-record command to obtain the user offline reason, proceed with the next step.
3. Verify that the IPoE static user settings are correct.
Check the IPoE static user settings by referring to the manuals for the BRAS product. For example, view tasks at a glance and configuration examples in the configuration guide for the related module.
¡ If there are incorrect settings, correct the settings and then try to come online again.
¡ If the settings are correct but the issue persists, proceed with the next step.
4. Identify whether the user has been blocked.
Execute the display ip subscriber chasten user quiet command to identify whether the user has been blocked.
¡ If the user has been blocked, redial after the remaining blocking time expires.
¡ If the user is not blocked, identify whether protocol packet loss occurs during packet transmission to the related modules on the BRAS device.
5. Verify that related modules have received packets from the user.
¡ If the static user uses unclassified-IP packet initiation, execute the debugging ip subscriber packet command to enable IPoE packet receipt and transmit debugging and troubleshoot based on debugging information.
¡ If the static user uses ARP packet initiation, execute the debugging arp packet interface ten-gigabitethernet xxx command to enable ARP packet receipt and transmit debugging and troubleshoot based on debugging information.
¡ If the static user uses ND packet initiation, execute the debugging ipv6 nd packet interface ten-gigabitethernet xxx command to enable ND packet receipt and transmit debugging and troubleshoot based on debugging information.
¡ Execute the following commands to enable service tracing messages, and collect service tracing messages and troubleshoot based on the messages.
- Execute the trace access-user command to to create a service tracing object.
- Execute the debugging ip subscriber all command to enable IPoE debugging.
- Execute the terminal debugging and terminal monitor commands to enable output of debugging messages to the current terminal and enable log output to the current terminal.
If the related modules have not received packets from the user, proceed with the next step.
6. Verify that the user packets have been sent to the BRAS device.
Execute the display hardware internal rxtx packet statistic command in probe view to view statistics about packets transmitted and received on the device driver (non-vBRAS-CPs)
For information about how to identify whether user packets have been sent to the BRAS device in a CUPS network, see "User online failure" in Troubleshooting issues specific to a CUPS network
<Sysname> system-view
[Sysname-probe] probe
[Sysname-probe] display hardware internal rxtx packet statistic slot 3 cpu 0
Net port packet loss count:
code counter
Rx packets statistic:
counter success rate
NET ->RXTX : 3177780 3177780 9 pps
Cpu code input list:(Mgment to L1 queue)
code counter success(whitelist/normal)
5 2057 2057(0/2057)
6 2077 2077(0/2077)
17 98 98(0/98)
18 48 48(0/48)
30 2091197 2091197(0/2091197)
35 573 573(0/573)
43 565 565(0/565)
45 4327 4327(0/4327)
49 79488 79488(0/79488)
50 85 85(0/85)
53 69830 69830(69823/7)
54 46567 46567(46566/1)
57 161707 161707(0/161707)
59 13052 13052(13044/8)
60 26280 26280(13953/12327)
61 30 30(0/30)
153 593518 593518(593513/5)
185 4354 4354(0/4354)
194 81927 81927(0/81927)
Callback function packets statistic:
total(r) success(r) total(c) success(c)
MACL: 0 0 0 0
NATL: 0 0 0 0
BFD: 0 0 0 0
(null): 0 0 0 0
Task input pkt statistics:
Task name total success
Main Task : 1086583 1086583
Icmp Task : 0 0
Cpu code input list:(L2 queue to platform)
code counter success drop rate
5 2057 2057 0 0
6 2077 2077 0 0
17 98 98 0 0
18 48 48 0 0
35 573 573 0 0
43 565 565 0 0
45 4327 4327 0 0
49 79488 79488 0 0
50 85 85 0 0
53 69830 69830 0 0
54 46567 46567 0 0
57 161707 161707 0 0
59 13052 13052 0 0
60 26280 26280 0 0
61 30 30 0 0
153 593518 593518 0 1
185 4354 4354 0 0
194 81927 81927 0 0
Cpu code to protocol:
5 ARP_REQ_LOCAL
6 ARP_REL
17 ARP_REQ
18 ARP_REQ_PROXY
30 DIAG
35 ND_NA
43 ND_NS
45 ND_RA
49 OSPF_HELLO,OSPF_LSU,OSPF_LSACK
50 OSPF_DD,OSPF_LSR
53 LDP_HELLO
54 LDP_NOTIF,LDP_INIT,LDP_KPALV,LDP_ADDR,LDP_LABEL
57 ISIS
59 BGP
60 BGP4P_IPV6
61 DHCP_IPOE,DHCP_SNOOPING,DHCP,DHCPv6_RELAY,DHCPv6_RELS,DHCPv6_SERV
153 IP_VSRP
185 VXLAN_GPE
194 CUSP
Debug packets statistic:
counter counter rate
NET->RXTX->SERVICE: 0 0 0 pps
SERVICE->RXTX->NET: 0 0 0 pps
failed
MbufTrSend: 0
FoundIfindex: 0
SaveCoreSta: 0
MainCoreSta: 0
TxFailedSta: 0
If the received ARP, ND, or unclassified IP packet count has increased, the device has received the packets and sent them to the platform. You can use debugging for the forwarding function to check the layer on which packets are dropped step by step. If the count does not increase, execute the display hardware internal np pktcnt drop command to identify whether the driver has dropped packets.
<Sysname> system-view
[Sysname-probe] probe
[Sysname-probe] display hardware internal np pktcnt drop slot 3 (the command for viewing the packet count varies by device model)
Current Mcode Type: SIRIUS_RELEASE
The NP 0 is Both NP
Drop packet statistics
32B7 116497 TOPparse total discarded pkts
350F 916677 TOPresolve total discarded pkts
51A 66 PRS Ingress route interface deny L2 forward
56B 384 PRS Ingress Route interface deny L2 forward
63C 403633 RSV Ingress ARP packet FTN or BROADCAST table no ma
tch
63E 372789 RSV Ingress PROTOCOL_MAC and BROADCAST table no mat
ch
641 161878 RSV Ingress PROTOCOL_MAC.THB is set, but BROADCAST
table no match
645 149489 RSV Ingress multicast, MULTICAST.DROP is set
646 144150 RSV Ingress multicast, match MULTICAST default entr
y, but BROADCAST table no match
663 4 RSV Ingress broadcast packets from route port, PROT
OCOL_PORT table no match
¡ If the dropped packet count keeps increasing, analyze the possible issues according to the packet drop reasons.
¡ If the dropped packet count does not increase and the number of packets sent to the CPU also does not increase, packets are not successfully sent to the BRAS. In this case, proceed with the next step.
7. Check whether faults are present on the device.
¡ Make sure the physical connections of the device are correct.
¡ Make sure the network settings of the device are correct.
8. If the issue persists, collect the following information and contact Technical Support:
¡ Results of each step.
¡ The configuration file, log messages, and alarm messages.
IPoE Web user online failure
Web authentication page not showing up
Symptom
When an IPoE user accesses the Web authentication page or access another page than the Web authentication page, the Web authentication page does not show up.
Common causes
The following are the common causes of this type of issue:
· The Web authentication page URL is configured incorrectly in preauthentication view.
· The QoS policy is configured incorrectly in the preauthentication phase.
· Disconnectivity between the host, server, and device.
· HTTP proxy has been enabled in the browser.
· The URL entered by the user uses a non-standard TCP port number.
· An issue has occurred on the intermediate network or DNS server.
· HTTPS redirection on the device is abnormal.
· The HTTPS website accessed by the user has enabled with HTTP Strict Transport Security (HSTS).
· The portal server cannot recognize URL escape codes.
· Portal server configuration error.
Troubleshooting flow
Figure 10 shows the troubleshooting flowchart.
Figure 10 Flowchart for troubleshooting Web authentication page not showing up
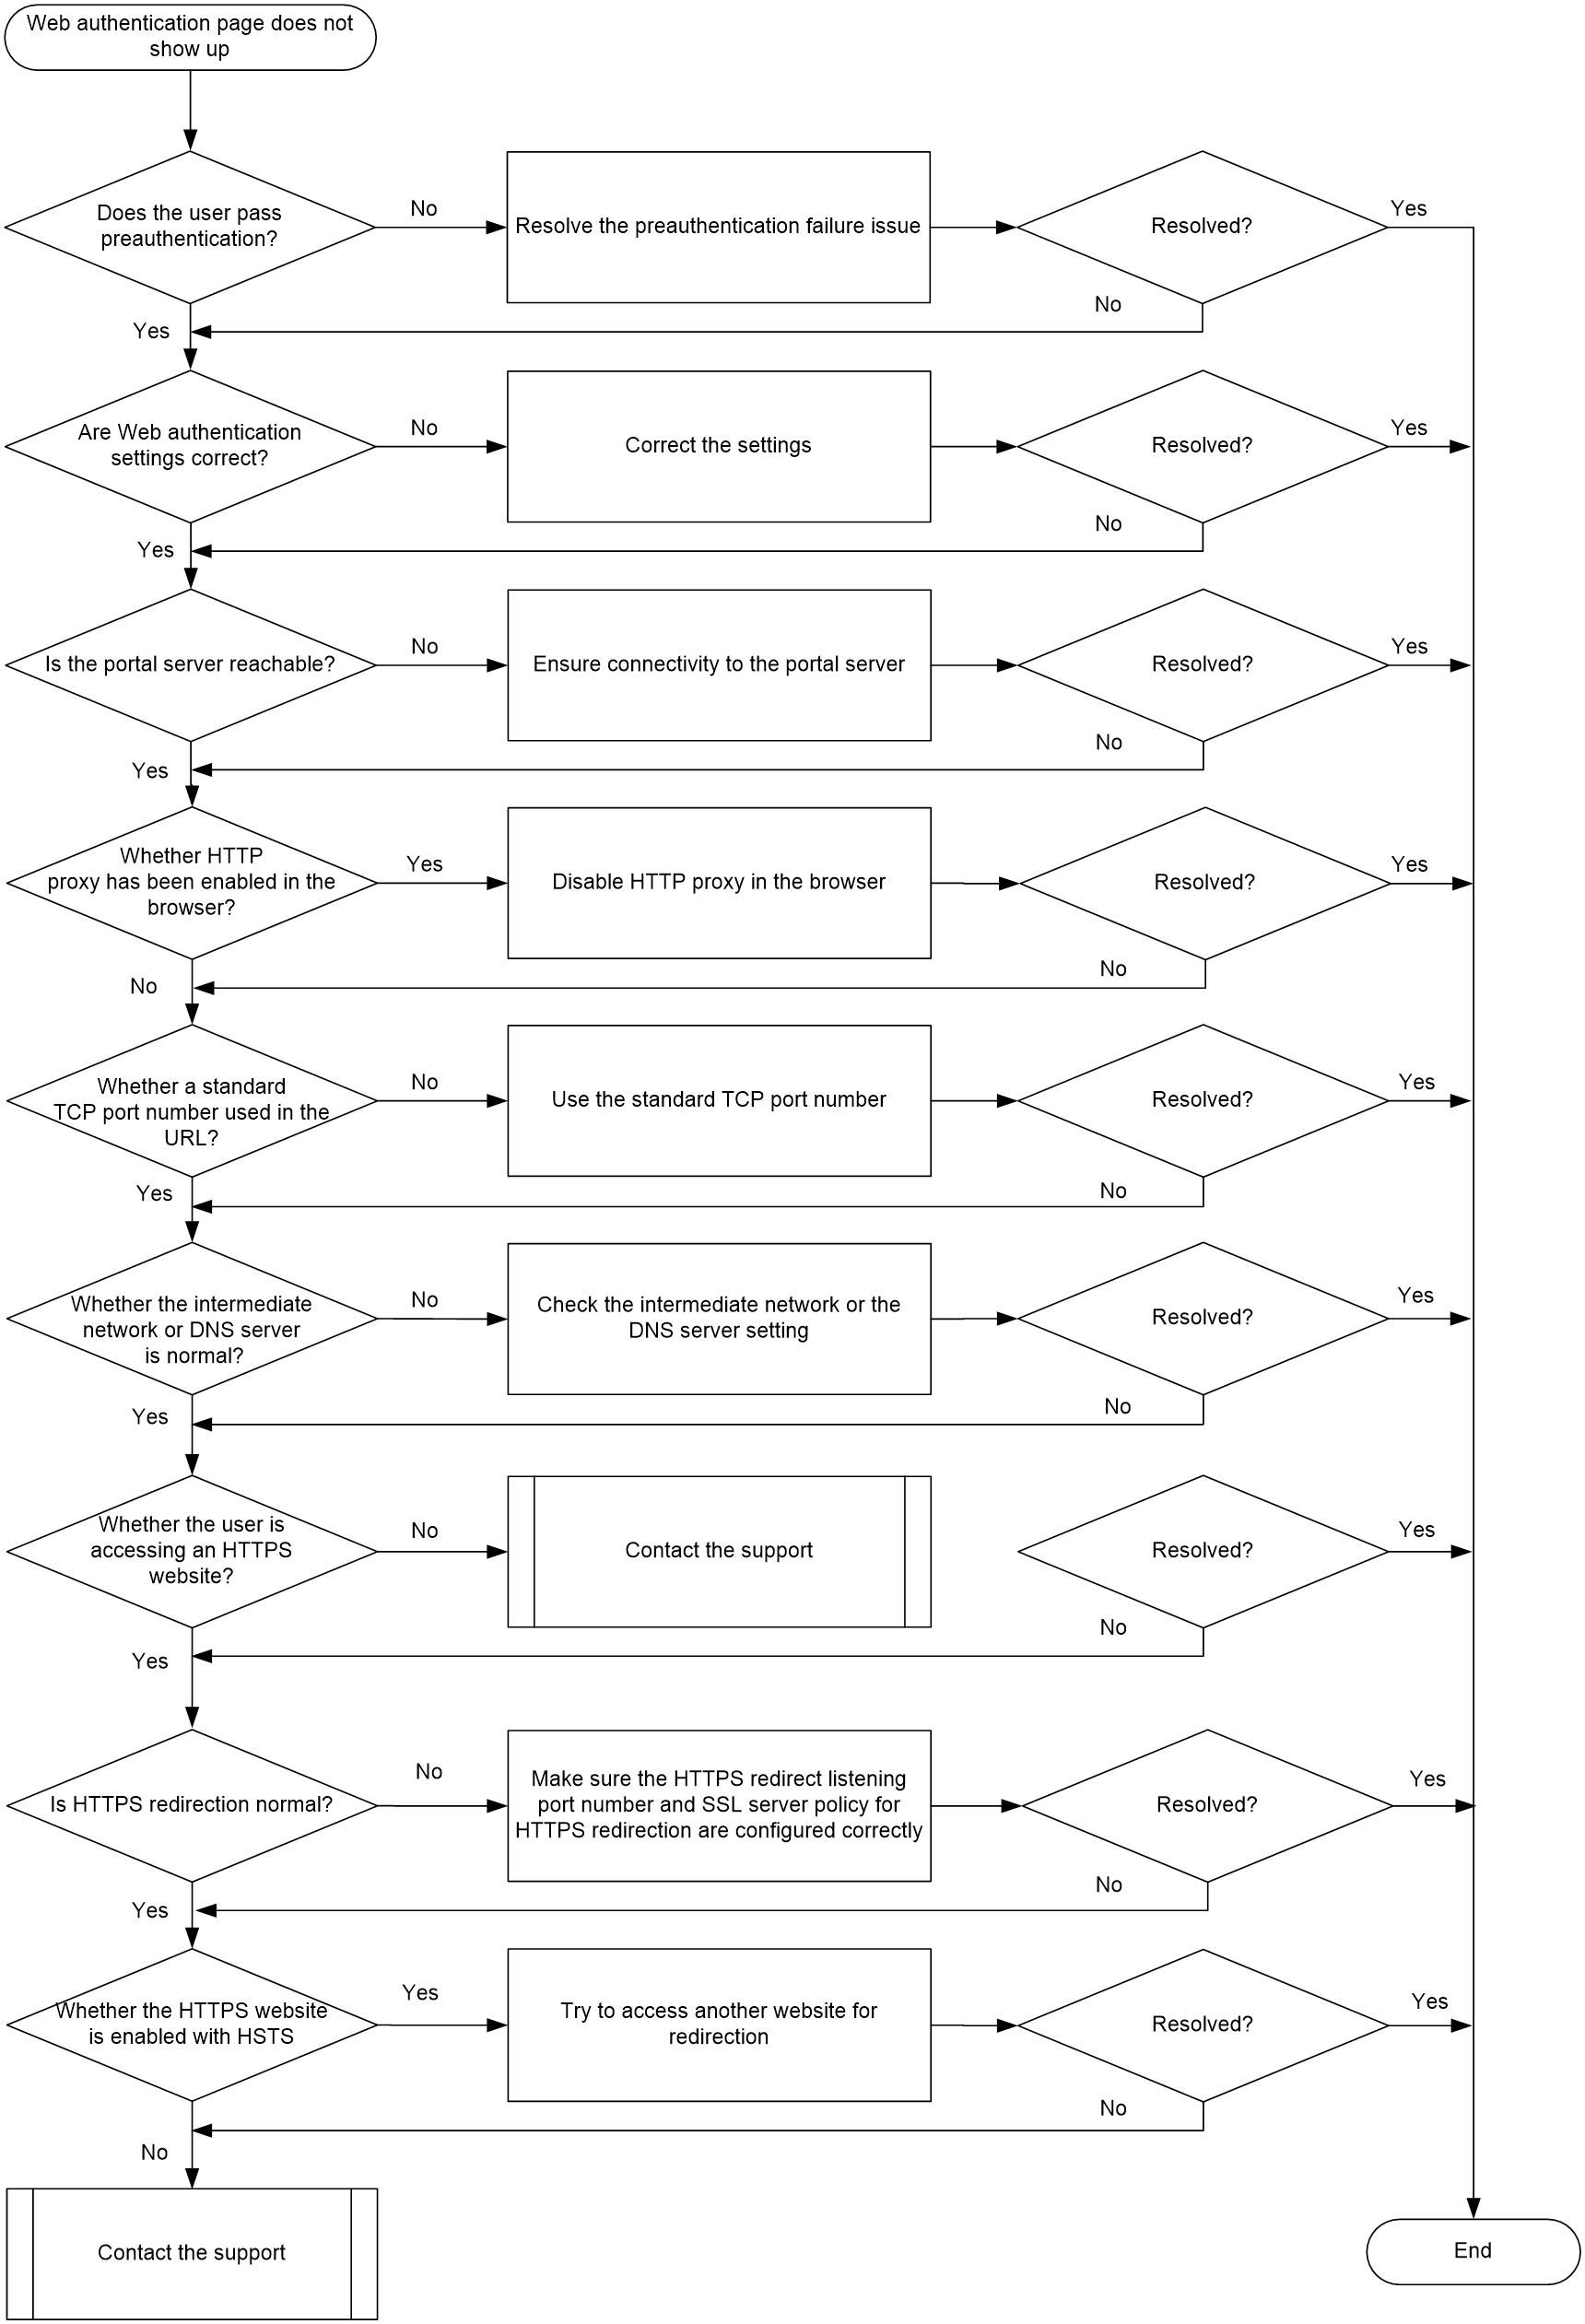
Solution
1. Verify that the user has passed preauthentication.
If the user fails to pass preauthentication, resolve the issues to ensure that it can pass preauthentication.
2. Verify that Web authentication settings are correct.
¡ Verify that the IP address of the portal authentication server is configured correctly on the BRAS device.
¡ Verify that the Web authentication page URL is configured correctly on the BRAS device.
¡ Verify that the QoS policy settings for preauthentication are configured correctly on the BRAS device:
- Inbound direction: Allow packets with the portal server as the destination address to pass through.
- Outbound direction: Allow packets with the portal server as the source address to pass through.
¡ Verify that the device has been bound to an IP address group on the portal server.
¡ Verify that the endpoint IP address is within the range of the IP address group configured on the Portal server.
3. Verify that the route settings on the endpoint and the portal server are correct.
a. Disable firewall on the endpoint and ping the portal server from the endpoint. If the ping operation fails, first identify whether the route settings on the endpoint and portal server are correct, and then check the following items:
- Whether the route from the portal server to the endpoint is configured correctly.
- Whether multiple network cards exist on the endpoint and portal server.
If multiple network cards exist, not all traffic between the endpoint and the server will go through the network with portal authentication. Check specific route information and determine from which network cards the Web access traffic goes out. For example, if you are using a Windows endpoint, execute the route print command in the CLI to view specific routing information.
b. Perform ping operations by hop. First ping the gateway from the endpoint (authentication must be disabled first), and then ping the server from the gateway.
4. Identify whether HTTP proxy is enabled in the endpoint browser.
Enabling HTTP proxy in the browser will prevent users from accessing the portal authentication page. You must disable HTTP proxy in the browser. For example, to disable HTTP proxy in a Windows IE browser, click Tools, select Internet Options > Connections > LAN Settings > Proxy Server, and then turn off HTTP proxy.
5. Identify whether the entered URL uses a non-standard TCP port.
Non-standard TCP ports are non-80 or non-443 ports. If the URL entered by the user contains a non-standard TCP port, for example, http://10.1.1.1:18008, the portal authentication page will not pop up. For an HTTP URL, use port number 80. For an HTTPS URL, use port number 443.
6. Identify whether there are any issues with the intermediate network or DNS server.
¡ Identify whether the DNS server IP address is allowed on the device.
¡ Identify the intermediate network connectivity and determine whether a fault has occurred on the DNS server. On the gateway, collect traffic statistics on the downlink interface connecting the endpoint and uplink interface connecting the DNS server or mirror the endpoint messages that access the DNS server. Determine whether the gateway has sent out DNS requests but not received a response message.
7. Identify whether HTTPS redirection is enabled.
¡ If the user is accessing an HTTPS website, the device will redirect the HTTPS request of the user. You must configure an HTTPS redirect listening port number (by using the http-redirect https-port command) on the device (non-vBRAS-CPs). Before configuring an HTTPS redirect listening port number, ensure that the port is not occupied by other services. To view the occupied TCP ports, execute the display tcp command.
¡ Identify whether an SSL server policy for HTTPS redirection exists. If no such policy exists, configure it.
8. Identify whether the HTTPS website has been enabled with HSTS.
If the HTTPS website has been enabled with HSTS, a browser must use HTTPS to access the HTTPS website, and the certificate must be valid. To redirect the HTTPS request from a browser, the device will use a self-signed certificate (the device does not have a certificate from the target website, and can only use a self-signed certificate) in the disguise of the target website to establish an SSL connection with the browser. Once the browser detects that the certificate is not trusted, HTTPS redirection fails and the portal authentication page will not pop up. This situation depends on the HSTS mandatory requirements on the website and cannot be resolved. In this case, try to access another website.
9. If the issue persists, collect the following information and contact Technical Support:
¡ Results of each step.
¡ The configuration file, log messages, and alarm messages.
¡ Snapshots of portal related configuration on the portal server.
¡ Packet capture files for packet transmission between the device and server.
¡ Snapshots of the client browser issues.
¡ Debugging information collected by executing the debugging portal and debugging portal commands.
Access failure to the Web authentication page
Symptom
A user fails Web authentication or an authentication anomaly occurs.
Common causes
The following are the common causes of this type of issue:
· The shared key configured in portal authentication server view on the BRAS device is inconsistent with that on the portal authentication server.
· The portal authentication server address configured in portal authentication server view on the BRAS device does not exist.
· The portal messages received on the BRAS device are invalid.
· The IPS domain used by the Web user is incorrect.
· The shared key configured in RADIUS view is inconsistent with that on the RADIUS server.
· The RADIUS server rejects the authentication request.
· The RADIUS server does not respond.
Troubleshooting flow
Figure 11 shows the troubleshooting flowchart.
Figure 11 Flowchart for troubleshooting access failure to the Web authentication page
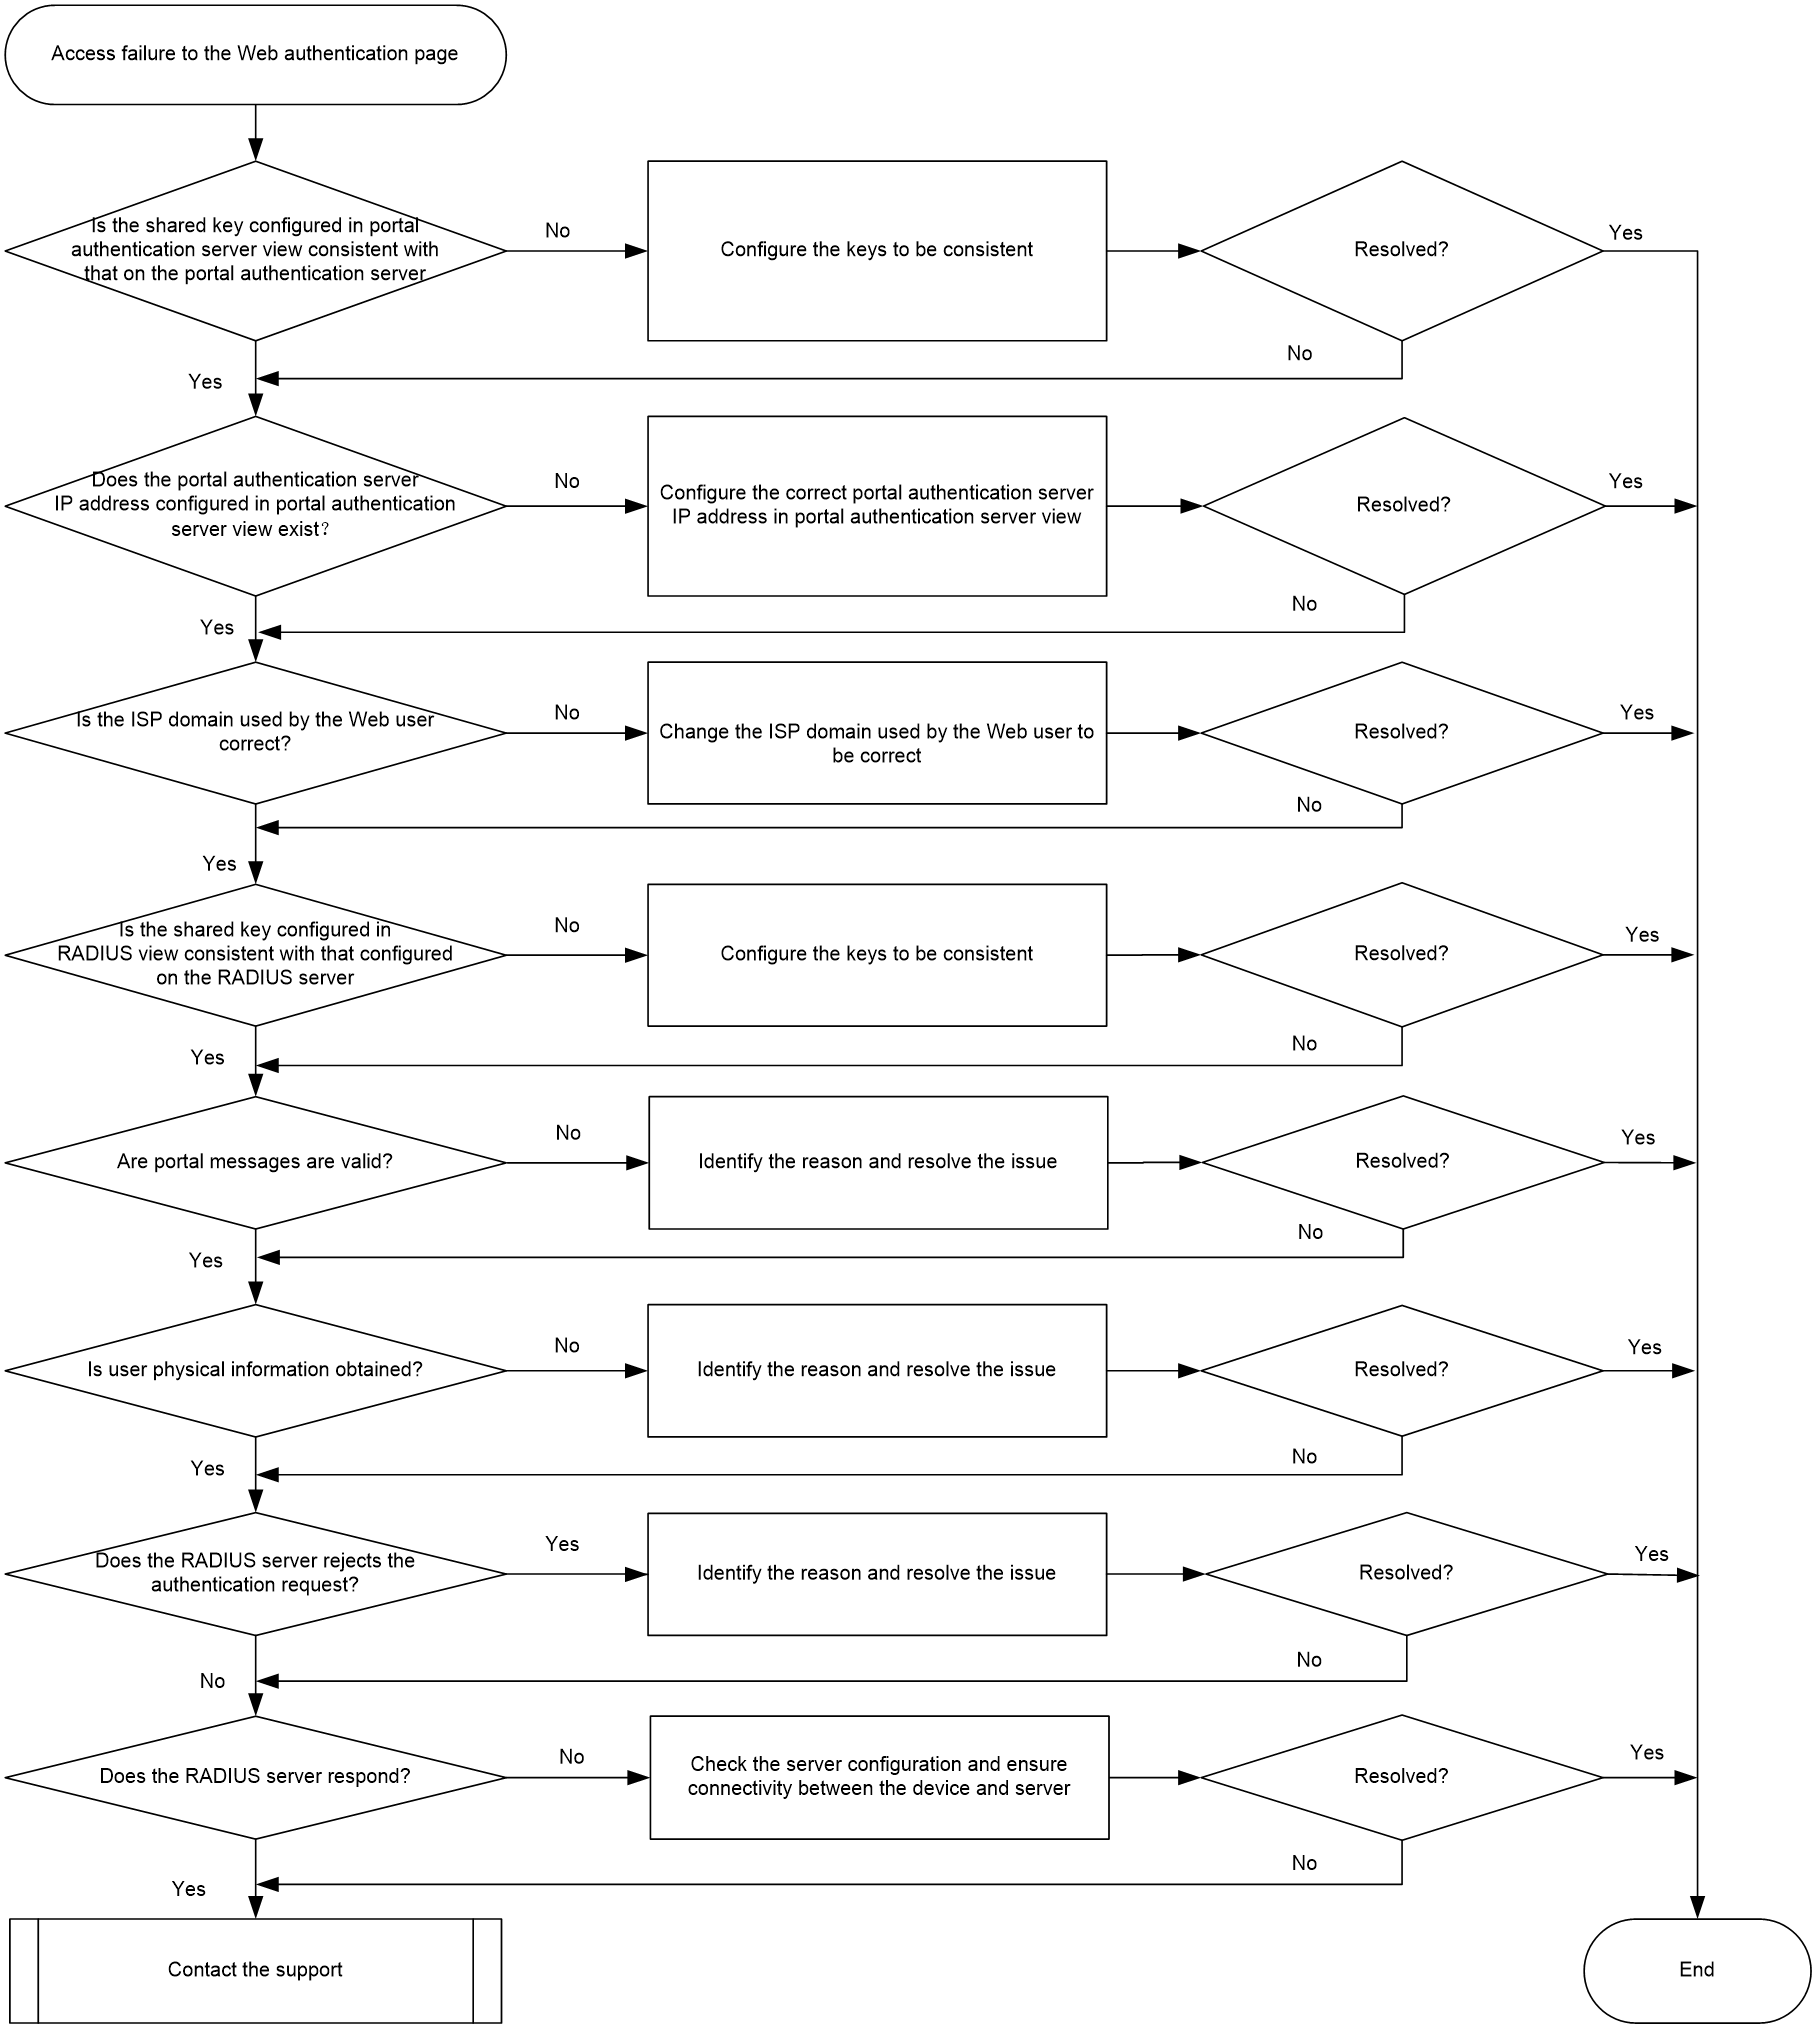
Solution
1. Identify whether the shared key configured in portal authentication server view on the BRAS device is inconsistent with that on the portal authentication server.
If a request timeout message is displayed on the Web login page after you enter the username and password on the page for coming online, the shared key configured in portal authentication server view on the BRAS device might be inconsistent with that on the portal authentication server.
Execute the debugging portal error command on the BRAS device and enable portal error debugging. If following information is generated on the device, the shared key configured on the BRAS device is inconsistent with that on the portal server.
*Jul 28 17:51:20:774 2021 Sysname PORTAL/7/ERROR: -MDC=1; Packet validity check failed due to invalid key.
If the shared key configured on the BRAS device is inconsistent with that on the portal server, change the shared key configured in portal server view on the BRAS device or the shared key configured on the portal authentication server to ensure that they are consistent.
2. Identify whether the portal authentication server IP address configured in portal authentication server view on the BRAS device exists.
When the portal server receives an authentication packet from the BRAS device, it will verify whether the source IP of the message is an allowed IP. If the IP is not allowed, the packet is considered invalid and will be discarded directly.
If a request timeout message is displayed on the Web login page after you enter the username and password on the page for coming online, the portal authentication server IP address configured in portal authentication server view on the BRAS device exist might not exist.
Execute the debugging portal error command on the BRAS device and enable portal error debugging. If following information is generated on the device, the portal authentication server IP address configured on the device is incorrect.
*Jul 28 19:15:10:665 2021 Sysname PORTAL/7/ERROR: -MDC=1;Packet source unknown. Server IP:192.168.161.188, VRF Index:0.
If the portal authentication server IP address configured on the device is incorrect, execute the ip command in portal server view to modify the IP address of the portal server.
3. Identify whether the ISP domain is configured correctly on the device.
For authentication to be performed on users, make sure the ISP domain is configured correctly on the device.
If a message that the device rejects the request is generated on the Web login page after you enter the username and password on the page for coming online, the ISP domain might be configured incorrectly.
Execute the debugging portal error command on the BRAS device and enable portal error debugging. If following information is generated on the device, the ISP domain on the device is configured incorrectly.
*Jul 28 19:49:12:725 2021 Sysname PORTAL/7/ERROR: -MDC=1; User-SM [21.0.0.21]: AAA processed authentication request and returned error.
If the ISP domain is configured incorrectly, execute the related command to change the ISP domain used by the Web user to be correct.
4. Identify whether the shared key configured in RADIUS view on the device is consistent with that configured on the RADIUS server.
If a request timeout message is displayed on the Web login page after you enter the username and password on the page for coming online, the shared key configured in RADIUS view on the device might be inconsistent with that configured on the RADIUS server..
Execute the debugging radius error command on the BRAS device and enable RADIUS error debugging. If following information is generated on the device, the shared key configured in RADIUS view on the device is inconsistent with that configured on the RADIUS server.
*Jul 28 19:49:12:725 2021 Sysname RADIUS/7/ERROR: -MDC=1; The response packet has an invalid Response Authenticator value.
When the device sends an authentication request to the RADIUS server, the server will first verify the request message using the shared key. If the verification fails, the server will notify the device that the verification has failed. If the shared key is configured incorrectly, change the key in RADIUS view on the device or the key on the RADIUS server to ensure that they are consistent.
5. Identify whether the portal packets are valid.
When the device receives a portal protocol packet from the portal server, it verifies the validity of the packet. If the packet length or the packet verification segment is incorrect, the packet will be considered invalid and discarded.
Execute the display portal packet statistics command to check whether the number of invalid packets is increasing. If the number of invalid packets is increasing, execute the debugging portal error command to enable portal error debugging for troubleshooting.
If the portal protocol packets are invalid, identify the reason causing message invalidity with the assistance of technical support personnel, resolve the issues, and make sure the portal packets are valid.
6. Identify whether the device fails to obtain user physical information.
During the user's online process, the portal module will obtain the user's physical information and determine interface and other information based on physical information. If the device fails to obtain the user's physical information, the user will fail to go online.
Execute the debugging portal event command and enable portal event debugging. If following information is generated on the device, the device fails to obtain user's physical information.
*Jul 28 19:49:12:725 2021 Sysname PORTAL/7/ERROR: -MDC=1; User-SM [21.0.0.21]: Failed to find physical info for ack_info.
If the device fails to obtain physical information of the user, identify whether an entry for the authentication user exists on the device. If no such entry exists, locate the reason.
7. Identify whether the RADIUS server rejects the authentication request.
There are various reasons why a RADIUS server rejects an authentication request. The most common ones are incorrect username or password and mismatch of the RADIUS server authorization policy. To resolve the issue, first view the authentication logs on the server side or enable RADIUS error debugging on the device to identify the root cause. Then, adjust the server, endpoint, or device configuration according to the root cause.
8. Identify whether the RADIUS server responds.
You can use the following methods to quickly identify whether the RADIUS server responds.
¡ Execute the display radius scheme command on the BRAS device to view the server status. If the status is Blocked, the server is not available.
¡ Identify whether the following message has been generated on the device.
RADIUS/4/RADIUS_AUTH_SERVER_DOWN: -MDC=1; RADIUS authentication server was
blocked: server IP=192.168.161.188, port=1812, VPN instance=public.
¡ Execute the debugging radius event command and enable event debugging for the RADIUS module. If following information is generated on the device, the RADIUS server does not respond.
*Jul 28 19:49:12:725 2021 Sysname RADIUS/7/evnet: -MDC=1; Reached the maximum retries.
If the RADIUS server does not respond, perform the following tasks:
a. Identify whether the device IP address has been added to the server.
- If not added, add the correct device IP address to the server.
- If added, determine whether the IP address of the device added to the server is consistent with the source IP address of the authentication request. The device uses the IP address of the default outgoing interface as the source IP address of the RADIUS authentication request. You can change the source IP address by using the source-ip command as needed. For more information about the source-ip command, see AAA command reference in BRAS Services Command References.
b. Identify whether the link between the device and server is normal, for example, whether the firewall between the two does permit the RADIUS packets (default authentication port: 1812). If a large number of users cannot be authenticated and a RADIUS server down log is generated on the device, the server or intermediate network might be abnormal, which must be identified one by one.
9. If the issue persists, collect the following information and contact Technical Support:
¡ Results of each step.
¡ The configuration file, log messages, and alarm messages.
¡ Snapshots of portal related configuration on the portal server.
¡ Packet capture files for packet transmission between the device and AAA server
¡ Snapshots of the client browser issues.
¡ Debugging information collected by executing the debugging portal command.
Troubleshooting issues specific to a CUPS network
User online failure
This chapter describes how to troubleshoot issues specific to a CP and UP separation (CUPS) network. For how to troubleshoot issues on other networks, see the chapters for troubleshooting common BRAS access issues.
Symptom
A user failed to come online on a CUPS network.
Common causes
The following are the common causes of this type of issue:
· BRAS-VM registration failure.
· FWD-VM registration failure.
· NETCONF connection failure.
· CUSP channel failure.
· VXLAN tunnel failure.
· Unmanaged remote interfaces.
· Configuration deployment failure.
· Network failure.
Troubleshooting flow
Figure 12 shows the troubleshooting flowchart.
Figure 12 Flowchart for troubleshooting user online failures
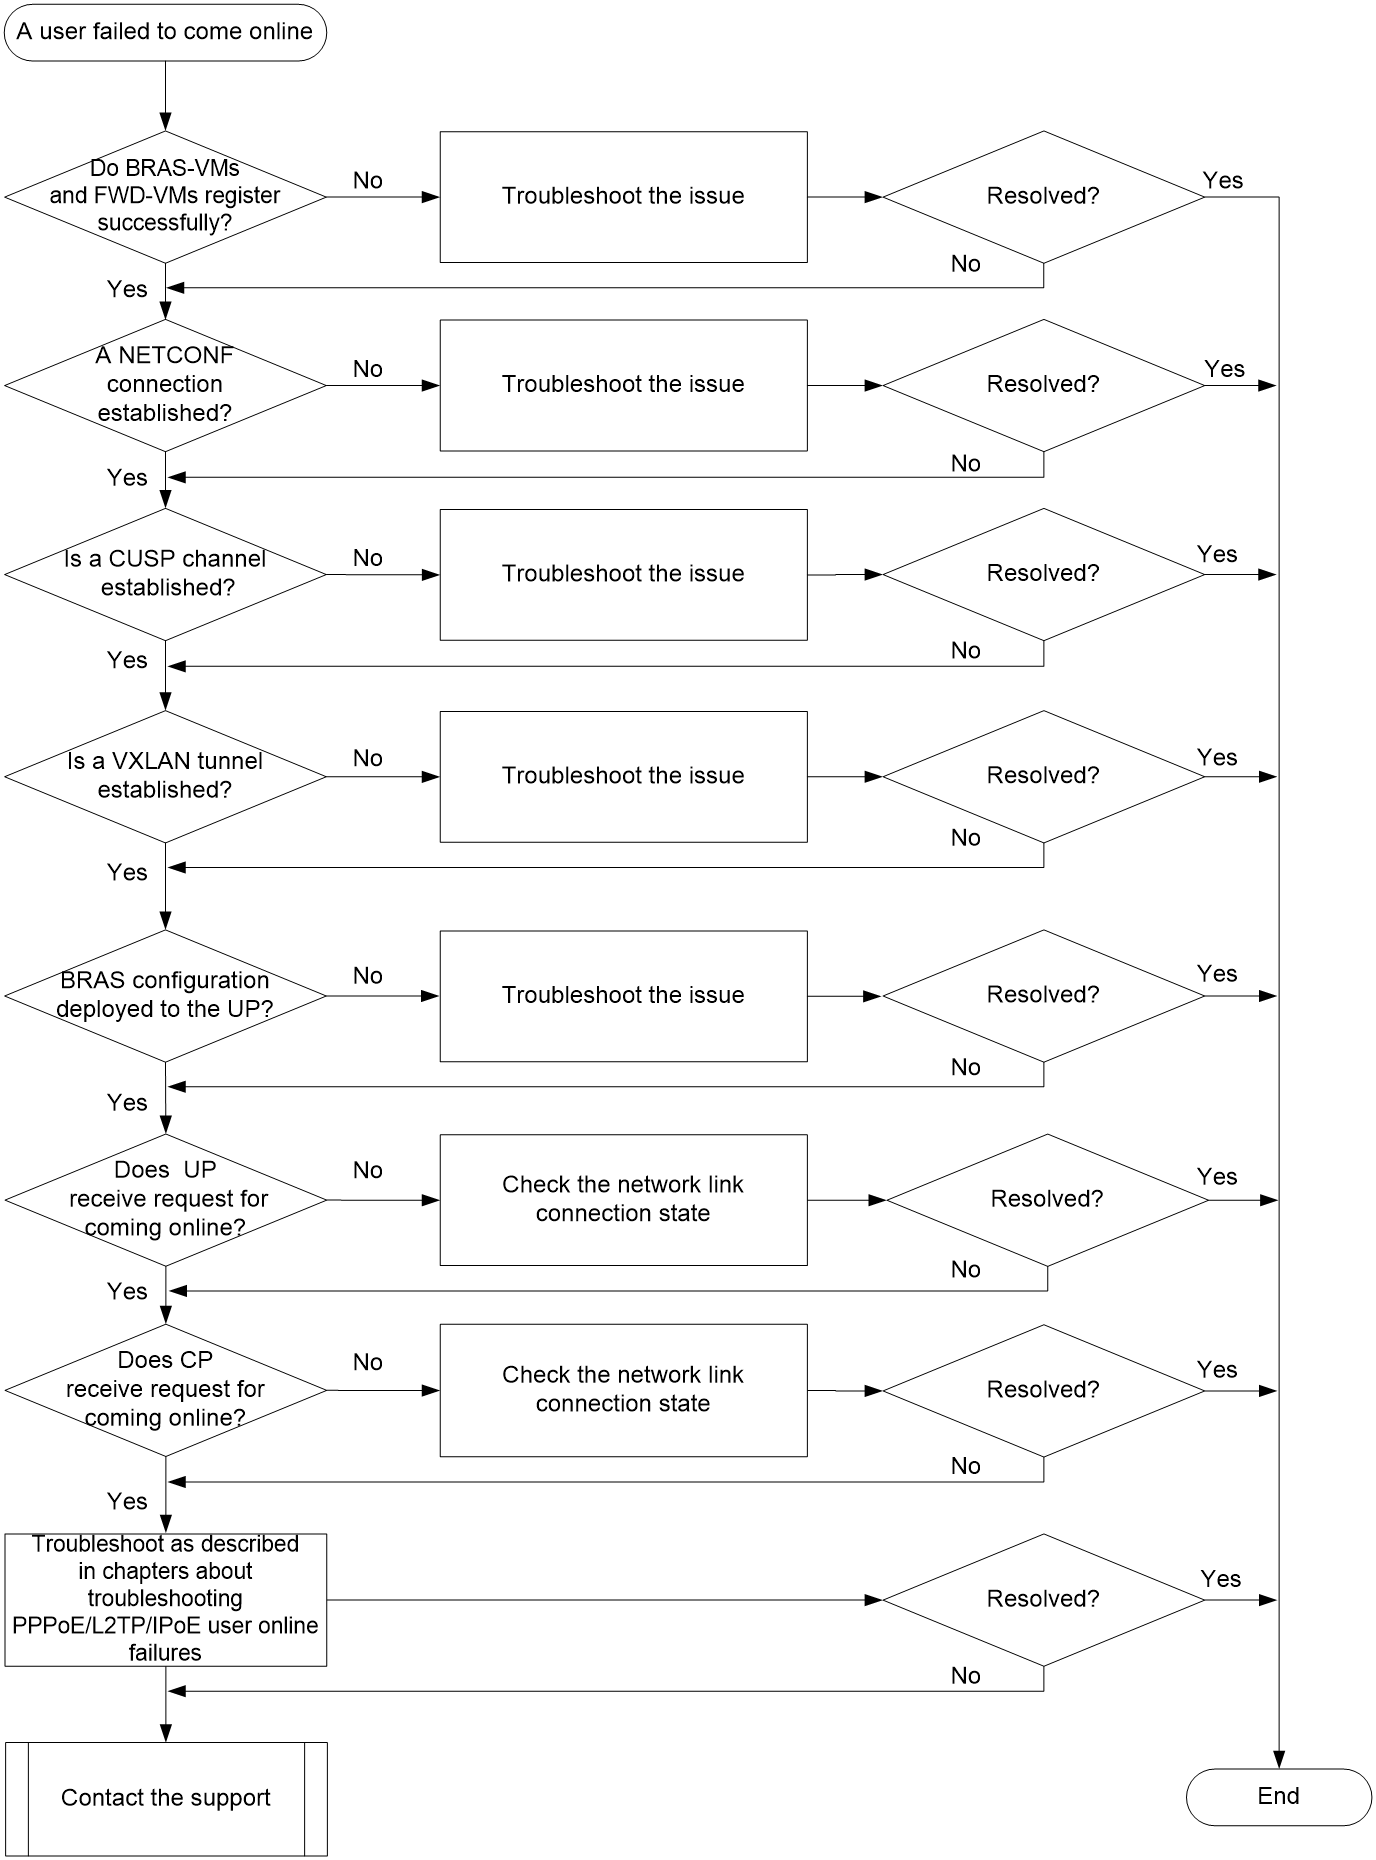
Solution
1. Execute the display vm command on the CP to verify if BRAS-VMs and FWD-VMs register with the CTRL-VM system successfully.
¡ If the Registration field displays Registered, the BRAS-VMs and FWD-VMs have registered with the CTRL-VM system successfully.
¡ If the Registration field does not display Registered, the BRAS-VMs and FWD-VMs fail to register with the CTRL-VM system. For more information, see "VM registration failure."
2. Execute the display netconfc session command on the CP to verify if a NETCONF connection is established between the CP and specified UP.
¡ If you can obtain the display, a NETCONF connection has been established between the CP and UP. Please go to the next step.
¡ If you cannot obtain the display, a NETCONF connection fails to be established between the CP and UP. For how to troubleshoot the issue, see "CP-UP connection management issues."
3. Execute the display cusp controller command on the CP to verify if a CUSP channel is established between the CP and specified UP.
¡ If the Connection state field displays Established, a CUSP channel has been established. Please go to the next step.
¡ If the Connection state field does not display Established, a CUSP connection fails to be set up. For how to troubleshoot the issue, see "CP-UP connection management issues."
4. Execute the display protocol-tunnel verbose command on the CP to verify if a VXLAN tunnel is established between the CP and specified UP.
¡ If the Active field displays Yes, a VXLAN tunnel has been established. Please go to the next step.
¡ If the Active field displays No, a VXLAN channel fails to be established. For how to troubleshoot the issue, see "CP-UP connection management issues."
5. Verify if the CP has deployed required BRAS configuration to the specified UP.
Execute the display this command on the user access interface on the UP to verify if cp-management configuration exists on the interface.
¡ If the interface has cp-management configuration, the interface has been remotely managed by the CP, which indicates that BRAS configuration has been deployed correctly.
¡ If the interface does not have cp-management configuration, go to the next step.
6. Verify if the UP has received the request packet for coming online.
Execute the display protocol-tunnel packet statistics command on the UP to obtain the outbound protocol packet statistics.
¡ If the number of the corresponding packets increases, go to the next step.
¡ If the number of the corresponding packets does not change, execute the debugging ucm forward all command to enable all types of debugging functions for the UCM forwarding plane.
- If the system outputs debugging information, the UP has received the packet. Please contact Technical Support.
- If the system does not output any debugging information, the UP does not receive the packet. Please check the network configuration and links.
7. Verify if the CP has received the request packet for coming online.
Execute the display protocol-tunnel packet statistics command on the CP to obtain the inbound protocol packet statistics.
¡ If the number of the corresponding packets increases, go to the next step.
¡ If the number of the corresponding packets does not change, capture packets traversing the NIC that connects to the CP by using Tcpdump on the UP.
¡ If the packet has been sent to the CP, capture packets on an interface of each FWD-VM by using the packet capture feature. Verify if the packet has been set to a FWD-VM. If a FWD-VM has received the packet, execute the display driver ten-gigabitethernet xxx message command in probe view to obtain the packet drop statistics for the x86 driver. The packet might be dropped due to incorrect VLAN ID. To resolve the issue, re-create the VXLAN tunnel and come online again.
8. Troubleshoot the issue as described in the chapters about troubleshooting PPPoE, L2TP, or IPoE user online failures.
9. If the issue persists, collect the following information and contact Technical Support:
¡ Results of each step.
¡ The configuration file, log messages, and alarm messages.
CP-UP connection management issues
CUPS channel failure
Symptom
On a CUPS system, the control channel, management channel, or protocol channel between the CP and a specified UP is abnormal. When you execute the cudetect cu tunnel-state command on the CTRL-VM, a minimum of one of the NETCONF Tunnel, CUSP Tunnel, and Protocol Tunnel fields does not display OK. For example:
<Sysname> cudetect cu tunnel-state up-id 1024
Please wait a few minutes...
Finished.
NETCONF Tunnel: NOK
Please configure the source IP of the NETCONF connetion abc to a interface on CP.
Please check the route to destination IP on CP.
CUSP Tunnel: OK
Protocol Tunnel: NOK
Please check the listening IP of the CUSP controller and the source IP of the protocol tunnel on CP.
Common causes
The following are the common causes of this type of issue:
· Management channel—Incorrect NETCONF connection settings.
· Control channel—Incorrect CUSP settings.
· Protocol channel—Incorrect VXLAN tunnel settings.
Troubleshooting flow
Troubleshoot this type of issue as follows:
1. Check the configuration for the management channel between the CP and UP.
2. Check the configuration for the control channel between the CP and UP.
3. Check the configuration for the protocol channel between the CP and UP.
Figure 13 shows the troubleshooting flowchart.
Figure 13 Flowchart for troubleshooting CUPS channel failures
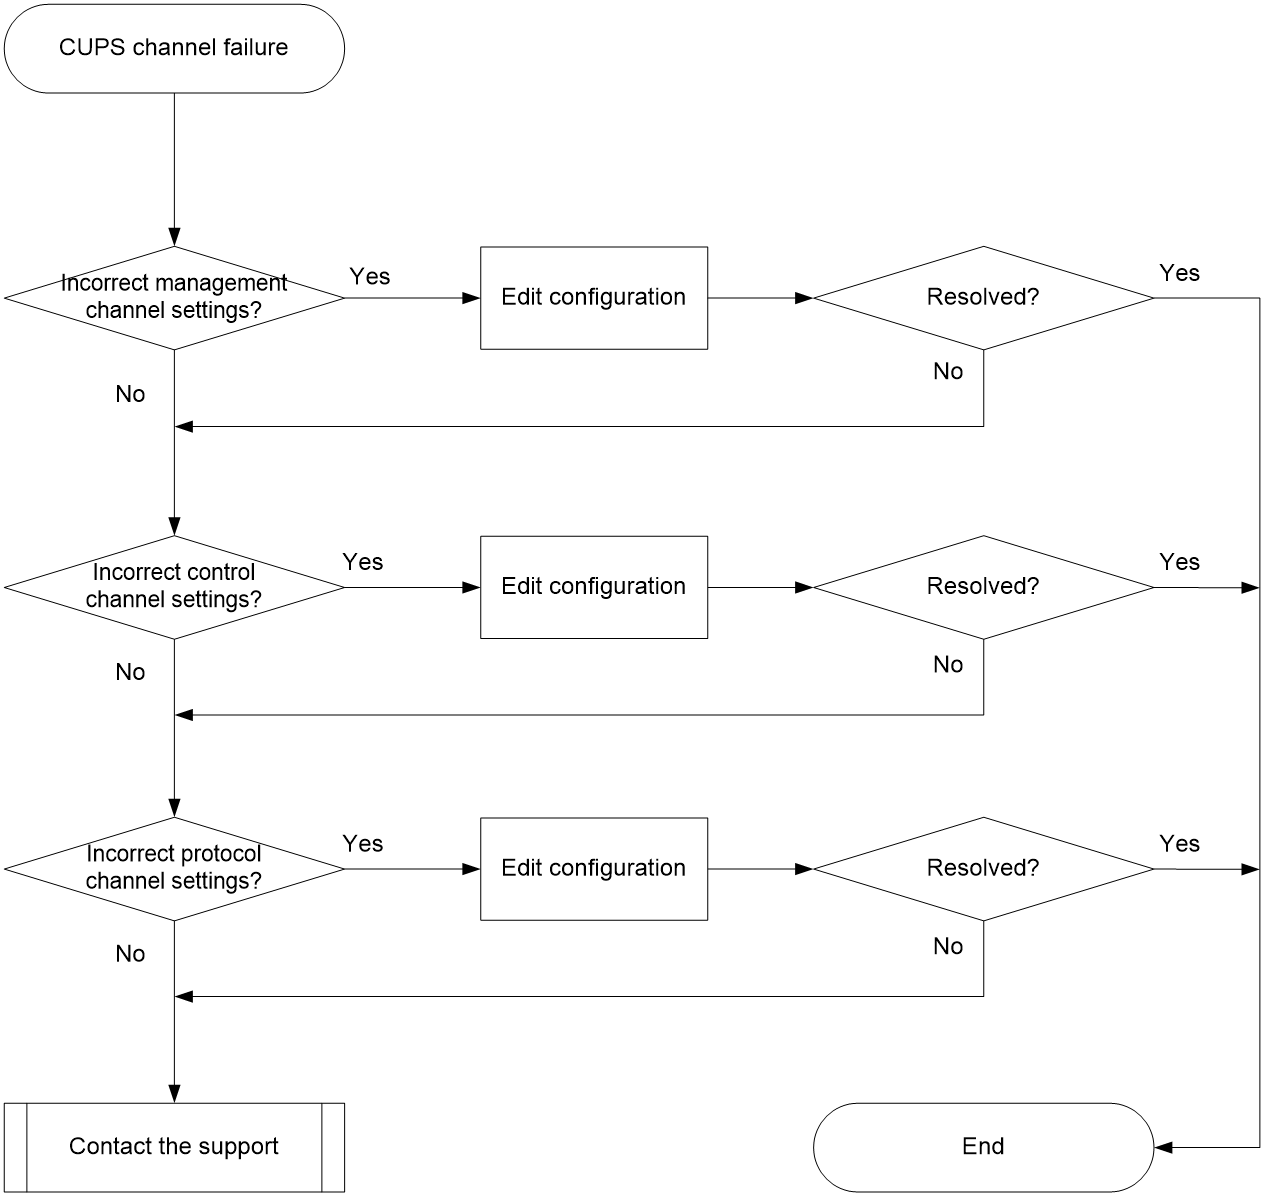
Solution
1. Check detailed management channel configuration on the CP and UP.
# Execute the display current-configuration configuration netconf-client command on the CP to check the CP-side management channel configuration.
netconf-client
source-address 2.2.2.2
connection 1024
user-name netconf password cipher $c$3$gwdAnb/zm8CEwMs5H9eQ89Hf4JFKXw==
destination-address 1.1.1.1
# Execute the display current-configuration configuration up-manage command on the CP to check the NETCONF connection profile bound to the UP.
bind netconf-connection 1024
# Execute the display current-configuration | begin ssh command on the UP to check the UP-side management channel configuration.
ssh server enable
ssh user netconf service-type netconf authentication-type password
local-user netconf class manage
password hash
bDm4CAp6rlXr9txtlp2w0URVUj8iKJ5a6MhLHmBMoHw==
service-type ssh
authorization-attribute user-role network-admin
authorization-attribute user-role network-operator
netconf ssh server enable
# Execute the cudetect cu tunnel-state up-id up-id command in any view on the CTRL-VM to obtain the value for the NETCONF Tunnel field.
¡ If the NETCONF Tunnel field displays NOK, troubleshoot the issue based on the displayed massage, as shown in the following table.
|
Message |
Possible causes |
Recommended action |
|
Please configure the source IP of the NETCONF connetion connetion-name to a interface on CP |
No IP address is configured on a CP-side interface. The connetion-name field displays the name of a NETCONF connection profile. |
Specify a loopback interface address as the source IP address used for setting up a NETCONF connection to a UP. |
|
Please check the route to destination IP on CP |
No route to the UP exists on the CP. |
Configure a static route or routing protocol on the CP. |
|
Please check the username and password on CP |
The username or password configured for setting up a NETCONF connection to a UP on the CP is invalid. |
Make sure the username and password configured for setting up a NETCONF connection to the UP match the local SSH user configuration on the UP. Local SSH users use the password authentication method on the UP. To configure the username and password configured for setting up a NETCONF connection to the UP, execute the user-name command in NETCONF client view on the CP. |
|
Please check the network configuration between CP and UP |
No IP address or route to the CP is configured on the UP, or the network between the CP and the UP has failed. |
1. Specify an IP address for the interface used for the NETCONF connection on the UP. Make sure the IP address is the same as that specified by using the destination-address command in NETCONF client view on the CP. 2. Execute the display ip routing-table command on the UP to verify that the source IP address used for setting up a NETCONF connection to the UP (specified by using the source-address command in NETCONF client view on the CP) is reachable. If the source IP address is unreachable, configure a static route or routing protocol on the UP. |
|
Please check the NETCONF SSH configuration between CP and UP |
Errors exist in the SSH configuration on the CP and the UP. |
Verify that the SSH configuration on the CP and UP is complete and correct. |
|
Others |
N/A |
¡ If the NETCONF Tunnel field displays NA, the NETCONF module is abnormal. To troubleshoot the issue, see "Management channel establishment failure."
¡ If the NETCONF Tunnel field displays OK, the management channel between the CP and UP operates correctly. Identify whether an error occurs on the other channels.
2. Check detailed control channel configuration on the CP and UP.
# Execute the display current-configuration configuration cusp-controller and display current-configuration configuration up-manage commands on the CP to check the control channel configuration on the CP and UP, respectively.
cusp controller
listening-ip 2.2.2.2
agent up1
agent-ip 1.1.1.1
up-manage id 1024
control-tunnel cusp-agent up1
up-config
cusp agent up1
local-address 1.1.1.1
controller address 2.2.2.2
# Execute the cudetect cu tunnel-state up-id up-id command in any view on the CTRL-VM to obtain the value for the CUSP Tunnel field.
¡ If the CUSP Tunnel field displays NOK, troubleshoot the issue based on the displayed massage, as shown in the following table.
|
Message |
Possible causes |
Recommended action |
|
Please configure the CUSP controller on CP |
The CUSP controller feature is not enabled on the CP. |
Execute the cusp controller command in system view on the CP to enable the CUSP controller feature. |
|
Please configure the listening IP on CP |
No listening IP address is specified for the CUSP controller on the CP. |
Execute the listening-ip command in CUSP controller view on the CP to specify a listening IP address for the CUSP controller. |
|
Please configure the listening IP to an interface on CP |
No listening IP address is specified for the CUSP controller on an interface on the CP. |
Specify an IP address for the CP-side interface on the CUSP control channel. Make sure the IP address is the same as the listening IP address for the CUSP controller specified by using the listening-ip command in CUSP controller view on the CP. |
|
Please configure the CUSP agent on CP |
No CUSP agent is added on the CP. |
Execute the agent command in agent view on the CP to create a CUSP agent. |
|
Please configure the CUSP agent IP on CP |
No CUSP agent to which a CUSP controller can connect is specified by its IP address on the CP. |
Execute the agent-ip command in agent view on the CP to specify an IP address for the CUSP agent to which a CUSP controller can connect. |
|
Please check the IP version of the listening IP and CUSP agent IP on CP |
The IP version of the listening IP address of the CUSP controller on the CP is different from the IP version of the CUSP agent IP on the CP. |
· Execute the listening-ip command in CUSP controller view on the CP to edit the listening IP address of the CUSP controller. · Execute the agent-ip command in agent view on the CP to edit the CUSP agent IP address. |
|
Please configure the VPN instance on CP |
No VPN instance to which a CUSP controller belongs is created on the CP. |
Specify an existing VPN instance when you execute the listening-ip command in CUSP controller view on the CP. |
|
Please check the listening IP on CP and the controller address on UP |
The listening IP of the CUSP controller on the CP is different from the CUSP controller IP on the UP. |
· Execute the listening-ip command in CUSP controller view on the CP to edit the listening IP address of the CUSP controller. · Execute the controller address command in CUSP agent view to edit the CUSP controller IP address. |
|
Please check the agent IP on CP and the local address on UP |
The CUSP agent IP configured on the CP is different from the local IP address of the CUSP agent on the UP. |
· Execute the agent-ip command in agent view on the CP to edit the CUSP agent IP address. · Execute the local-address command in CUSP agent view to edit the local IP address of the CUSP agent. |
|
Please configure the CUSP agent on UP |
No CUSP agent is configured on the UP. |
Execute the cusp agent command in UP-config view on the CP to create a CUSP agent. |
|
Please configure the local address on UP |
No local IP address is specified for a CUSP agent on the UP. |
Execute the local-address command in CUSP agent view on the CP to specify a local IP address for a CUSP agent. |
|
Please configure the controller address on UP |
No CUPS controller IP address is specified for the CUSP agent on the UP. |
Execute the controller address command in CUSP agent view on the CP to specify a CUSP controller IP address for the CUSP agent. |
|
Please check the IP version of the local address and controller address on UP |
The IP version of the CUSP controller IP is different from the IP version of the local IP address of the CUSP agent on the CP. |
Execute the undo local-address or undo controller address command in CUSP agent view on the CP to delete the incorrect IP address configuration and reconfigure it. |
|
Cannot check the UP configuration because of the disconnection of the CU NETCONF tunnel |
The management channel between the CP and the UP is abnormal, so the CP cannot check the CUSP configuration on the UP. |
Return to step 1 to check detailed management channel configuration on the CP and UP. |
¡ If the CUSP Tunnel field displays NA, the error occurring on the channel is unknown. To troubleshoot the issue, see "Control channel establishment failure."
¡ If the CUSP Tunnel field displays OK, the control channel between the CP and UP operates correctly. Identify whether an error occurs on the other channels.
3. Check detailed protocol channel configuration on the CP and UP.
# Execute the display current-configuration | begin up-manage command on the CP to check the protocol channel configuration on the CP and UP.
up-manage id 1024
protocol-tunnel vxlan 10 source 2.2.2.2 destination 1.1.1.1
cu-agent
protocol-tunnel vxlan 10 source 1.1.1.1 destination 2.2.2.2
# Execute the cudetect cu tunnel-state up-id up-id command on the CTRL-VM to obtain the value for the Protocol Tunnel field.
¡ If the Protocol Tunnel field displays NOK, troubleshoot the issue based on the displayed massage, as shown in the following table.
|
Message |
Possible causes |
Recommended action |
|
Please configure the protocol tunnel on CP |
No protocol channel parameters are configured on the CP. |
Execute the protocol-tunnel command in UP-manage view on the CP to configure the parameters for the protocol channel between the CP and UP. |
|
Please check the listening IP of the CUSP controller and the source IP of the protocol tunnel on CP |
The protocol channel source IP and the CUSP controller listening IP are different on the CP. |
Execute the protocol-tunnel command in UP-manage view on the CP to edit the protocol channel source IP address. Make sure the protocol channel source IP address is the same as the CUSP controller listening IP address specified by using the listening-ip command. |
|
Please check the agent IP of the CUSP controller and the destination IP of the protocol tunnel on CP |
The protocol channel destination IP and the CUSP controller agent IP are different on the CP. |
Execute the protocol-tunnel command in UP-manage view on the CP to edit the protocol channel destination IP address. Make sure the protocol channel destination IP address is the same as the CUSP controller agent IP address specified by using the agent-ip command. |
|
Please check the source IP of the protocol tunnel on CP and the destination IP of the protocol tunnel on UP |
The protocol channel source IP on the CP is different from the protocol channel destination IP on the UP. |
· Execute the protocol-tunnel command in UP-manage view on the CP to edit the protocol channel source IP address on the CP. · Execute the protocol-tunnel command in CU agent view to edit the protocol channel destination IP address on the UP. |
|
Please check the destination IP of the protocol tunnel on CP and the source IP of the protocol tunnel on UP |
The protocol channel destination IP on the CP is different from the protocol channel source IP on the UP. |
· Execute the protocol-tunnel command in UP-manage view on the CP to edit the protocol channel destination IP address on the CP. · Execute the protocol-tunnel command in CU agent view to edit the protocol channel source IP address on the UP. |
|
Please configure the protocol tunnel on UP |
No protocol channel parameters are configured on the UP. |
Execute the protocol-tunnel command in CU agent view on the CP to configure the parameters for the protocol channel between the CP and UP. |
|
Please check the local address of the CUSP agent and the source IP of the protocol tunnel on UP |
The protocol channel source IP and the local IP address of the CUSP agent are different on the UP. |
Execute the protocol-tunnel command in CU agent view on the CP to edit the protocol channel source IP address on the UP. Make sure the protocol channel source IP address is the same as the local IP address of the CUSP agent specified by using the local-address command. |
|
Please check the controller address of the CUSP agent and the destination IP of the protocol tunnel on UP |
The protocol channel destination IP and the controller IP of the CUSP agent are different on the UP. |
Execute the protocol-tunnel command in CU agent view on the CP to edit the protocol channel destination IP address on the UP. Make sure the protocol channel destination IP address is the same as the controller IP address of the CUSP agent specified by using the controller address command. |
|
Please check the VXLAN ID of the protocol tunnel between CP and UP |
The VXLAN tunnel ID of the protocol channel is different on the CP and the UP. |
· Execute the protocol-tunnel command in UP-manage view on the CP to edit the VXLAN tunnel ID on the CP. · Execute the protocol-tunnel command in CU agent view to edit the VXLAN tunnel ID on the UP. |
|
Please check the abnormal state of the CUSP tunnel between CP and UP |
The state of the control channel between the CP and the UP is abnormal. |
Return to step 2 to check detailed control channel configuration on the CP and UP. |
|
Cannot check the configuration of the protocol tunnel on UP because of the disconnection of the CU NETCONF tunnel |
The management channel between the CP and the UP is abnormal, so the CP cannot check the protocol channel configuration on the UP. |
Return to step 1 to check detailed management channel configuration on the CP and UP. |
¡ If the Protocol Tunnel field displays NA, the VXLAN module is abnormal and the troubleshooting tool cannot detect the reason. To troubleshoot the issue, see "Protocol channel establishment failure."
¡ If the Protocol Tunnel field displays OK, the protocol channel between the CP and UP operates correctly.
4. If the issue persists, collect the following information and contact Technical Support:
¡ Results of each step.
¡ The configuration file, log messages, and alarm messages.
Related alarm and log messages
Alarm messages
None.
Log messages
None.
Management channel establishment failure
Symptom
No management channel is established between the CP and specified UP. When you execute the display netconfc session command on the CP, no NETCONF session information about the specified UP is displayed.
Common causes
The following are the common causes of this type of issue:
· Physical link failure, which causes route failure for the CP and UP.
· Management channel configuration errors on the CP or UP.
Troubleshooting flow
Figure 14 shows the troubleshooting flowchart.
Figure 14 Flowchart for troubleshooting management channel establishment failures

Solution
1. Verify if an error occurs on the physical link.
a. On the CP, ping the IP address of the interface on the UP, which is directly connected to the CP.
If the ping fails, execute the display ip routing-table or display route-static routing-table command on the CP to obtain the output interface of the route to the UP. Then, execute the display interface command to check the output interface state.
<CTRL-VM> display interface ten-gigabitethernet 1/5/0
Ten-GigabitEthernet1/5/0
Interface index: 386
Current state: Administratively DOWN
Line protocol state: DOWN
...
b. If the Current state field displays Administratively DOWN, execute the undo shutdown command on the interface to bring up the interface. If the Current state field displays DOWN, check the physical connection of the interface.
c. Repeat the above steps on the UP to check and repair the output interface of the route to the CP.
d. If other devices exist between the CP and UP, repeat steps a and b on each hop to check and repair the physical interfaces connecting to other devices.
e. If the physical link between the CP and specified UP is correct but the issue persists, go to the next step.
2. Execute the display current-configuration configuration netconf-client command on the CP to check the CP-side management channel configuration.
<CTRL-VM> display current-configuration configuration netconf-client
#
netconf-client
source-address 2.2.2.2
connection 1024
user-name netconf password cipher $c$3$J29ZV3fWskY85w0NwEO1p/LAWauPdx6Kw4xiLOn
W2dPMGEs=
destination-address 1.1.1.1
connection 1025
user-name netconf password cipher $c$3$YhPZ2Xk+MH9BNcxshQ0w8fewibpnQw2ojT1xkP2
hax3HDaE=
destination-address 3.3.3.3
#
Execute the cudetect cu tunnel-state up-id up-id command on the CTRL-VM. If the NETCONF Tunnel field displays NOK or NA, check the detailed management channel configuration on the CP and UP as described in "CUPS channel failure." If the NETCONF Tunnel field displays OK but the issue persists, go to the next step.
3. Execute the display current-configuration | begin ssh command on the UP to check the UP-side management channel configuration.
<UP1024> display current-configuration | begin ssh
ssh server enable
ssh user netconf service-type netconf authentication-type password
...
local-user netconf class manage
password hash $h$6$nJfK2tYuvrbih32X$+reBw1rUDg9R3z1rJ2+cs09hYIVQT7IzzxdnZe2/Nsg
liHTsJI+qDT/dbRqLQpP+it44esvq9xRfcujMdRB9Bw==
service-type ssh
authorization-attribute user-role network-admin
authorization-attribute user-role network-operator
#
netconf ssh server enable
#
return
¡ Make sure you have enabled the Stelnet server on the UP by executing the ssh server enable command.
¡ Make sure you have enabled NETCONF over SSH on the UP by executing the netconf ssh server enable command.
4. If the issue persists, collect the following information and contact Technical Support:
¡ Results of each step.
¡ The configuration file, log messages, and alarm messages.
Related alarm and log messages
Alarm messages
Module: HH3C-NCM-MIB
· hh3cNcmCUConnectFailed (1.3.6.1.4.1.25506.2.201.3.0.3)
Log messages
· NCM/2/NCM_CREATE_CHANNEL_FAILED
Packet forwarding failure for the management channel
Symptom
The management channel between the CP and UP fails to forward management packets correctly. As a result, user service traffic is discarded.
Common causes
The common cause of this type of issue is physical link failure, which causes route failure for the CP and UP.
Troubleshooting flow
Figure 15 shows the troubleshooting flowchart.
Figure 15 Flowchart for troubleshooting packet forwarding failures for the management channel
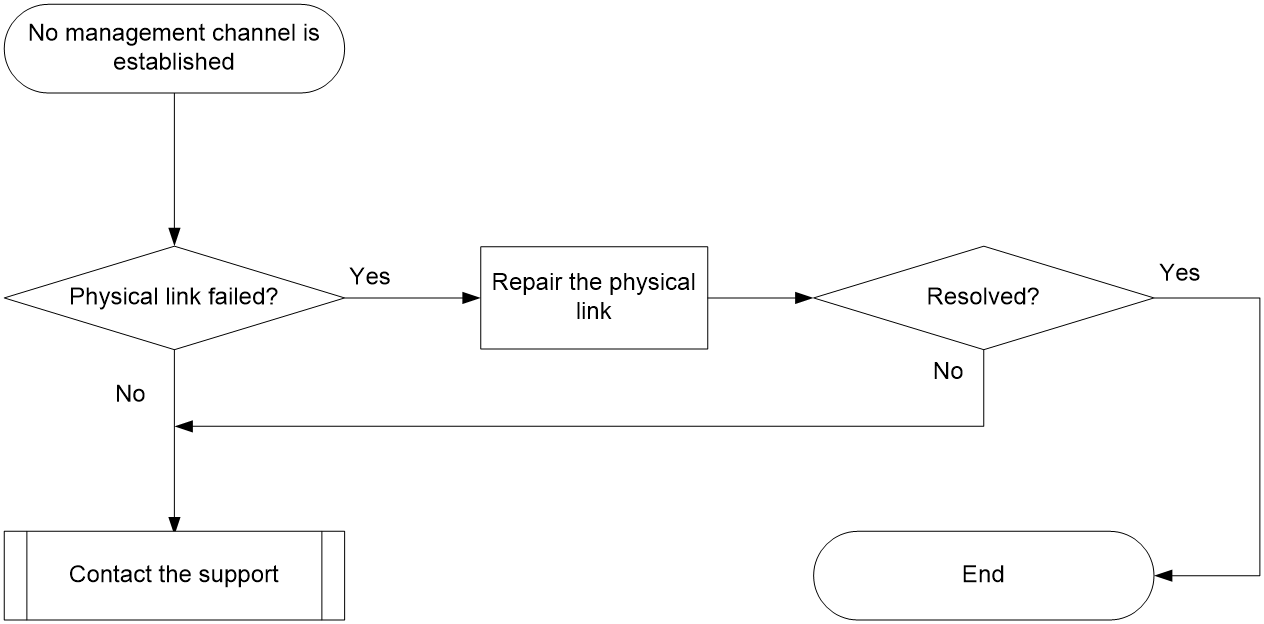
Solution
1. Verify if an error occurs on the physical link.
a. On the CP, ping the IP address of the interface on the UP, which is directly connected to the CP.
If the ping fails, execute the display ip routing-table or display route-static routing-table command on the CP to obtain the output interface of the route to the UP. Then, execute the display interface command to check the output interface state.
<CTRL-VM> display interface ten-gigabitethernet 1/5/0
Ten-GigabitEthernet1/5/0
Interface index: 386
Current state: Administratively DOWN
Line protocol state: DOWN
...
b. If the Current state field displays Administratively DOWN, execute the undo shutdown command on the interface to bring up the interface. If the Current state field displays DOWN, check the physical connection of the interface.
c. Repeat the above steps on the UP to check and repair the output interface of the route to the CP.
d. If other devices exist between the CP and UP, repeat steps a and b on each hop to check and repair the physical interfaces connecting to other devices.
2. If the issue persists, collect the following information and contact Technical Support:
¡ Results of each step.
¡ The configuration file, log messages, and alarm messages.
Related alarm and log messages
Alarm messages
Module: HH3C-NCM-MIB
· hh3cNcmCUConnDisconnected (1.3.6.1.4.1.25506.2.201.3.0.1)
Log messages
· NCM/1/NCM_SESSION_DISCONNECTED
Control channel establishment failure
Symptom
No control channel is established between the CP and UP. When you execute the display cusp controller command on the CP, no fields about the CUSP agent is displayed, such as the Agent name, UP ID, and Control tunnel state fields.
Common causes
The following are the common causes of this type of issue:
· Physical link failure, which causes route failure for the CP and UP.
· Control channel configuration errors on the CP or UP.
Troubleshooting flow
Figure 16 shows the troubleshooting flowchart.
Figure 16 Flowchart for troubleshooting control channel establishment failures

Solution
1. Verify if an error occurs on the physical link.
a. On the CP, ping the IP address of the interface on the UP, which is directly connected to the CP.
If the ping fails, execute the display ip routing-table or display route-static routing-table command on the CP to obtain the output interface of the route to the UP. Then, execute the display interface command to check the output interface state.
<CTRL-VM> display interface ten-gigabitethernet 1/5/0
Ten-GigabitEthernet1/5/0
Interface index: 386
Current state: Administratively DOWN
Line protocol state: DOWN
...
b. If the Current state field displays Administratively DOWN, execute the undo shutdown command on the interface to bring up the interface. If the Current state field displays DOWN, check the physical connection of the interface.
c. Repeat the above steps on the UP to check and repair the output interface of the route to the CP.
d. If other devices exist between the CP and UP, repeat steps a and b on each hop to check and repair the physical interfaces connecting to other devices.
e. If the physical link between the CP and specified UP is correct but the issue persists, go to the next step.
2. Check the CP-side control channel configuration.
Execute the display current-configuration | begin cusp command on the CP to verify if you have executed the listening-ip and agent-ip commands.
<CTRL-VM> display current-configuration | begin cusp
cusp controller
listening-ip 2.2.2.2
agent up1024
agent-ip 1.1.1.1
agent up1025
agent-ip 3.3.3.3
...
Execute the cudetect cu tunnel-state up-id up-id command on the CTRL-VM. If the CUSP Tunnel field displays NOK or NA, check the detailed control channel configuration on the CP and UP as described in "CUPS channel failure." If the CUSP Tunnel field displays OK but the issue persists, go to the next step.
3. Execute the display current-configuration | begin cusp command on the UP to check the UP-side control channel configuration.
<UP1024> display current-configuration | begin cusp
cusp agent up1024
local-address 1.1.1.1
controller address 2.2.2.2
...
¡ Make sure the IP address specified by using the local-address command in CUSP agent view on the UP is the same as that specified by using the agent-ip command in agent view on the CP.
¡ Make sure the IP address specified by using the controller address command in CUSP agent view on the UP is the same as that specified by using the listening-ip command in CUSP controller view on the CP.
4. If the issue persists, collect the following information and contact Technical Support:
¡ Results of each step.
¡ The configuration file, log messages, and alarm messages.
Related alarm and log messages
Alarm messages
Module: HH3C-CUSP-MIB
· hh3cCuspServerDisconnect (1.3.6.1.4.1.25506.2.190.1.2.0.1)
· hh3cCuspClientDisconnect (1.3.6.1.4.1.25506.2.190.1.2.0.3)
Log messages
· CUSP/5/CUSP_CP_DISCONNECT
Packet forwarding failure for the control channel
Symptom
The control channel between the CP and UP failed to forward control packets correctly, causing user service traffic to be dropped.
Common causes
The common cause of this type of issue is that a physical link failure causes route unreachability between CP and UP devices.
Troubleshooting flow
Figure 17 shows the troubleshooting flowchart.
Figure 17 Flowchart for troubleshooting packet forwarding failure for the control channel
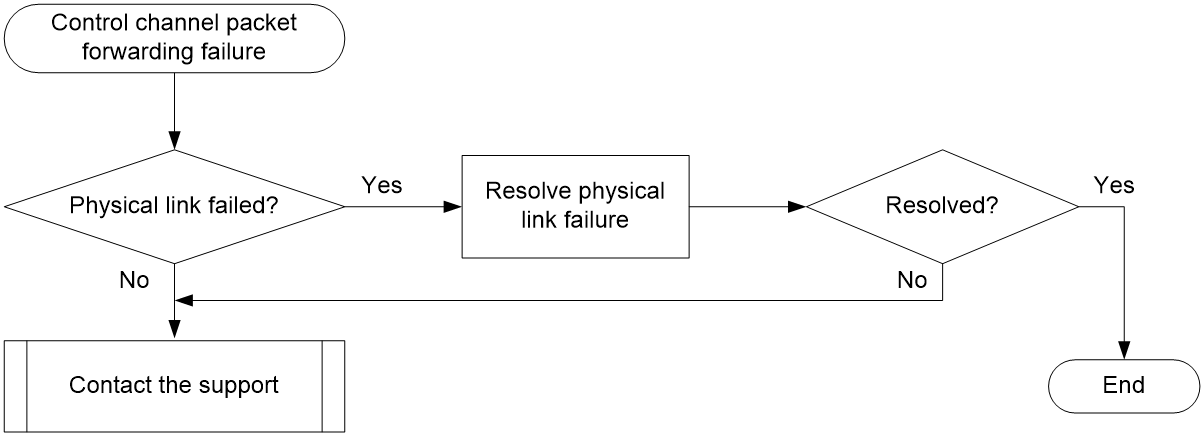
Solution
1. Check the physical link.
On the CP, ping the IP address of the interface that directly connects the UP to the CP.
If the address cannot be pinged, execute the display ip routing-table or display route-static routing-table command to identify the outgoing interface of the route to the UP. Then, execute the display interface command to view the status of the outgoing interface.
<CTRL-VM> display interface ten-gigabitethernet 1/5/0
Ten-GigabitEthernet1/5/0
Interface index: 386
Current state: Administratively DOWN
Line protocol state: DOWN
...
¡ If the current state of the interface is Administratively DOWN, execute the undo shutdown command to bring up the interface. If the current state of the interface is DOWN, verify that the physical link of the interface is normal.
¡ Repeat the previous steps on the UP to check and repair the outgoing interface of the route to the CP.
¡ If other devices exist between the CP and UP, use the previous steps to check and repair the status of the connecting interfaces hop by hop.
2. If the issue persists, collect the following information and contact Technical Support:
¡ Results of each step.
¡ The configuration file, log messages, and alarm messages.
Related alarm and log messages
Alarm messages
Module name: HH3C-CUSP-MIB
· hh3cCuspServerDisconnect (1.3.6.1.4.1.25506.2.190.1.2.0.1)
· hh3cCuspClientDisconnect (1.3.6.1.4.1.25506.2.190.1.2.0.3)
Log messages
· CUSP/5/CUSP_CP_DISCONNECT
· CUSP/5/CUSP_UP_DISCONNECT
Protocol channel establishment failure
Symptom
On the CP and UP, execute the display protocol-tunnel verbose command. The outputs show that the VXLAN channel between the CP and UP is not established successfully (the value of the Active field is No).
Common causes
The following are the common causes of this type of issue:
· The VXLAN related settings for the protocol channel are incorrect.
· The CUSP channel between the CP and the specified UP fails.
· Physical link failure.
Troubleshooting flow
Figure 18 shows the troubleshooting flowchart.
Figure 18 Flowchart for troubleshooting protocol channel establishment failure

Solution
1. Check the physical link.
On the CP, execute the display ip routing-table or display route-static routing-table command to identify the outgoing interface of the route to the UP. Then, execute the display interface command to view the status of the outgoing interface.
<Sysname> display interface ten-gigabitethernet 1/5/0
Ten-GigabitEthernet1/5/0
Interface index: 386
Current state: Administratively DOWN
Line protocol state: DOWN
...
¡ If the current state of the interface is Administratively DOWN, execute the undo shutdown command to bring up the interface. If the current state of the interface is DOWN, verify that the physical link of the interface is normal.
¡ Repeat the previous steps on the UP to check and repair the outgoing interface of the route to the CP.
¡ If other devices exist between the CP and UP, use the previous steps to check and repair the status of the connecting interfaces hop by hop.
¡ If the physical link between the CP and UP is normal and the issue persists, perform the following operations.
2. Check the VXLAN related settings for the protocol channel.
On the CP, execute the display current-configuration configuration up-manage command to view the detailed configuration for the protocol channel between the CP and UP.
<Sysname> display current-configuration configuration up-manage
up-manage id 1024
protocol-tunnel vxlan 10 source 2.2.2.2 destination 1.1.1.1
cu-agent
protocol-tunnel vxlan 10 source 1.1.1.1 destination 2.2.2.2
On the CTRL-VM, execute the cudetect cu tunnel-state up-id up-id command. If the Protocol Tunnel field displays NOK or NA, check and repair the UP-CP protocol channel as described in the step for checking the protocol channel configuration in “CUPS channel failure.”
If the physical link between the CP and UP is normal and the issue persists, proceed to the following step.
3. Check the CUSP channel between the CP and the specified UP.
On the CP, execute the display cusp controller command.
¡ If no CUSP agent information (including agent name, UP ID, and control tunnel state) is displayed for the specified UP, it indicates that no CUSP channel is established. In this case, troubleshoot the issue as described in “Control channel establishment failure.”
¡ If the Connection state field displays Established, it indicates that the CUSP channel has been established successfully. Proceed to the next step.
4. If the issue persists, collect the following information and contact Technical Support:
¡ Results of each step.
¡ The configuration file, log messages, and alarm messages.
Related alarm and log messages
Alarm messages
N/A
Log messages
N/A
Packet forwarding failure for the protocol channel
Symptom
The protocol channel between the CP and UP failed to forward VXLAN packets correctly, causing user service traffic to be dropped.
Common causes
The following are the common causes of this type of issue:
· The VXLAN related settings for the protocol channel are incorrect.
· User access interfaces on the UP are not managed on the CP.
· The UP failed to send packets to UP for processing.
· The physical link between the CP and UP fails.
Troubleshooting flow
Figure 19 shows the troubleshooting flowchart.
Figure 19 Flowchart for troubleshooting packet forwarding failure for the protocol channel
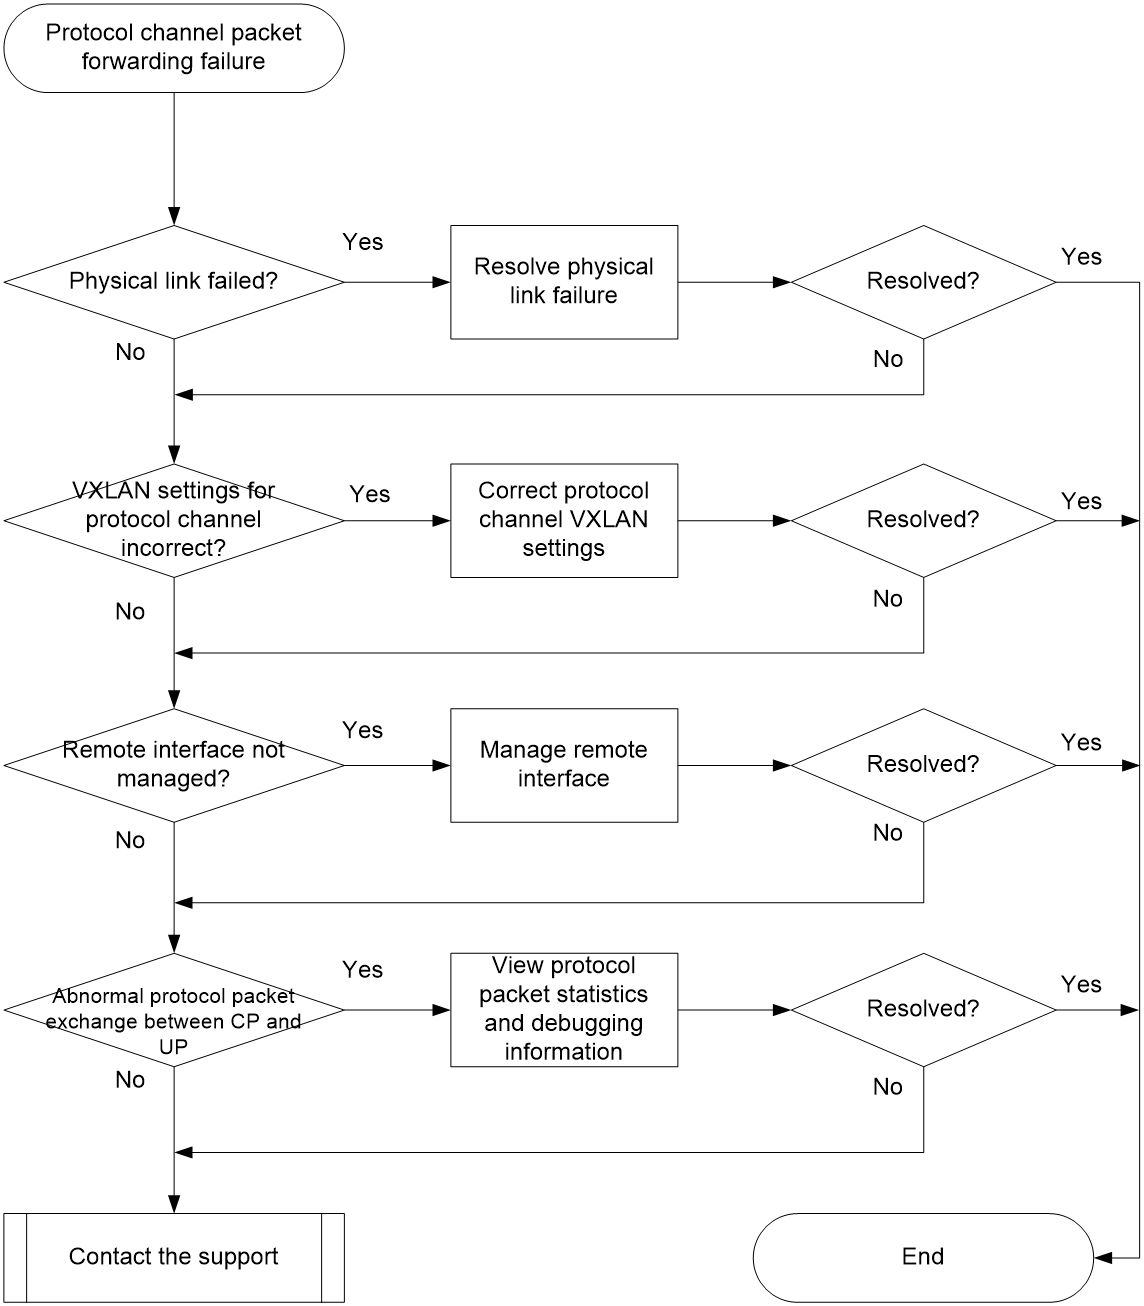
Solution
1. Check the physical link.
On the CP, execute the display ip routing-table or display route-static routing-table command to identify the outgoing interface of the route to the UP. Then, execute the display interface command to view the status of the outgoing interface.
<Sysname> display interface ten-gigabitethernet 1/5/0
Ten-GigabitEthernet1/5/0
Interface index: 386
Current state: Administratively DOWN
Line protocol state: DOWN
...
¡ If the current state of the interface is Administratively DOWN, execute the undo shutdown command to bring up the interface. If the current state of the interface is DOWN, verify that the physical link of the interface is normal.
¡ Repeat the previous steps on the UP to check and repair the outgoing interface of the route to the CP.
¡ If other devices exist between the CP and UP, use the previous steps to check and repair the status of the connecting interfaces hop by hop.
¡ If the physical link between the CP and UP is normal and the issue persists, perform the following operations:
2. Check the VXLAN related settings for the protocol channel.
On the CP, execute the display current-configuration configuration up-manage command to view the detailed configuration for the protocol channel between the CP and UP.
<Sysname> display current-configuration configuration up-manage
up-manage id 1024
protocol-tunnel vxlan 10 source 2.2.2.2 destination 1.1.1.1
cu-agent
protocol-tunnel vxlan 10 source 1.1.1.1 destination 2.2.2.2
¡ On CTRL-VM, execute the cudetect cu tunnel-state up-id up-id command. If the Protocol Tunnel field displays NOK or NA, check and repair the UP-CP protocol channel as described in the step for checking the protocol channel configuration in “CUPS channel failure.”
¡ If the physical link between the CP and UP is normal and the issue persists, proceed to the following step:
3. Verify that the remote interface has been managed by the CP.
On UP, execute the display this command on the interface where users come online to check the cp-management configuration of the interface.
¡ If the configuration exists, it indicates that the interface has been managed remotely by the CP, and BRAS settings are issued normally.
¡ If the configuration does not exist, it indicates that the interface is not managed remotely by the CP. In this case, troubleshoot the management channel and control channel issues as described in "Management channel establishment failure" and "Control channel establishment failure."
¡ If the remote interface has been managed but the issue persists, proceed to the following step:
4. Check the protocol packet exchange between the CP and UP.
Perform repeated dial-up operations on the user end. Meanwhile, execute the display protocol-tunnel packet statistics command on the CP repeatedly at regular intervals (30 seconds as a best practice). View the packet statistics for the protocol channel and record the value of the Input packet statistics field each time displayed.
¡ If the value increases time by time, it indicates that the VXLAN protocol channel is normal.
¡ If the value does not increase, it indicates that the CP cannot receive protocol packets from the UP. Execute the display protocol-tunnel packet statistics command on the CP repeatedly at regular intervals (30 seconds as a best practice). Record the value of the Output packet statistics field each time.
<Sysname> display protocol-tunnel packet statistics
Input packet statistics:
Total: 7283
PPPoE PADI and PADO: 3
Other PPPoE: 0
DHCP DISCOVER and OFFER: 129
Other DHCP: 181
DHCPv6: 0
ND: 6970
L2TP: 0
ARP: 0
IPv4 data miss: 0
IPv6 data miss: 0
Ethernet: 0
IPv4: 0
IPv6: 0
Drop: 0
Output packet statistics:
Total: 1121
PPPoE PADI and PADO: 6
Other PPPoE: 0
DHCP DISCOVER and OFFER: 284
Other DHCP: 393
DHCPv6: 0
ND: 0
L2TP: 0
ARP: 0
IPv4 data miss: 417
IPv6 data miss: 21
Ethernet: 0
IPv4: 0
IPv6: 0
Drop: 0
If the value does not increase, execute the debugging ucm forward all command to enable UCM debugging. Collect the debugging information and proceed to the next step.
5. If the issue persists, collect the following information and contact Technical Support:
¡ Results of each step.
¡ The configuration file, log messages, and alarm messages.
Related alarm and log messages
Alarm messages
N/A
Log messages
N/A
Elastic scaling issues
VM manual scaling failure
Symptom
Failed to perform manual scaling with the VNFM-vBRAS.
Common causes
The following are the common causes of this type of issue:
· When manual scaling in is performed, a BRAS-VM has been associated with a UP.
· The link between vBRAS and VNFM-vBRAS fails.
· The configuration for the connection between vBRAS and VNFM-vBRAS is incorrect.
· The hardware resources on the server that holds the VMs are insufficient.
Troubleshooting flow
Figure 20 shows the troubleshooting flowchart.
Figure 20 Flowchart for troubleshooting VM manual scaling failure

Solution
1. Verify that the BRAS-VM is not associated with a UP.
For manual scaling out, go to step 2 regardless of whether the BRAS-VM has been associated with a UP.
For manual scaling in, execute the display bras-vm-up associated-info command on the CP to display the BRAS-VM and UP association information.
<Sysname> display bras-vm-up associated-info
Slot UP ID
129, 130 1024
¡ If the BRAS-VM is associated with a UP, execute the up-migrate to bras-vm command on the CP to migrate the UP to another BRAS-VM.
¡ If the BRAS-VM is not associated with a UP, go to step 2.
2. Check the link between vBRAS and VNFM-vBRAS.
If the CP outputs the following log information, it indicates that the link between vBRAS and VNFM-vBRAS has failed.
VMMGR/4/VMMGR_CREATE_FAIL: Failed to manually create VM 99 in group 67. Reason: Failed to connect to the vBRASSO server.
VMMGR/4/VMMGR_DELETE_FAIL: Failed to delete the manually created VM on slot 99 in group 67. Reason: Connection with the vBRASSO server timed out.
Execute the ping command on the CTRL-VM to test the connectivity to the IP address of the VNFM-VBRAS.
¡ If the VNFM-VBRAS IP cannot be pinged, examine all the links on the packet forwarding path and resolve the route issue.
¡ If the VNFM-VBRAS IP can be pinged, go to step 3.
3. Verify that the configuration for the connection between vBRAS and VNFM-vBRAS is correct.
The following conditions indicate that configuration errors exist for the connection between vBRAS and VNFM-vBRAS:
¡ The following log information is output on the CP:
VMMGR/4/VMMGR_CREATE_FAIL: Failed to manually create VM 99 in group 67. Reason: Failed to connect to the vBRASSO server.
VMMGR/4/VMMGR_DELETE_FAIL: Failed to delete the manually created VM on slot 99 in group 67. Reason: Connection with the vBRASSO server timed out.
¡ Execute the display vbras-cp stable state vnfm command on the CP. The command output shows that the communication status with VNFM is Not configured or Disconnected.
<Sysname> display vbras-cp stable state vnfm
------------------------------VNFM state------------------------------
VNFM communication state: Connected
Execute the display current-configuration command on the CP to display the VNFM-vBRAS configuration. Make sure the configuration in the vnfm address command is consistent with the actually used IP address, port number, username, and password for login to the VNFM-vBRAS and the actual mode (HTTP or HTTPS) for communication with the VNFM-vBRAS.
<Sysname> display current-configuration | include vnfm
vnfm address 192.168.73.33 user test password simple 123456789 http-method port 30000
¡ If the VNFM-vBRAS configuration is incorrect, execute the vnfm address command to edit the configuration.
¡ If the VNFM-vBRAS configuration is correct, go to step 4.
4. Verify that VMs have been deployed correctly.
The following log information output on the CP indicates VM deployment failures.
VMMGR/4/VMMGR_CREATE_FAIL: Failed to manually create VM 99 in group 67. Reason: The vBRASSO server failed to create the VM.
VMMGR/4/VMMGR_DELETE_FAIL: Failed to delete the manually created VM on slot 99 in group 67. Reason: The vBRASSO server failed to delete the VM.
¡ If a VM deployment failure exists, troubleshoot the issue as described in “VM deployment failure.”
¡ If VM deployment is correct, go to step 5.
5. If the issue persists, collect the following information and contact Technical Support:
¡ Results of each step.
¡ The configuration file, log messages, and alarm messages.
Related alarm and log messages
Alarm messages
Module name: HH3C-VNF-DEVICE-MIB
· hh3cVmCreateFail (1.3.6.1.4.1.25506.2.196.3.0.4)
· hh3cVmDeleteFail (1.3.6.1.4.1.25506.2.196.3.0.6)
Log messages
· VMMGR/4/VMMGR_CREATE_FAIL
· VMMGR/4/VMMGR_DELETE_FAIL
VM auto scaling failure
Symptom
Failed to perform auto scaling for VMs.
Common causes
The following are the common causes of this type of issue:
· Auto scaling for BRAS-VMs is not enabled.
· After the delay timer for auto scaling expires, UP migration conditions are not met.
· The link between vBRAS and VNFM-vBRAS fails.
· The configuration for the connection between vBRAS and VNFM-vBRAS is incorrect.
· The hardware resources on the server that holds the VMs are not enough.
Troubleshooting flow
Figure 21 shows the troubleshooting flowchart.
Figure 21 Flowchart for troubleshooting VM auto scaling failure
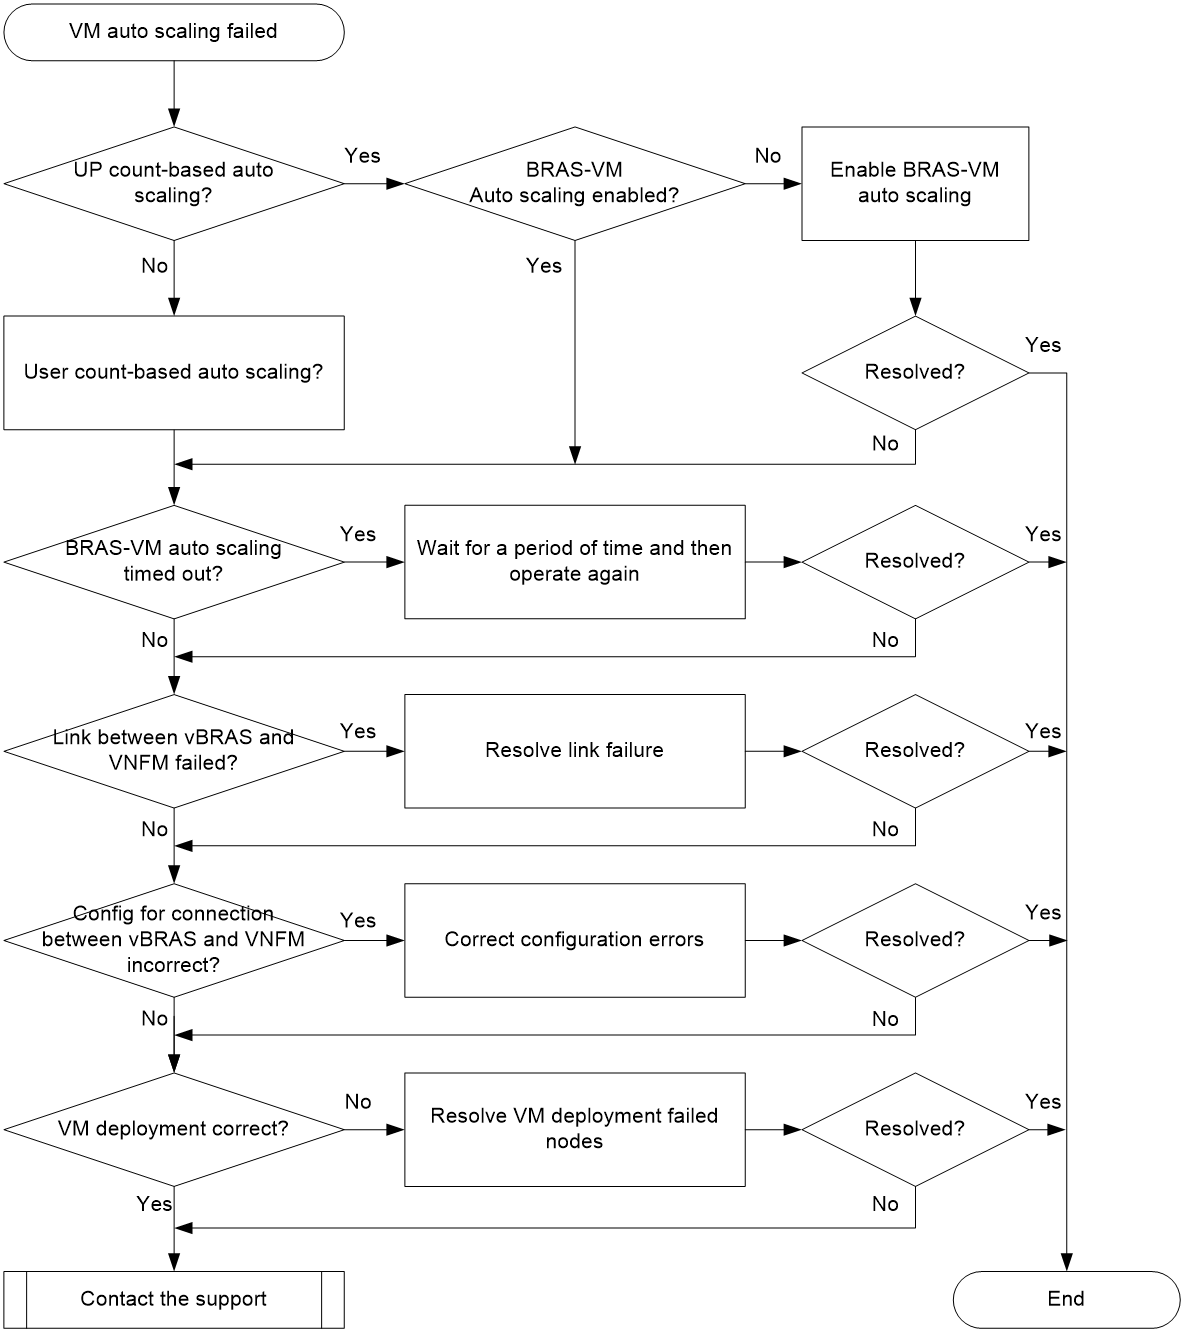
Solution
1. Identify whether the auto scaling is caused by UP count changes.
On the CP, execute the display bras-scale capacity command to display scaling capabilities for the current BRAS-VM.
<Sysname> display bras-scale capacity slot 129
Slot: 129, 130
Current UP count: 16
UP count threshold: 64
Current user count: 1000
Max user count: 2000000
User count lower threshold: 200000
User count alert threshold: 1600000
User count upper threshold: 1800000
Current delay time: 300s(will expand to 600s after 2 retry)
¡ If the Current UP count (number of UPs associated with the BRAS-VM) is greater than or equal to the UP count threshold (UP-count threshold for triggering auto scaling) or the Current UP count is 0, it indicates the auto scaling is caused by a CP count change. In this case, go to step 2.
¡ If the Current UP count is smaller than the UP count threshold and is not 0, it indicates the auto scaling is caused by a user count change. In this case, go to step 3.
2. Verify that BRAS-VM auto scaling is enabled.
On the CP, execute the display current-configuration command to display the enabling status of auto scaling for BRAS-VM.
<Sysname> display current-configuration | include bras-scale
bras-scale enable
¡ If BRAS-VM auto scaling is not enabled, enable it by using the bras-scale enable command in system view.
¡ If BRAS-VM auto scaling is enabled, go to step 3.
3. Identify whether BRAS-VM auto scaling has timed out.
The following log information on the CP indicates the BRAS-VM auto scaling timeout is reached.
VMMGR/4/VMMGR_CREATE_FAIL_FINAL: Failed to automatically create VM 99 in group 67 after the maximum number of retries reached.
VMMGR/4/VMMGR_DELETE_FAIL_FINAL: Failed to delete the automatically created VM on slot 99 in group 67 after the maximum number of retries reached.
On the CP, execute the display bras-scale capacity command to display the current delay time of auto scaling.
<Sysname> display bras-scale capacity slot 129
Slot: 129, 130
Current UP count: 16
UP count threshold: 64
Current user count: 1000
Max user count: 2000000
User count lower threshold: 200000
User count alert threshold: 1600000
User count upper threshold: 1800000
Current delay time: 300s(will expand to 600s after 2 retry)
¡ If the Current delay time is greater than the delay timer set by the bras-scale delay-time command, it indicates the auto scaling timeout is reached. Wait for the time indicated by Current delay time and then perform user online and offline operations.
¡ If the Current delay time is the same as the delay timer set by the bras-scale delay-time command same, it indicates the auto scaling timeout is not reached. Go to step 4.
4. Check the link between vBRAS and VNFM-vBRAS.
If the CP outputs the following log information, it indicates that the link between vBRAS and VNFM-vBRAS has failed.
VMMGR/4/VMMGR_CREATE_FAIL: Failed to manually create VM 99 in group 67. Reason: Failed to connect to the vBRASSO server.
VMMGR/4/VMMGR_DELETE_FAIL: Failed to delete the manually created VM on slot 99 in group 67. Reason: Connection with the vBRASSO server timed out.
Execute the ping command on the CTRL-VM to test the connectivity to the IP address of the VNFM-VBRAS.
¡ If the VNFM-VBRAS IP cannot be pinged, examine all the links on the packet forwarding path and resolve the route issue.
¡ If the VNFM-VBRAS IP can be pinged, go to step 5.
5. Verify that the configuration for the connection between vBRAS and VNFM-vBRAS is correct.
The following conditions indicate that configuration errors exist for the connection between vBRAS and VNFM-vBRAS:
¡ The following log information is output on the CP:
VMMGR/4/VMMGR_CREATE_FAIL: Failed to manually create VM 99 in group 67. Reason: Failed to connect to the vBRASSO server.
VMMGR/4/VMMGR_DELETE_FAIL: Failed to delete the manually created VM on slot 99 in group 67. Reason: Connection with the vBRASSO server timed out.
¡ Execute the display vbras-cp stable state vnfm command on the CP. The command output shows that the communication status with VNFM is Not configured or Disconnected.
<Sysname> display vbras-cp stable state vnfm
------------------------------VNFM state------------------------------
VNFM communication state: Connected
Execute the display current-configuration command on the CP to display the VNFM-vBRAS configuration. Make sure the configuration in the vnfm address command is consistent with the actually used IP address, port number, username, and password for login to the VNFM-vBRAS and the actual mode (HTTP or HTTPS) for communication with the VNFM-vBRAS.
<Sysname> display current-configuration | include vnfm
vnfm address 192.168.73.33 user test password simple 123456789 http-method port 30000
¡ If the VNFM-vBRAS configuration is incorrect, execute the vnfm address command to edit the configuration.
¡ If the VNFM-vBRAS configuration is correct, go to step 6.
6. Verify that VMs have been deployed correctly.
If the following log information is output on the CP, it indicates that VM deployment failures exist.
VMMGR/4/VMMGR_CREATE_FAIL: Failed to manually create VM 99 in group 67. Reason: The vBRASSO server failed to create the VM.
VMMGR/4/VMMGR_DELETE_FAIL: Failed to delete the manually created VM on slot 99 in group 67. Reason: The vBRASSO server failed to delete the VM.
¡ If a VM deployment failure exists, troubleshoot the issue as described in “VM deployment failure.”
¡ If VM deployment is correct, go to step 7.
7. If the issue persists, collect the following information and contact Technical Support:
¡ Results of each step.
¡ The configuration file, log messages, and alarm messages.
Related alarm and log messages
Alarm messages
Module name: HH3C-VNF-DEVICE-MIB
· hh3cVmCreateFail (1.3.6.1.4.1.25506.2.196.3.0.4)
· hh3cVmDeleteFail (1.3.6.1.4.1.25506.2.196.3.0.6)
Log messages
· VMMGR/4/VMMGR_CREATE_FAIL
· VMMGR/4/VMMGR_CREATE_FAIL_FINAL
· VMMGR/4/VMMGR_DELETE_FAIL
· VMMGR/4/VMMGR_DELETE_FAIL_FINAL
UP allocation failure
Symptom
Execute the display bras-vm-up associated-info command on the CP to display the BRAS-VM and UP association information. The output shows an unmanaged UP exists, that is, the UP does not have BRAS-VM information.
<CP> display bras-vm-up associated-info
Slot UP ID
1024
129, 130 1025
Common causes
The following are the common causes of this type of issue:
· The number of UPs or users exceeds the BRAS-VM management capacity.
· The server resources are not enough for BRAS-VM auto scaling.
Troubleshooting flow
The primary troubleshooting procedure for this type of issue is as follows:
1. Identify whether the number of UPs exceeds the BRAS-VM management capacity.
2. Identify whether the number of users exceeds the BRAS-VM management capacity.
3. Identify whether the server resources are enough.
Figure 22 shows the troubleshooting flowchart.
Figure 22 Flowchart for troubleshooting UP allocation failure
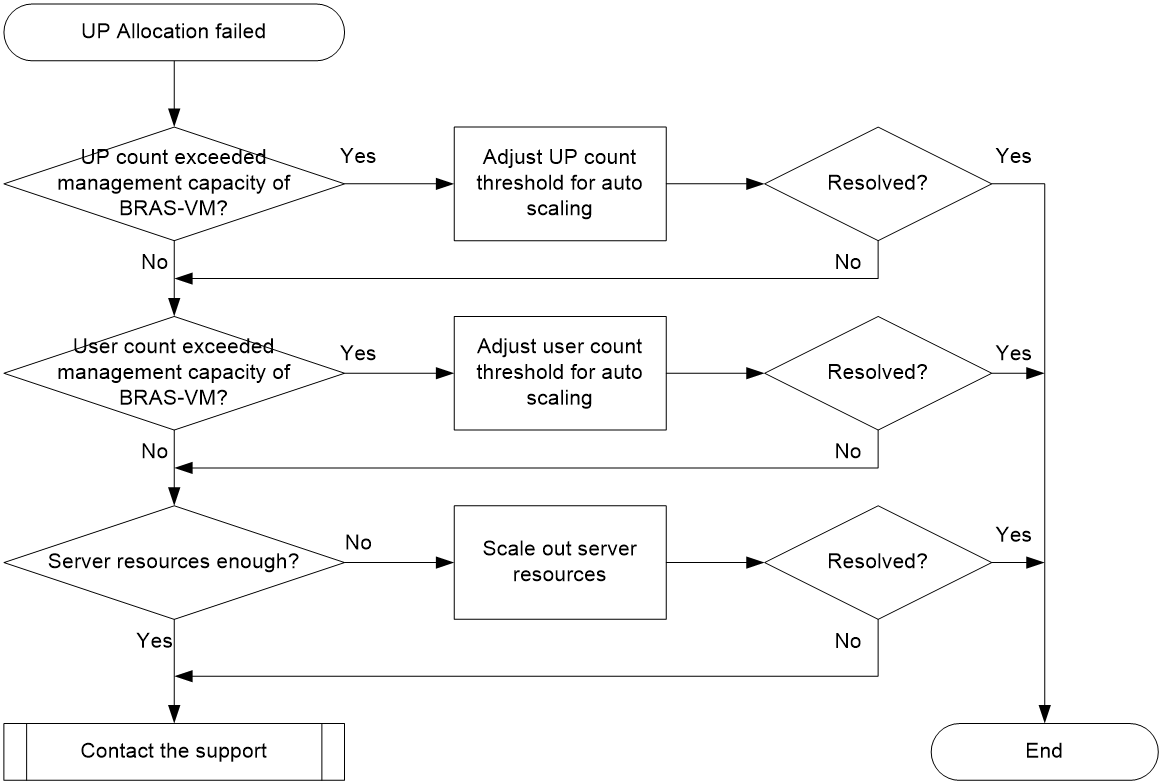
Solution
1. Identify whether the number of UPs exceeds the BRAS-VM management capacity.
Execute the display bras-scale capacity command to display scaling capabilities for the current BRAS-VM.
<Sysname> display bras-scale capacity slot 129
Slot: 129, 130
Current UP count: 16
UP count threshold: 64
Current user count: 1000
Max user count: 2000000
User count lower threshold: 200000
User count alert threshold: 1600000
User count upper threshold: 1800000
Current delay time: 300s(will expand to 600s after 2 retry)
¡ If the Current UP count (number of UPs associated with the BRAS-VM) is greater than or equal to the UP count threshold (UP-count threshold for triggering auto scaling), it indicates the number of UPs has exceeded the BRAS-VM management capacity. Use the bras-scale capacity up-count-threshold command to change the UP-count threshold for auto scaling.
¡ If the Current UP count is smaller than the UP count threshold, it indicates the number of UPs has not exceeded the BRAS-VM management capacity. In this case, go to step 2.
2. Identify whether the number of user exceeds the BRAS-VM management capacity.
Execute the display bras-scale capacity command to display scaling capabilities for the current BRAS-VM.
<Sysname> display bras-scale capacity slot 129
Slot: 129, 130
Current UP count: 16
UP count threshold: 64
Current user count: 1000
Max user count: 2000000
User count lower threshold: 200000
User count alert threshold: 1600000
User count upper threshold: 1800000
Current delay time: 300s(will expand to 600s after 2 retry)
¡ If the Current user count (number of users on UPs managed by the BRAS-VM) is greater than or equal to the User count upper threshold (user-count threshold for triggering auto scaling), it indicates the number of users has exceeded the BRAS-VM management capacity. Use the bras-scale capacity user-count-threshold command to change the user-count threshold for auto scaling.
¡ If the Current user count is smaller than the User count upper threshold, it indicates the number of users has not exceeded the BRAS-VM management capacity. In this case, go to step 3.
3. Identify whether the server resources are enough.
After an auto scaling failure, log in to the CAS management interface of the server host to view VM resource usage information.
¡ If the server resources are not enough, scale out server resources.
¡ If the server resources are enough, go to step 4.
4. If the issue persists, collect the following information and contact Technical Support:
¡ Results of each step.
¡ The configuration file, log messages, and alarm messages.
Related alarm and log messages
Alarm messages
None.
Log messages
· UPLB_SCALE_EXPAND_FAILED
· UPLB_SCALE_SHRINK_FAILED
CP disaster recovery issues
Symptom
· In hot backup mode, after a user comes online from the master CP, user information cannot be backed up to the backup CP.
· The CPs cannot negotiate the master and backup roles correctly. Two master CPs or two backup CPs exist.
· A user cannot come online from the new master CP after a master-backup switchover.
Common causes
The following are the common causes of this type of issue:
· Routing failure.
· The heartbeat channel between the master and backup CPs was not established.
· The data backup channels between the master and backup CPs were not established.
· Incorrect source interface configuration for outgoing RADIUS packets.
· Inconsistent configuration on the master and backup CPs.
Troubleshooting flow
Figure 23 shows the troubleshooting flowchart:
Figure 23 Flowchart for troubleshooting CP disaster recovery failure
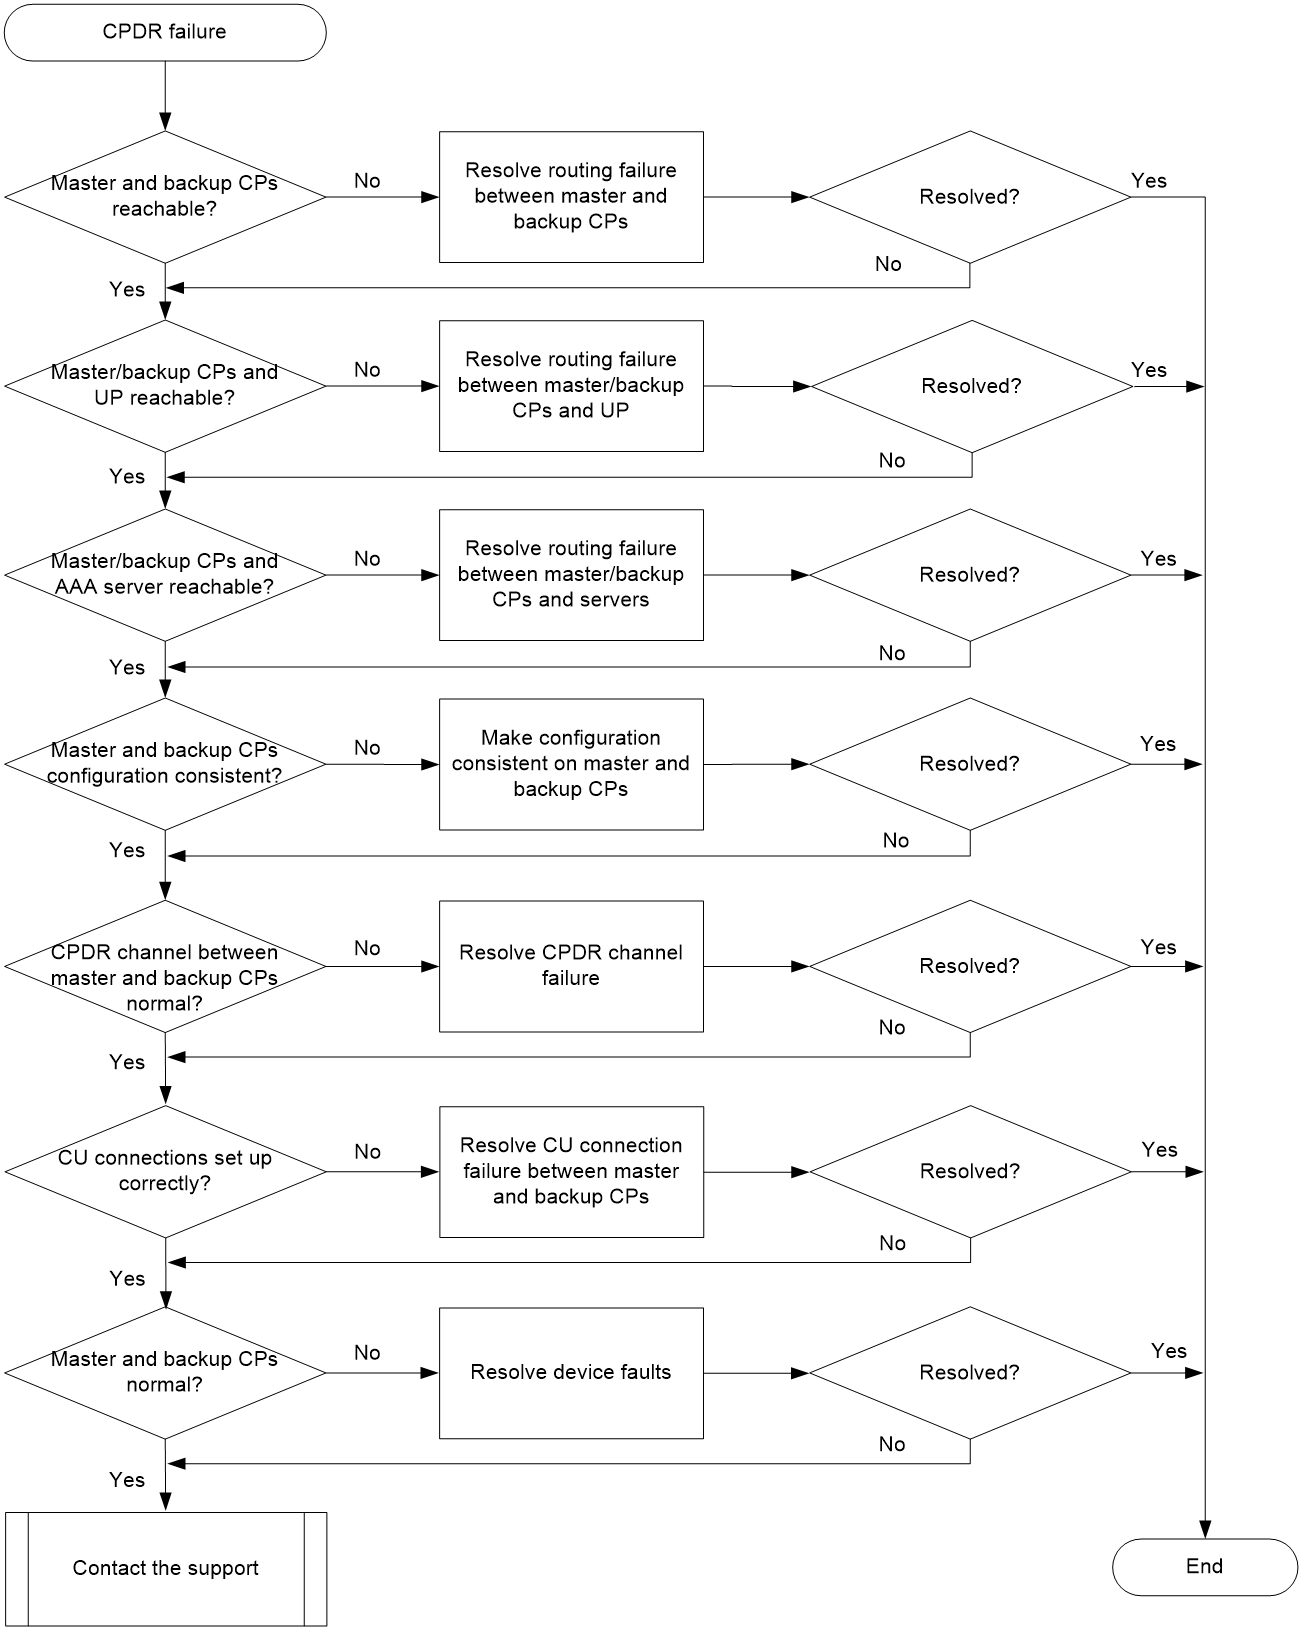
Solution
1. Identify whether the master and backup CPs can reach each other at Layer 3.
On one CP, ping the other CP. If the ping succeeds, proceed to the next step. If the ping fails, resolve the routing issue.
2. Identify whether the master/backup CPs and the UP can reach each other at Layer 3.
On the UP, ping the master and backup CPs respectively. If the ping succeeds, proceed to the next step. If the ping fails, resolve the routing issue.
3. Identify whether the master CP and the servers (such as AAA server) can reach each other at Layer 3.
On the master CP, ping the AAA server. If the ping succeeds, proceed to the next step. If the ping fails, resolve the routing issue.
4. Identify whether the master and backup CPs have consistent configuration.
On the master and backup CPs, execute the display current-configuration command. Compare the configurations on the master and backup CPs, such as the IP address pool configuration and the source interface configuration for outgoing RADIUS packets. If the configuration is consistent, proceed to the next step. If the configuration is inconsistent, edit the configuration to ensure consistency.
5. Verify that the CPDR channel between the master and backup CPs is normal.
Perform the following operations to check the CPDR channel between the master and backup CPs:
¡ Execute the display cp disaster-recovery data-tunnel command to display data backup channel information. If no data backup channels are established, check the data channel configuration, network configuration, and link connection status.
¡ Execute the display cp disaster-recovery heartbeat-tunnel command to display TCP heartbeat channel information. If no heartbeat channel is established, check the heartbeat channel configuration, network configuration, and link connection status.
¡ Execute the display cp disaster-recovery protect-tunnel statistics command to display packet statistics for the protection channel. If packet statistics are abnormal, check the related feature configuration, network configuration, and link connection status.
¡ Execute the display cp disaster-recovery group command to display CPDR group configuration and running information. If the CUSP channel is not set up correctly, proceed to the next step.
6. Identify whether the CU connections are set up correctly.
On the CPs, execute the display cusp controller command to display the connection information of the CUSP controller.
On UPs, execute the display cusp agent command to display the connection information of the CUSP agent.
If the CUSP channel connections are abnormal, check the CUSP configuration and resolve the issue as described in the CUSP connection troubleshooting guide.
7. Identify whether the device state is stable.
On CPs, execute the display vbras-cp stable state command to identify whether the CP and UP separation system is in stable state.
8. If the issue persists, collect the following information and contact Technical Support:
¡ Results of each step.
¡ The configuration file, log messages, and alarm messages.
UP backup issues
Master/backup interface failure or master/backup switchover
Symptom
The master and backup interfaces in a UP backup profile are operating incorrectly. The output from the display up-backup-profile command executed on the CP shows the following errors:
· The state value for the master interface is not master(normal).
· The state value for the backup interface is not backup(normal).
<Sysname> display up-backup-profile
...
Interface group 1:
Master: Remote-XGE1024/1/0/1, state=backup(normal), VRID=1
Backup: Remote-XGE1025/1/0/1, state=master(normal)
...
Common causes
The following are the common causes of this type of issue:
· The physical links of the master and backup interfaces on the UPs go down.
· CUSP channel failure occurs between the CP and the UPs that host the master and backup interfaces.
· The track entries on the UPs are in an abnormal state.
· Switchover back to the original master interface upon failure recovery is disabled in the UP backup profile on the CP.
Troubleshooting flow
1. Verify that the physical links of the master and backup interfaces on the UPs are operating correctly.
2. Identify the cause of the issue from the backup profile information.
3. Verify that the CUSP channels between the CP and the UPs are operating correctly.
4. Verify that the track entries on the UPs are in a normal state.
5. Verify that switchover back to the original master interface upon failure recovery is enabled in the UP backup profile on the CP.
Figure 24 shows the troubleshooting flowchart.
Figure 24 Flowchart for troubleshooting master/backup interface failure or switchover
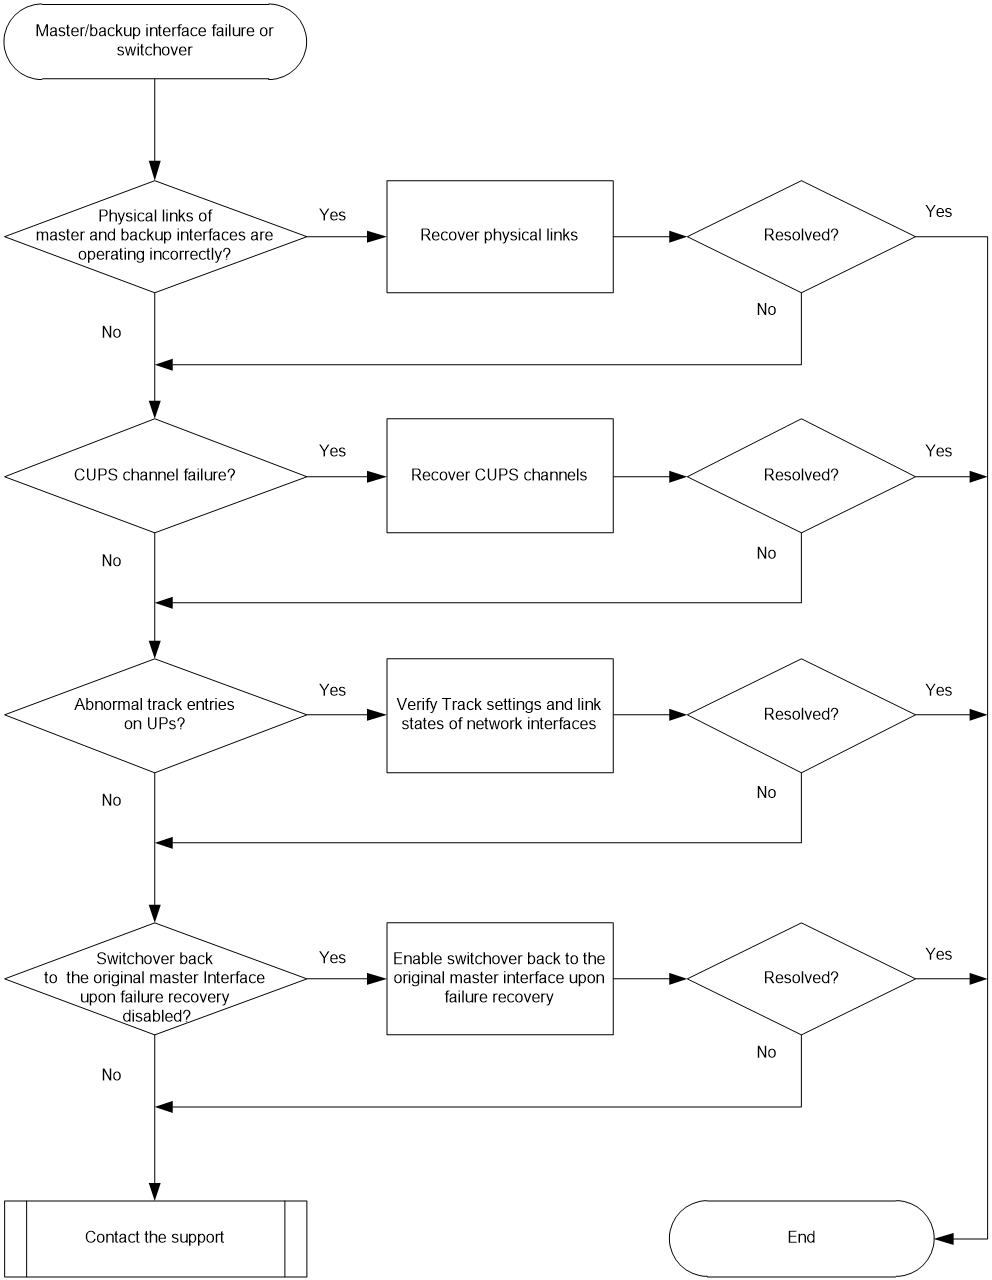
Solution
1. Verify that the physical links of the master and backup interfaces on the UPs are operating correctly.
Execute the display interface command on the UPs to view interface information, for example:
<Sysname> display interface ten-gigabitethernet 3/1/1
Ten-GigabitEthernet3/1/1
Interface index: 386
Current state: Administratively DOWN
Line protocol state: DOWN
...
Perform the following steps depending on the state of the interface:
a. If the Current state field displays Administratively DOWN, execute the undo shutdown command on the interface to bring up the interface.
b. If the Current state field displays DOWN, check the interface cabling for physical connection issues.
c. Repeat the previous steps on the UPs to verify that the outgoing interfaces to the CP are operating correctly.
2. Execute the display up-backup-profile command on the CP to view UP backup profile information.
¡ If the Reason field displays CUSP down, the CUSP channel between the CP and the UP that hosts the master interface is operating incorrectly. Go to step 3.
¡ If the Reason field displays Track negative, the network interface monitored by the UP through Track goes down. Go to step 4.
¡ If the Failure recovery field displays Disabled, switchover back to the original master interface upon failure recovery is disabled. Go to step 5.
Execute the display cusp controller command on the CP to view information about connections to the UPs on the CUSP controller.
¡ If the Control tunnel state field displays Inactive, troubleshoot the issue as described in "Control channel establishment failure."
¡ If the Control tunnel state field displays Active, the CUSP channel is operating correctly.
4. Identify the track monitoring states on the UPs.
Execute the display this command in UP backup profile view on the CP to identify whether the up-id up-id network-state track uplink-group group-name command is executed.
¡ If not, identify the track entry state on the UP. If the state is Positive, go to next step.
¡ If yes, verify that the user-plane switchover track track-id uplink-group group-name command is executed on the UP that hosts the master interface. Make sure the CP and UP are configured with the same UP uplink network resource group. Then, execute the display track track-id command to view the state of the corresponding track entry associated with the UP. If the State field displays Negative for the track entry, the tracked object is operating incorrectly. Troubleshoot tracked object exceptions according to the corresponding information.
<Sysname> display track all
Track ID: 2
State: Negative
Duration: 0 days 0 hours 0 minutes 32 seconds
Tracked object type: BFD
Notification delay: Positive 20, Negative 30 (in seconds)
Tracked object:
BFD session mode: Echo
Outgoing interface: Ten-GigabitEthernet3/1/1
...
Execute the display this command in UP backup profile view on the CP to identify whether switchover back to the original master interface upon failure recovery is enabled:
¡ If not, execute the failure-recovery-switch enable command to enable switchover back to the original master UP or interface upon failure recovery.
¡ If yes, verify that an appropriate switchover delay is set, for example, 30 seconds. A long delay might result in delayed switchovers. A short delay might cause frequent master/backup switchovers.
6. If the issue persists, collect the following information and contact Technical Support:
¡ Results of each step.
¡ The configuration file and alarm messages.
¡ Execute the display system internal up-backup log event command to obtain information about UP backup event log messages.
Related alarm and log messages
Alarm messages
N/A
Log messages
· UPBAK/6/UPBAK_IF_STATE_CHANGE
· UPBAK/6/UPBAK_IF_STATE_SWITCH
Long master/backup interface switchover
Symptom
A long master/backup interface switchover might cause a long traffic interruption due to the following errors:
· The backup interface fails to take over in time when the master interface fails.
· Switchover back to the original master interface upon failure recovery is not in time.
Common causes
The following are the common causes of this type of issue:
· A long switchover delay is set for switchover back to the original master interface upon failure recovery.
· A long switchover delay upon CUSP channel failure is set.
· A long switchover delay upon CUSP channel failure recovery is set.
· Service modules are slow in switchover processing.
Troubleshooting flow
1. Verify that the switchover delay is appropriate for switchover back to the original master interface upon failure recovery.
2. Verify that the switchover delay upon CUSP channel failure is appropriate.
3. Verify that the switchover delay upon CUSP channel failure recovery is appropriate.
4. Verify that the service modules are operating correctly in processing switchovers.
Figure 25 shows the troubleshooting flowchart.
Figure 25 Flowchart for troubleshooting long master/backup interface switchover
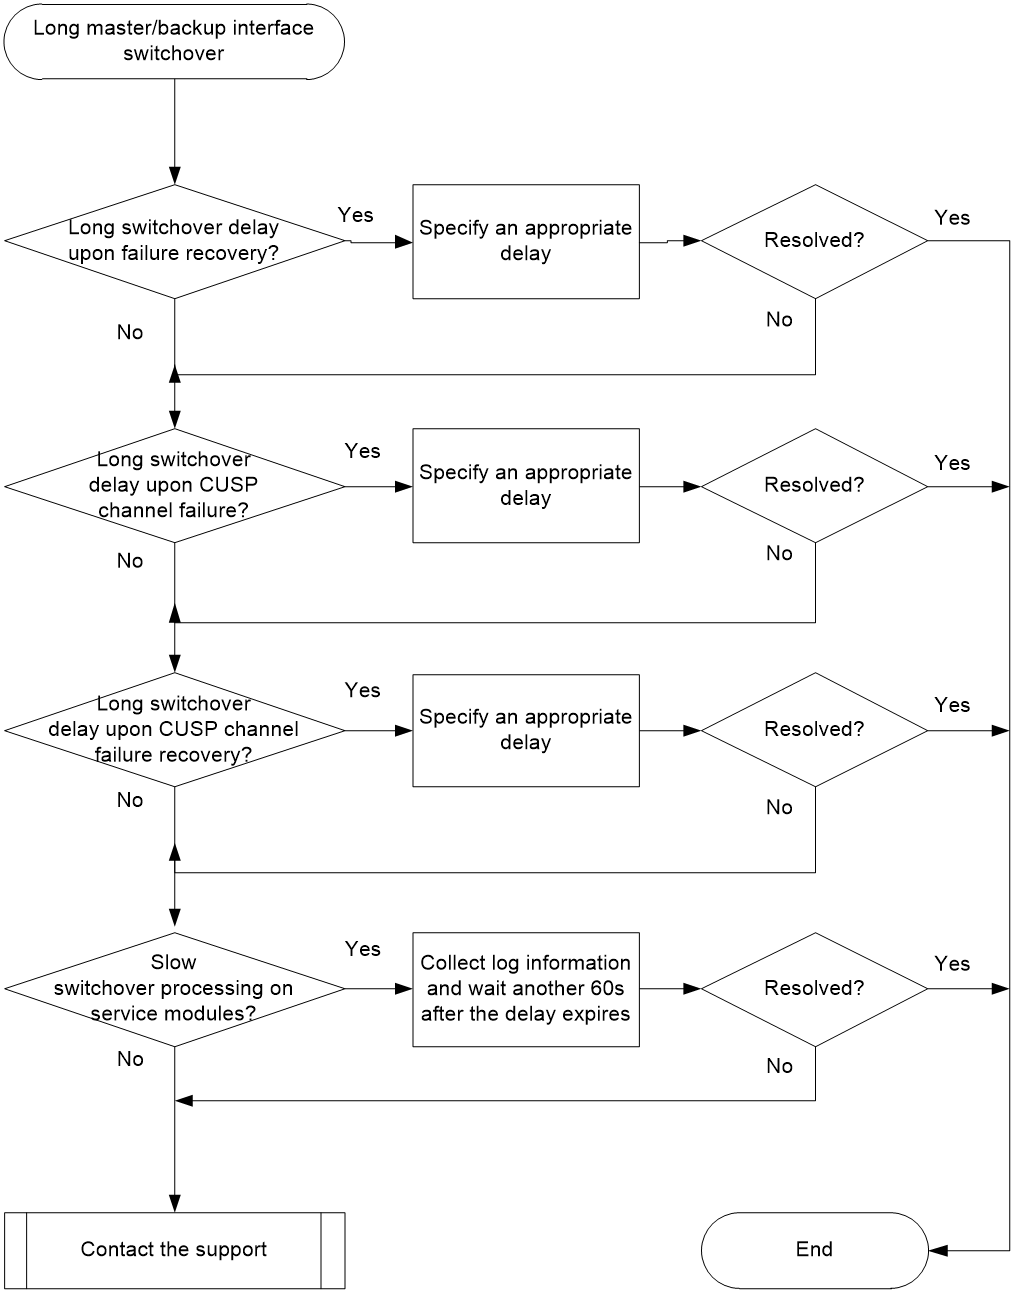
Solution
1. Execute the display up-backup-profile command on the CP to identify whether the delay is appropriate, for example:
<Sysname> display up-backup-profile 1
Profile ID: 1
Backup mode: Hot standby
Failure recovery: Enabled Delay time: 1800 seconds
CUSP tunnel down switchover Delay time: 1800 seconds
CUSP tunnel up switchover Delay time: 60000 milliseconds
Route advertise: Disabled
Interface backup mode: Inherit-main
Interface group 1:
Master: Remote-XGE2009/1/3/0, state=backup(normal), VRID=2
Backup: Remote-XGE2000/1/3/0, state=master(normal)
Switchback state: Waiting(remaining time: 1797 seconds)
¡ If the Failure recovery field displays Enabled, switchover back to the original master interface upon failure recovery is enabled. The value range for the switchover delay is 0 to 1800, in seconds, and the default is 30 seconds. If the delay is much longer than 30 seconds, go to step 2.
¡ If the Delay time field for CUSP tunnel down switchover displays the switchover delay upon CUSP channel failure, in the range of 0 to 1800 seconds. By default, the CP notifies the UP to perform a master/backup UP or interface switchover 50 milliseconds after CUSP channel failure occurs between the CP and a UP. If the delay is much longer than 50 milliseconds, go to step 3.
¡ If the Delay time field for CUSP tunnel up switchover displays the switchover delay upon CUSP channel failure recovery, in the range of 0 to 60000 milliseconds. By default, the CP notifies the UP to perform a master/backup UP or interface switchover 3 seconds after a CUSP channel failure recovery. If the delay is much longer than 3 seconds, go to step 4.
2. If the switchover delay upon failure recovery is long, modify the delay.
On the CP, execute the failure-recovery-switch enable [ delay delay-time ] command in UP backup profile view or CGN-UP backup profile view to specify an appropriate delay.
3. If the switchover delay upon CUSP channel failure is long, modify the delay.
On the CP, execute the control-tunnel-down switchover [ delay sec-delay-time | msec-delay msec-delay-time ] command in UP backup profile view or CGN-UP backup profile view to specify an appropriate delay.
4. If the switchover delay upon CUSP channel failure recovery is long, modify the delay.
On the CP, execute the control-tunnel-up switchover msec-delay delay-time command in UP backup profile view or CGN-UP backup profile view to specify an appropriate delay.
5. Wait another 60 seconds after the switchover delay expires.
6. If the issue persists, collect the following information and contact Technical Support:
¡ Results of each step.
¡ The configuration file and alarm messages.
¡ Execute the display system internal up-backup log event to obtain information about UP backup event log messages.
Related alarm and log messages
Alarm messages
N/A
Log messages
N/A
Two master interfaces on UPs
Symptom
When the CP notifies the UPs to switch the master interface to backup and the backup interface to master, the master interface fails to switch to backup. As a result, two master interfaces exist. In this case, user access devices connected to the UPs repeatedly refresh forwarding interface information, resulting in forwarding entry flapping, which causes packet loss.
When you execute display system internal up interface-backup on the UPs that host the master and backup interfaces, the output shows that the states of the interfaces are Master.
<Sysname> system-view
[Sysname] probe
[Sysname-probe] display system internal up interface-backup
Interface: Ten-GigabitEthernet3/1/4
IfIndex: 65
State: Master
Backup mode: Hot standby
Interface backup mode: Inherit-main
Resource ID: 0x20001
Virtual MAC: 0000-5e00-0101
Switchover upon ctrl tunnel down: Enabled
Switchover delay: 0
Common causes
The following are the common causes of this type of issue:
· CUSP channel failure occurs between the CP and the UP that hosts the master interface and the master/backup interface switchover is disabled.
· The UCM service module fails to notify the UP backup module to switch the master interface to backup.
Troubleshooting flow
1. Locate the cause for the master/backup switchover and identify whether the master/backup interface switchover is disabled on the UPs.
2. Recover the CUSP channels between the CP and UPs.
Figure 26 shows the troubleshooting flowchart.
Figure 26 Flowchart for troubleshooting two master interfaces on UPs
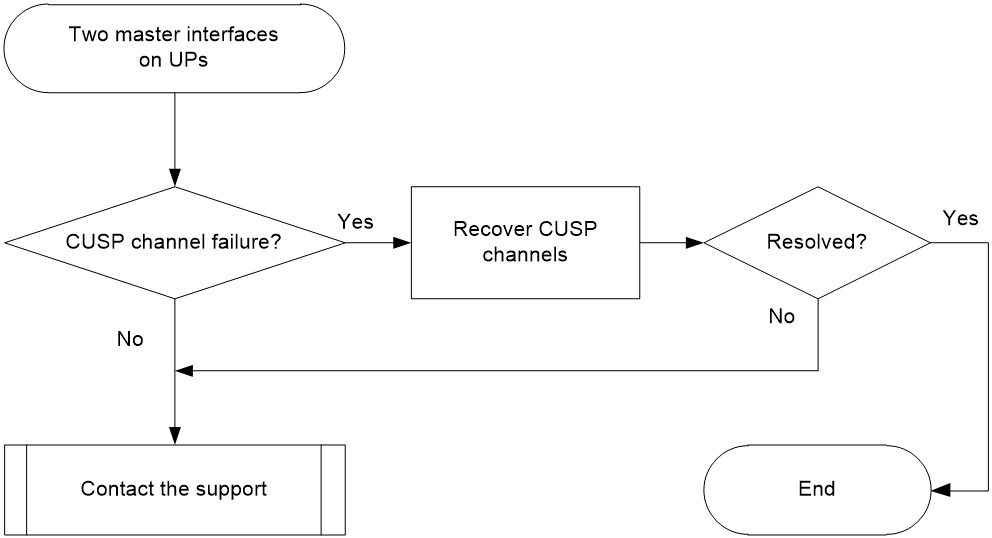
Solution
1. Execute the display up-backup-profile profile-id switch-history command on the CP to locate the cause of the most recent switchover, for example:
<Sysname> display up-backup-profile 1 switch-history
Reason Interface State Time
CUSP down Remote-XGE2009/1/3/0 Switchover to backup 2021-08-30 04:28:39
¡ If the Reason field displays CUSP down, the switchover is caused by a CUSP channel failure. Go to step 2.
¡ If the Reason field displays CUSP down, the service modules might be faulty. Go to step 3.
2. Perform the following operations:
¡ Verify UP settings. Execute the display current-configuration command to identify whether master/backup interface switchover is enabled on the UPs. To enable master/backup interface switchover on a UP, execute the user-plane control-tunnel-down switchover track command.
¡ Execute the display cusp controller command on the CP to view information about connections to the UPs on the CUSP controller.
- If the Control tunnel state field displays Inactive, troubleshoot the issue as described in "Control channel establishment failure."
- If the Control tunnel state field displays Active, the CUSP channel is operating correctly.
3. If the issue persists, collect the following information and contact Technical Support:
¡ Results of each step.
¡ The configuration file and alarm messages.
¡ Execute the display system internal up-backup log event command to obtain information about UP backup event log messages.
Related alarm and log messages
Alarm messages
N/A
Log messages
N/A
Two backup interfaces on UPs
Symptom
Two backup interfaces exist on UPs when the following conditions are met:
· The CP fails to notify the UPs to perform a master/backup switchover when CUSP channel failure occurs between the CP and the UPs that host the master and backup interfaces.
· The master and backup interfaces are faulty.
In this case, users cannot come online because the master and backup UPs fail to process user traffic.
When you execute display system internal up interface-backup on the UPs that host the master and backup interfaces, the output shows that the states of the interfaces are Backup.
<Sysname> system-view
[Sysname] probe
[Sysname-probe]display system internal up interface-backup
Interface: Ten-GigabitEthernet3/1/4
IfIndex: 65
State: Backup
Backup mode: Hot standby
Interface backup mode: Inherit-main
Resource ID: 0x20001
Virtual MAC: 0000-5e00-0101
Switchover upon ctrl tunnel down: Enabled
Switchover delay: 0
Common causes
The following are the common causes of this type of issue:
· The following conditions are all met:
¡ The master and backup interfaces are faulty.
¡ CUSP channel failure occurs between the CP and UPs.
¡ The master/backup interface switchover is disabled on the UPs.
· The UCM service module fails to notify the UP backup module to switch the backup interface to master.
Troubleshooting flow
1. Verify that the physical links of the master and backup interfaces on the UPs are operating correctly.
2. Verify that the CUSP channels between the CP and the UPs are operating correctly.
3. Collect information about UP backup event log messages.
Figure 27 shows the troubleshooting flowchart.
Figure 27 Flowchart for troubleshooting two backup interface on UPs
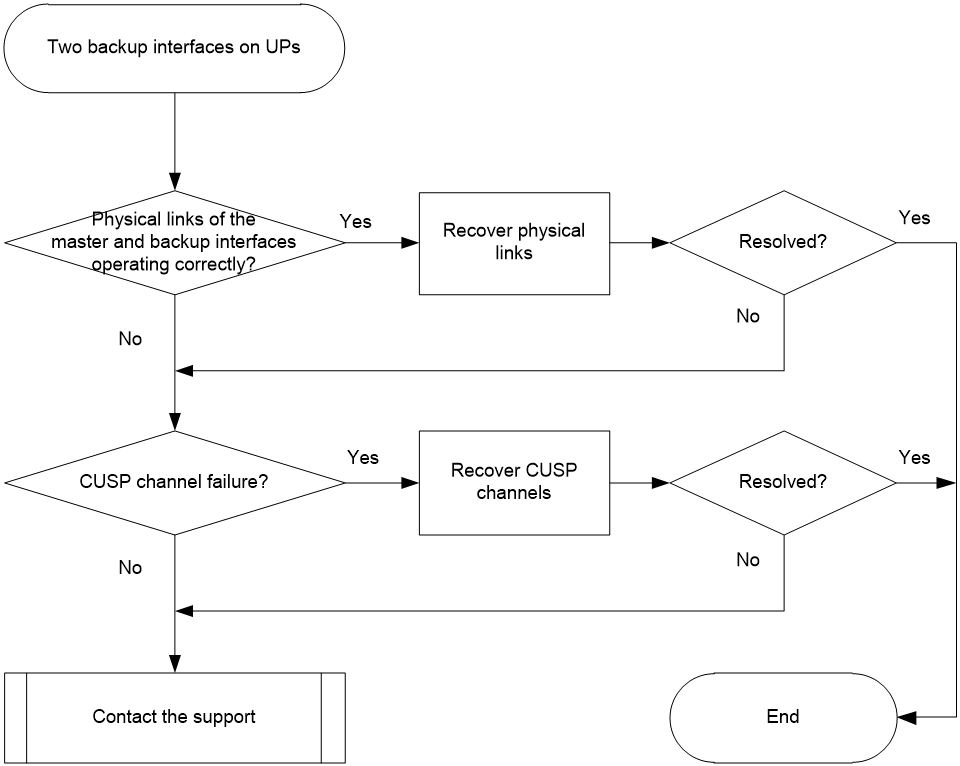
Solution
1. Verify that the physical links of the master and backup interfaces are operating correctly.
Execute the display interface command on the UPs, for example:
<Sysname> display interface ten-gigabitethernet 3/1/1
Ten-GigabitEthernet3/1/1
Interface index: 386
Current state: Administratively DOWN
Line protocol state: DOWN
...
Perform the following steps depending on the state of the interface:
a. If the Current state field displays Administratively DOWN, execute the undo shutdown command on the interface to bring up the interface.
b. If the Current state field displays DOWN, check the interface cabling for physical connection issues.
c. Repeat the previous steps on the UPs to verify that the outgoing interfaces to the CP are operating correctly.
2. Verify that the CUSP channels between the CP and the UPs are operating correctly.
Execute the display cusp controller command on the CP to view information about connections to the UPs on the CUSP controller.
¡ If the Control tunnel state field displays Inactive, troubleshoot the issue as described in "Control channel establishment failure."
¡ If the Control tunnel state field displays Active, the CUSP channel is operating correctly.
3. If the issue persists, collect the following information and contact Technical Support:
¡ Results of each step.
¡ The configuration file and alarm messages.
¡ Execute the display system internal up-backup log event command to obtain information about UP backup event log messages.
Related alarm and log messages
Alarm messages
N/A
Log messages
UPBAK/6/UPBAK_IF_STATE_NO_MASTER
Data inconsistency between CP and UP
Symptom
Data inconsistency occurs between the CP and a master UP in warm standby mode.
Common causes
The following are the common causes of this type of issue:
· The CUSP channel between the CP and UP is inactive.
· A forwarding error occurs on the CUSP channel between the CP and UP.
· The work-mode user-plane command is not executed on the UP.
· The devices are not stable, for example:
¡ The CP and UP are performing data smoothing.
¡ The memory usage is high on the UP.
¡ The master/backup interface switchover is not completed.
¡ Users are coming online or going offline.
Troubleshooting flow
Figure 28 shows the troubleshooting flowchart.
Figure 28 Flowchart for troubleshooting data inconsistency between CP and UP
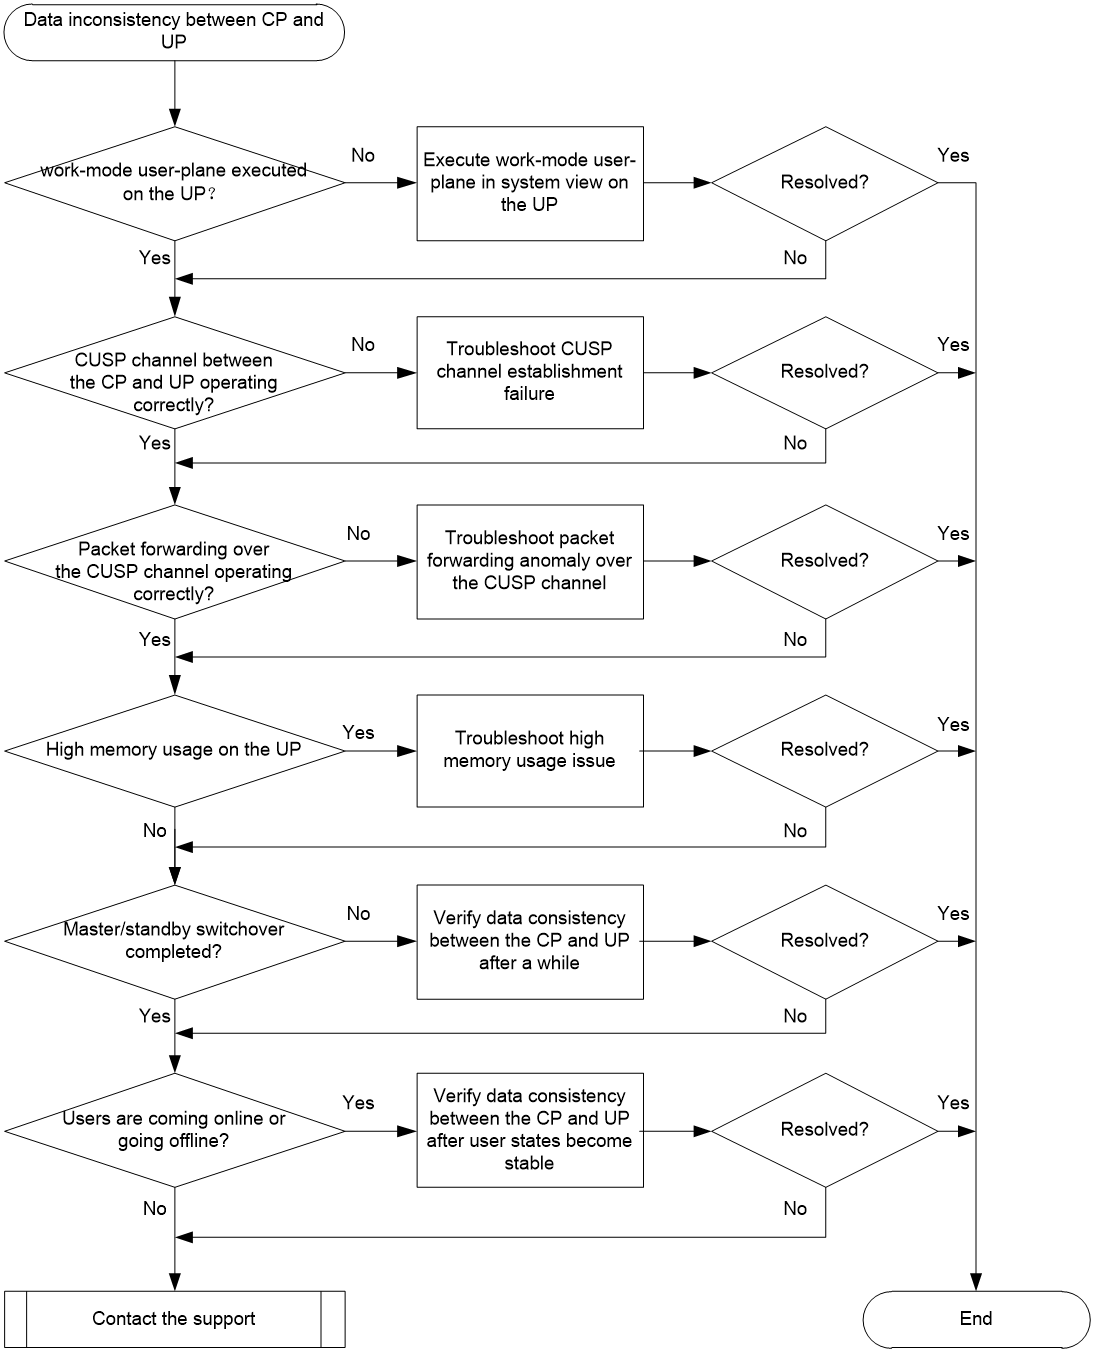
Solution
1. Execute the display current-configuration command on the UP to identify whether the work-mode user-plane command is executed:
¡ If not, execute the display current-configuration command in system view on the UP.
¡ If yes, go to step 2.
2. Identify whether the CUSP channel between the CP and UP is operating correctly.
Execute display cusp controller on the CP and display cusp agent on the UP to identify the state of the CUSP channel:
¡ If the state is Inactive, the CUSP channel is not activated. Troubleshoot the issue as described in "Control channel establishment failure."
¡ If the state is Active, the CUSP channel is activated. Go to step 3.
<CP> display cusp controller
CUSP version : 2
Controller IP : 2.2.2.2
VPN instance : --
SSL policy : --
BFD state : Disabled
BFD template : --
Echo interval : 30s
Echo timeout threshold : 4
Vendor ID : 25506
Keychain name : --
Disconnection entry aging time : Not aging
Agent name: up1
Vendor ID : 25506
CUSP version : 2
UP ID : 1026
Control tunnel state : Active
Agent IP : 1.1.1.1
Connection state : Established
Packets sent : 2209
Packets received : 2204
Standby controller : Disconnected
<UP> display cusp agent
Agent name : up1
Vendor ID : 25506
CUSP version : 2
Agent IP : 1.1.1.1
VPN instance : --
SSL policy : --
BFD state : Disable
BFD template : --
Echo interval : 30s
Echo timeout threshold : 4
Keychain name : --
Disconnection entry aging time : Not aging
First connection delay time : Not delayed
Controller information:
Vendor ID : 25506
Control tunnel state : Active
Controller IP : 2.2.2.2
Connection state : Established
Packets sent : 2204
Packets received : 2209
Execute display cusp controller on the CP and display cusp agent on the UP to identify whether packet forwarding is operating correctly.
¡ Packet forwarding is operating incorrectly if the Packets sent field on the CP and the Packets received field on the UP show an obvious difference. Troubleshoot the issue as described in "Packet forwarding failure for the control channel."
¡ Packet forwarding is operating correctly if the Packets sent field on the CP and the Packets received field on the UP show a minimal difference. Go to step 4.
<CP> display cusp controller
CUSP version : 2
Controller IP : 2.2.2.2
VPN instance : --
SSL policy : --
BFD state : Disabled
BFD template : --
Echo interval : 30s
Echo timeout threshold : 4
Vendor ID : 25506
Keychain name : --
Disconnection entry aging time : Not aging
Agent name: up1
Vendor ID : 25506
CUSP version : 2
UP ID : 1026
Control tunnel state : Active
Agent IP : 1.1.1.1
Connection state : Established
Packets sent : 2209
Packets received : 2204
Standby controller : Disconnected
<UP> display cusp agent
Agent name : up1
Vendor ID : 25506
CUSP version : 2
Agent IP : 1.1.1.1
VPN instance : --
SSL policy : --
BFD state : Disable
BFD template : --
Echo interval : 30s
Echo timeout threshold : 4
Keychain name : --
Disconnection entry aging time : Not aging
First connection delay time : Not delayed
Controller information:
Vendor ID : 25506
Control tunnel state : Active
Controller IP : 2.2.2.2
Connection state : Established
Packets sent : 2204
Packets received : 2209
4. Identify whether the memory usage on the UP is high.
Execute the display memory-threshold command on the UP to identify whether the memory usage is normal.
¡ If yes, troubleshoot the high memory usage issue.
¡ If not, go to step 5.
<UP> display memory-threshold
Memory usage threshold: 100%
Free-memory thresholds:
Minor: 235M
Severe: 156M
Critical: 78M
Normal: 313M
Early-warning: 391M
Secure: 470M
Current free-memory state: Normal (secure)
...
5. Identify whether the master/backup interface switchover is completed.
Execute the display up-backup-profile switchover-history command to view interface switchover records for a UP backup profile.
¡ If an interface switchover has occurred, identify whether data is consistent between the CP and UP a while later. If data inconsistency persists for a lot of users, go to step 6.
¡ If no interface switchover occurs recently, go to step 6.
<CP> display up-backup-profile 1 switchover-history
Reason Interface State Time
IF down Remote-XGE2000/1/3/0 Switchover to backup 2022-06-09 12:24:36
...
6. Identify whether a lot of users are coming online or going offline.
Execute the display access-user count commands multiple times to view access user information on the CP.
¡ If the number of users in the Total users field differs greatly between each execution of the command, there are a lot of users coming online or going offline. View user information on the CP and UP after the user access status is stable.
¡ If the number of users in the Total users field is close between each execution of the command, users do not frequently come online or go offline. Go to step 7.
<CP> display access-user count
Total users : 5
PPPoE users : 0
PPPoEA users : 0
PPPoA users : 0
PPPoFR users : 0
PPPoPhy users : 0
LNS users : 0
LAC users : 0
VPPP users : 0
L2 IPoE dynamic users : 1
L2 IPoE static users : 0
L2 IPoE interface leased users : 0
L2 IPoE subnet leased users : 0
L2 IPoE leased subusers : 0
IPoE L2VPN leased users : 0
L3 IPoE dynamic users : 0
L3 IPoE static users : 0
L3 IPoE interface leased users : 0
L3 IPoE subnet leased users : 0
Web auth users : 0
Portal users : 0
Telnet users : 1
SSH users : 0
HTTP users : 1
HTTPS users : 1
FTP users : 1
Command users : 0
PAD users : 0
Terminal users : 0
MAC auth users : 0
Dot1X users : 0
IKE users : 0
SSLVPN users : 0
DVPN users : 0
7. If the issue persists, collect the following information and contact Technical Support:
¡ Results of each step.
¡ The configuration file, log messages, and alarm messages.
Related alarm and log messages
Alarm messages
N/A
Log messages
N/A
VM issues
Image file upload failure
Symptom
Failed to upload an image file on the image management page of VNFM-vBRAS.
Common causes
The following are the common causes of this type of issue:
· The image file is invalid. For example, the file type or file name is incorrect, or the image file is repeatedly uploaded.
· Pods are operating incorrectly.
Troubleshooting flow
Figure 29 shows the troubleshooting flowchart.
Figure 29 Flowchart for troubleshooting image file upload failure
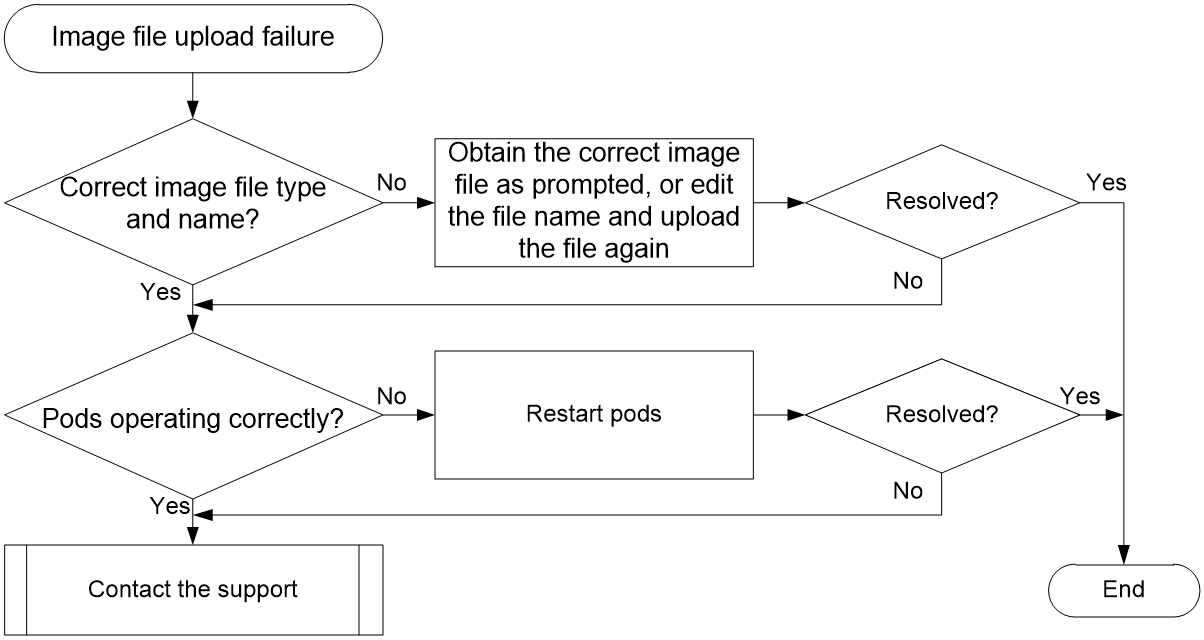
Solution
1. Identify whether the type and name of the image file are correct.
a. If yes, go to step 2.
b. If the image file type or name is incorrect, perform operations as shown in Table 4, and then upload the image file again. If the issue persists, go to step 3.
Table 4 Messages for image file upload failure and corresponding solutions
|
Message |
Solution |
|
Invalid image file type |
Verify that the image file is in the ISO format and the file name is suffixed with .iso. if the image file type is incorrect, contact Technical Support to obtain the correct image file. |
|
Invalid image file name |
Edit the file name and upload the image file again. The file name must meet the following requirements: · A maximum of 128 case-sensitive characters are allowed. · Only letters, digits, underscores (_), and hyphens (-) are supported. · The name of a vBRAS-CP image file must start with CP, for example, CP-vBRAS1000-CP-CMW710-E2021P12-X64.iso. · The name of a vBRAS-DB image file must start with DB. · The name of a vBRAS-UP image file must start with vUP. |
|
The image file already exists |
If the existing image file is available, you do not need to upload an image file again. If the existing image file is not available, delete the existing image file and upload the image file again, or edit the name of the image file to be uploaded. |
2. Access the CLI of the active master node of the SNA Installer cluster and execute kubectl get pod –n vnfm to identify whether the pods are operating correctly:
¡ If the status of all pods is Running, all pods are operating correctly.
¡ If the status of a pod is not Running, the pod is operating incorrectly. Restart the pod, and then upload the image file again.
[root@ucenter1 ~]# kubectl get pod -n vnfm
NAME READY STATUS RESTARTS AGE
vnfm-help-68497c48df-5qp5l 1/1 Running 0 111d
vnfm1-5b69d4865f-b6qqz 1/1 Running 0 111d
vnfm2-8f98fbc4d-ctdmn 1/1 Running 0 111d
vnfm3-c8bf6b777-r72t8 1/1 Running 0 111d
3. If the issue persists, collect the following information and contact Technical Support:
¡ Results of each step.
¡ The configuration file, log messages, and alarm messages.
Related alarm and log messages
Alarm messages
N/A
Log messages
N/A
VNF package upload failure
Symptom
Failed to upload the VNF package on the VNF package management page of the VNFM-vBRAS.
Common causes
The following are the common causes of this type of issue:
· The VNF package is incorrect. For example, the VNF package name or structure is wrong, or the VNF package is repeatedly uploaded.
· The files in the VNF package are incorrect. For example, the yml file structure is wrong, certain fields are missing, or the edited data for the yml file is out of the valid range.
Troubleshooting flow
Figure 30 shows the troubleshooting flowchart.
Figure 30 Troubleshooting flowchart
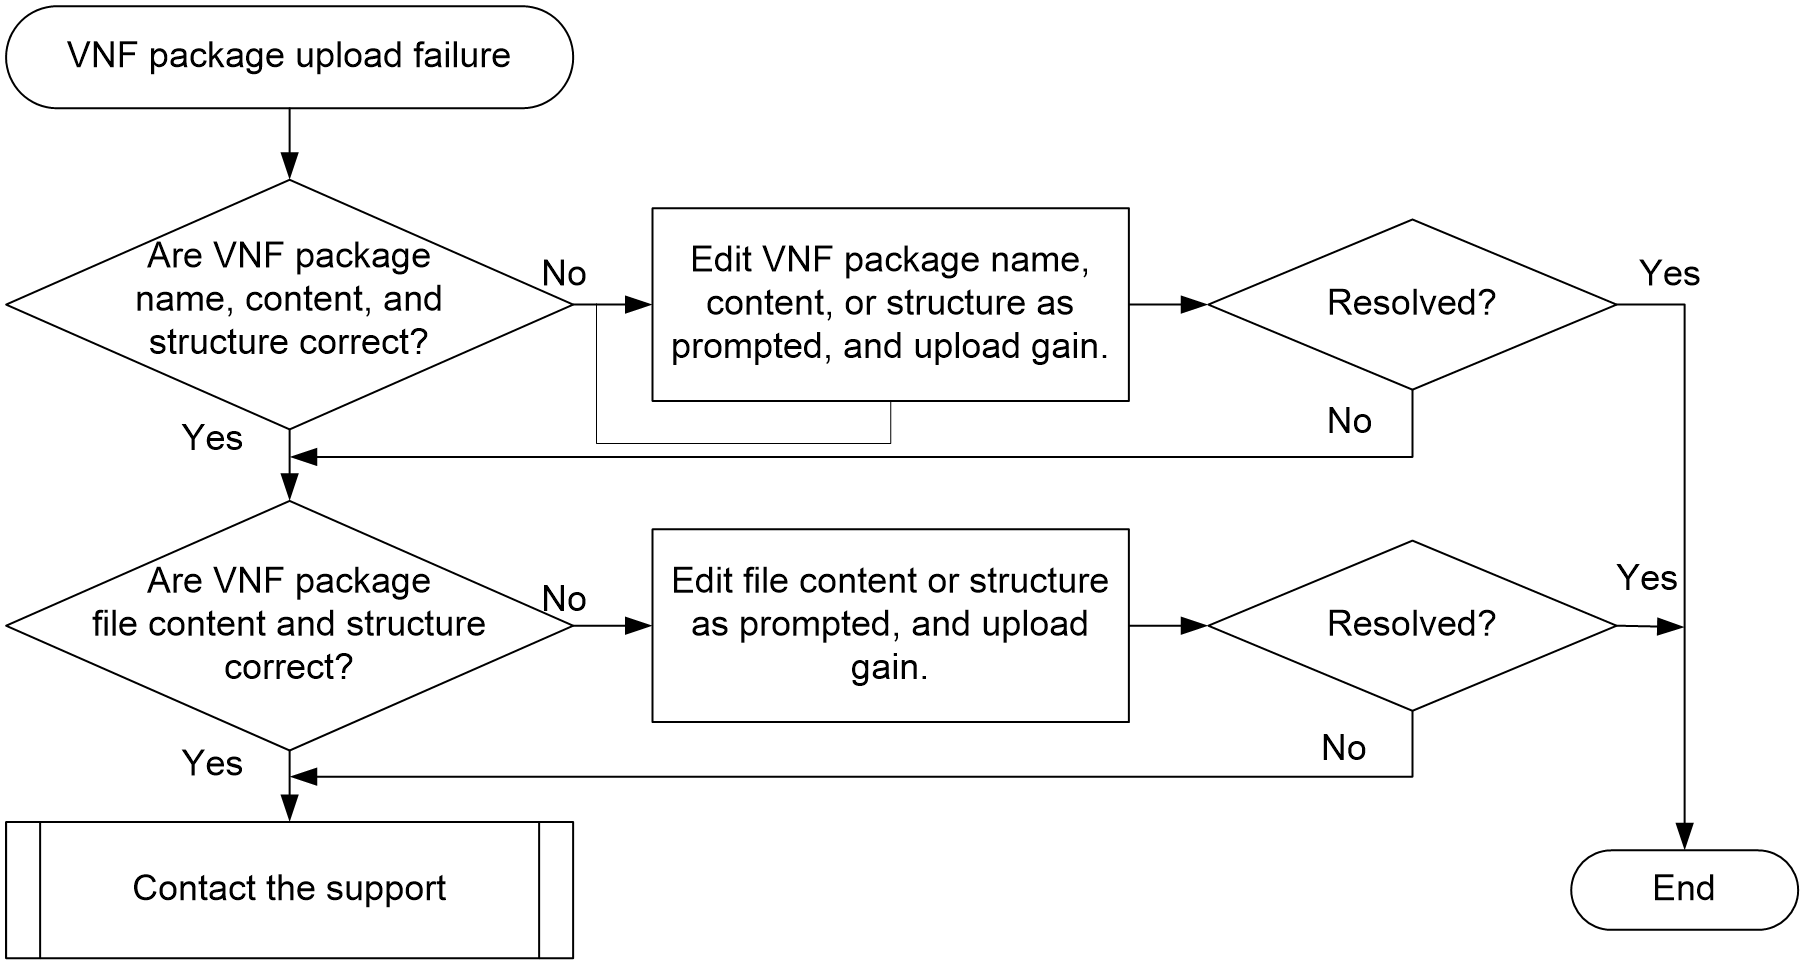
Solution
1. Examine the VNF package type, name, and structure.
a. If the VNF package type, name, or structure is incorrect, take relevant actions according to the prompt messages. For how to troubleshoot upload failures caused by incorrect VNF packages, see step 2. After resolving the issue, upload the VNF package again. If the issue persists, proceed to step 3.
|
Message |
Solution |
|
Invalid VNF package type. |
The VNF package must be a compressed ZIP file suffixed with .zip. If the VNF package type is incorrect, contact the support. |
|
Invalid VNF package name. |
Change the VNF package name and upload the package again. The VNF package name must meet the following requirements: · Up to 128 characters, case sensitive. · Only letters, digits, underlines (_), dots (.), and hyphens (-) are supported. |
|
The specified VNF package already exists. |
A VNF package with the same name has already been uploaded: · If the uploaded VNF package is available, you do not need to upload it again. · If the uploaded VNF package is unavailable, delete the VNF package or edit the name of the VNF package to upload |
|
Invalid VNF package structure. |
· Make sure the VNF packet structure is intact and complete with correct hierarchy, no files are missing, and the file names are correct. If an error or loss exists, obtain it again. A correct decompressed VNF package must include the Definitions folder (containing nodes.yml and vbras.yml files), TOSCA-Metadata folder (containing TOSCA.meta file), and csar.meta file. · Select all contents in the VNF package, and compress them in ZIP format. Make sure you select all of the Definitions folder, TOSCA-Metadata folder, and csar.meta file for compression, and do not select the upper-level folders. |
b. If the VNF package type, name, and structure are correct, proceed to step 3.
2. Verify that the file content and structure in the VNF package are correct.
a. If the file content or structure in the VNF package is incorrect, take relevant actions according to the prompt messages. For how to troubleshoot upload failures caused by VNF package file errors, see step 4. After resolving the issue, upload the VNF package again. If the issue persists, proceed to step 5.
|
Message |
Solution |
|
Tosca template parse error. |
Obtain the VNF package files again. After decompression, use text editor (that does not change file format) to edit the vbras.yml configuration file, so as to make sure the file structure (for example, indent format) is as shown in Figure 31. NOTE: VNFM-vBRAS parses the VNF package based on the Tosca template. The yml file content in the package must meet the specified indent format that is not allowed to be edited. |
|
Invalid init node attributes. |
Make sure the attribute value of each field in the init node is within the valid range. If not, configure the correct values. (For example, the slot number for the CTRL-VM must be 1 or 2. Make sure the attribute value for the ctrlvm_slot_id field is within the range of 1 to 2.) |
|
Invalid VM specifications. |
Make sure the attribute value of each field on each VM node is within the valid range. If not, configure the correct values. |
|
Invalid network binding parameters. |
Make sure the network_binding: parameter fields on each VM node do not contain any errors or losses. If errors or losses exist, configure the correct values. |
Figure 31 Structure of the vbras.yml configuration file
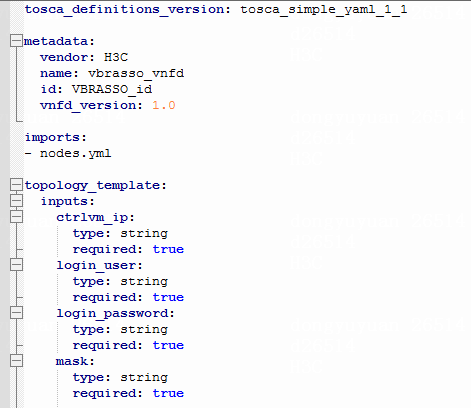
b. If the file content and structure in the VNF package are correct, proceed to step 5.
3. If the issue persists, collect the following information and contact Technical Support:
¡ Results of each step.
¡ The configuration file, log messages, and alarm messages.
Related alarm and log messages
Alarm messages
N/A
Log messages
N/A
VM deployment failure
Symptom
Failed to deploy a VM by using VNFM-vBRAS.
Common causes
The following are the common causes of this type of issue:
· CloudOS contains insufficient organization resource quota. Organization users cannot create VMs.
· In the vbras.yml file, the logical_nic_name is not prefixed with SRIOV for the SR-IOV straight-through NIC. Possible reasons include:
¡ The CloudOS classic network name does not meet the requirements. As a result, the vbras.yml file content is incorrect.
¡ An incorrect value is specified for the logical_nic_name attribute field during vbras.yml file modification.
· In the vbras.yml file, the storage attribute value of each VM is too small, resulting in insufficient storage resources.
· The parameters and configuration commitment are not correctly configured for CAS collaboration in CloudOS, resulting in insufficient remaining space of the storage pool resources and VM creation failure.
Troubleshooting flow
Figure 32 shows the troubleshooting flowchart.
Figure 32 Troubleshooting flowchart

Solution
1. Access the VNFM-vBRAS component of Unified Platform, and navigate to the operation log page to view VM deployment log information.
a. If the failure cause column displays Failed to create the VNF on the host, log in to CloudOS, and navigate to the quota page. Then change all the quota settings to the maximum values. After configuration, deploy the VM again. If the issue persists, proceed to step 2.
b. If the message is not displayed, proceed to step 2.
2. Navigate to the classic network page of CloudOS to view the classic network information.
a. If the SRIOV prefix is added to the names of the classic networks associated with the configured SR-IOV straight-through NICs, proceed to step 3.
b. If not, edit the classic network names, and make sure the names of the classic networks associated with the SR-IOV straight-through NICs are prefixed with SRIOV. For example, if the classic network name associated with the internal control interface is Inner-Ctrl-DC1, change the name to SRIOV-Inner-Ctrl-DC1. After configuration, deploy the VM again. If the issue persists, proceed to step 3.
a. If all the attribute values are consistent with the CloudOS classic network names, proceed to step 4.
b. If not, edit the vbras.yml file. Make sure the attribute values for the logical_nic_name field are consistent with the CloudOS classic network names. After configuration, deploy the VM again. If the issue persists, proceed to step 4.
4. On the CAS cloud computing management platform, click the ![]() icon in the upper right corner. On the task page that opens, view
the reason for the VM adding failure.
icon in the upper right corner. On the task page that opens, view
the reason for the VM adding failure.
a. If the failure reason is storage volume conversion failure, you need to edit the vbras.yml file to make sure the storage field value is equal to or greater than 32768. After configuration, deploy the VM again. If the issue persists, proceed to step 5.
b. If the failure reason is insufficient remaining space of storage pool resources, you need to perform configuration commitment in CloudOS. For more information, see the H3C vBRAS1000-CP installation and deployment guide. After configuration commitment, verify that the useLocalStorage = True parameter exists in the /etc/nova/nova-compute.conf file of the compute node container. If the parameter exists, deploy the VM again. If the issue persists and the useLocalStorage = True parameter does not exist, proceed to step 5.
c. For other failure reasons, proceed to step 5.
5. If the issue persists, collect the following information and contact Technical Support:
¡ Results of each step.
¡ The configuration file, log messages, and alarm messages.
Related alarm and log messages
Alarm messages
N/A
Log messages
N/A
VM creation or startup failure due to insufficient resources
Symptom
Failed to create or start up the VM on any server host during VM manual expansion, auto expansion, and initial deployment.
Common causes
The following are the common causes of this type of issue:
· The server host storage pool is running out of space.
· The remaining memory of the server host does not meet the requirements.
· The number of CPUs of the server host does not meet the requirements.
Troubleshooting flow
Figure 33 shows the troubleshooting flowchart.
Figure 33 Troubleshooting flowchart

Solution
1. Verify that the VM is correctly deployed.
2. Enter the http://server host IP address:8080/cas/login URL to log in to the CAS cloud computing management platform of the server host. On the cloud resource tab of the server host management page, verify that the VM exists and has started up correctly (displayed in green).
3. To resolve the VM creation or startup failure, see the one-key inspection section in the H3C CAS cloud computing management platform maintenance guide. If the issue persists, proceed to the next step.
4. If the issue persists, collect the following information and contact Technical Support:
¡ Results of each step.
¡ The configuration file, log messages, and alarm messages.
Related alarm and log messages
Alarm messages
N/A
Log messages
N/A
VM startup failure due to version file issues
Symptom
Certain VMs in the vBRAS-CP fail to start up correctly.
Common causes
The following are the common causes of this type of issue:
· The software version of the faulty VM is inconsistent with the software version used by the vBRAS-CP.
· The software version file of the faulty VM is damaged.
· Software version update has been performed based on initial deployment of the faulty VM.
Troubleshooting flow
Figure 34 shows the troubleshooting flowchart.
Figure 34 Troubleshooting flowchart
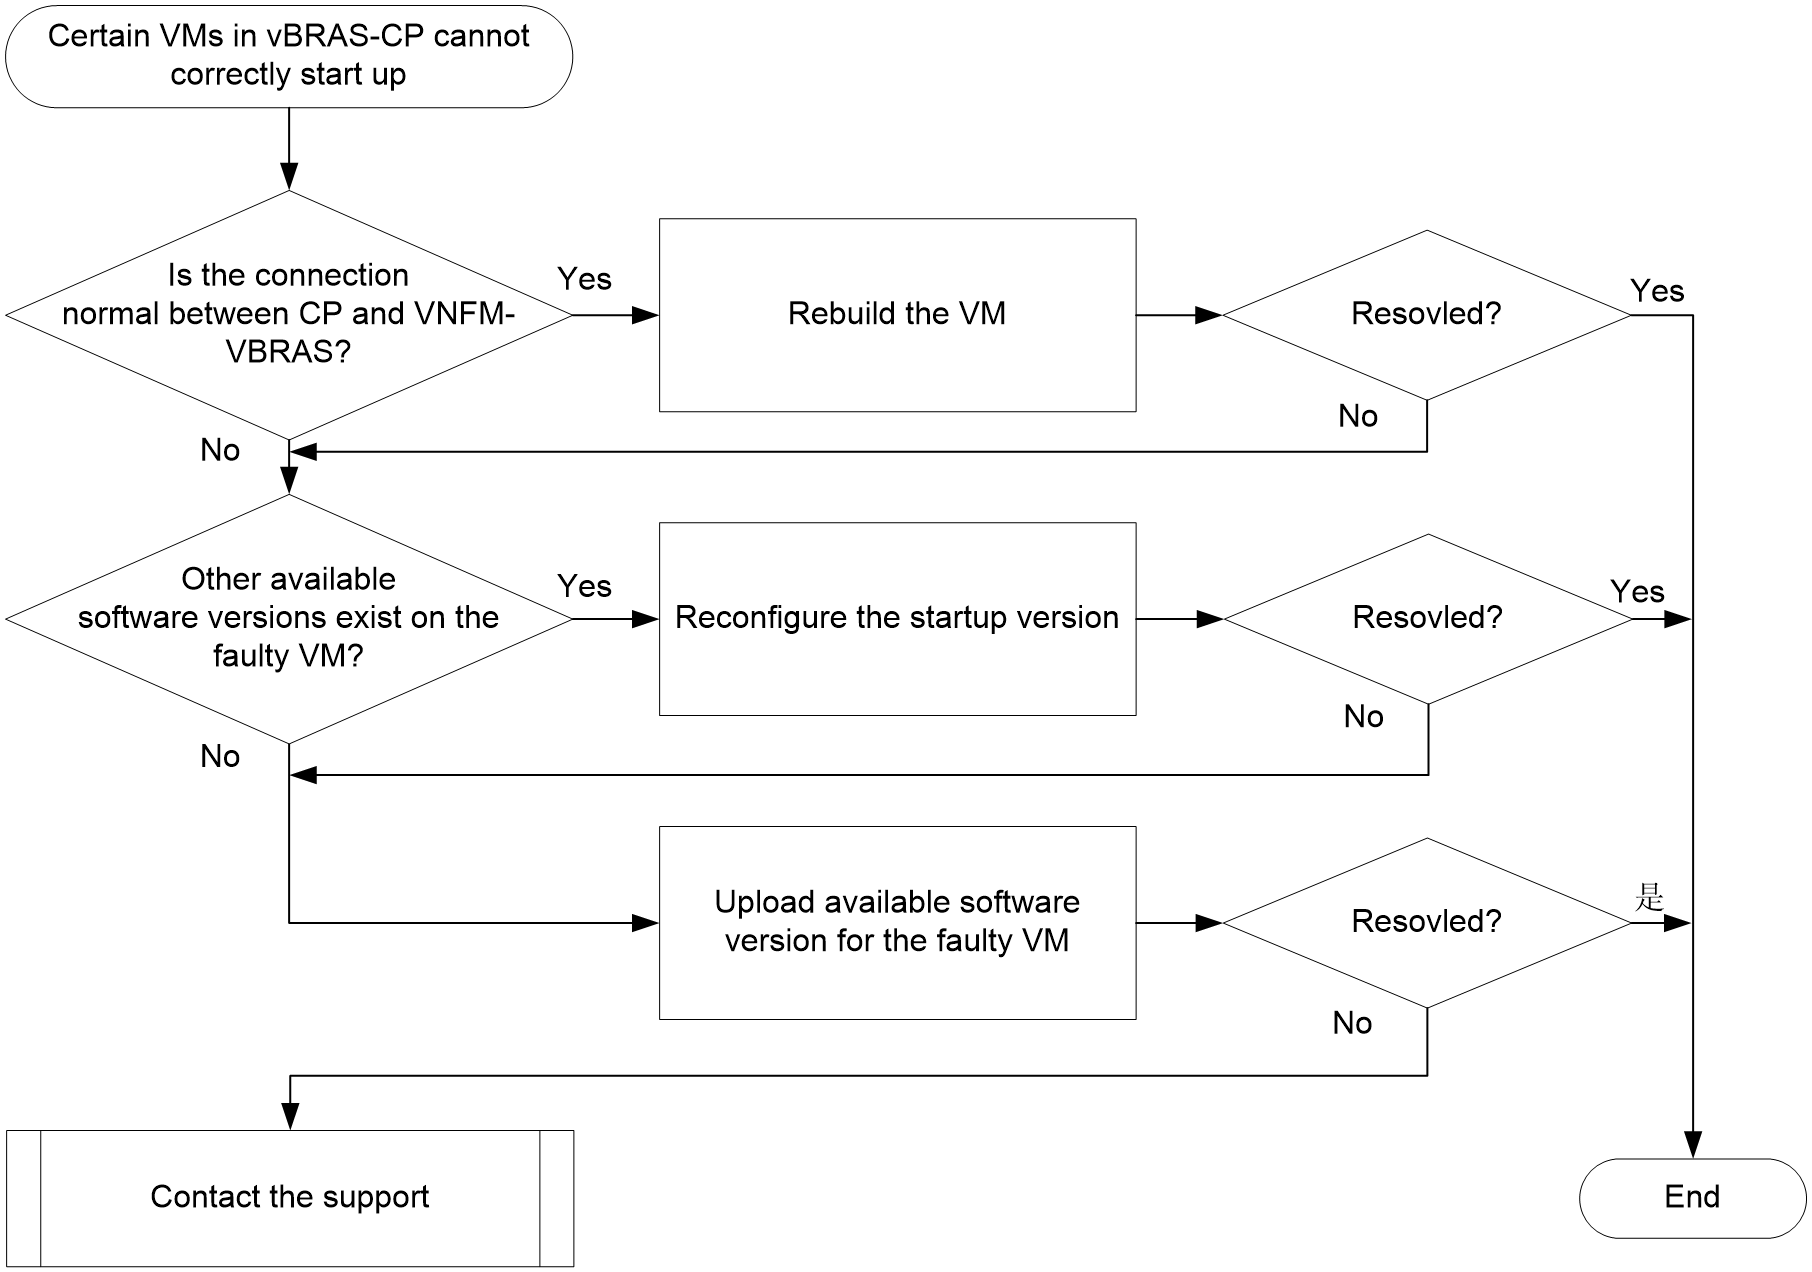
Solution
1. Verify that the connection between the vBRAS-CP and VNFM-vBRAS is correct.
Execute the display vbras-cp stable state vnfm command in any view on the CTRL-VM to verify that the direct connection between the CP and VNFM-vBRAS is correct.
¡ If the connection between the vBRAS-CP and VNFM-vBRAS is correct, proceed to step 2.
¡ If the connection between the vBRAS-CP and VNFM-vBRAS is terminated, proceed to step 3.
2. Log in to the Web interface of VNFM-vBRAS to rebuild the faulty VM.
a. Enter http://IP address:30000/uclogin/view/login.html in the browser address bar on the local PC to launch the Unified Platform login page. The IP address is the northbound service virtual IP address of the cluster, and 30000 is the default port number.
b. Enter the username and password and log in to Unified Platform.
|
|
NOTE: · The factory default account and password of Unified Platform are version specific. This document uses E0611 as an example. · For version E0611, the factory default username is admin and the password is Pwd@12345. · You can customize the username and password and log in with your own account. |
c. Click the vBRAS management menu on the top navigation bar to enter
the vBRAS management page. On the vBRAS resource page of deployment management,
select the faulty VM, and click the rebuild icon ![]() in the Actions column for the VM. In the confirmation dialog
box that opens, click OK to rebuild the VM. VNFM-vBRAS first deletes the
original VM and then rebuilds it. The version for original deployment is
loaded.
in the Actions column for the VM. In the confirmation dialog
box that opens, click OK to rebuild the VM. VNFM-vBRAS first deletes the
original VM and then rebuilds it. The version for original deployment is
loaded.
|
|
IMPORTANT: If version upgrade has been performed for the vBRAS-CP, the rebuilt VM is still the version for original deployment. You need to upgrade the rebuilt VM to the software version of the vBRAS-CP. For how to upgrade the software version for the vBRAS-CP, see the installation and deployment guide. |
d. After completing rebuilding, verify that the VM can start up correctly. If the issue persists, proceed to step 3.
3. Enter the BootWare page of the faulty VM.
To enter the BootWare page of the vBRAS-CP faulty VM, press CTRL+B. The CAS cloud computing management platform might fail to respond to your input. In this case, you can enter the BootWare page in the following situations:
Situation 1: If the CAS cloud computing management platform does not respond, perform the following operations:
a. Use the MobaXterm software to log in to the back end of the server where the faulty VM resides.
b. Execute the virsh command to enter the virsh CLI, and use the list command to obtain the name of the VM for which you want to enter the BootWare page.
[root@CVK3594 ~]# virsh
Welcome to virsh, the virtualization interactive terminal.
Type: 'help' for help with commands
'quit' to quit
virsh # list
Id Name State
----------------------------------------------------
1 vUP1_1-82 running
2 CP1_BRAS-VM_97-140 running
3 CP1_CTRL-VM_1-138 running
4 CP1_FWD-VM_5-142 running
virsh #
c. Obtain the faulty VM name, and select the faulty VM on the CAS cloud computing management platform page, power it off, and then start it up. Then immediately return to the SSH console to enter the send-key --domain DOMAINNAME KEY_LEFTCTRL KEY_B command. (You can edit the command in advance to facilitate operation. DOMAINNAME is the name of the faulty VM.) You can enter the command multiple times to enter the BootWare page of the faulty VM. If you successfully enter the BootWare page, proceed to step 4.
virsh # send-key --domain CP1_FWD-VM_5-142 KEY_LEFTCTRL KEY_B
^[[A
^[[A
virsh # send-key --domain CP1_FWD-VM_5-142 KEY_LEFTCTRL KEY_B
virsh # send-key --domain CP1_FWD-VM_5-142 KEY_LEFTCTRL KEY_B
virsh # send-key --domain CP1_FWD-VM_5-142 KEY_LEFTCTRL KEY_B
d. If you fail to enter the BootWare page, repeat step c. If the issue persists, proceed to step 7.
Situation 2: If the CAS cloud computing management platform can respond to your input, perform the following operations:
a. Enter http://IP address:8080/cas or https://IP address:8443/cas in the browser address bar on the local PC to launch the CAS cloud computing management platform. The IP address is the management IP address of the primary CVM host. 8080 and 8443 are the default port numbers.
b. Enter the username and password to log in to the cloud computing management platform.
|
|
NOTE: · The default username and password of the CAS cloud computing management platform are version specific. This document uses E0710P09 as an example. For version E0611, the default username is admin and the default password is Cloud@1234. · You can customize the username and password and log in with your own account. |
d. Enter the VM summary page, select the console tab, locate the remote console option, and then enter the Web interface of the VM. Click the send key menu and then select Ctrl+Alt+Del to reboot the VM.
e. Repeatedly press CTRL+B on the local PC to enter the BootWare page of the faulty VM. If you successfully enter the BootWare page, proceed to step 4.
f. If you fail to enter the BootWare page, try the previous steps again. If the issue persists, proceed to step 7.
¡ If other software versions exist, proceed to step 5.
¡ If no other software versions exist, proceed to step 6.
5. Reconfigure the startup version.
a. As shown in Figure 35, on the BootWare page, input 2 as prompted to enter the file control menu, and then input 3 to set the Bin file type and enter the version file selection page.
Figure 35 Version file loading page
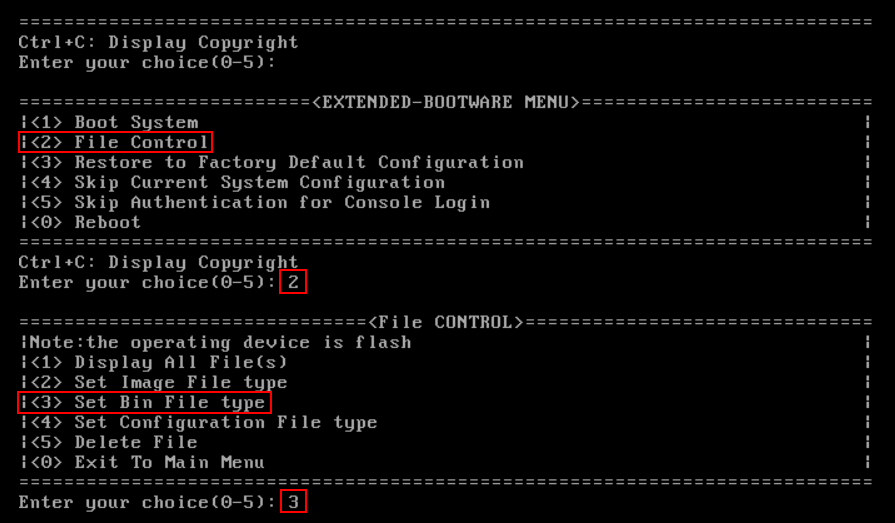
b. Select the boot, system, and devkit version files of the version according to the associated file sequence numbers. Then input 0 to quit, and then input 1.
c. After selecting version files, input 0 to quit the file control page as prompted, and then input 0 to reboot the faulty VM.
d. After the reboot is completed, verify that the VM can start up correctly. If the issue persists, proceed to step 6.
|
|
CAUTION: You cannot upload the version file through FTP or TFTP in BootWare on the CAS cloud computing management platform. |
a. On the Webpage of the CAS cloud computing management platform, select the faulty VM to edit it. In the window that opens, select the disk menu and copy the original path.
b. Power off the faulty VM on the Webpage of the CAS cloud computing management.
c. Log in to the back end of the CVM where the faulty VM resides through SSH, and specify the correct version file to the /root/ directory of the CVK.
[root@CVK3597 ~]# ll
total 94672
-rw------- 1 root root 7302 Jun 22 14:50 anaconda-ks.cfg
-rw------- 1 root root 6851 Jun 22 14:50 original-ks.cfg
-rw-r--r-- 1 root root 8351744 Aug 31 13:50 vBRAS1000-CP-FWD-CMW710-BOOT-E2022-X64.bin
-rw-r--r-- 1 root root 88573952 Aug 31 13:50 vBRAS1000-CP-FWD-CMW710-SYSTEM-E2022-X64.bin
[root@CVK3597 ~]#
d. Enter the disk source path, locate the disk file consistent with the source path on the CAS cloud computing management platform. Use guestfish -a to edit the file, and use copy-in to copy the version file to the image as follows:
[root@CVK3597 ~]# cd /vms/isos/
[root@CVK3597 isos]# ll
total 5478900
-rw-r--r-- 1 root root 123797504 Jun 25 13:53 078d6414-96f9-42d8-b79b-8fd63b45f868
-rw-r--r-- 1 root root 123863040 Jun 30 10:42 2f78cb8f-a601-45c4-bd06-eac85479d2ec
-rw-r--r-- 1 root root 121110528 Jul 29 13:47 4c6f0a6a-ebdb-4a3b-9d11-f114c4ced2d8
-rw-r--r-- 1 root root 123863040 Jun 28 11:19 72aaad31-2dfe-406b-be54-31aba377c2a9
-rw-r--r-- 1 root root 1320943616 Aug 31 11:31 7791f71f-16a8-4582-b140-7d4f17852279
-rw-r--r-- 1 root root 3013672960 Aug 31 11:28 7af588d6-61fb-4a5b-beea-f80e3bed15bc
[root@CVK3597 isos]# guestfish -a 7791f71f-16a8-4582-b140-7d4f17852279
Welcome to guestfish, the guest filesystem shell for
editing virtual machine filesystems and disk images.
Type: 'help' for help on commands
'man' to read the manual
'quit' to quit the shell
><fs>run //To run other commands, you need to run the run command first.
100% ⟦▒▒▒▒▒▒▒▒▒▒▒▒▒▒▒▒▒▒▒▒▒▒▒▒▒▒▒▒▒▒▒▒▒▒▒▒▒▒▒▒▒▒▒▒▒▒▒▒▒▒▒▒▒▒▒▒▒▒▒▒▒▒▒▒▒▒▒▒▒▒▒▒▒▒▒▒▒▒▒▒▒▒▒▒▒▒▒▒▒▒▒▒▒▒▒▒▒▒▒▒▒▒▒▒▒▒▒▒▒▒▒▒▒▒▒▒▒▒▒▒▒▒▒▒▒▒▒▒▒▒▒▒▒▒▒▒▒▒▒▒▒▒▒▒▒▒▒▒▒▒▒▒▒▒▒▒▒▒▒▒▒▒▒▒▒▒▒▒▒▒▒▒▒▒▒▒▒▒▒▒▒▒▒▒▒▒▒▒▒▒▒▒▒▒⟧ 00:00
><fs> mount /dev/sda3 / //Mount this description to the directory.
><fs> copy-in /root/vBRAS1000-CP-FWD-CMW710-BOOT-E2022-X64.bin / //Copy the version file to image.
><fs> copy-in /root/vBRAS1000-CP-FWD-CMW710-SYSTEM-E2022-X64.bin /
><fs> umount /dev/sda3 //After the operation is completed, unmount it. The file at the specified location is successfully edited.
><fs> quit
e. Power on the VM on the CAS cloud computing management platform, enter the BootWare page of the faulty VM, and select the uploaded version file as the startup file. For detailed operation procedure, see step 3 and step 5.
27 -rw- 133372 Jan 01 2000 07:55:04 startup.mdb
28 drw- - Jan 01 2000 07:47:54 tracefile
29 -rw- 8200192 Jan 25 2000 02:15:32 vBRAS1000-UP-CMW710-BOOT-E3021-X64.
bin
30 -rw- 8201216 Oct 05 2000 10:45:40 vBRAS1000-UP-CMW710-BOOT-E3021P05-X
64.bin
31 -rw- 8317952 Jan 02 2001 10:34:14 vBRAS1000-UP-CMW710-BOOT-E3022-X64.
bin
32 -rw- 9467904 Jan 25 2000 02:16:10 vBRAS1000-UP-CMW710-DEVKIT-E3021-X6
4.bin
33 -rw- 9467904 Oct 05 2000 10:45:40 vBRAS1000-UP-CMW710-DEVKIT-E3021P05
-X64.bin
34 -rw- 9596928 Jan 02 2001 10:34:14 vBRAS1000-UP-CMW710-DEVKIT-E3022-X6
4.bin
35 -rw- 22734848 Sep 08 2021 17:34:52 vBRAS1000-UP-CMW710-PACKET-CAPTURE-
E3022-X64.bin
36 -rw- 88110080 Jan 25 2000 02:16:06 vBRAS1000-UP-CMW710-SYSTEM-E3021-X6
4.bin
37 -rw- 88312832 Oct 05 2000 10:45:40 vBRAS1000-UP-CMW710-SYSTEM-E3021P05
-X64.bin
38 -rw- 97087488 Jan 02 2001 10:34:14 vBRAS1000-UP-CMW710-SYSTEM-E3022-X6
4.bin
39 -rw- 119580 Jan 05 2001 07:10:10 version.log
32476656 KB total (32078432 KB free)
f. After loading the version file and reboot the VM, verify that the VM can start up correctly. If the issue persists, proceed to step 7.
7. If the issue persists, collect the following information and contact Technical Support:
¡ Results of each step.
¡ The configuration file, log messages, and alarm messages.
VM registration failure
This section uses a vBRAS1000-CP VM as an example.
Unless otherwise stated, VMs in this section are unregistered BRAS-VMs or FWD-VMs.
CTRL-VMs communicate with each other through LIPC. Therefore, standby CTRL-VMs do not need to register to the master CTRL-VM.
Symptom
vBRAS1000-CP VM registration failure
· BRAS-VMs and FWD-VMs are not registered to the current master CTRL-VM, and the master CTRL-VM cannot manage the BRAS-VMs and FWD-VMs. Execute the display vm command on the CTRL-VM. If the value for the Registration field of a VM is Unregistered, the VM has failed to register to the CTRL-VM.
<CTRL-VM>display vm
Abbreviation: R-Role M-Master S-Standby MD-MAD down DING-DESTROYING
Slot VM name Type State(R) Registration
1 ctrl-vm-1 CTRL-VM Normal(M) --
2 -- CTRL-VM Absent(-) --
5 fwd-vm-5 FWD-VM Normal(-) Registered
6 -- FWD-VM Absent(-) Unregistered
97 bras-vm-97 BRAS-VM Normal(M) Registered
98 -- BRAS-VM Absent(-) Unregistered
vBRAS1000-vUP VM registration failure
· LPU-VMs are not registered to the current master MPU-VM, and the master MPU-VM cannot manage the LPU-VMs. Execute the display vm command on the MPU-VM. If the value for the Registration field of a VM is Unregistered, the VM has failed to register to the MPU-VM.
<MPU-VM>display vm
Abbreviation: R-Role M-Master S-Standby I-IO MD-MAD down DING-DESTROYING
Slot VM name Type State(R) Registration
1 mpu-vm-1 MPU-VM Normal(M) --
2 -- MPU-VM Absent(-) --
5 lpu-vm-5 LPU-VM Normal(I) Registered
6 -- LPU-VM Absent(-) Unregistered
Common causes
The following are the common causes of this type of issue:
· VM creation failure.
· The VM is not powered on.
· The VM is starting.
· An exception occurred on the control link between the VM and the CTRL-VM.
· An exception occurred on the NETCONF channel between the VM and the CTRL-VM.
· An exception occurred on the SSH connection between the VM and the CTRL-VM.
· The initialization mode was not professional for the VM when a compute node was added to CloudOS.
Troubleshooting flow
Figure 36 shows the troubleshooting flowchart.
Figure 36 VM registration failure troubleshooting flowchart
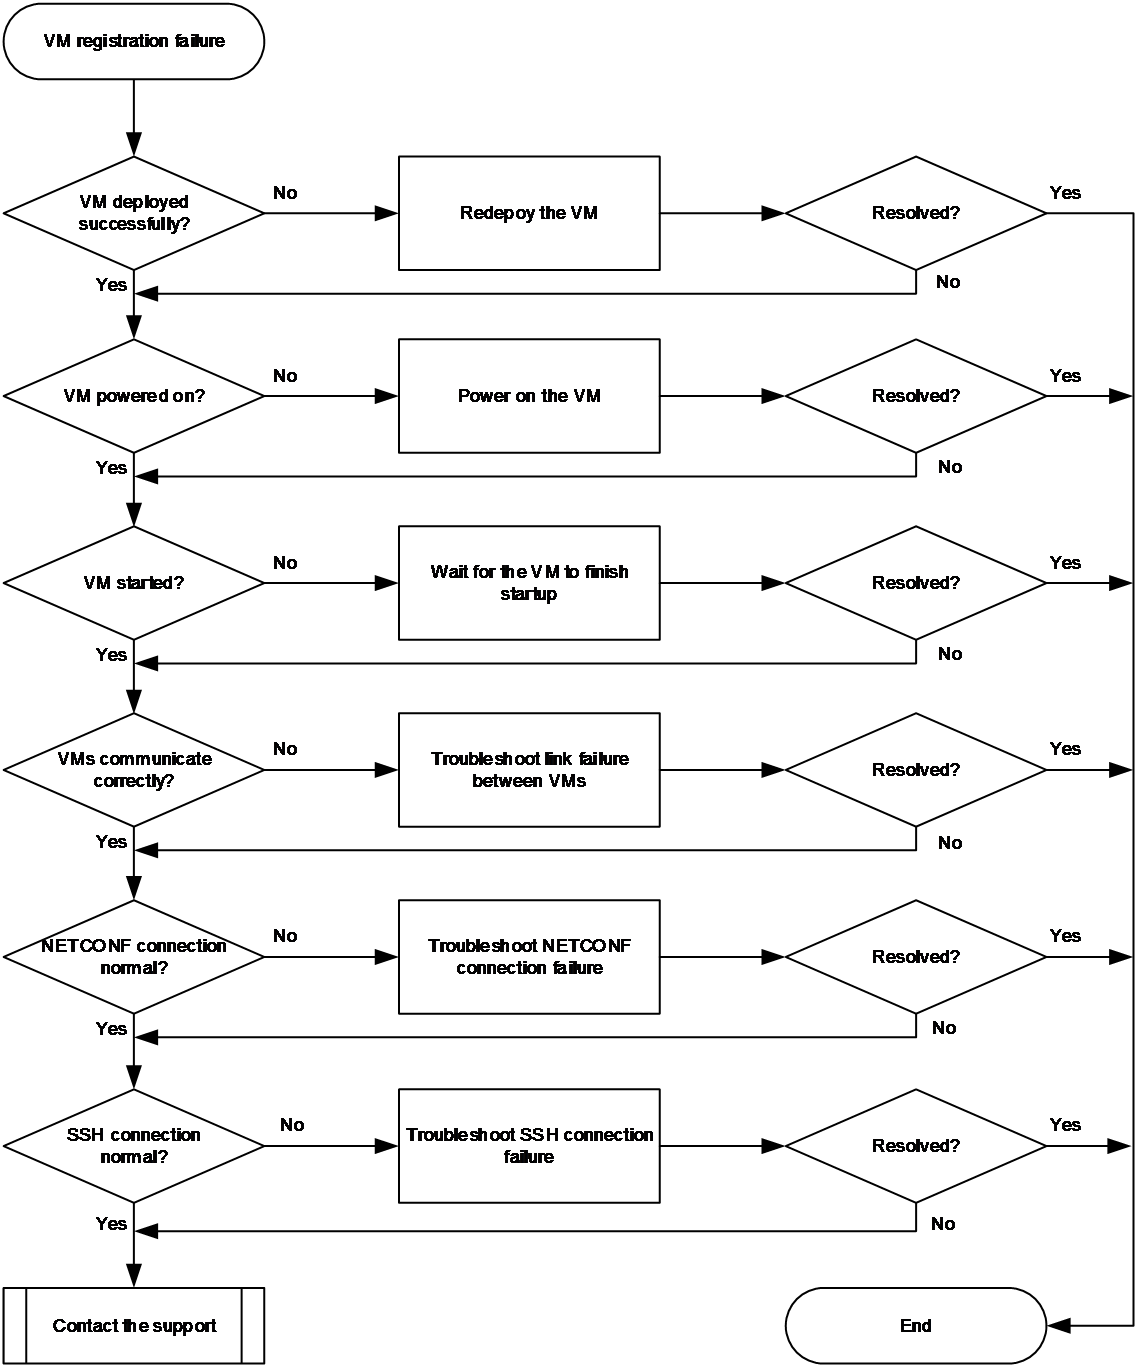
Solution
1. Identify whether the VM is deployed successfully.
2. Execute the display vm command on the CTRL-VM:
¡ If the value for the State(R) field in the output from the command is Normal, the VM is deployed successfully.
¡ If the value for the State(R) field in the output from the command is Absent, the VM is not deployed or has failed to be deployed. For more information, see "VM deployment failure" and "VM creation or startup failure due to insufficient resources."
3. Go to step 2 if the VM still cannot be registered after it is deployed successfully.
<Sysname> display vm
Abbreviation: R-Role M-Master S-Standby MD-MAD down DING-DESTROYING
Slot VM name Type State(R) Registration
1 ctrl-vm-1 CTRL-VM Normal(M) --
2 -- CTRL-VM Absent(-) --
5 fwd-vm-5 FWD-VM Normal(-) Registered
6 -- FWD-VM Absent(-) Unregistered
97 bras-vm-97 BRAS-VM Normal(M) Registered
98 -- BRAS-VM Absent(-) Unregistered
4. Identify whether the VM is powered on.
Log in to the CAS CVM at http://IP address:8080/cas, where IP address represents management IP address of the primary CVM. Navigate to the Resources > Compute > Host Pool Name > Cluster Name > Host Name, or Compute > Host Pool Name > Host Name > VM Name page.
¡ If the icon is green for the VM, the VM is powered on.
¡ If the icon is red for the VM, the VM is not powered on. Power on the VM from the CAS CVM.
5. Go to step 2 if the VM still cannot be registered after it is powered on.
Figure 37 Accessing the VM management page on CAS CVM
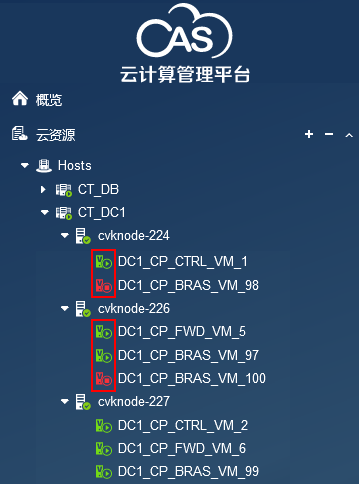
6. Identify whether the VM is starting.
Click the ![]() icon in the administration area of CAS CVM to access the task
console to identify whether the VM is starting. It takes about 1 to 5 minutes
for a VM to complete registration after it is powered on.
icon in the administration area of CAS CVM to access the task
console to identify whether the VM is starting. It takes about 1 to 5 minutes
for a VM to complete registration after it is powered on.
7. Go to step 4 if the VM still cannot be registered after it starts.
8. Identify whether the number of optical drivers is 2.
Access the VM summary page on CAS CVM to view hardware information for the VM.
¡ If the number of optical drivers is 2, the drivers are operating correctly.
¡ If the number of optical drivers is not 2, driver failure has occurred. Perform the following steps:
- Delete the failed VM, and then navigate to the Cloud Resources > Virtualization > Compute Nodes page on CloudOS.
- Click Edit in the Actions column for the compute node where the failed VM resides.
- Click Refresh, change the cloud host initialization mode to Professional, and then click OK.
9. Go to step 6 if the number of optical drivers is 2, the VM initialization mode is processional, and the VM still cannot be registered.
10. Identify whether unregistered BRAS-VMs or FWD-VMs can communicate with the CTRL-VM correctly.
A VM uses the control tunnel for registration. Execute the ping -vpn-instance vpn-instance-name host command in any view of the CTRL-VM to identify whether the VM control tunnel IP address can be pinged successfully.
¡ If it can be pinged successfully, go to step 6.
¡ If the ping operation fails, remove the link failure between the VM and the CTRL-VM with the help of Technical Support.
In the ping command, the value for the vpn-instance-name argument is fixed at __vm_private_ctrl_vpn. The value for the host argument is the IP address of the control channel between the unregistered FWD-VM and the BRAS-VM. Execute the more ovf-env-startup.xml command in user view of the CTRL-VM, and then check the control-network-segment field for the subnet to which the IP address of the VM control channel belongs.
¡ The IP address of the control channel on the FWD-VM in slot 5 is X.X.X.2.
¡ The IP address of the control channel on the FWD-VM in slot 6 is X.X.X.3.
¡ The IP address of the control channel on BRAS-VM is X.X.X.group-id, where group-id is the group which the BRAS-VM belongs. Two BRAS-VMs belong to one group. Group IDs start from 66. For example, the IP address of the control channel on the BRAS-VMs in slots 97 and 98 is X.X.X.66, and the IP address of the control channel on BRAS-VMs in slots 99 and 100 is X.X.X.67.
<CTRL-VM> more ovf-env-startup.xml
<?xml version="1.0" encoding="UTF-8"?>
<Environment
Omitted...
<Property oe:key="CU-MAC" oe:value="stackmemberid:1;domain:1;datamac:0cda411df706;controlmac:0cda411d7a06;vm-name:ctrl-vm-1;control-tunnel-vlan:11;control-network-segment:192.168.1.1/16;data-tunnel-vlan:22;data-network-segment:192.158.1.1/16;"/>
</PropertySection>
</Environment>
11. Identify whether the NETCONF sessions between unregistered BRAS-VMs or FWD-VMs and the CTRL-VM are normal.
# Access the console of the VM from CAS CVM, and then execute the display netconf session command in any view of the VM.
# Display NETCONF session information on the BRAS-VM in slot 97.
[Sysname-vm-net-slot97] display netconf session
Session ID: 1 Session type : Agent
Username : __private_admin_user__
Login time : 2021-09-07T11:25:53
Client IP address : 192.168.0.1
Session statistics:
Received RPCs : 10 Received bad RPCs : 0
Output RPC errors: 1 Output notifications: 0
Session ID: 2 Session type : Agent
Username : __private_admin_user__
Login time : 2021-09-07T11:25:53
Client IP address : 192.168.0.1
Session statistics:
Received RPCs : 6 Received bad RPCs : 0
Output RPC errors: 0 Output notifications: 0
Session ID: 3 Session type : Agent
Username : __private_admin_user__
Login time : 2021-09-07T11:25:53
Client IP address : 192.168.0.1
Session statistics:
Received RPCs : 8 Received bad RPCs : 0
Output RPC errors: 0 Output notifications: 0
¡ If the output from the command contains three agent-type NETCONF sessions and the value for the Username field is __private_admin_user__, and the value for the Client IP address field is the IP address of the CTRL-VM control channel, go to step 8.
¡ If the NETCONF sessions are abnormal, identify whether NETCONF over SSH is enabled.
# Access the console of the VM from CAS CVM, and then execute the display netconf service command in any view of the VM.
[Sysname-vm-net-slot97] display netconf service
NETCONF over SOAP over HTTP: Disabled (port 80)
NETCONF over SOAP over HTTPS: Disabled (port 832)
NETCONF over SSH: Enabled (port 830)
NETCONF over Telnet: Enabled
NETCONF over Console: Enabled
SOAP timeout: 10 minutes Agent timeout: 0 minutes
Active Sessions: 3
Service statistics:
NETCONF start time: 2021-09-07T09:37:07
Output notifications: 6
Output RPC errors: 2
Dropped sessions: 3
Sessions: 6
Received bad hellos: 0
Received RPCs: 72
Received bad RPCs: 0
- If the value for the NETCONF over SSH field is Enabled, go to step 8.
- If the value for the NETCONF over SSH field is Disabled, execute the following command to enable NETCONF over SSH.
[Sysname-vm-net-slot97] netconf ssh server enable
12. Identify whether the SSH sessions between unregistered BRAS-VMs or FWD-VMs and the CTRL-VM are normal.
# Access the console of the VM from CAS CVM, and then execute the display SSH server session command in any view of the VM.
[Sysname-vm-net-slot97] display ssh server session
UserPid SessID Ver Encrypt State Retries Serv Username
801 0 2.0 aes128-ctr Established 0 NETCONF __private_admin_user__
802 0 2.0 aes128-ctr Established 0 NETCONF __private_admin_user__
803 0 2.0 aes128-ctr Established 0 NETCONF __private_admin_user__
3363 0 2.0 aes128-ctr Established 0 Stelnet __private_admin_user__
¡ If the output from the command contains three NETCONF sessions, the value for the Username field is __private_admin_user__, and the value for the Serv field is NETCONF for all the three sessions, go to step 10.
¡ If not, perform the following steps:
# Execute the display ssh server status command to identify whether Stelnet server is enabled.
[Sysname-vm-net-slot97] display ssh server status
Stelnet server: Enable
SSH version : 2.0
SSH authentication-timeout : 60 second(s)
SSH server key generating interval : 0 hour(s)
SSH authentication retries : 3 time(s)
SFTP server: Enable
SFTP Server Idle-Timeout: 10 minute(s)
NETCONF server: Enable
SCP server: Disable
If the value for the Stelnet server field is Disable, execute the following command to enable Stelnet server.
[Sysname-vm-net-slot97] ssh server enable
# Identify whether the local vmmgrpublickey on the CTRL-VM is the same as that saved on the BRAS-VM or FWD-VM.
View information about public key vmmgrpublickey on the CTRL-VM.
<Sysname> display public-key local rsa public name vmmgrpublickey
=============================================
Key name: vmmgrpublickey
Key type: RSA
Key length: 1024
Time when key pair created: 11:10:54 2021/09/22
Key code:
30819F300D06092A864886F70D010101050003818D0030818902818100AB0FF5506AD71A75
A775479827EB14B5584CB4E59BC154FC2C80F708A2241F2E7801C6B8863B31BD85B6F64622
1996E5FD8A04EB4ABEAC7A6A26FB2AC8CC38C1DB88DC9C3A6347765485C28190D9E7DD386C
F00AEB30D3D06D437BE1328B9E6914103726E0D9CEEB203AD2B237732225526B858C89BBF7
B195EDDDB2103E5F130203010001
View information about peer public key vmmgrpublickey on the VM.
[Sysname-vm-net-slot97] display public-key peer name vmmgrpublickey
=============================================
Key name: vmmgrpublickey
Key type: RSA
Key length: 1024
Key code:
30819F300D06092A864886F70D010101050003818D0030818902818100AB0FF5506AD71A75
A775479827EB14B5584CB4E59BC154FC2C80F708A2241F2E7801C6B8863B31BD85B6F64622
1996E5FD8A04EB4ABEAC7A6A26FB2AC8CC38C1DB88DC9C3A6347765485C28190D9E7DD386C
F00AEB30D3D06D437BE1328B9E6914103726E0D9CEEB203AD2B237732225526B858C89BBF7
B195EDDDB2103E5F130203010001
[Sysname-vm-net-slot97]]
- If the public key on the CTRL-VM is not the same as the key code on the VM, restart the VM. After the VM is restarted, it synchronizes the public key on the CTRL-VM automatically and re-registers to the CTRL-VM.
- If the public keys are the same, go to step 10.
13. If the issue persists, collect the following information and contact Technical Support:
¡ Results of each step.
¡ The configuration file, log messages, and alarm messages.
Related alarm and log messages
Alarm messages
Module name: HH3C-VNF-DEVICE-MIB
· hh3cVmUnregisterLongtime (1.3.6.1.4.1.25506.2.196.3.0.11)
Log messages
N/A
Subnet request and release failure of BRAS-VMs
· Subnets include IP subnets, IPv6 subnets, and prefixes.
· This issue is typically found in L2TP, NAT-CENTRAL, ODAP address pools.
· This section troubleshoots issues caused by communication failure between CTRL-VM and BRAS-VMs. For information about how to troubleshoot the issue that a CP fails to receive DHCP address request and release packets because of connection failures between the CP and UPs, see "CP-UP connection management issues."
Symptom
· A BRAS-VM cannot request subnets from the CTRL-VM. No assigned subnet information exists when the following commands are executed:
¡ display dhcp dynamic-alloc address
¡ display ipv6 dhcp dynamic address
¡ display ipv6 dhcp dynamic prefix
· If you execute the following commands after you execute the reset dhcp { l2tp | nat-central | odap } subnet/reset ipv6 dhcp odap subnet command on the CTRL-VM, the released subnet still exist:
¡ display dhcp dynamic-alloc address
¡ display ipv6 dhcp dynamic address
¡ display ipv6 dhcp dynamic prefix
Common causes
The following are the common causes of this type of issue:
· The BRAS-VM is not registered to the CTRL-VM.
· An exception occurred on the DHCP connection between the BRAS-VM and the CTRL-VM.
· The subnet resources on the CTRL-VM have been used up.
Troubleshooting flow
Figure 38 shows the troubleshooting flowchart.
Figure 38 Troubleshooting flowchart for subnet request and release failure of BRAS-VMs
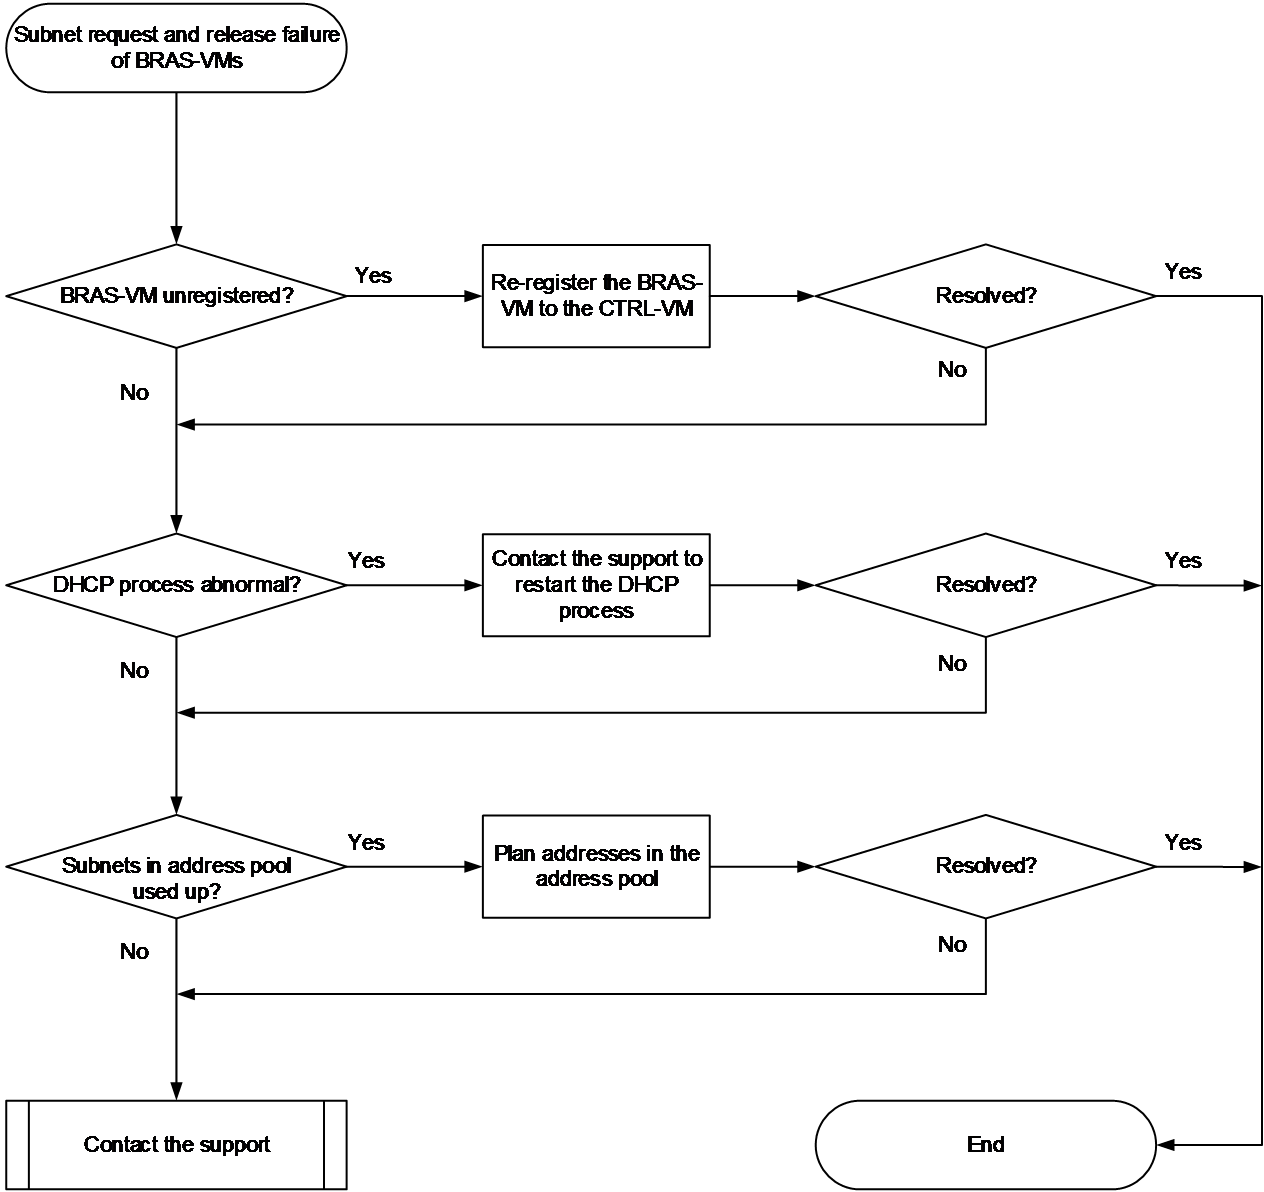
Solution
1. Identify whether the BRAS-VM is registered to the CTRL-VM successfully.
2. If the BRAS-VM is not registered to the CTRL-VM, the CTRL-VM cannot manage the BRAS-VM.
3. Execute the display vm command on the CTRL-VM.
<Sysname> display vm
Abbreviation: R-Role M-Master S-Standby MD-MAD down DING-DESTROYING
Slot VM name Type State(R) Registration
1 ctrl-vm-1 CTRL-VM Normal(M) --
6 -- FWD-VM Absent(-) Unregistered
97 bras-vm-1 BRAS-VM Normal(M) Registered
98 bras-vm-2 BRAS-VM Normal(S) Registered
¡ If the value for the Registration field is Registered, the BRAS-VM is registered to the CTRL-VM successfully.
¡ If the value for the Registration field is Unregistered, the BRAS-VM is not registered to the CTRL-VM. If the BRAS-VM is not registered to the CTRL-VM, see "VM registration failure" to troubleshoot the issue.
4. Identify the DHCP connection between a BRAS-VM and the CTRL-VM.
Subnet release and request by a BRAS-VM is done by the DHCP connection between that BRAS-VM and the CTRL-VM. Internal packet exchange will failure if a DHCP connection failure occurs.
Execute the display system internal dhcp server bras-connection or display system internal ipv6 dhcp server bras-connection command in probe view of the CTRL-VM to display information about the DHCP connection between a BRAS-VM and the CTRL-VM.
[Sysname-probe] display system internal dhcp server bras-connection
IP address Connected at
192.159.0.66 Jun 22 05:45:49 2022
[Sysname-probe] display system internal ipv6 dhcp server bras-connection
IP address Connected at
192.159.0.66 Jun 22 05:45:49 2022
¡ If the IP address and Connected at fields display connection information for the BRAS-VM, the DHCP connection between the BRAS-VM and the CTRL-VM is normal.
¡ If the IP address and Connected at fields do not display connection information for the BRAS-VM, the DHCP connection between the BRAS-VM and the CTRL-VM is abnormal. If no other connection failures exist, contact Technical Support to restart the DHCP process and restore the DHCP connection.
5. Identify whether the subnet resources on the CTRL-VM have been used up.
Execute the exhaustion log enable command in address pool view to enable IP resource exhaustion logging for an IP pool or IP pool group. If DHCPS/4/DHCPS_NET_EXHAUST, DHCPS6_IP_NET_EXHAUST, or DHCPS6_PD_NET_EXHAUST is displayed on the CTRL-VM, the subnet resources in the address pool on the CTRL-VM have been used up. You must re-plan the addresses in the address pool.
|
|
CAUTION: To avoid reclamation of subnets that have been assigned and logoff of clients that have obtained addresses from the subnets, do not delete an existing address pool for address re-plan. You can add an address pool or add secondary subnets in the original address pool. |
6. If the issue persists, collect the following information and contact Technical Support:
¡ Results of each step.
¡ The configuration file, log messages, and alarm messages.
¡ Execute the debugging dhcp server and debugging ipv6 dhcp server commands to enable DHCP debugging.
Related alarm and log messages
Alarm messages
None.
Log messages
· DHCPS/4/DHCPS_NET_EXHAUST
· DHCPS6_IP_NET_EXHAUST
High CPU control core usage on a VM
Symptom
In a vBRAS system, the forwarding plane provides forwarding plane services to forward data packets and control traffic and the control plane provides control plane services. As a result, CPUs on a VM in the vBRAS system contain a forwarding core and a control core. It is normal for the forwarding core to have a high CPU usage, because a large number of packets need to be forwarded in the network. However, a high control core CPU usage can affect the processing capacity of the system and cause service anomaly, because the control core controls device operation and packet forwarding. This document only describes troubleshooting of high CPU control core usage issues.
A VM has a high CPU control core usage when one of the following conditions is met:
· The output from the display cpu-usage command shows that the CPU usage keeps higher than 80% when the command is executed multiple times.
# Use the display cpu-usage summary command to display the average CPU usage in the last 5 seconds, 1 minute, and 5 minutes.
<CTRL-VM> display cpu-usage summary
Slot CPU Last 5 sec Last 1 min Last 5 min
1 0 85% 81% 16%
5 0 0% 0% 0%
97 0 0% 0% 0%
# Use the display cpu-usage history command to display the CPU usage statistics for the most recent 60 sampling points in a graph and identify whether the CPU usage is always higher than 80%. In the graph,
¡ CPU usage is displayed on the vertical Y-axis with a precision. For example, when the the precision is 5%, value 53% is displayed as 55% and value 52% is displayed as 50%.
¡ Time is displayed on the horizontal X-axis. The closer to the left, the closer to the current time.
¡ CPU usage at a timepoint is displayed as consecutive number signs (#). The value on the Y-axis of the highest number sign at a timepoint is the CPU usage of that sampling point. You can use the monitor cpu-usage interval command to configure the sampling interval. The default sampling interval is one minute.
<Sysname> display cpu-usage history
100%|
95%|
90%|
85%|
80%|#
75%|#
70%|#
65%|#
60%|#
55%|#
50%|#
45%|#
40%|#
35%|#
30%|#
25%|#
20%|#
15%|# #
10%|# ### #
5%|# ########
------------------------------------------------------------
10 20 30 40 50 60 (minutes)
cpu-usage (Slot 1 CPU 0) last 60 minutes (SYSTEM)
…
The output shows the CPU usage of SYSTEM on Slot 1 CPU 0 within the last 60 minutes. The CPU usages were as follows:
¡ 80%—1 minute ago
¡ 5%—12 minutes ago
¡ 10%—13 minutes ago
¡ 15%—14 minutes ago
¡ 10%—15 minutes ago
¡ 5%—16 minutes ago
¡ 5%—17 minutes ago
¡ 10%—18 minutes ago
¡ 5%—19 minutes ago
¡ Not higher than 2% at other timepoints.
· The device responds slowly and gets stuck when you log in to it through Telnet or SSH.
· The device generates logs about high CPU usage.
· SNMP generates notifications about high CPU usage.
Common causes
The following are the common causes of this type of issue:
· Network attacks.
· Protocol flappings, typically routing protocol flappings.
· Heavy traffic or high sampling frequency when flow sampling is enabled on the device.
· Generation and management of a large number of log messages.
Troubleshooting flow
Figure 39 shows the troubleshooting flowchart.
Figure 39 Flowchart for troubleshooting high CPU control core usage on a VM
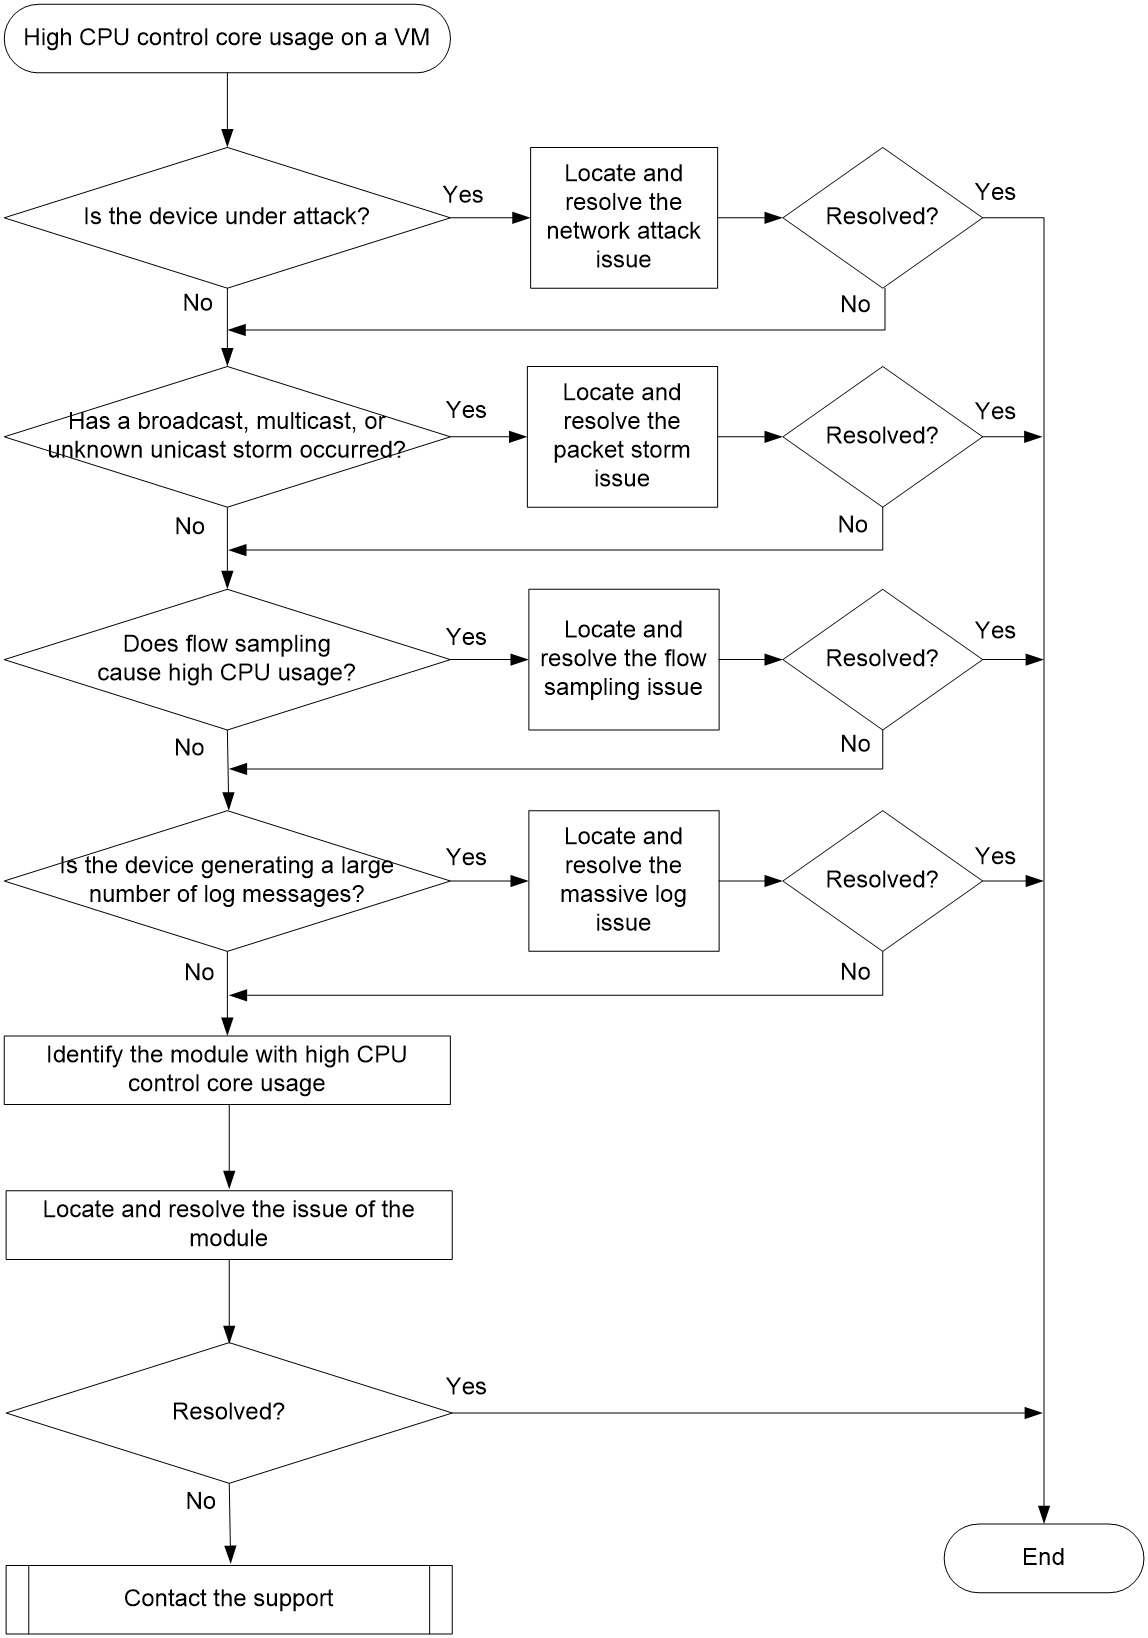
Solution
1. Identify whether the device is under network attack.
On a live network, the most common reason for high CPU usage is network attack. The attacker initiates a large number of abnormal network interactions, such as sending a large number of TCP connection establishment requests or ICMP requests in a short period of time. Processing these attacking packets greatly consumes the CPU resources of the device and affects the services.
Use the display system internal control-plane statistics command to view statistics for the control plane. If the Dropped field displays a large value and the CPU usage is high, the device might be under packet attack.
<CTRL-VM-vm-net> display system internal control-plane statistics slot 1
Control plane slot 1
Protocol: Default
Bandwidth: 15360 (pps)
Forwarded: 108926 (Packets), 29780155 (Bytes)
Dropped : 0 (Packets), 0 (Bytes)
Protocol: ARP
Bandwidth: 512 (pps)
Forwarded: 1489284 (Packets), 55318920 (Bytes)
Dropped : 0 (Packets), 0 (Bytes)
Protocol: HTTP
Bandwidth: 1024 (pps)
Forwarded: 0 (Packets), 0 (Bytes)
Dropped : 0 (Packets), 0 (Bytes)
Protocol: HTTPS
Bandwidth: 1024 (pps)
Forwarded: 0 (Packets), 0 (Bytes)
Dropped : 0 (Packets), 0 (Bytes)
Protocol: NTP
Bandwidth: 1024 (pps)
Forwarded: 0 (Packets), 0 (Bytes)
Dropped : 0 (Packets), 0 (Bytes)
…
¡ If the device is under network attack, resolve the network attack issue first.
¡ If the device is not under attack, proceed to step 2.
When a loop exists in the access link of the VM, the switch might forward a large number of broadcast, multicast, or unknown unicast packets to the vCP. The vCP redirects the packets to the CPU for processing, causing high CPU usage. To identify whether a broadcast, multicast, or unknown unicast storm has occurred:
a. Clear statistics on the interface.
<CTRL-VM> reset counters interface
b. Access the VM network setup environment and enter its user view. Execute the display counters rate inbound interface command multiple times and identify whether the interface usage significantly increases. You can view statistics about internal MGE and VMC interfaces only in the VM network setup environment.
<CTRL-VM> system-view
[CTRL-VM] switchto vm-net-setup
Enter password:
As a best practice, use the default VM network setup. Changes in the VM network
setup environment might cause the CP to malfunction. If you need to change a set
ting, make sure you understand its impact on the services.
<CTRL-VM-vm-net> display counters rate inbound interface
Usage: Bandwidth utilization in percentage
Interface Usage(%) Total(pps) Broadcast(pps) Multicast(pps)
XGE5/3/0 0.01 7 -- --
MGE0/31/0 0.01 1 -- --
MGE0/32/0 0.01 5 -- --
VMC1/1/0 0.05 60 -- --
VMC1/2/0 0.04 52 -- --
Overflow: More than 14 digits.
--: Not supported.
<CTRL-VM-vm-net>
c. If the interface usage significantly increases, execute the display counters inbound interface command multiple times to view the Total(pkt), Broadcast(pkt), and Multicast(pkt) fields in the output.
If the number of broadcast or multicast packets significantly increases and broadcast or multicast packets take a large portion in the total number of packets received on the interface, a broadcast or multicast storm might occur. If the numbers of broadcast and multicast packets do not significantly increase but the total number of packets received on the interface significantly increases, an unknown unicast storm might occur.
<CTRL-VM-vm-net> display counters inbound interface
Interface Total(pkt) Broadcast(pkt) Multicast(pkt) Err(pkt)
XGE5/3/0 141 27 111 0
MGE0/31/0 274866 47696 0 --
MGE0/32/0 1063034 684808 2 --
VMC1/1/0 11157797 7274558 50 0
VMC1/2/0 9653898 5619640 52 0
Overflow: More than 14 digits (7 digits for column "Err").
--: Not supported.
<CTRL-VM-vm-net> quit
[CTRL-VM] quit
<CTRL-VM>
¡ If a broadcast, multicast, or unknown unicast storm occurs, perform the following tasks:
- Verify that the access switch of the VM does not have physical links and the network topology does not have loops.
- Verify that the VLAN, port aggregation, and other settings are configured correctly.
- Apply QoS policies to the VM to configure the rate limit for multicast, broadcast, and unknown unicast packets.
¡ If no broadcast, multicast, or unknown unicast storm occurs, proceed to step 3.
When a traffic statistics collection feature, for example, NetStream or sFlow is configured on the device, heavy traffic might cause high CPU usage. To resolve this issue, perform the following tasks:
¡ Configure filtering criteria to analyze only the traffic that users are concerned about.
¡ Configure a sampler and set a proper sampling percentage to make sure the sampled data is statistically accurate and reduce the impact on the forwarding capacity of the device.
4. Identify whether the device is generating a large number of log messages.
The device keeps generating diagnostic information or log messages when a fault occurs, for example, the deivce is under attack, an operation failure occurs, or a port frequently comes up and goes down. The system software frequently reads and writes data to the storage medium and the CPU usage increases.
To identify whether the device is generating a large number of log messages, perform one of the following tasks:
¡ Log in to the device through Telnet, and configure the terminal monitor command to enable log output to the current terminal.
<CTRL-VM> terminal monitor
The current terminal is enabled to display logs.
If a large number of unexpected log messages or duplicate log messages are output to the CLI, the device is generating a large number of log messages.
¡ Use the display logbuffer command and identify whether a large number of unexpected log messages are displayed or a log message is displayed multiple times.
<CTRL-VM> display logbuffer reverse
Log buffer: Enabled
Max buffer size: 1024
Actual buffer size: 512
Dropped messages: 0
Overwritten messages: 0
Current messages: 410
%Jan 15 08:17:24:259 2021 CTRL-VM SHELL/6/SHELL_CMD: -Line=vty0-IPAddr=192.168.2.108-User=**; Command is display logbuffer
%Jan 15 08:17:19:743 2021 CTRL-VM SHELL/4/SHELL_CMD_MATCHFAIL: -User=**-IPAddr=192.168.2.108; Command display logfile in view shell failed to be matched.
%Jan 15 07:12:54:584 2021 CTRL-VM SHELL/6/SHELL_CMD: -Line=vty0-IPAddr=192.168.2.108-User=**; Command is display counters rate in
…
<CTRL-VM> display logbuffer summary
Slot EMERG ALERT CRIT ERROR WARN NOTIF INFO DEBUG
1 0 0 2 9 24 12 128 0
5 0 0 0 41 72 8 2 0
97 0 0 42 11 14 7 40 0
If the device is generating a large number of log messages, perform the following tasks to reduce the number of log messages:
¡ Disable log output for some modules.
¡ Use the info-center logging suppress command to configure log suppression for some modules.
¡ Use the info-center logging suppress duplicates command to enable duplicate log suppression.
If the device is not generating a large number of log messages, proceed to step 5.
5. Collect statistics about CPU usage and locate the module that has high CPU control core usage.
a. Identify the slot number of each VM.
# Log in to the CTRL-VM and use the display vm command to view the slot number of each VM.
<CTRL-VM> display vm
Abbreviation: R-Role M-Master S-Standby MD-MAD down DING-DESTROYING
Slot VM name Type State(R) Registration
1 DC1_CP_CTRL_VM_1 CTRL-VM Normal(M) --
2 DC1_CP_CTRL_VM_2 CTRL-VM Normal(S) --
5 DC1_CP_FWD_VM_5 FWD-VM Normal(-) Registered
6 DC1_CP_FWD_VM_6 FWD-VM Normal(-) Registered
97 DC1_CP_BRAS_VM_97 BRAS-VM Normal(M) Registered
98 DC1_CP_BRAS_VM_98 BRAS-VM Normal(S) Registered
99 DC1_CP_BRAS_VM_99 BRAS-VM Normal(M) Registered
100 DC1_CP_BRAS_VM_100 BRAS-VM Normal(S) Registered
b. Identify the CPU number of the control core on each VM.
# Log in to each VM, and use the display driver forward command on the VM to view the CPU number of the control core. Take slot 1 on the CTRL-VM as an example:
<CTRL-VM> system-view
[CTRL-VM] probe
[CTRL-VM-probe] display driver forward slot 1 enable
Fwd Statistics Enabled!
[CTRL-VM-probe] display driver forward slot 1 core
CPU STATE PLANE STATISTICS
0 USED Ctrl Fwd 0
1 USED Ctrl Fwd 0
2 USED Data Dis Rx 2196 Tx 0
3 USED Data Fwd Fwd 5183
4 USED Data Dis Rx 0 Tx 3833
The output shows that the CPU numbers of the control cores are 0 and 1 on the CTRL-VM.
# Log in to the BRAS-VM and FWD-VM by using the slot numbers of the VMs on the CTRL-VM. For example, log in to the FWD-VM of which the slot number is 5 and the IP address is 192.168.0.2:
<CTRL-VM> system-view
[CTRL-VM] switchto vm-net-setup
Enter password:
As a best practice, use the default VM network setup. Changes in the VM network
setup environment might cause the CP to malfunction. If you need to change a set
ting, make sure you understand its impact on the services.
<CTRL-VM-vm-net> switchto vm slot 5
Press CTRL+C to abort.
Connecting to 192.168.0.2 port 22.
********************************************************************************
* Copyright (c) 2004-2021 New H3C Technologies Co., Ltd. All rights reserved.*
* Without the owner's prior written consent, *
* no decompiling or reverse-engineering shall be allowed. *
********************************************************************************
<CTRL-VM-slot5>
c. Identify the processes with high CPU control core usage.
# Log in to each VM, and use the display process cpu command to view the CPU usage for all processes. Take slot 1 on the CTRL-VM as an example:
[CTRL-VM-probe] display process cpu slot 1
CPU utilization in 5 secs: 0.4%; 1 min: 0.2%; 5 mins: 0.2%
JID 5Sec 1Min 5Min Name
1 0.0% 0.0% 0.0% scmd
2 5.5% 5.1% 5.0% [kthreadd]
3 0.0% 0.0% 0.0% [ksoftirqd/0]
5 0.0% 0.0% 0.0% [kworker/0:0H]
7 0.0% 0.0% 0.0% [rcu_sched]
8 0.0% 0.0% 0.0% [rcu_bh]
9 0.0% 0.0% 0.0% [migration/0]
…
If the CPU usage of the process is higher than 5%, perform the following tasks to locate the process.
# Log in to each VM, and use the monitor process dumbtty command to view the process running state. Take slot 1 CPU 0 on the CTRL-VM as an example:
[CTRL-VM-probe] monitor process dumbtty slot 1 cpu 0
206 processes; 342 threads; 5134 fds
Thread states: 4 running, 338 sleeping, 0 stopped, 0 zombie
CPU0: 99.04% idle, 0.00% user, 0.96% kernel, 0.00% interrupt, 0.00% steal
CPU1: 98.06% idle, 0.00% user, 1.94% kernel, 0.00% interrupt, 0.00% steal
CPU2: 0.00% idle, 0.00% user, 100.00% kernel, 0.00% interrupt, 0.00% steal
CPU3: 0.00% idle, 0.00% user, 100.00% kernel, 0.00% interrupt, 0.00% steal
CPU4: 0.00% idle, 0.00% user, 100.00% kernel, 0.00% interrupt, 0.00% steal
Memory: 7940M total, 5273M available, page size 4K
JID PID PRI State FDs MEM HH:MM:SS CPU Name
322 322 115 R 0 0K 01:48:03 20.02% [kdrvfwdd2]
323 323 115 R 0 0K 01:48:03 20.02% [kdrvfwdd3]
324 324 115 R 0 0K 01:48:03 20.02% [kdrvfwdd4]
376 376 120 S 22 159288K 00:00:07 0.37% diagd
1 1 120 S 18 30836K 00:00:02 0.18% scmd
379 379 120 S 22 173492K 00:00:11 0.18% devd
2 2 120 S 0 0K 00:00:00 0.00% [kthreadd]
3 3 120 S 0 0K 00:00:02 0.00% [ksoftirqd/0]
…
- Identify the JID of processes with CPU usage higher than 5% in the output, and use the display proce job command for each process to view detailed information about the process and identify whether it is running on the control core.
If the LAST_CPU field in the output from the display proce job command displays the CPU number of the control core, for example, 0 or 1, the process is running on the control core. Further actions are required to locate the issue.
If the LAST_CPU field in the output from the display proce job command does not display the CPU number of the control core, proceed to step 6.
For example, display information for process pppd.
<CTRL-VM> display process name pppd
Job ID: 515
PID: 515
Parent JID: 1
Parent PID: 1
Executable path: /sbin/pppd
Instance: 0
Respawn: ON
Respawn count: 1
Max. spawns per minute: 12
Last started: Wed Nov 3 09:52:00 2021
Process state: sleeping
Max. core: 1
ARGS: --MaxTotalLimit=2000000 --MaxIfLimit=65534 --CmdOption=0x01047fbf --bSaveRunDb --pppoechastenflag=1 --pppoechastennum=6 --pppoechastenperiod=60 --pppoechastenblocktime=300 --pppchastenflag=1 --pppchastennum=6 --pppchastenperiod=60 --pppchastenblocktime=300 --PppoeKChasten --bSoftRateLimit --RateLimitToken=2048
TID LAST_CPU Stack PRI State HH:MM:SS:MSEC Name
515 0 136K 115 S 0:0:0:90 pppd
549 0 136K 115 S 0:0:0:0 ppp_misc
557 0 136K 115 S 0:0:0:10 ppp_chasten
610 0 136K 115 S 0:0:0:0 ppp_work0
611 1 136K 115 S 0:0:0:0 ppp_work1
612 1 136K 115 S 0:0:0:0 ppp_work2
613 1 136K 115 S 0:0:0:0 mp_main
618 1 136K 115 S 0:0:0:110 pppoes_main
619 1 136K 115 S 0:0:0:100 pppoes_mesh
620 1 136K 115 S 0:0:0:120 l2tp_mesh
621 1 136K 115 S 0:0:0:20 l2tp_main
The output shows that process pppd has multiple threads and they are all running on the control core.
- For a process that is running on the control core and has a CPU usage higher than 5%, identify whether the process is a user process by the value displayed in the Name field.
If the value displayed in the Name field of a process contains a space ( ), it is a kernel thread and you do not need to execute the monitor thread dumbtty command.
If the value displayed in the Name field of a process does not contain any space ( ), it is a user process and might contain multiple threads. Execute the monitor thread dumbtty command for the process. If the LAST_CPU field for a thread displays the CPU number of the control core and the CPU field for the thread displays a value higher than 5%, the thread might be the cause of high CPU control core usage. Further actions are required to locate the issue.
<CTRL-VM> monitor thread dumbtty slot 1 cpu 0
206 processes; 342 threads; 5134 fds
Thread states: 4 running, 338 sleeping, 0 stopped, 0 zombie
CPU0: 98.06% idle, 0.97% user, 0.97% kernel, 0.00% interrupt, 0.00% steal
CPU1: 97.12% idle, 0.96% user, 0.96% kernel, 0.96% interrupt, 0.00% steal
CPU2: 0.00% idle, 0.00% user, 100.00% kernel, 0.00% interrupt, 0.00% steal
CPU3: 0.00% idle, 0.00% user, 100.00% kernel, 0.00% interrupt, 0.00% steal
CPU4: 0.00% idle, 0.00% user, 100.00% kernel, 0.00% interrupt, 0.00% steal
Memory: 7940M total, 5315M available, page size 4K
JID TID LAST_CPU PRI State HH:MM:SS MAX CPU Name
322 322 2 115 R 00:04:21 0 20.15% [kdrvfwdd2]
323 323 3 115 R 00:04:21 0 20.15% [kdrvfwdd3]
324 324 4 115 R 00:04:21 0 20.15% [kdrvfwdd4]
1 1 1 120 S 00:00:02 21 0.19% scmd
376 376 1 120 S 00:00:00 1 0.19% diagd
2 2 0 120 S 00:00:00 0 0.00% [kthreadd]
…
d. Identify the call stack of the faulty process.
Log in to each VM, and use the follow job command in probe view of the VM to locate the call stack of the faulty process. Take process pppd with JID 515 on slot 1 of the CTRL-VM as an example:
<CTRL-VM> system-view
[CTRL-VM] probe
[CTRL-VM-probe] follow job 515 slot 1
Attaching to process 515 (pppd)
Iteration 1 of 5
------------------------------
Thread LWP 515:
Switches: 3205
User stack:
#0 0x00007fdc2a3aaa8c in epoll_wait+0x14/0x2e
#1 0x0000000000441745 in ppp_EpollSched+0x35/0x5c
#2 0x0000000000000004 in ??
Kernel stack:
[<ffffffff811f0573>] ep_poll+0x2f3/0x370
[<ffffffff811f06c0>] SyS_epoll_wait+0xd0/0xe0
[<ffffffff814aed79>] system_call_fastpath+0x16/0x1b
[<ffffffffffffffff>] 0xffffffffffffffff
Thread LWP 549:
Switches: 20
User stack:
#0 0x00007fdc2a3aaa8c in epoll_wait+0x14/0x2e
#1 0x00000000004435d4 in ppp_misc_EpollSched+0x44/0x6c
Kernel stack:
[<ffffffffffffffff>] 0xffffffffffffffff
…
e. Identify the module through the name of the faulty process, and resolve the issues on the module. For example, if the CPU usage of thread snmpd is high, the device might be under SNMP attack or the NMS might access the device frequently, and further actions are required to locate the issues on the SNMP module. If the CPU usage of thread nqad is high, NQA might perform probes frequently, and further actions are required to locate the issues on the NQA module.
6. If the issue persists, collect the following information and contact Technical Support:
¡ Results of each step.
¡ The configuration file, log messages, and alarm messages.
Related alarm and log messages
Alarm messages
· hh3cEntityExtCpuUsageThresholdNotfication
· hh3cEntityExtCpuUsageThresholdRecover
· hh3cCpuUsageSevereNotification
· hh3cCpuUsageSevereRecoverNotification
· hh3cCpuUsageMinorNotification
· hh3cCpuUsageMinorRecoverNotification
Log messages
· DIAG/5/CPU_MINOR_RECOVERY
· DIAG/4/CPU_MINOR_THRESHOLD
· DIAG/5/CPU_SEVERE_RECOVERY
· DIAG/3/CPU_SEVERE_THRESHOLD
Memory alarm threshold crossings caused by high memory usages of VMs on a vBRAS-CP
Symptom
Memory alarm thresholds are crossed and cause high memory usage on VMs (CTRL-VMs, BRAS-VMs, and FWD-VMs) on a vBRAS-CP. The memory usage of a VM is high when the following conditions are met:
· The output from the display memory or display health command shows that the memory usage of the VMs on the CP keeps increasing when the command is executed multiple times.
· The output from the display memory-threshold command shows that the current free memory state of VMs on the CP is neither Normal nor Normal (secure).
· The CP outputs high memory usage-related log messages.
· The NMS receives high memory usage-related alarms sent by the CP.
Common causes
The following are the common causes of this type of issue:
· The configured memory usage threshold is too low.
· The configured free memory thresholds are too high.
· The configured Direct Memory Access (DMA) memory alarm threshold is too high.
· The number of online BRAS access users has exceeded the limit.
· VM memory leakage occurs.
· Message queue backlog occurs because the UCM component cannot process user online/offline requests in time when BRAS access users come online or go offline too fast.
Troubleshooting flow
Figure 40 shows the troubleshooting flowchart.
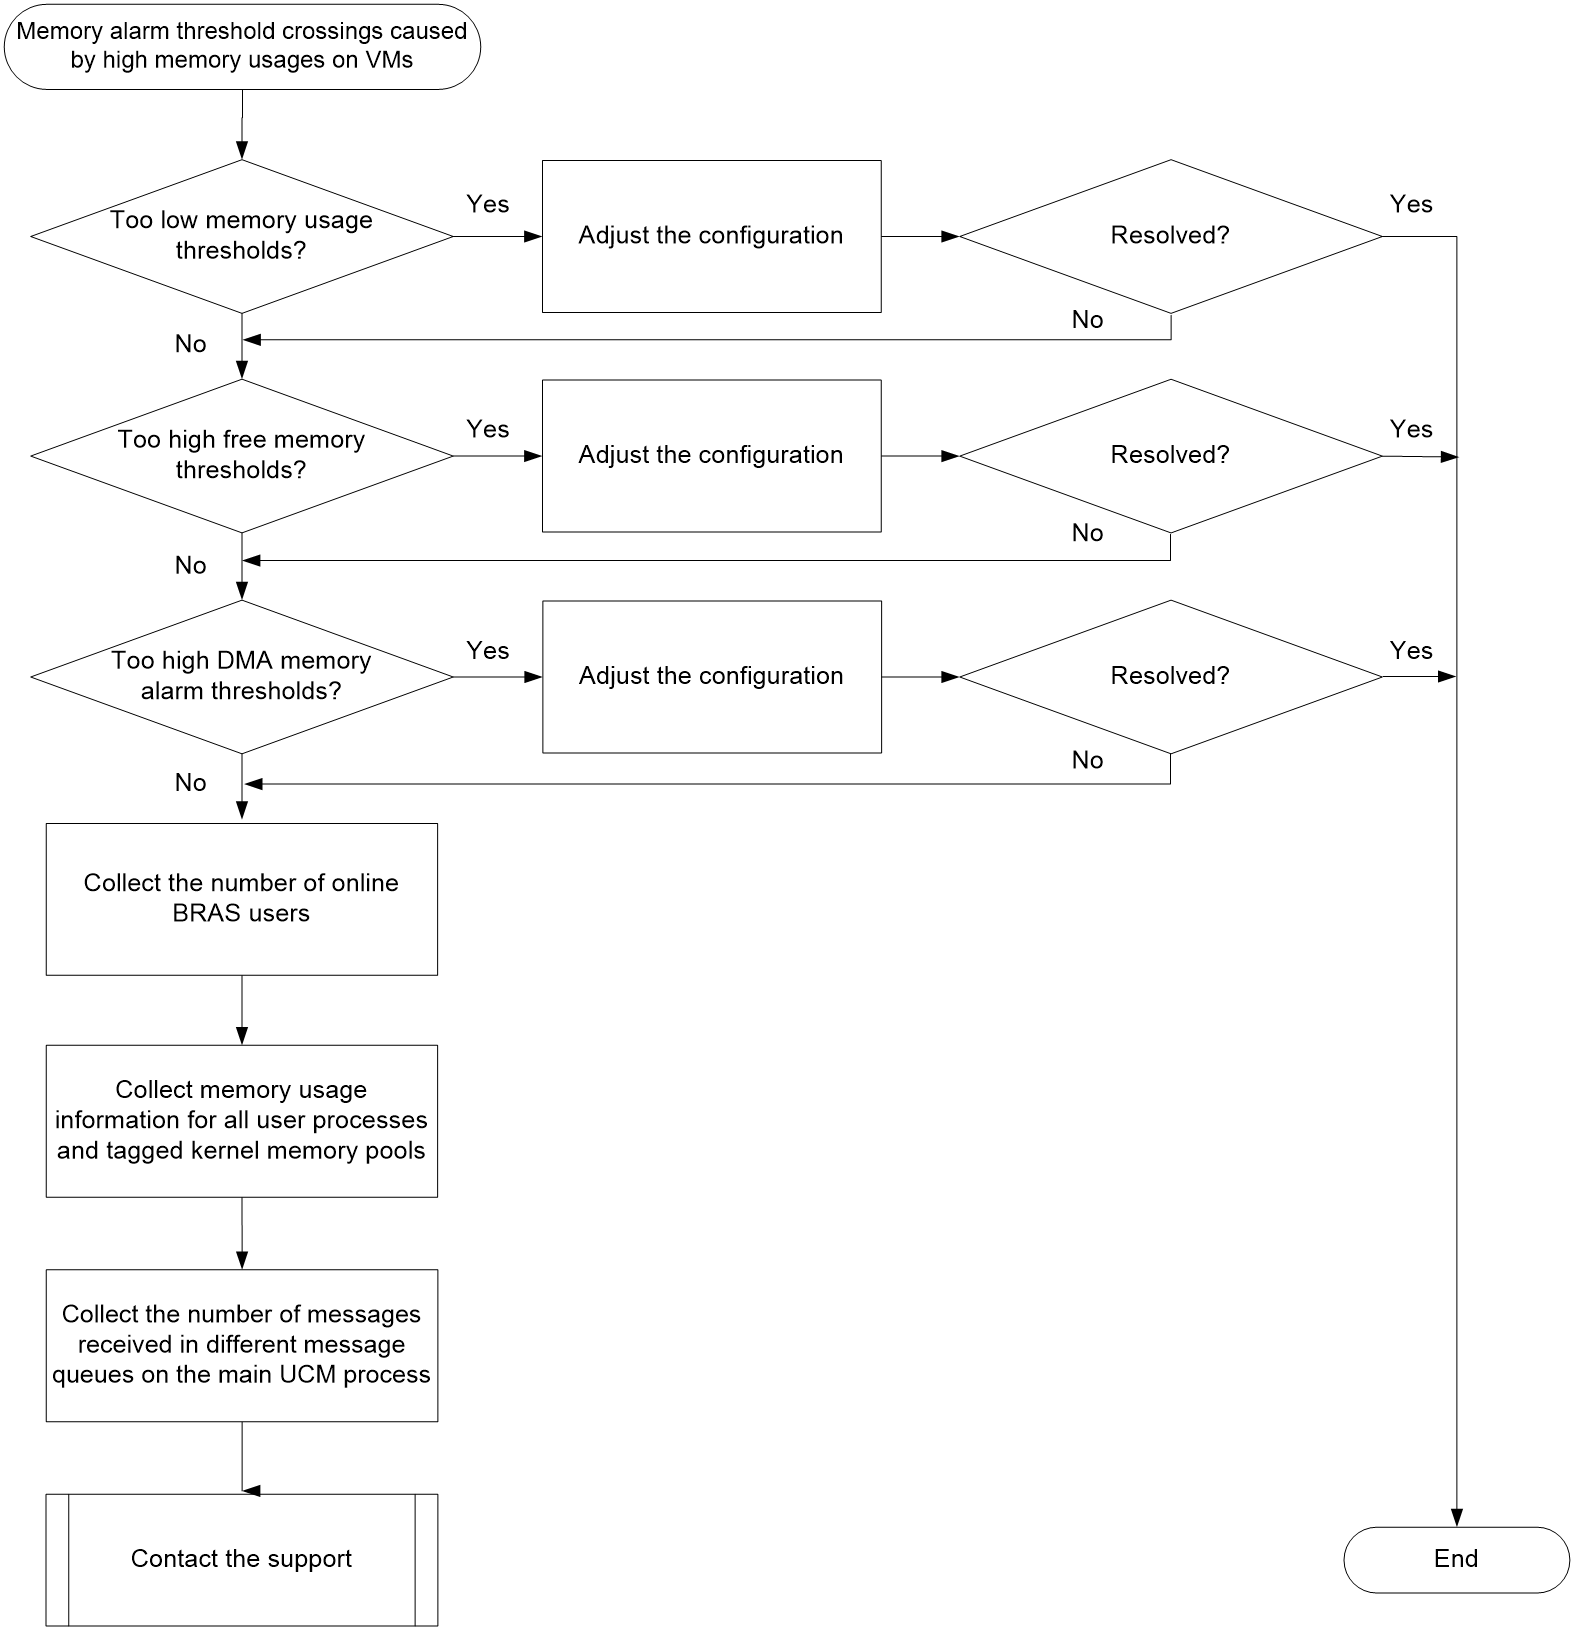
Solution
1. Identify whether the memory usage threshold configured for each VM is too low.
The CP collects the memory usage on each VM at 1-minute intervals, and compares it with the memory usage threshold (100%, by default) configured for each VM. If the collected memory usage threshold on a VM is higher than the configured memory usage threshold, the CP generates an alarm and a log message.
a. Execute the display health slot slot-number command in any view on the CTRL-VM to view the current memory usage of a VM. In this example, CTRL-VM with slot number 1 is specified.
<CTRL-VM> display health slot 1
Slot CPU Role CPU Usage(%) Memory Usage(%) Used/Total(MB) Disk Info
1 0 Master 0 50 5053/9917 855/31715(2)
b. Execute the display memory-threshold slot slot-number command in any view on the CTRL-VM to view the memory usage threshold configured for a VM. In this example, CTRL-VM with slot number 1 is specified.
<CTRL-VM> display memory-threshold slot 1
Memory usage threshold: 20%//Configured memory usage threshold
Free-memory thresholds:
Minor: 495M
Severe: 396M
Critical: 297M
Normal: 595M
Current free-memory state: Critical
Free-memory event statistics:
…
The outputs show that the current memory usage is 50%, which is not a very high memory suage. However, the VM determines that the memory usage is too high and triggers an alarm, because the memory usage threshold is 20%, which is too low.
c. Perform the following tasks based on whether the memory usage threshold configured for a VM is too low:
- If the memory usage threshold is too low, execute the undo memory-threshold usage command in system view to restore the default memory usage threshold (100%) for the VM, or the memory-threshold usage command to set the VM's memory usage threshold to an appropriate value.
- If the configured memory usage threshold is higher than the current memory usage and the issue persists, go to step 2.
|
|
IMPORTANT: The memory-threshold usage command takes effect on only the current VM. To set the memory usage thresholds for other VMs, log in to each of the VMs and execute the memory-threshold usage command. |
2. Identify whether the free memory thresholds configured for each VM are too high.
The CP generates an alarm and a log message if the minor, severe, or critical free memory space drops to or below the corresponding alarm threshold. If the configured free memory thresholds are too high, the CP will frequently generate alarms and log messages.
a. Execute the display health slot slot-number command in any view on the CTRL-VM to view the total memory on a VM. In this example, CTRL-VM with slot number 1 is specified.
<CTRL-VM> display health slot 1
Slot CPU Role CPU Usage(%) Memory Usage(%) Used/Total(MB) Disk Info
1 0 Master 0 50 5053/9917 855/31715(2)
b. Execute the display memory-threshold slot slot-number command in any view on the CTRL-VM to view the free memory alarm thresholds and current free memory state on a VM. In this example, CTRL-VM with slot number 1 is specified.
<CTRL-VM> display memory-threshold slot 1
Memory usage threshold: 20%
Free-memory thresholds:
Minor: 5000M //Configured minor free memory alarm threshold
Severe: 4000M //Configured severe free memory alarm threshold
Critical: 3000M //Configured critical free memory alarm threshold
Normal: 6000M //Configured normal state free memory alarm threshold
Current free-memory state: Minor //Current free memory usage state
Free-memory event statistics:
…
The outputs show that the VM's total memory is 9917 MB, and the minor, severe, and critical free memory alarm thresholds are 5000M, 4000M, and 3000M, respectively.
- (9917-5000)÷9917≈49.58% //Minor free memory alarm threshold in percentage
- (9917-4000)÷9917≈59.67% //Severe free memory alarm threshold in percentage
- (9917-3000)÷9917≈69.75% //Critical free memory alarm threshold in percentage
The configured free memory thresholds are too high.
c. Perform the following tasks based on whether the free memory thresholds configured for a VM are too high:
- If the free memory thresholds are too high, execute the undo memory-threshold command in system view to restore the default free memory thresholds for the VM. Alternatively, use the memory-threshold [ slot slot-number [ cpu cpu-number ] ] [ ratio ] minor minor-value severe severe-value critical critical-value normal normal-value command to set appropriate free memory thresholds for the VM.
The default free memory thresholds vary by device model.
- If the free memory thresholds are not high and the issue persists, go to step 3.
|
|
IMPORTANT: · To set the free memory thresholds for a VM, use the slot slot-number option in the memory-threshold command on the CTRL-VM to specify the VM by its slot number. · Setting the value for a free memory threshold to 0 in the memory-threshold command disables the corresponding free memory usage alarm feature. · Execute the following commands in sequence if the system displays message Please set all free-memory thresholds to 0 to disable the free-memory alarm functions first. after you execute the undo memory-threshold command: ¡ memory-threshold minor 0 severe 0 critical 0 normal 0 ¡ undo memory-threshold |
3. Identify whether the DMA memory alarm threshold configured for each VM is too high.
Insufficient DMA memory might cause malfunctioning of service modules that use the DMA memory. The system monitors the free DMA memory space regularly. If the free DMA memory space drops to or below the alarm threshold, the system generates an alarm and a log message to report that the DMA memory space might be insufficient.
a. Execute the display memory dma command in any view on the CTRL-VM to view DMA memory usage information for the VM.
<CTRL-VM> display memory dma
DMA memory statistics measured in KB on slot 1:
Total Used Free FreeRatio
16380 504 15876 97%
b. Execute the display memory dma command in any view on the CTRL-VM to view the free DMA memory thresholds and the current DMA memory state of the VM.
<CTRL-VM> display memory-threshold dma
Free DMA memory thresholds:
Critical: 16000KB //Configured free DMA memory alarm threshold
Normal: 16000KB //Configured free DMA memory alarm recovery threshold
Current DMA memory state: Critical //Current DMA memory state
Free memory event statistics:
[Back to normal state]
First notification: 0.0
Latest notification: 0.0
Total number of notifications sent: 0
[Entered to critcal state]
First notification: 2000-09-17 09:06:01.525
Latest notification: 2000-09-17 09:06:01.525
Total number of notifications sent: 1
The outputs show that the free DMA memory is 15876 KB, the free DMA memory ratio is 97%, and the free DMA memory alarm threshold is 16000 KB. The configured free DMA memory alarm threshold is too high.
c. Perform the following tasks based on whether the free DMA memory alarm threshold configured for a VM is too high:
- If the free DMA memory alarm threshold is too high, execute the undo memory-threshold dma command in system view to restore the default free DMA memory alarm threshold for the VM. Alternatively, use the memory-threshold dma [ slot slot-number [ cpu cpu-number ] ] [ ratio ] critical critical-value normal normal-value command to set an appropriate free memory alarm threshold for the VM.
The default free DMA memory alarm threshold varies by device model.
- If the free DMA memory alarm threshold is not high and the issue persists, go to step 4.
|
|
IMPORTANT: The memory-threshold dma command takes effect on only the current VM. To set the DMA memory thresholds for other VMs, log in to each of the VMs and execute the memory-threshold dma command. |
4. Execute the display access-user count command in any view on the CTRL-VM to view the total number of online BRAS users on the CP.
5. Collect the memory usage information for all user processes and tagged kernel memory pools on all VMs:
¡ Execute the display process memory slot slot-number command in any view on the CTRL-VM to display the memory usage for all user processes on a VM.
¡ Execute the display system internal kernel memory pool tag slot slot-number command in any view on the CTRL-VM to display the brief usage information for all tagged kernel memory pools on a VM.
Repeat the two commands to collect memory usage information for other VMs.
6. Execute the display system internal ucm main-ctrl queue command to display the number of messages received in different message queues on the main UCM process of the VMs.
|
|
IMPORTANT: The display system internal ucm main-ctrl queue command configured in probe view takes effect on only the current VM. To collect the message reception information about other VMs, log in to each of the VMs and execute the display system internal ucm main-ctrl queue command. |
7. If the issue persists, collect the following information and contact Technical Support:
¡ Results of each step.
¡ The configuration file, log messages, and alarm messages.
Related alarm and log messages
Alarm messages
HH3C-LswTRAP-MIB
· hh3cMemoryUsageMinorNotification(1.3.6.1.4.1.25506.8.35.12.1.35)
· hh3cMemoryUsageMinorRecoverNotification(1.3.6.1.4.1.25506.8.35.12.1.36)
· hh3cMemoryUsageSevereNotification(1.3.6.1.4.1.25506.8.35.12.1.37)
· hh3cMemoryUsageSevereRecoverNotification(1.3.6.1.4.1.25506.8.35.12.1.38)
· hh3cMemoryUsageCriticalNotification(1.3.6.1.4.1.25506.8.35.12.1.39)
· hh3cMemoryUsageCriticalRecoverNotification(1.3.6.1.4.1.25506.8.35.12.1.40)
· hh3cMemoryUsageEarlyWarningNotification(1.3.6.1.4.1.25506.8.35.12.1.33)
· hh3cMemoryUsageEarlyWarningRecoverNotificatio(1.3.6.1.4.1.25506.8.35.12.1.34)
Log messages
· DIAG_DMA_MEM_CRITICAL_THRESHOLD
· DIAG_DMA_MEM_RECOVERY
· KERNEL_MEMFRAGMT_BELOW_THRESHOLD
· KERNEL_MEMFRAGMT_EXCEED_THRESHOLD
· MEM_ALERT
· MEM_EXCEED_THRESHOLD
· MEM_BELOW_THRESHOLD
· MEM_USAGE_RECOVERY
· MEM_USAGE_THRESHOLD
Attack protection issues
DHCP flood attack protection issues
About DHCP flood attack protection
When an attacker launches a DHCP flood attack, it maliciously sends a large number of DHCP requests to a targeted DHCP server within a short time. Such attack encroaches on the system resources of that DHCP server, interrupting legitimate DHCP interactions.
To protect a DHCP server from DHCP flood attacks, configure either the DHCP flood attack protection feature or the DHCP attack suppression feature on the DHCP server.
Symptom
· Although the DHCP flood attack protection feature is enabled, the DHCP server still delivers many attack packets to its CPU, which causes system resource waste.
· A legitimate user cannot obtain any IP address from the DHCP server, because its requests are regarded as attack packets.
Common causes
The following are the common causes for this type of issue:
· The DHCP flood attack protection feature is not enabled on the client-facing interfaces of the DHCP server.
· When multiple DHCP relay agents exist between a DHCP client and the DHCP server, the DHCP server or the non-first-hop relay agents are enabled with the DHCP flood attack protection feature.
· The DHCP packet rate threshold that triggers DHCP flood attack protection is unreasonable for the DHCP server.
Troubleshooting flow
Figure 41 shows the troubleshooting flowchart.
Figure 41 Flowchart for troubleshooting DHCP flood attack protection issues
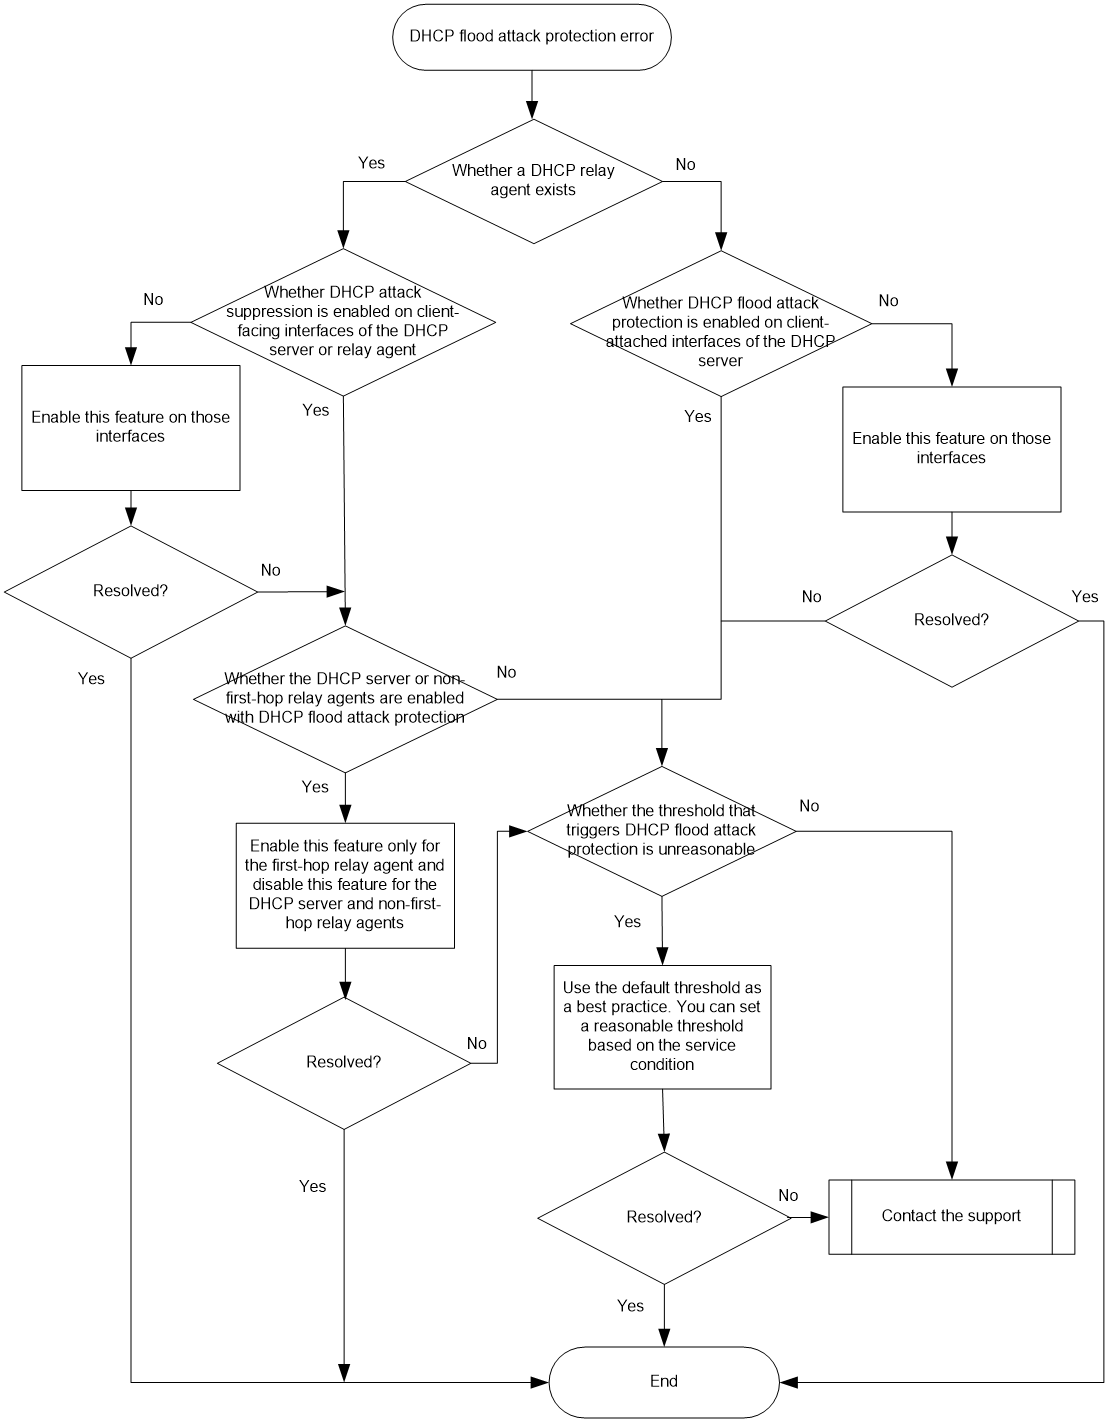
Solution
|
|
NOTE: · The DHCP flood attack protection feature counts collect packet statistics on a per-source MAC address basis. This feature protects the device well against attacks from a fixed MAC address. However, it cannot limit the packet rate when the attack packets are from different MAC addresses. For better DHCP flood attack protection, enable DHCP attack suppression on interfaces. When an interface is enabled with DHCP attack suppression, the device collects statistics about the DHCP requests received on that interface. When the DHCP packet rate of the interface reaches the threshold, the device performs DHCP attack suppression. · In this chapter, the interface-based DHCP attack suppression feature is part of the DHCP flood attack protection feature. · The troubleshooting flow for DHCPv6 flood attack protection issues is similar as that for DHCP flood attack protection issues, except command differences. |
1. Check whether the DHCP flood attack protection feature is enabled on the client-facing interfaces of the DHCP server.
|
|
NOTE: Take this step when DHCP clients are directly connected to the DHCP server. If DHCP clients are connected to a DHCP relay agent, proceed to step 2. |
a. Use the display dhcp flood-protection command to check whether the DHCP flood attack protection feature is globally enabled on the DHCP server. You do not need to enable the DHCP flood attack protection feature on a per-interface basis if this feature is enabled globally.
b. Use the display this command on the client-facing interfaces of the DHCP server to check whether the DHCP flood attack protection feature or the DHCP attack suppression feature are enabled on those interfaces.
<Sysname> system-view
[Sysname] interface ten-gigabitethernet 3/1/1
[Sysname-Ten-GigabitEthernet3/1/1] display this
#
interface Ten-GigabitEthernet3/1/1
port link-mode route
dhcp flood-protection enable
dhcp interface-rate-suppression enable
...
<Sysname> display dhcp flood-protection
Global DHCP flood protection: Enabled
DHCP flood protection threshold: 100 packets/ 2000 milliseconds
Index MAC address UDP port SVLAN/CVLAN State
...
Perform one of the following tasks according to the check result:
¡ If the DHCP flood attack protection feature is not enabled on the client-facing interfaces, enable this feature globally or on a per-interface basis.
- To enable the DHCP flood attack protection feature only on the interface, use the dhcp flood-protection enable command in conjunction with the dhcp interface-rate-suppression enable command in interface view.
- To enable the DHCP flood attack protection feature globally, use the dhcp flood-protection global enable command in system view.
¡ If the DHCP flood attack protection feature is enabled on the client-facing interfaces, proceed to step 3.
2. Check whether the DHCP flood attack protection feature is configured correctly on the DHCP server or DHCP relay agent.
|
|
NOTE: Take this step when a DHCP client is connected to a DHCP relay agent for communication with the DHCP server. If no DHCP relay agent is deployed on the network, skip this step. |
a. Check whether the DHCP attack suppression feature is enabled on the client-facing interfaces of the DHCP server or the DHCP relay agent. The check process is similar as step 1.
b. Check whether the DHCP flood attack protection feature is enabled on the client-facing interfaces of the DHCP server or non-first-hop DHCP relay agents.
When a Layer 3 device forwards a DHCP request to the DHCP server, the Layer 3 device replaces the source MAC address of the DHCP request with its MAC address. If the following conditions exist, the DHCP server or a non-first-hop DHCP relay agent might consider legitimate DHCP requests received on an interface as attack packets:
¡ The interface is enabled with the DHCP flood attack protection feature.
¡ On the interface above, the DHCP server or non-first-hop DHCP relay agent receives too many relayed DHCP requests that have the same MAC address.
When multiple DHCP relay agents exist between a DHCP client and the DHCP server, follow these guidelines as a best practice:
¡ Use the undo dhcp flood-protection enable command to disable the DHCP flood attack protection feature on the client-facing interfaces of the DHCP server and non-first-hop DHCP relay agents.
¡ Enable the DHCP flood attack protection feature only on the client-facing interfaces of the first-hop DHCP relay agent.
For more information about how to check whether the DHCP flood attack protection feature is enabled on a DHCP relay agent, see step 1.
3. Check whether the DHCP packet rate threshold that triggers DHCP flood attack protection is reasonable.
¡ Use the display dhcp flood-protection command in any view of the DHCP server to view the DHCP packet rate threshold that triggers DHCP flood attack protection.
<Sysname> display dhcp flood-protection
Global DHCP flood protection: Enabled
DHCP flood protection threshold: 100 packets/ 2000 milliseconds
Index MAC address UDP port SVLAN/CVLAN State
...
¡ Use the display dhcp interface-rate-suppression command in any view to view the DHCP packet rate threshold that triggers interface-based DHCP attack suppression.
<Sysname> display dhcp interface-rate-suppression
DHCP attack suppression threshold: 100 packets/ 2000 milliseconds
Index Interface State
...
To ensure optimal DHCP flood attack protection and correct communication between legitimate users and the DHCP server, set a reasonable DHCP packet rate threshold. As a best practice, use the default DHCP packet rate threshold. If the default one cannot meet the service requirement, you can use the dhcp flood-protection threshold command or the dhcp interface-rate-suppression threshold command in system view to set a new DHCP packet rate threshold.
4. If the issue persists, collect the following information and contact Technical Support:
¡ Results of each step.
¡ The configuration file, log messages, and alarm messages.
¡ Collect the debugging results after you use the debugging dhcp server all command or the debugging ipv6 dhcp server all command.
Related alarm and log messages
Alarm messages
N/A
Log messages
N/A
DHCP starvation attack protection issues
About DHCP starvation attack protection
A DHCP starvation attack occurs when an attacker constantly sends forged DHCP requests using different MAC addresses in the chaddr field to a DHCP server. This might cause the following issues:
· Legitimate DHCP clients cannot obtain IP addresses, because the IP address resources of the DHCP server are exhausted.
To resolve this issue, enable the DHCP starvation attack protection feature for the DHCP server.
· The DHCP server might also fail to work because of exhaustion of system resources.
To resolve this issue, enable the DHCP starvation attack protection feature in conjunction with the DHCP flood attack protection feature for the DHCP server.
Symptom
· Although the DHCP starvation attack protection feature is enabled, the DHCP server still frequently runs out of IP address resources.
· A legitimate user cannot obtain any IP address from the DHCP server, because its requests are regarded as attack packets.
Common causes
The following are the common causes for this type of issue:
· The DHCP starvation attack protection feature is not enabled on the client-facing interfaces of the DHCP server.
· When multiple DHCP relay agents exist between a DHCP client and the DHCP server, the DHCP server or non-first-hop relay agents are enabled with the MAC address check feature.
· The maximum number of ARP entries or MAC addresses that a client-facing interface can learn is unreasonable.
Troubleshooting flow
Figure 42 shows the troubleshooting flowchart.
Figure 42 Flowchart for troubleshooting DHCP starvation attack protection issues
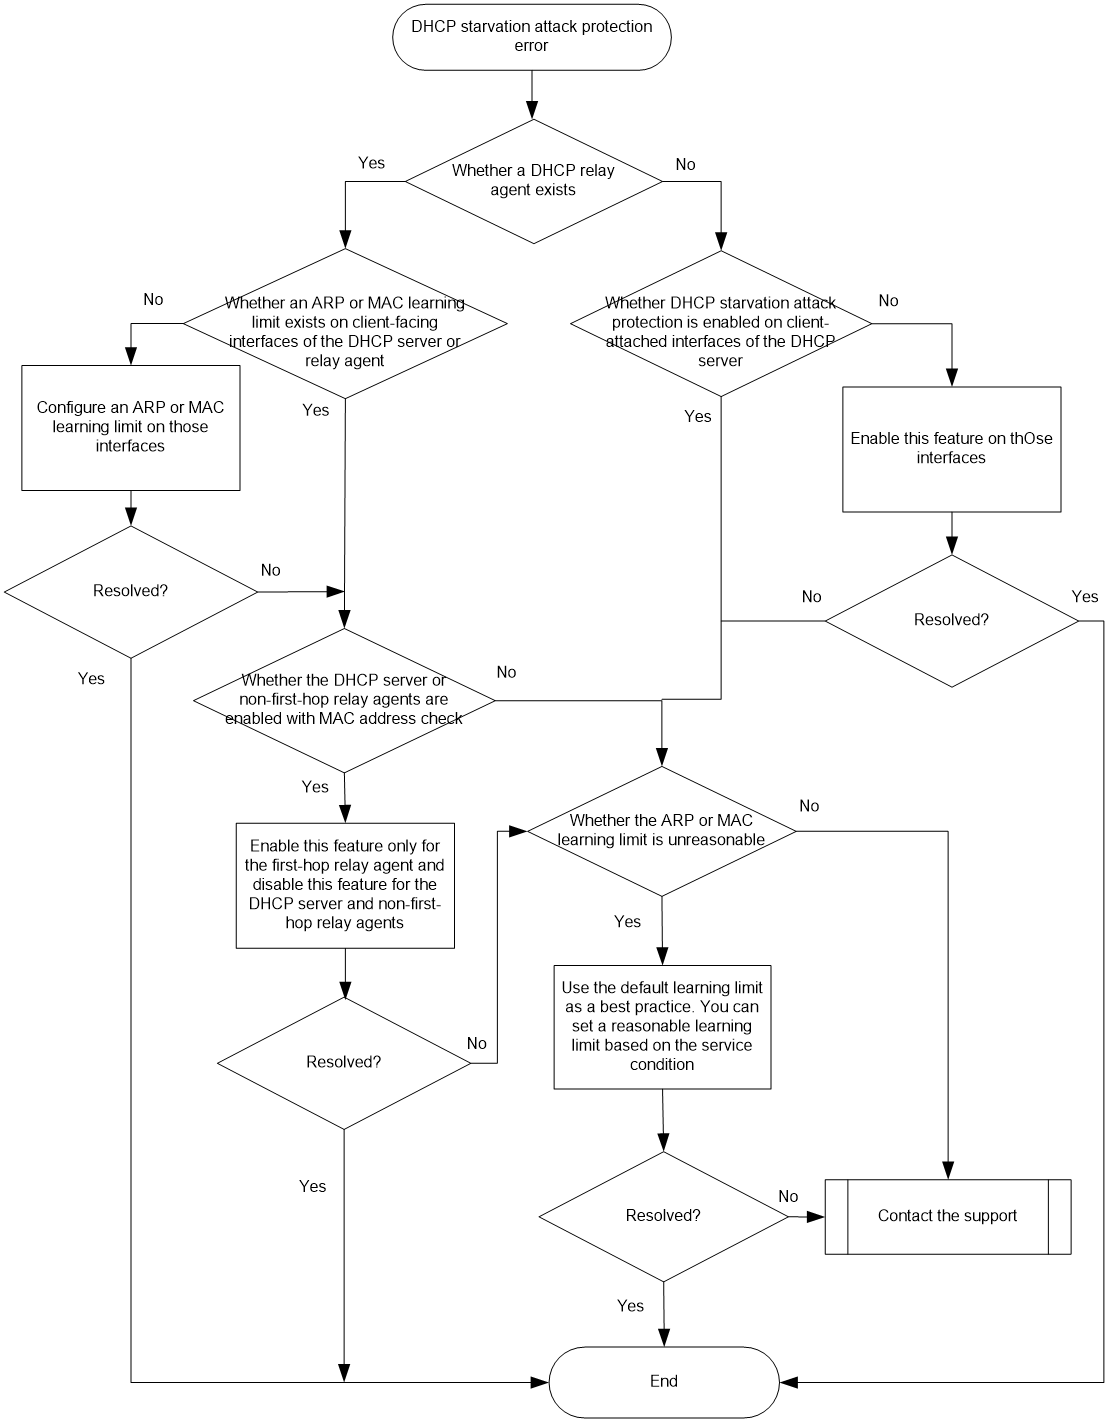
Solution
1. Check whether the DHCP starvation attack protection feature is enabled on the client-facing interfaces of the DHCP server.
|
|
NOTE: Take this step when DHCP clients are directly connected to the DHCP server. If DHCP clients are connected to a DHCP relay agent, proceed to step 2. |
For better DHCP starvation attack protection, configure the DHCP server to achieve DHCP starvation attack protection against DHCP requests with different MAC addresses and with the same MAC address.
To achieve DHCP starvation attack protection against DHCP requests with different MAC addresses:
¡ For a Layer 3 interface, use the arp max-learning-num command in Layer 3 interface view to set an ARP entry learning limit.
¡ For a Layer 2 interface, perform the following tasks in Layer 2 interface view:
- Use the mac-address max-mac-count command to set an MAC learning limit.
- Use the undo mac-address max-mac-count enable-forwarding command to disable forwarding unknown frames received on the interface after the MAC learning limit on the interface is reached.
You can use the display this command to view the configuration of a client-facing interface on the DHCP server.
¡ Display Layer 3 interface configuration.
<Sysname> system-view
[Sysname] interface ten-gigabitethernet 3/1/1
[Sysname-Ten-GigabitEthernet3/1/1] display this
#
interface Ten-GigabitEthernet3/1/1
port link-mode route
arp max-learning-num 10
...
If no ARP entry limit is configured on the interface, use the arp max-learning-num command in Layer 3 interface view to set an ARP entry learning limit.
¡ Display Layer 2 interface configuration.
<Sysname> system-view
[Sysname] interface ten-gigabitethernet 3/1/1
[Sysname-Ten-GigabitEthernet3/1/1] display this
#
interface Ten-GigabitEthernet3/1/1
port link-mode bridge
mac-address max-mac-count 600
undo mac-address max-mac-count enable-forwarding
...
If the interface does not have any configuration about DHCP starvation attack protection, perform the following tasks in Layer 2 interface view:
- Use the mac-address max-mac-count command to set an MAC learning limit.
- Use the undo mac-address max-mac-count enable-forwarding command to disable forwarding unknown frames received on the interface after the MAC learning limit on the interface is reached.
To achieve DHCP starvation attack protection against DHCP requests with the same MAC address, use the dhcp server check mac-address command to enable MAC address check on all client-facing interfaces. The MAC address check feature enables the DHCP server to compare the chaddr field of a received DHCP request with the source MAC address in the frame header. If they are the same, the DHCP server verifies the packet legal and continues processing the packet. If they are not the same, the DHCP server discards the request.
You can use the display this command to check whether the MAC address check feature is enabled on a client-facing interface of the DHCP server.
<Sysname> system-view
[Sysname] interface ten-gigabitethernet 3/1/1
[Sysname-Ten-GigabitEthernet3/1/1] display this
#
interface Ten-GigabitEthernet3/1/1
port link-mode route
dhcp server check mac-address
...
If the MAC address check feature is not enabled, use the dhcp server check mac-address command to enable this feature on the interface.
2. Check whether the DHCP starvation attack protection feature is configured correctly on the DHCP server or DHCP relay agent.
|
|
NOTE: Take this step when a DHCP client is connected to a DHCP relay agent for communication with the DHCP server. If no DHCP relay agent is deployed on the network, skip this step. |
a. Check whether an ARP entry learning limit or MAC learning limit is configured on the client-facing interfaces of the DHCP relay agent or the DHCP server. The check process is similar as step 1.
b. Check whether the DHCP server or non-first-hop relay agents are enabled with the MAC address check feature.
When a Layer 3 device forwards a DHCP request to the DHCP server, the Layer 3 device replaces the source MAC address of the DHCP request with its MAC address. On receipt of the packet from the Layer 3 device, the DHCP server or a non-first-hop DHCP relay agent will consider that packet as an attack packet:
When multiple DHCP relay agents exist between a DHCP client and the DHCP server, follow these guidelines as a best practice:
¡ Disable the MAC address check feature on the client-facing interfaces of the DHCP server and non-first-hop DHCP relay agents.
To disable the MAC address check feature on a client-facing interface of the DHCP server, use the undo dhcp server check mac-address command. To disable the MAC address check feature on a client-facing interface of a non-first-hop DHCP relay agent, use the undo dhcp relay check mac-address command.
¡ Enable the MAC address check feature only on the client-facing interfaces of the first-hop DHCP relay agent.
For more information about how to check whether the MAC address check feature is enabled on a DHCP relay agent, see step 1.
3. Check whether the maximum number of ARP entries or MAC addresses that a client-facing interface can learn is unreasonable.
You can use the display this command in any view of the DHCP server to view the ARP entry learning limit or MAC learning limit on a client-facing interface.
¡ Display Layer 3 interface configuration.
<Sysname> system-view
[Sysname] interface ten-gigabitethernet 3/1/1
[Sysname-Ten-GigabitEthernet3/1/1] display this
#
interface Ten-GigabitEthernet3/1/1
port link-mode route
arp max-learning-num 10
...
¡ Display Layer 2 interface configuration.
<Sysname> system-view
[Sysname] interface ten-gigabitethernet 3/1/1
[Sysname-Ten-GigabitEthernet3/1/1] display this
#
interface Ten-GigabitEthernet3/1/1
port link-mode bridge
mac-address max-mac-count 600
...
If the ARP entry learning limit or MAC learning limit is much greater than the number of assignable IPs on the DHCP server, numerous users will fail to obtain IPs from the DHCP server. If the ARP entry learning limit or MAC learning limit is too small, the DHCP server might discard DHCP requests from legitimate users.
To ensure successful IP address acquisition and correct communication between legitimate users and the DHCP server, set a reasonable ARP entry learning limit or MAC learning limit. As a best practice, use the default ARP entry learning limit or MAC learning limit. If the default one cannot meet the service requirement, you can use the arp max-learning-num command or the mac-address max-mac-count command in interface view to set a new learning limit.
4. If the issue persists, collect the following information and contact Technical Support:
¡ Results of each step.
¡ The configuration file, log messages, and alarm messages.
¡ Collect the debugging results after you use the debugging dhcp server all command.
Related alarm and log messages
Alarm messages
N/A
Log messages
N/A
Appendix A Reasons for user login failures and abnormal logouts
Identifying the reasons
Identifying login failure reasons
Use the display aaa online-fail-record command to view the login failure reason.
<Sysname> display aaa online-fail-record username 001094500020
Total count: 116
Username: 001094500020
Domain: dm1
MAC address: 0010-9450-0020
Access type: IPoE
Access UP ID: 1353
Access interface: XGE3/1/1
SVLAN/CVLAN: -/-
IP address: -
IPv6 address: -
Online request time: 2021/08/15 07:42:15
Online failure reason: DHCP with server no response
In this example, the online failure reason is DHCP with server no response. To view the recommended troubleshooting methods for the failure, see "Reasons for user login failures and abnormal logouts."
If the failure reason cannot be obtained in the method described above, it indicates that the failure might be caused because AAA authentication has not started or the link between the user and the device is faulty. In this case, use the trace access-user command to identify the stage at which an error occurred and then troubleshoot the link based on the actual networking conditions. For more information about the trace access-user command, see BRAS Services Command Reference.
Identifying abnormal logout reasons
Use the display aaa abnormal-offline-record and display aaa offline-record commands to view the abnormal logout reason.
<Sysname> display aaa offline-record username 001094500021
Total count: 4
Username: 001094500021
Domain: dm1
MAC address: 0010-9450-0021
Access type: IPoE
Access UP ID: 1354
Access interface: XGE3/1/1
SVLAN/CVLAN: -/-
IP address: 9.0.3.1
IPv6 address: -
Online request time: 2021/08/15 08:05:17
Offline time: 2021/08/15 08:09:08
Offline reason: DHCP release
In this example, the online failure reason is DHCP release. To view the recommended troubleshooting methods for the failure, see "Reasons for user login failures and abnormal logouts."
If the failure reason cannot be obtained in the method described above, it indicates that the failure might be caused because the link between the user and the device is faulty. In this case, troubleshoot the link based on the actual networking conditions.
Reasons for user login failures and abnormal logouts
AAA access limit under domain
Message
AAA access limit under the domain
Reasons
The number of online users in an authentication domain exceeds the upper limit.
Recommended actions
Execute the access-limit command in ISP domain view to increase the upper limit, or execute the free command in user view to forcibly log out other online users.
AAA domain do not exist
Message
AAA domain do not exist
Reasons
The specified ISP domain of a user does not exist.
Recommended actions
Execute the display domain command to identify whether the ISP domain of the user exists on the device. If the ISP domain does not exist, execute the domain name command to create the ISP domain, and configure the authentication, authorization, and accounting schemes correctly for the ISP domain.
AAA forces the PPPoEA user offline
Message
AAA forces the PPPoEA user offline
Reasons
The AAA server forces the PPPoEA user to go offline.
Recommended actions
Contact the AAA server administrator to identify the forced logout reason.
AAA with Authentication no response
Message
AAA with Authentication no response
Reasons
The device does not receive authentication response packets from the server.
Recommended actions
1. Verify that the access device IP added on the authentication server is the same as the source IP address in the authentication request packets sent by the device.
2. Verify that the device can reach the authentication server.
AAA with authorization data error
Message
AAA with authorization data error
Reasons
The device fails to parse the authorization information issued by the server.
Recommended actions
1. Enable debugging for RADIUS packets and view the authorization attributes.
2. Verify that the authorization attributes issued by the server are correct.
AAA with flow limit
Message
AAA with flow limit
Reasons
The traffic quota of the online user is exhausted.
Recommended actions
No action is required.
AAA with memory alloc fail
Message
AAA with memory alloc fail
Reasons
Failed to allocate the memory.
Recommended actions
1. Use the display memory command to view the memory usage of the device, and identify whether the memory of the device is sufficient.
2. Use the display memory-threshold command to identify whether the memory threshold alarms exist. According to the value for the Current free-memory state: field, check the memory alarm state.
3. Clear the memory as needed, for example, reduce the number of online users or close some unneeded services.
AAA with message send fail
Message
AAA with message send fail
Reasons
The device fails to send packets to the server.
Recommended actions
Verify that the interface that sends packets from the device to the server is up. If the issue persists, contact Technical Support.
AAA with radius decode fail
Message
AAA with radius decode fail
Reasons
The device fails to parse the received RADIUS packets.
Recommended actions
Enable debugging for RADIUS packets on the device. Collect the debugging information, and contact Technical Support to identify whether the RADIUS packet format is correct.
AAA with realtime accounting fail
Message
AAA with realtime accounting fail
Reasons
A user goes offline because real-time accounting fails.
Recommended actions
1. Identify whether the shared key on the device matches that on the accounting server. If they do not match, set the shared key matching that on the server in the accounting scheme.
2. Identify whether the accounting update-fail [ max-times max-times ] offline command is executed in the ISP domain. By default, a user stays online when real-time accounting fails. For a user not to go offline when real-time accounting fails, execute the accounting update-fail online command or execute the undo accounting update-fail command to restore the default.
3. If the issue persists, contact Technical Support.
AAA with start accounting fail
Message
AAA with start accounting fail
Reasons
Failed to start accounting for a user coming online.
Recommended actions
1. Check the accounting configuration in the ISP domain, and verify that the accounting scheme is correct.
2. Identify whether the accounting start-fail offline command is executed in the ISP domain. By default, a user stays online if accounting fails to start for the user. For a user not to go offline when accounting fails to start, execute the accounting start-fail online command or execute the undo accounting start-fail command to restore the default.
AAA with timer create fail
Message
AAA with timer create fail
Reasons
Failed to create the AAA timer on the device.
Recommended actions
1. Use the display memory command to view the memory usage of the device, and identify whether the memory of the device is sufficient.
2. Use the display memory-threshold command to identify whether the memory threshold alarms exist. According to the value for the Current free-memory state: field, check the memory alarm state.
3. Clear the memory as needed, for example, reduce the number of online users or close some unneeded services.
AAA with user information err
Message
AAA with user information err
Reasons
When a user performs LDAP authentication, the user does not provide the required username.
Recommended actions
Modify the username of the user for coming online, and log in again.
access-block
Message
access-block
Reasons
On a CUPS network, the access UP of a user prevents new users from coming online.
Recommended actions
Execute the undo access-block command on the access UP of the user to configure the UP to allow new users to come online. Example:
<Sysname> system-view
[Sysname] up-manage id 1024
[Sysname-up-manage-1024] undo access-block
Add nat user data fail(IP Alloc Fail)
Message
Add nat user data fail(IP Alloc Fail)
Reasons
In the NAT configuration matching traffic of a user, the NAT address group does not have enough public network addresses.
Recommended actions
In the NAT address group, the public network address resources are obtained in one of the following methods:
· Execute the address command in NAT address group view to add address resources. When address resources are insufficient, execute the address command to add address resources. Example:
<Sysname> system-view
[Sysname] nat address-group 1
[Sysname-address-group-1] address 202.1.1.1 202.1.1.2
· Bind a NAT address group to the global NAT address pool. Then, the NAT address group obtains address resources from the global NAT address pool.
¡ For a static global NAT address pool, manually add address resources when the address resources are insufficient. Example:
<Sysname> system-view
[Sysname] nat ip-pool pool1
[Sysname-nat-ip-pool-pool1] section 0 200.1.1.1 mask 24
¡ For a dynamic global NAT address pool, when the address resources in the NAT address group are insufficient, the dynamic global NAT address pool on the UP will request resources from the NAT-central IP address pool on the CP. If the CP does not have available address to allocate to the UP, the NAT address group on the UP does not have available addresses for allocation. In this case, add public network address resources to the NAT-central IP address pool on the CP. Example:
<Sysname> system-view
[Sysname] ip pool 1 nat-central
[Sysname-ip-pool-1] network range 202.1.1.1 202.1.1.2
Add no backlist no Sub IfMaster
Message
Add no backlist no Sub IfMaster
Reasons
If master/backup switchover occurs on a UP backup network, the current configured backup interface is the actual running master interface, and the configured master interface is the actual running backup interface. In this case, users come online through subinterfaces on the configured backup interface (running master interface). However, the device fails to find subinterfaces on the configured master interface (running backup interface). As a result, the users cannot come online.
Recommended actions
Identify whether the subinterface on the configured master interface is configured to terminate the VLAN tag carried in packets. For example, the subinterface on the configured master interface is configured to terminate packets carrying VLAN tag 3 rather than VLAN tag 2, but the user packets carry VLAN tag 2. In this case, you can configure the subinterface on the configured master interface to terminate packets carrying VLAN tag 2. Then, trigger the users to come online again.
<Sysname> system-view
[Sysname] interface ten-gigabitethernet 3/1/1.2
[Sysname-Ten-GigabitEthernet3/1/1.2] vlan-type dot1q vid 2
After the IPoE Web user has come online in postauth by inheriting PPPoE user info, the BRAS rejects Web access requests from the user
Message
After the IPoE Web user has come online in postauth by inheriting PPPoE user info, the BRAS rejects Web access requests from the user
Reasons
After receiving a Web access request from an IPoE Web user that has come online in the postauthentication domain by using the inherited PPPoE user information, the BRAS device rejects the request directly. The user stays online in the postauthentication domain by using the inherited PPPoE user information.
Recommended actions
No action is required.
All prefix ranges in the DHCPv6 address pool group have been allocated
Message
All prefix ranges in the DHCPv6 address pool group have been allocated
Reasons
An ODAP IPv6 address pool group does not have available prefix ranges for allocation.
Recommended actions
Crete a new ODAP IPv6 address pool, and reference a prefix pool available for allocation. Then, use the pool command to add the address pool to the IPv6 address group.
All prefix ranges in the DHCPv6 address pool have been allocated
Message
All prefix ranges in the DHCPv6 address pool have been allocated
Reasons
An ODAP IPv6 address pool does not have available prefix ranges for allocation.
Recommended actions
As a best practice, configure the user to come online through another interface. The DHCP server will authorize a new address pool to the user. If the DHCP server does not have a new address pool that can be authorized, you must re-create the address pool.
All subnets in the DHCP address pool group have been allocated
Message
All subnets in the DHCP address pool group have been allocated
Reasons
An ODAP IP address pool group does not have available subnets for allocation.
Recommended actions
· In the IP address pool group, execute the network secondary command to create new secondary subnets. Then, use the new secondary subnets to allocate available subnets.
· Crete a new ODAP IP address pool, and configure subnets available for allocation. Then, use the pool command to add the address pool to the IP address group.
All subnets in the DHCP address pool have been allocated
Message
All subnets in the DHCP address pool have been allocated
Reasons
An ODAP IP address pool does not have available subnets for allocation.
Recommended actions
· In the IP address pool, execute the network secondary command to create new secondary subnets. Then, use the new secondary subnets to allocate available subnets.
· The user can come online through another interface. The DHCP server will authorize a new address pool to the user. If the DHCP server does not have a new address pool that can be authorized, you must re-create the address pool.
All subnets in the DHCPv6 address pool group have been allocated
Message
All subnets in the DHCPv6 address pool group have been allocated
Reasons
An ODAP IPv6 address pool group does not have available subnets for allocation.
Recommended actions
Crete a new ODAP IPv6 address pool, and configure subnets available for allocation. Then, use the pool command to add the address pool to the IPv6 address group.
All subnets in the DHCPv6 address pool have been allocated
Message
All subnets in the DHCPv6 address pool have been allocated
Reasons
An ODAP IPv6 address pool does not have available subnets for allocation.
Recommended actions
As a best practice, configure the user to come online through another interface. The DHCP server will authorize a new address pool to the user. If the DHCP server does not have a new address pool that can be authorized, you must re-create the address pool.
ARP with detect fail
Message
ARP with detect fail
Reasons
· The intermediate transmission devices drop or modify the ARP detection packets.
· Link failures occur.
· The detection packets are dropped by the device.
· The device drops packet because of access method, interface state, and user information errors.
Recommended actions
View the online and offline time difference of the user. View the detection settings. Execute the trace access-user command to create a service tracing object and view the packet sending/receiving conditions. Identify the phase at which a packet was lost, and troubleshoot accordingly.
Authenticate fail
Message
Authenticate fail
Reasons
A local management user fails to pass authentication and come online.
Recommended actions
· Verify that the username and password entered are correct.
· Check the authentication configuration in the ISP domain, and verify that the authentication scheme configuration is correct.
Authentication method error
Message
Authentication method error
Reasons
· The authentication method configured is incorrect. For example, a user comes online as a static leased user but the configured authentication method is Web.
· LDAP supports only the PAP authentication mode. The client uses an authentication method other than PAP.
Recommended actions
Modify the configuration and trigger the user to come online again.
Authorize fail
Message
Authorize fail
Reasons
Authorization fails after a user passes authentication.
Recommended actions
1. Contact the administrator of the AAA server to identify whether the authorization attributes on the server are correct. Make sure the authorization attributes issued by the server are correct.
2. Identify whether the corresponding authorization attributes (for example, authorization ACL and VLAN) exist on the device. Verify that the user can obtain the authorization information.
3. If the issue persists, contact Technical Support.
Base service address alloc failed
Message
Base service address alloc failed
Reasons
The IP addresses of the type that the main service relies on to use the basic services (configured by using the basic-service-ip-type command in ISP domain view) fail to be allocated, or IP address allocation times out.
Recommended actions
Verify that the IP address pool is configured correctly. If the issue persists, contact Technical Support.
Cancelled PPPoE agency configuration
Message
Cancelled PPPoE agency configuration
Reasons
The undo pppoe-agency forward command was executed to delete PPPoE agency configuration.
Recommended actions
No action is required.
Connect check fail
Message
Connect check fail
Reasons
Inter-process communication is abnormal during local authentication.
Recommended actions
Contact Technical Support.
CP change from master to backup in cold mode
Message
CP change from master to backup in cold mode
Reasons
In the CPDR environment, when a master CP changes to a backup CP in cold backup, the master CP deletes its user sessions.
Recommended actions
No action is required.
CP send message to UP failed
Message
CP send message to UP failed
Reasons
On a CUPS network, the CUPS connection between CP and UP is disconnected. As a result, the CP fails to send messages to the UP.
Recommended actions
Verify that the CUSP channel is normal. If the issue persists, contact Technical Support.
CPDR no permit users access
Message
CPDR no permit users access
Reasons
On a CPDR network, access users cannot come online on the backup CP.
Recommended actions
Execute the display vbras-cp stable state command to identify whether the CUPS system is stable. If the CUPS system is not stable, wait until it is stable and then trigger users to come online.
Create pppinfo failed
Message
Create pppinfo failed
Reasons
PPPoE fails to notify PPP to start negotiation.
Recommended actions
Contact Technical Support.
CU Smoothing
Message
CU Smoothing
Reasons
· On a CUPS network, the CP and UP are synchronizing data, and users cannot come online.
· On a CUPS network, the master/backup switchover is in progress, and users cannot come online.
Recommended actions
Execute the display vbras-cp stable state command to identify whether the CUPS system is stable. If the CUPS system is not stable, wait until the CP-UP synchronization or master/backup UP switchover is completed and then trigger users to come online.
Cut by the AAA server
Message
Cut by the AAA server
Reasons
The AAA server forcibly logs out users.
Recommended actions
Contact the AAA server administrator, and confirm the reason why the users are forcibly logged out.
Cut command
Message
Cut command
Reasons
The administrator executes the cut access-user command to forcibly log out users.
Recommended actions
No action is required.
Cut command from domain
Message
Cut command from domain
Reasons
The administrator executes the state block offline command in the ISP domain of users to forcibly log out users.
Recommended actions
No action is required.
DHCP allocating IP from local pool failed
Message
DHCP allocating IP from local pool failed
Reasons
Failed to request IP addresses or subnets.
Recommended actions
Execute the debugging dhcp server, debugging dhcp relay, and debugging dhcp-access packet commands to enable debugging for the DHCP server, the DHCP relay agent, and DHCP packets. View the packet interaction process and user access conditions, and troubleshoot if errors are found. If the issue persists, contact Technical Support.
DHCP BRAS OUT DELETE
Message
DHCP BRAS OUT DELETE
Reasons
On a CUPS network, a UP is moving. The lease and subnet information on the moving UP are deleted.
Recommended actions
No action is required.
DHCP configuration synchronization between CTRL-VM and BRAS-VM failed
Message
DHCP configuration synchronization between CTRL-VM and BRAS-VM failed
Reasons
On a CUPS network, configuration synchronization between CTRL-VMs and BRAS-VMs fail. The lease and subnet information on these devices are deleted.
Recommended actions
Check and collect related device configuration, and contact Technical Support.
DHCP decline
Message
DHCP decline
Reasons
IP conflicts might exist on the network. The client sends DECLINE packets to decline the lease.
Recommended actions
In normal conditions, the DHCP client will request an IP address again. If the DHCP client fails to request an IP address after multiple retries, contact Technical Support.
DHCP free lease with command
Message
DHCP free lease with command
Reasons
Execute the reset dhcp server ip-in-use, reset ipv6 dhcp server ip-in-use, and reset ipv6 dhcp server pd-in-use commands to delete the user lease information.
Recommended actions
· If some commands are executed to delete the user lease, no action is required.
· If no commands are executed to delete the user lease, contact Technical Support.
DHCP generate request pkt fail
Message
DHCP generate request pkt fail
Reasons
When a DHCP access user comes online again in loose mode, the address in DHCP records is different from the IP address carried in ARP packets triggering the user to come online.
Recommended actions
Contact Technical Support.
DHCP invalid IP pool info
Message
DHCP invalid IP pool info
Reasons
The address pool configuration is incorrect.
Recommended actions
Check the address pool configuration. If the configuration errors cannot be located, contact Technical Support.
DHCP lease timeout
Message
DHCP lease timeout
Reasons
The lease times out, and the lease information of the user is deleted.
Recommended actions
Execute the debugging dhcp server, debugging dhcp relay, and debugging dhcp-access packet commands to enable debugging for the DHCP server, the DHCP relay agent, and DHCP packets. View the packet interaction process for use lease renewal.
· If the user does not actively renew the lease, it is normal that the user goes offline.
· If the user has requested for lease renewal, collect the debugging information to locate issues, and troubleshoot the errors. If the issue persists, contact Technical Support.
DHCP memory error
Message
DHCP memory error
Reasons
Failed to apply for the memory.
Recommended actions
Execute the display memory command to view the memory usage of device. If the memory usage reaches the threshold, wait until the memory usage drops below the threshold and then trigger users to come online again. If the memory usage does not reach the threshold, contact Technical Support.
DHCP packet info did not match
Message
DHCP packet info did not match
Reasons
· When a DHCP relay agent receives a reply from the DHCP server, the DHCP relay agent detects a conflict with the recorded user address entry. In this case, the DHCP relay agent drops the reply and the user fails to come online.
· When an ND RS user comes online, the device finds that the client information carried by the ND RS user is different from the authorization information. As a result, the user fails to come online.
Recommended actions
Contact Technical Support.
DHCP release
Message
DHCP release
Reasons
A DHCP user actively sends a RELEASE packet to request going offline.
Recommended actions
No action is required.
DHCP retrieved unexpected IP address
Message
DHCP retrieved unexpected IP address
Reasons
The DHCP server cannot allocate the IP address requested by the client.
Recommended actions
Check the address allocation on the DHCP server:
· If the address requested by the client has been allocated to another client, you can determine whether to request a new address based on the client implementation.
· When the IP address requested by the client has not been allocated to another client, the server might be in abnormal state. Contact Technical Support.
DHCP Smooth aging
Message
DHCP Smooth aging
Reasons
The DHCP lease entry has been deleted. Address synchronization between UCM and DHCP fails. As a result, the user is deleted.
Recommended actions
Contact Technical Support.
DHCP user state timeout
Message
DHCP user state timeout
Reasons
The DHCP module and the UCM module fail to establish a user connection.
Recommended actions
Contact Technical Support.
DHCP VSRP status changed to Down
Message
DHCP VSRP status changed to Down
Reasons
The master or backup VSRP device goes down. As a result, the lease information on the device is deleted.
Recommended actions
No action is required.
DHCP wait client packet timeout
Message
DHCP wait client packet timeout
Reasons
The DHCP client does not respond.
Recommended actions
Execute the debugging dhcp server, debugging dhcp relay, and debugging dhcp-access packet commands to enable debugging for the DHCP server, the DHCP relay agent, and DHCP packets. View the packet interaction process for user coming online. If the issue persists, contact Technical Support
DHCP wait up reply timeout
Message
DHCP wait up reply timeout
Reasons
· UCM response to the UP request times out.
· The process that UCM confirms the roaming user role times out.
· UCM replies to the user and does not allow the user to come online as a roaming user.
Recommended actions
Contact Technical Support.
DHCP with IP address conflict
Message
DHCP with IP address conflict
Reasons
· The dhcp conflict-ip-address offline or ipv6 dhcp conflict-ip-address offline command is executed to log out the old user.
· The user request for an IP address times out.
Recommended actions
Contact Technical Support.
DHCP with server nak
Message
DHCP with server nak
Reasons
· The DHCP server replies with an NAK packet, and denies the address request of the client.
· The server is in abnormal state, and cannot allocate an IP address to the user.
Recommended actions
Contact Technical Support.
DHCP with server no response
Message
DHCP with server no response
Reasons
· The DHCP service is not enabled.
· The IP address pool is not configured with IP addresses that can be allocated.
· The DHCP server does not respond, possibly because the link fails.
Recommended actions
Verify that DHCP is configured correctly. If the issue persists, contact Technical Support.
DHCPv6 client release
Message
DHCPv6 client release
Reasons
A DHCPv6 user actively sends a RELEASE packet to request going offline.
Recommended actions
No action is required.
Disable ipoe via command
Message
Disable ipoe via command
Reasons
IPoE is disabled on the interface.
Recommended actions
Verify that IPoE is enabled and configured correctly on the user access interface.
Disabled PPPoE agency
Message
Disabled PPPoE agency
Reasons
The undo pppoe-agency bind command was executed to disable PPPoE agency.
Recommended actions
No action is required.
Domain denied
Message
Domain denied
Reasons
The access interface of the user is configured to prevent users in the ISP domain from coming online.
Recommended actions
Identify whether the aaa deny-domain isp-name command is executed on the interface to prevent users in the specified ISP domain from coming online. Example: Configure the interface to prevent users in ISP domain test from coming online.
<Sysname> system-view
[Sysname] interface ten-gigabitethernet 3/1/1
[Sysname-Ten-GigabitEthernet3/1/1] display this
#
interface Ten-GigabitEthernet3/1/1
port link-mode route
aaa deny-domain test
#
To cancel the limit, execute the undo aaa deny-domain isp-name command on the interface.
domain is block
Message
domain is block
Reasons
The ISP domain of the user is blocked, and users in the ISP domain cannot request network services.
Recommended actions
Identify whether the state block offline command is executed in the ISP domain to block the ISP domain and forcibly log out users.
<Sysname> system-view
[Sysname] domain name test
[Sysname-isp-test] display this
#
domain name test
state block offline
#
To cancel the configuration, execute the undo state command.
Dpbackup Cfg Change Offline
Message
Dpbackup Cfg Change Offline
Reasons
On a UP backup network in a CUPS system, the UP backup profile change causes the users to go offline.
Recommended actions
If the administrator has known the configuration change, this issue is expected, and no action is required. If the administrator does not know the configuration change, identify whether the UP backup profile configuration change is caused by misoperation of a non-administrator user.
Drv operation failed
Message
Drv operation failed
Reasons
The user session fails to be issued to the hardware.
Recommended actions
Contact Technical Support.
Dynamic ipoe user forbidden
Message
Dynamic ipoe user forbidden
Reasons
Unclassified IPv4 packet initiation is configured to allow only the matching static users, abnormally logged out DHCP users, roaming users, and users in loose mode to come online on an interface.
Recommended actions
Identify whether the ip subscriber initiator unclassified-ip enable matching-user command is executed on the interface. If the command is executed, this issue is expected, and no action is required.
Enable/disable VSRP Instance command
Message
Enable/disable VSRP Instance command
Reasons
When a VSRP instance is added or deleted, old online users will be deleted.
Recommended actions
No action is required.
failed to add nat user data(invalid private network address)
Message
failed to add nat user data(invalid private network address)
Reasons
The user's private network address is invalid.
Recommended actions
1. Delete the NAT-BRAS collaboration configuration in the ISP domain. Example:
<Sysname> system-view
[Sysname] domain name cgn
[Sysname-isp-cgn] undo user-address-type private-ipv4
The following types of user addresses support collaboration with BRAS: private IPv4 addresses (private-ipv4), private dual-stack addresses (private-ds), and lite dual-stack addresses (ds-lite). If related configuration exists, delete the configuration in the ISP domain.
2. Cancel the binding between the load-sharing user group and NAT instance. Example:
<Sysname> system-view
[Sysname] domain name cgn
[Sysname-isp-cgn] undo user-group name ugrp
3. Execute the display access-user command to check the value for the IP address field. If a hyphen (-) is displayed for this field, it means that the user has not obtained a private network address. Check the configurations related to user login.
failed to add nat user data(license invalid)
Message
failed to add nat user data(license invalid)
Reasons
The vBRAS does not have the NAT license installed.
Recommended actions
Purchase and install the NAT license.
Failed to associate the PPPoEA user with the BRAS user
Message
Failed to associate the PPPoEA user with the BRAS user
Reasons
System processing fails when the system attempts to associate a BRAS user with a PPPoEA user.
Recommended actions
Contact Technical Support.
Failed to authenticate for ldap configuration changed
Message
Failed to authenticate for ldap configuration changed
Reasons
When a user is performing LDAP authentication, the LDAP configuration on the device changes.
Recommended actions
Execute the display ldap scheme command to display the current LDAP configuration. Verify that the LDAP configuration is correct, and trigger the users to come online again. During the login process, do not modify the LDAP configuration on the device.
Failed to authenticate for no ldap binding user's DN
Message
Failed to authenticate for no ldap binding user's DN
Reasons
When a user is performing LDAP authentication, the device cannot send the requests for searching for user DNs.
Recommended actions
Enter the LDAP server view, and execute the search-base-dn command to specify the base DN for user search. Example: Specify the base DN for user search:
<Sysname> system-view
[Sysname] ldap server ldap1
[Sysname-ldap-server-ldap1] search-base-dn dc=ldap,dc=com
Failed to come online by using CGN because service-instance-group is invalid
Message
Failed to come online by using CGN because service-instance-group is invalid
Reasons
· The service instance group bound to the NAT instance does not exist.
· The service instance group bound to the NAT instance is not associated with an effective failover group.
Recommended actions
· If the service instance group bound to the NAT instance does not exist, execute the service-instance-group command to create a service instance group, and execute the failover-group command to associate the service instance group with a failover group. Example:
<Sysname> system-view
[Sysname] service-instance-group sgrp
[Sysname-service-instance-group-sgrp] failover-group failgrp
· Use the display failover command to display failover group information. If the value for the Active Status field is Initial, no nodes in the failover group can process services. If the value for the Active Status field is Primary or Secondary, the failover group can normally process services. Associate the service instance group with a failover group that can normally process services.
Failed to compose tacacs request packet
Message
Failed to compose tacacs request packet
Reasons
The device fails to encapsulate HWTACACS packets because the memory of the device in insufficient.
Recommended actions
1. Use the display memory command to view the memory usage of the device, and identify whether the memory of the device is sufficient.
2. Use the display memory-threshold command to identify whether the memory threshold alarms exist. According to the value for the Current free-memory state: field, check the memory alarm state.
3. Clear the memory as needed, for example, reduce the number of online users or close some unneeded services.
Failed to connect with the ldap server
Message
Failed to connect with the ldap server
Reasons
The device fails to connect to the LDAP server for the first time.
Recommended actions
Verify that the connection between the device and the LDAP server is normal.
Failed to connect with the tacacs server
Message
Failed to connect with the tacacs server
Possible reasons
The device has failed to connect to the HWTACACS server.
Recommended actions
Identify the link issues between the device and the HWTACACS server.
Failed to create a PPPoEA session
Message
Failed to create a PPPoEA session
Possible reasons
The device failed to create a session for a PPPoEA user.
Recommended actions
Contact Technical Support.
Failed to deliver PPPoEA user information to the kernel
Message
Failed to deliver PPPoEA user information to the kernel
Possible reasons
The device failed to deliver PPPoEA user information to the kernel.
Recommended actions
Contact Technical Support.
Failed to encode the request packet
Message
Failed to encode the request packet
Possible reasons
The device has failed to encode the request packet.
Recommended actions
1. Use the display memory command to view the memory usage of the device and identify whether the memory is sufficient.
2. Use the display memory-threshold command to view the memory limit alarms. Identify the memory alarm state based on the Current free-memory state: field in the command output.
3. Clear the memory as needed. For example, reduce the number of online users or shut down services currently not needed.
Failed to fill the authentication attributes
Message
Failed to fill the authentication attributes
Possible reasons
Due to insufficient storage space, the device has failed to fill the attributes when encoding the authentication request packets.
Recommended actions
1. Use the display memory command to view to view the memory usage of the device and identify whether the memory is sufficient.
2. Use the display memory-threshold command to view the memory limit alarms. Identify the memory alarm state based on the Current free-memory state: field in the command output.
3. Clear the memory as needed. For example, reduce the number of online users or shut down services currently not needed.
Failed to find AAA server
Message
Failed to find AAA server
Possible reasons
You have not configured the authentication method, authorization method, or accounting method for the access users of the authentication domain.
Recommended actions
Configured the authentication method, authorization method, and accounting method for the access users of the authentication domain. Make sure the specified methods exist.
Specify the authentication method, authorization method, and accounting method as RADIUS for the PPP access users of ISP domain test as follows:
<Sysname> system-view
[Sysname] domain name test
[Sysname-isp-test] authentication ppp radius-scheme rd1
[Sysname-isp-test] authorization ppp radius-scheme rd1
[Sysname-isp-test] accounting ppp radius-scheme rd1
Failed to find the BRAS user
Message
Failed to find the BRAS user
Possible reasons
The corresponding BRAS user information gets lost unexpectedly, and the system cannot find the BRAS user during the association of a PPPoEA user.
Recommended actions
Contact Technical Support.
Failed to get NAT instance
Message
Failed to get NAT instance
Possible reasons
The NAT instance used for user login authorization does not exist.
Recommended actions
· Use the user-group bind nat-instance command to edit the NAT instance associated with the load-sharing user group in the ISP domain. Make sure the load-sharing user group is associated with the same NAT instance as that applied to the device. For example:
<Sysname> system-view
[Sysname] domain name cgn
[Sysname-isp-cgn] user-group name ugrp bind nat-instance inst
· In a CUPS network, you must configure the same NAT instance for the CP and UP. For example:
After you execute the following commands on the CP, do the same on the UP.
<Sysname> system-view
[Sysname] nat instance cgn1 id 1
Failed to get user’s DN from the ldap search result
Message
Failed to get user’s DN from the ldap search result
Possible reasons
The device has failed to obtain the user’s DN from the LDAP server.
Recommended actions
1. Verify that the search-base-dn configuration in LDAP server view for the device is correct.
2. Contact the LDAP server administrator to verify that the user's DN configuration on the LDAP server is correct. Make sure the server has the user’s DN information.
Failed to inherit user information from PPPoE
Message
Failed to inherit user information from PPPoE
Possible reasons
The BRAS device is in abnormal state, for example, the memory threshold is exceeded, or the PPPoE user with the same MAC address in the same VLAN is in abnormal state.
Recommended actions
Contact Technical Support.
Failed to obtain the secret
Message
Failed to obtain the secret
Possible reasons
The user has not provided the user password as required when performing LDAP authentication.
Recommended actions
Request the user to edit the password used for login and try logging in again.
Failed to obtain user group information
Message
Failed to obtain user group information
Possible reasons
In a CUPS network with NAT-BRAS unification configured, bind a load-sharing user group to an NAT instance in ISP domain view to enable load-sharing for the group in the domain. After an access user comes online, the access device adds the user to a user group and assigns an NAT instance to the user based on the following rules:
· After the AAA server assigns a user group to the access user, load-sharing will be performed among the user and other group members. Then, the access device assigns an NAT instance to the user based on the load-sharing user group-NAT instance mappings configured for the authentication domain. If no NAT instance is mapped to the user group, the device does not assign NAT instance to the user, and then the user goes offline.
· If the AAA server assigns no user group to the access user, the access device adds the user to one of the load-sharing user groups specified for the authentication domain. Additionally, the device assigns the NAT instance associated with the user group to the user. For a user, the access device selects the load-sharing user group with the least number of online users in the authentication domain. If the number of online users is the same in each user group, the device selects the most recently configured user group.
· If the AAA server assigns no user group to the access user and no load-sharing user groups are specified for the authentication domain, the user goes offline.
If the user group, to which the user belongs, does not exist, the system prompts message "Failed to obtain user group information".
Recommended actions
In a CUPS network, you must configure the same NAT instance for the CP and UP. For example:
<Sysname> system-view
[Sysname] user-group user
Failed to parse AAA request message
Message
Failed to parse AAA request message
Possible reasons
The device has failed to parse AAA request messages due to insufficient memory.
Recommended actions
1. Use the display memory command to view the memory usage of the device and identify whether the memory is sufficient.
2. Use the display memory-threshold command to view the memory limit alarms. Identify the memory alarm state based on the Current free-memory state: field in the command output.
3. Clear the memory as needed. For example, reduce the number of online users or shut down services currently not needed.
Failed to smooth the PPPoEA session
Message
Failed to smooth the PPPoEA session
Possible reasons
The system failed to smooth PPPoEA user information between the PPPoE module and the UCM module.
Recommended actions
Contact Technical Support.
Failed to switch workslot for user is not up
Message
Failed to switch workslot for user is not up
Possible reasons
When the user session is unstable, the negotiation slot changes on the card to which the interface or aggregation member interface (used for user login) belongs. A negotiation slot change might be due to a reboot or other reasons.
Recommended actions
Contact Technical Support.
Failed to update the PPPoEA session
Message
Failed to update the PPPoEA session
Possible reasons
The device failed to update session information about PPPoEA users.
Recommended actions
Contact Technical Support.
failover group becomes invalid
Message
failover group becomes invalid
Possible reasons
The undo nat centralized-backup enable command is used to disable centralized backup of distributed CGN, and the traffic is switched back to the NAT device with distributed CGN. In this case, if the backup group of the NAT device with distributed CGN cannot correctly operate, the user is forced to go offline.
Recommended actions
Before you disable centralized backup of distributed CGN, verify the availability of the backup group of the NAT device with distributed CGN. User the display failover command to view information about the backup group. If the Active Status field displays Initial in the command output, the backup group has no nodes that can process traffic. In this case, troubleshoot the node failures.
Flow-triggered port block assignment does not support CGN
Message
Flow-triggered port block assignment does not support CGN
Possible reasons
In a NAT+BRAS scenario, when a user comes online, NAT assigns a public IP address and port block to the user. The port block assignment conflicts with the flow-triggered port block assignment configured through the nat port-block flow-trigger enable command.
Recommended actions
Identify whether the nat port-block flow-trigger enable command is executed in system view or NAT instance view. If yes, use the undo nat port-block flow-trigger enable command to disable flow-triggered port block assignment. For example:
<Sysname> system-view
[Sysname] nat instance cgn1 id 1
[Sysname-nat-instance-cgn1] undo nat port-block flow-trigger enable
Force user offline by CUSP aging
Message
Force user offline by CUSP aging
Possible reasons
The CUSP channel is terminated, and the channel fails to be re-established before the CUSP channel aging time expires, which causes users to go offline. The aging time is configured by using the disconnection entry-aging command in CUSP controller view.
Recommended actions
Use the undo disconnection entry-aging command in CUSP controller view to delete the aging time setting.
Going online failed because matching CGN doesn't support port block
Message
Going online failed because matching CGN doesn't support port block
Possible reasons
In a NAT+BRAS scenario, if the port block parameters are not specified for an NAT configuration, the NAT configuration cannot assign a port block to a user that comes online.
Recommended actions
In address group view of the NAT configuration that applies to the user, use the port-block command to configure the port block parameters. For example:
<Sysname> system-view
[Sysname] nat address-group 1
[Sysname-address-group-1] port-block block-size 256 extended-block-number 1
Hardware not support IPV6 PD prefix with mask longer than 120
Message
Hardware not support IPV6 PD prefix with mask longer than 120
Possible reasons
The hardware device does not support a user with an IPv6 PD prefix longer than 120 bits.
Recommended actions
Verify the IPV6 PD prefix pool settings and make sure the IPv6 PD prefix are shorter than or equal to 120 bits.
ICMP with detect fail
Message
ICMP with detect fail
Possible reasons
· With the firewall configured, the client does not respond to ICMP probe packets.
· The intermediate transmission devices drop or edit the probe packets.
· Failures occur on the link.
· The device drops the probe packets.
· The device drops the packets due to incorrect access methods, incorrect interface status, or incorrect user information.
Recommended actions
Disable the firewall on the client, such as Windows Firewall. If the issue persists, identify at which stage the packets are dropped by the following methods:
· View the time when the user came online and went offline.
· View the probe settings.
· Use the trace access-user command to create a service tracing object.
· View packet transmitting and receiving status.
After you identify at which stage the packets are dropped, perform corresponding actions to deal with the failure.
ICMPv6 with detect fail
Message
ICMPv6 with detect fail
Possible reasons
· With the firewall configured, the client does not respond to ICMP probe packets.
· The intermediate transmission devices drop or edit the probe packets.
· Failures occur on the link.
· The device drops the probe packets.
· The device drops the packets due to incorrect access methods, incorrect interface status, or incorrect user information.
Recommended actions
Disable the firewall on the client, such as Windows Firewall. If the issue persists, identify at which stage the packets are dropped by the following methods:
· View the time when the user came online and went offline.
· View the probe settings.
· Use the trace access-user command to create a service tracing object.
· View packet transmitting and receiving status.
After you identify at which stage the packets are dropped, perform corresponding actions to deal with the failure.
Idle cut
Message
Idle cut
Possible reasons
The user does not generate enough traffic to meet the specified volume in a specific period, and is forced to go offline.
Recommended actions
This situation is normal if the authorization time is appropriate. The user can come back online as needed. If the authorization time is not appropriate, edit the authorization idle cut settings for the AAA server or ISP domain to which the device belongs.
idle cut
Message
idle cut
Possible reasons
The user does not generate enough traffic to meet the specified lower threshold in a specific period, and is forced to go offline.
Recommended actions
This situation is normal. The user can come back online as needed.
Inherited PPPoE user went offline
Message
Inherited PPPoE user went offline
Possible reasons
A PPPoE user went offline, and IPoE user inheriting information of the PPPoE user is logged off.
Recommended actions
Identify the offline reason of the PPPoE user and resolve the issue.
Insufficient hardware resources
Message
Insufficient hardware resources
Possible reasons
The hardware resources are insufficient.
Recommended actions
Use the display access-user count command to view the number of users.
Use the following commands to view the hardware resource usage:
· display qos-acl resource
· display hardware internal pppoe record summary session
· display hardware internal ucm record type
Interface deactive
Message
Interface deactive
Possible reasons
The reboot of the interface card or removing the interfaces causes the interface to be inactivated, and the user fails to come online or forced to go offline.
Recommended actions
Identify whether the interface card has rebooted or the interfaces has been removed through the following methods:
· Use the display logbuffer command to display log buffer information and buffered logs.
· View the log file. You can use the display logfile summary command to obtain the path of the log file, and then execute the more command or export the log file to the local host.
If the interface card has rebooted or the interfaces has been removed, identify the reboot cause. If no such events took place, contact Technical Support.
Interface down
Message
Interface down
Possible reasons
The link connecting to the interface that the user uses to come online is down or has flapped.
Recommended actions
Identify whether the interface is down or has experienced link flaps through the following methods:
· Use the display logbuffer command to display log buffer information and buffered logs.
· View the log file. You can use the display logfile summary command to obtain the path of the log file, and then execute the more command or export the log file to the local host.
If the interface is down or has experienced link flaps, no actions are required. If no such events took place, contact Technical Support.
Interface MAC change
Message
Interface MAC change
Possible reasons
The interface MAC address that the user uses to come online has changed. The user is forced to go offline because it is using the former MAC address.
Recommended actions
Identify whether the interface MAC address has been changed by executing the mac-address command through the following methods:
· Use the display history-command all command to display all commands that are saved in the command history buffer for all CLI sessions.
· Use the display logbuffer command to display log buffer information and buffered logs.
· View the log file. You can use the display logfile summary command to obtain the path of the log file, and then execute the more command or export the log file to the local host.
If the interface MAC address has been changed by executing the mac-address command, no actions are required. If not, contact Technical Support.
Interface shutdown
Message
Interface shutdown
Possible reasons
The interface is shut down, which causes the user to go offline or fail to come online.
Recommended actions
Identify whether the interface has been shut down through the following methods:
· Use the display history-command all command to display all commands that are saved in the command history buffer for all CLI sessions.
· Use the display logbuffer command to display log buffer information and buffered logs.
· View the log file. You can use the display logfile summary command to obtain the path of the log file, and then execute the more command or export the log file to the local host.
If the interface has been shut down, no actions are required. If not, contact Technical Support.
Invalid ldap username
Message
Invalid ldap username
Possible reasons
When the user performs LDAP authentication, the username it provides is invalid.
Recommended actions
Verify the validity of the username. For example, make sure the username contains no more than 255 characters. Request the user to edit its username and try to log in again.
Invalid username or password
Message
Invalid username or password
Possible reasons
The username and password are invalid.
Recommended actions
Verify the validity of the entered username and password, and try to log in again.
Invalid Vlan value
Message
Invalid Vlan value
Possible reasons
When a DHCP user requests to come online, the ARP packets that the device sends out carry a different VLAN tag than the user, and the user fails to come online.
Recommended actions
Contact Technical Support.
IP address is not a valid user address
Message
IP address is not a valid user address
Possible reasons
The IP address is invalid.
Recommended actions
Contact Technical Support.
ip subscriber access-block
Message
ip subscriber access-block
Possible reasons
The interface that the user uses to come online has the ip subscriber access-block command executed to forbid IPoE users from coming online.
Recommended actions
Execute the undo ip subscriber access-block command on the interface to cancel forbidding IPoE users from coming online, and then request the user to log in again.
IP6CP is already down
Message
IP6CP is already down
Possible reasons
When DHCPv6 requests to bring up the connection, the IP6CP connection of PPP is down.
Recommended actions
Execute the display system internal ucm access-user slot 1 user-id command in probe view to identify why the IP6CP connection is down. If you cannot fix the issue based on the command output, contact Technical Support.
IPoE access mode or authentication method error
Message
IPoE access mode or authentication method error
Possible reasons
A global IPoE static session with a PD prefix can be accessed only on Layer 2, and you must specify the authentication method to allow users to come online.
Recommended actions
Verify the global IPoE static session configuration.
IPoE lease sub-user without the main user
Message
IPoE lease sub-user without the main user
Possible reasons
When an IPoE subuser comes online, the system cannot find its parent user.
Recommended actions
Contact Technical Support.
IPoE user conflict
Message
IPoE user conflict
Possible reasons
If the interface has IPoE dynamic users that are online, configuring IPoE interface-leased or L2VPN-leased users forces IPoE dynamic users on the interface to go offline.
Recommended actions
No actions are required.
IPoELease main user offline
Message
IPoELease main user offline
Possible reasons
For IPoE interface-leased users, if the parent user goes offline, its sub-users also go offline.
Recommended actions
Use the display aaa offline-record command to identify why the parent user goes offline, and identify whether the sub-users going offline is normal.
IPv6 PD prefix conflict
Message
IPv6 PD prefix conflict
Possible reasons
For IPoE users in Layer 2 access mode or dual-stack IPoE static users, if two users trying to come online have the same MAC address but different PD prefixes, the two users cannot come online because of PD prefix conflict.
Recommended actions
Contact Technical Support.
IPv6 user managed flag error
Message
IPv6 user managed flag error
Possible reasons
In IANA or IAPD applications, the interface that the user uses to come online is not configured with the managed flag.
Recommended actions
Execute the ipv6 nd autoconfig managed-address-flag command on the interface (or VT interface for PPPoE). For a PPP user, you can also execute the ipv6 nd autoconfig managed-address-flag command for the ISP domain where the user belongs.
L2TP alloc sessionid fail
Message
L2TP alloc sessionid fail
Possible reasons
The total number of sessions exceeds the limit.
Recommended actions
Use the display l2tp session statistics command to view the total number of L2TP sessions and identify whether the number exceeds the device limit.
L2TP alloc tunnelid fail
Message
L2TP alloc tunnelid fail
Possible reasons
No available tunnel IDs can be allocated because the number of tunnels exceeds the limit. As a result, the system has failed to establish the tunnel.
Recommended actions
Use the display l2tp tunnel statistics command to view the total number of L2TP tunnels and identify whether the number exceeds the device limit.
L2TP checking ICCN error
Message
L2TP checking ICCN error
Possible reasons
The AVP attribute carried by the ICCN message does not meet the negotiation requirement, or the ICCN message has failed to be parsed.
Recommended actions
Verify L2TP related settings. If the settings are correct but the negotiation still fails, contact Technical Support.
L2TP checking ICRQ error
Message
L2TP checking ICRQ error
Possible reasons
The AVP attribute carried by the ICRQ message does not meet the negotiation requirement.
Recommended actions
Verify L2TP related settings. If the settings are correct but the negotiation still fails, contact Technical Support.
L2TP checking SCCRP error
Message
L2TP checking SCCRP error
Possible reasons
· The SCCRP message carries an invalid tunnel ID.
· A reason, such as an invalid challenge, caused an AVP attribute parsing error.
Recommended actions
Verify L2TP related settings on the peer. If the settings are correct but the negotiation still fails, contact Technical Support.
L2TP inner error
Message
L2TP inner error
Possible reasons
An internal error occurs.
Recommended actions
Verify L2TP related settings on the peer. If the settings are correct but the negotiation still fails, contact Technical Support.
L2TP instance cfg change
Message
L2TP instance cfg change
Possible reasons
· The tunnel source IP address changes, which brings down L2TP tunnels created based on the source IP address.
· The UP ID is removed from the BRAS VM, which brings down L2TP tunnels based on the UP ID.
Recommended actions
This is a normal situation. No actions are required.
L2TP peer cleared tunnel
Message
L2TP peer cleared tunnel
Possible reasons
The local device receives a StopCCN message from the peer, and clears the L2TP tunnels from the local device.
Recommended actions
Use the display l2tp statistics failure-reason command to identify why the peer clears tunnels and contact Technical Support.
L2TP remote slot
Message
L2TP remote slot
Possible reasons
The card to which the interface or aggregation member interface (used for user login) belongs is unplugged, and the user is forced to go offline.
Recommended actions
This is a normal situation. No actions are required.
L2TP SCCCN check fail
Message
L2TP SCCCN check fail
Possible reasons
· Errors occur when parsing the SCCCN message.
· The local device cannot recognize the AVP attribute that the SCCCN message carries, which caused the local device fails negotiation.
Recommended actions
Verify settings on the peer and contact Technical Support.
L2TP SCCRQ check fail
Message
L2TP SCCRQ check fail
Possible reasons
· The device fails to obtain the L2TP group based on the host name in the SCCRQ message.
· The SCCRQ message carries an invalid tunnel ID.
· A reason, such as an invalid challenge, caused an AVP attribute parsing error.
Recommended actions
Verify settings on the peer. If the settings are correct but the negotiation still fails, contact Technical Support.
L2TP send ICCN fail
Message
L2TP send ICCN fail
Possible reasons
The local device fails to send the ICCN message.
Recommended actions
Contact Technical Support.
L2TP send ICRP fail
Message
L2TP send ICRP fail
Possible reasons
The local device fails to send the ICRP message.
Recommended actions
Contact Technical Support.
L2TP send ICRQ fail
Message
L2TP send ICRQ fail
Possible reasons
The local device fails to send the ICRQ message.
Recommended actions
Contact Technical Support.
L2TP send SCCRQ fail
Message
L2TP send SCCRQ fail
Possible reasons
The local device fails to send the SCCRQ message, possibly due to disconnection.
Recommended actions
Contact Technical Support.
L2TP service is unavailable
Message
L2TP service is unavailable
Possible reasons
L2TP is not enabled on the local device, or the connection between the LAC and LNS is down.
Recommended actions
Verify settings and ping the LAC from the LNS.
L2TP session limit
Message
L2TP session limit
Possible reasons
The number of L2TP tunnel sessions exceeds the limit.
Recommended actions
Use the l2tp session-limit command to adjust the maximum number of L2TP sessions for the UP, and then request the user to come online again.
L2TP session wait for time out
Message
L2TP session wait for time out
Possible reasons
The L2TP session negotiation times out, possibly due to link failures.
Recommended actions
Identify link failures. If you cannot fix the issue, contact Technical Support.
L2TP tunnel time out
Message
L2TP tunnel time out
Possible reasons
The tunnel keepalive timer times out, possibly due to link failures or the serial numbers used for traffic control are not aligned.
Recommended actions
Verify the link between the LAC and LNS. If yes, use the display l2tp control-packet statistics and display l2tp statistics all command to view L2TP protocol packet statistics and verify packet transmitting and receiving. If you cannot identify the issue, check the packet dropping nodes and contact Technical Support.
L2TP with cut command
Message
L2TP with cut command
Possible reasons
The reset l2tp tunnel command is executed on the local device to delete tunnels.
Recommended actions
This is a normal situation. No actions are required.
L2TP with memory alloc fail
Message
L2TP with memory alloc fail
Possible reasons
The device does not have sufficient memory.
Recommended actions
Use the display memory command to identify whether the memory is sufficient. If memory is sufficient, contact Technical Support.
L2TP with UP is not exist
Message
L2TP with UP is not exist
Possible reasons
In a CUPS network, the master UP specified for the L2TP (upon creation) does not exist.
Recommended actions
Contact Technical Support.
LAC clear session
Message
LAC clear session
Possible reasons
The local device receives the CDN message from the peer.
Recommended actions
Use the display l2tp statistics failure-reason command to view the message interactions and why the peer goes offline.
LAC clear tunnel
Message
LAC clear tunnel
Possible reasons
The local device receives the StopCCN message from the peer.
Recommended actions
Use the display l2tp statistics failure-reason command to view the message interactions and why the peer goes offline.
LAC too many session in mid state tunnel
Message
LAC too many session in mid state tunnel
Possible reasons
Before the L2TP tunnel negotiation completes, more than 300 temporary sessions created based on the tunnel time out, and no more users can access the tunnel.
Recommended actions
Use the display l2tp tunnel command to view the tunnel status. After the L2TP tunnel negotiation completes, allow users to access the tunnel.
Layer2 IPoE leased subusers do not support access through IA_PD or the NDRS scenario of one prefix per user
Message
Layer2 IPoE leased subusers do not support access through IA_PD or the NDRS scenario of one prefix per user
Possible reasons
Subusers of Layer 2 IPoE leased lines do not support access through IA_PD or NDRS in per user per prefix manner. If subusers of Layer 2 IPoE leased lines are configured mistakenly to use IA_PD or NDRS in per user per prefix manner, user association fails.
Recommended actions
Correct the configuration to prevent subusers of Layer 2 IPoE leased lines from accessing the network through IA_PD or NDRS in per user per prefix manner.
LB Offline
Message
LB Offline
Possible reasons
In an LAC CUPS network, a user in a policy group cannot use different interfaces to come online.
Recommended actions
Contact Technical Support.
Ldap admin-binding operation failed
Message
Ldap admin-binding operation failed
Possible reasons
The DN of the administrator configured on the device is not the same as that of the administrator on the LDAP server.
Recommended actions
Enter LDAP server view, use the login-dn command to edit the DN for the administrator to align the DN with that of the administrator on the LDAP server. For example:
<Sysname> system-view
[Sysname] ldap server ldap1
[Sysname-ldap-server-ldap1] login-dn cn=administrator,cn=users,dc=ld
Ldap server connection error occurred while authenticating
Message
Ldap server connection error occurred while authenticating
Possible reasons
When the user performs authentication, the device fails to connect to the LDAP server.
Recommended actions
Use the display ldap scheme command to view information about the LDAP server in use, and then identify the link failures between the device and the LDAP server.
LNS cfg change
Message
LNS cfg change
Possible reasons
The configuration of the allow l2tp command changes, which cause the L2TP tunnels to be deleted from the VT interface.
Recommended actions
This is a normal situation. No actions are required.
LNS clear tunnel
Message
LNS clear tunnel
Possible reasons
The local device receives the StopCCN message from the peer.
Recommended actions
Use the display l2tp statistics failure-reason command to view the message interactions and why the peer goes offline.
LNS cleared session
Message
LNS cleared session
Possible reasons
The local device receives the CDN message from the peer.
Recommended actions
Use the display l2tp statistics failure-reason command to view the message interactions and why the peer goes offline.
LNS mandatory-chap error
Message
LNS mandatory-chap error
Possible reasons
Forced CHAP authentication is configured but the VT interface has no CHAP configuration.
Recommended actions
Execute the undo mandatory-chap command in LNS-mode L2TP group view to delete the forced CHAP authentication configuration, and then request the user to access the L2TP tunnel again.
LNS proxy negotiation fail
Message
LNS proxy negotiation fail
Possible reasons
After a prenegotiation (such as an MRU negotiation or authentication negotiation) fails, the LCP negotiation is restarted.
Recommended actions
Verify the L2TP settings and then access the L2TP tunnel again.
Local no this user
Message
Local no this user
Possible reasons
The user goes online through local authentication, but the device does not have such a local user.
Recommended actions
Use the display local-user command to identify whether the user is created on the local device. If not, create the user on the local device.
local no this user
Message
local no this user
Possible reasons
The user goes online through local authentication, but the device does not have such a local user.
Recommended actions
Use the display domain command to identify whether the authentication domain is configured with local authentication. By default, the authentication domain uses local authentication. If the user authentication method is specified as local authentication, use the display local-user command to verify the user configuration on the local device. If the user does not exist on the local device, use the local-user command to create the user configuration on the local device, including the password and service type.
Create device management user test, specify the password as 123456TESTplat&!, and specify the service type as SSH.
<Sysname> system-view
[Sysname] local-user test class manage
[Sysname-luser-manage-test] password simple 123456TESTplat&!
[Sysname-luser-manage-test] service-type ssh
Local-user access-limit
Message
Local-user access-limit
Possible reasons
The number of concurrent logins using the local user name reached the maximum.
Recommended actions
Cancel the limit on the number of concurrent logins using the local user name or increase the maximum number of concurrent logins:
· Use the undo access-limit command to cancel the limit on the number of concurrent logins using the local user name.
<Sysname> system-view
[Sysname] local-user test class manage
[Sysname-luser-manage-test] undo access-limit
· Use the undo access-limit command to increase the maximum number of concurrent logins (10, in this example).
<Sysname> system-view
[Sysname] local-user test class manage
[Sysname-luser-manage-test] access-limit 10
Logged out by the RADIUS proxy
Message
Logged out by the RADIUS proxy
Possible reasons
The IPoE user was logged out because the wireless client logged out.
Recommended actions
Examine the cause of the logout of the wireless client. If the wireless client did not log out abnormally, no action is required.
Macauth without the ipoe user
Message
Macauth without the ipoe user
Possible reasons
The IPoE user could not be found during MAC authentication for the possible reason that the IPoE user has gone offline.
Recommended actions
Examine why the IPoE user went offline. If the reason cannot be determined, contact Technical Support.
MAC address conflict
Message
MAC address conflict
Possible reasons
The maximum number of PPPoE sessions that can be created for each user on an interface is 1 (specified by the pppoe-server session-limit per-mac command). If the device receives a PADR packet with the same MAC address as an online user that has completed NCP negotiation for over 30 seconds, it sends a PADT packet to notify the online user to go offline. Then, the device closes the current session. This operation ensures that a new session with the same MAC can be created.
Recommended actions
Verify if the network requires only one PPPoE session per user on an interface based on the actual conditions.
· If only one PPPoE session is required, no action is required.
· If more than one PPPoE sessions are required, use the pppoe-server session-limit per-mac command to change the maximum number of PPPoE sessions that can be created for each user on an interface. Then, use the remote address dhcp client-identifier command and specify the session-info keyword for PPP sessions to participate in DHCP client ID generation.
Magic number check failed
Message
Magic number check failed
Possible reasons
Magic number check was enabled for PPP, and the locally saved magic number was different from the magic number carried in the packet received from the peer end.
Recommended actions
Capture Echo-Request and Echo-Reply packets to check whether their Magic-Number fields are correct, and contact Technical Support.
Maximum concurrent users for the account has been reached
Message
Maximum concurrent users for the account has been reached
Possible reasons
The maximum number of concurrent users for the account in an AAA domain has been reached.
Recommended actions
Modify the access-limit command configuration in the ISP domain and bring the user online.
NAT instance state error
Message
NAT instance state error
Possible reasons
In an N:1 warm backup scenario of a vBRAS CUPS system, no CGN warm backup group was configured on the CP.
Recommended actions
Create a CGN-UP backup profile in warm standby mode and bind it to a NAT instance. Specify a backup UP and master UPs in the CGN-UP backup profile.
<Sysname> system-view
[Sysname] cgn-backup-profile 1 warm-standby nat-instance cgn-a
[Sysname-cgn-backup-profile-1] backup up-id 1026
[Sysname-cgn-backup-profile-1] master up-id 1024
[Sysname-cgn-backup-profile-1] master up-id 1025
nat online failed because of match config failed
Message
nat online failed because of match config failed
Possible reasons
In a NAT and BRAS unification scenario, the user failed to match a nat outbound command configuration.
Recommended actions
1. Use the display nat outbound command to identify the ACL used to match user traffic. For example:
<Sysname> display nat outbound
NAT outbound information:
Totally 1 NAT outbound rules.
Interface: Ten-GigabitEthernet3/1/1
ACL: 2036 Address group: 1 Port-preserved: Y
NO-PAT: N Reversible: N
Config status: Active
2. Use the display acl command to verify that the ACL matched user traffic. If the xx times matched field is absent, the ACL did not match user traffic. For example:
<Sysname> display acl 2036
Basic IPv4 ACL 2036, 1 rule,
ACL's step is 5
rule 0 permit source 10.210.0.0 0.0.0.255
3. Modify the ACL.
nat online failed because of match session-service-location failed
Message
nat online failed because of match session-service-location failed
Possible reasons
No failover group was specified to process session-based services, or the specified failover group failed to match user traffic.
Recommended actions
1. Use the display current-configuration | include session command to verify that a session service-location acl command configuration exists. For example:
<Sysname> display current-configuration | include session
session service-location acl 2000 failover-group aa
2. If no session service-location acl command configuration exists, execute the session service-location acl. For example:
<Sysname> system-view
[Sysname] session service-location acl 2010 failover-group aa
3. Use the display acl command to verify that the ACL matched user traffic. If the xx times matched field is absent, the ACL did not match user traffic. For example:
<Sysname> display acl 2000
Basic IPv4 ACL 2000, 1 rule,
ACL's step is 5
rule 0 permit source 10.210.0.0 0.0.0.255
4. Modify the ACL.
NAT Online failed by not bind vsrp
Message
NAT Online failed by not bind vsrp
Possible reasons
In a 1:1 hot backup scenario or N:1 warm backup scenario of a vBRAS CUPS system, the NAT instances on the NAT devices backing up each other are not bound to the same VSRP instance.
Recommended actions
Bind the NAT instances on the NAT devices backing up each other to the same VSRP instance. For example:
<Sysname> system-view
[Sysname] nat instance inst
[Sysname-nat-instance-inst] bind vsrp-instance 1
NAT Online failed by vsrp channel state error
Message
NAT Online failed by vsrp channel state error
Possible reasons
In a 1:1 hot backup scenario or N:1 warm backup scenario of a vBRAS CUPS system, VSRP failed to establish a data backup channel for NAT services after a NAT instance is bound to a VSRP instance.
Recommended actions
1. Use the display vsrp instance command to verify that the backup IDs of the VSRP instances bound to the NAT interfaces on UPs are the same.
2. Verify that the TCP port numbers for VSRP to establish data backup channels are the same on the two devices.
3. If the TCP port numbers are different, use the nat vsrp-port command to modify a TCP port number. For example:
<Sysname> system-view
[Sysname] nat vsrp-port 30000
ND detect fail
Message
ND detect fail
Possible reasons
· Intermediate devices drop or modify ND probe packets.
· Link failures existed.
· The device itself dropped ND probe packets because the access mode, interface state, or user information is incorrect.
Recommended actions
View the difference between the login time and logout time, view probe configuration. Execute the trace access-user command to configure a service tracing object. Observe the packet sending and receiving to identify where packets are lost, and troubleshoot the problem based on the packet loss information.
No AAA response during realtime accounting
Message
No AAA response during realtime accounting
Possible reasons
The device failed to receive response packets for real-time accounting packets from the accounting server.
Recommended actions
1. Verify that the IP address of the device was added on the accounting server and that the added IP address is the same as the source IP address of accounting packets.
2. Verify that the device and the accounting server can reach each other.
No AAA response for accounting start
Message
No AAA response for accounting start
Possible reasons
The device failed to receive an Accounting-Response packet from the accounting server.
Recommended actions
1. Verify that the IP address of the device was added on the accounting server and that the added IP address is the same as the source IP address of accounting packets.
2. Verify that the device and the accounting server can reach each other.
No available pool
Message
No available pool
Possible reasons
AAA did not have authorized IPv4 address pools or IPv4 address pool groups.
Recommended actions
Modify the IPv4 address pool or IPv4 address pool group in the ISP domain.
No IPv6 address available
Message
No IPv6 address available
Possible reasons
For IA_NA users, AAA did not authorize an IPv4 address pools or IPv4 address pool group.
Recommended actions
Modify the IPv6 address pool or IPv6 address pool group in the ISP domain.
No prefix available
Message
No prefix available
Possible reasons
For ND RS users, AAA did not authorize an IPv6 prefix or the interface was not configured with an IP address or prefix.
Recommended actions
Modify the authorization settings in the ISP domain or configure an IP address or configure the prefix information in RA messages by using the ipv6 nd ra prefix command on the interface. Configuring the prefix information in RA messages is not applicable in a non-vBRAS CUPS system.
No response of control packet from peer
Message
No response of control packet from peer
Possible reasons
On an L2TP network, the device failed to create a flow control timer.
Recommended actions
Contact Technical Support.
Old connection is exist
Message
Old connection is exist
Possible reasons
No gateway IP address is configured for an IP pool.
Recommended actions
Execute the gateway-list command in IP pool view to specify gateway addresses to be assigned to DHCP clients.
On-line user with the same mac exists
Message
On-line user with the same mac exists
Possible reasons
An online static user existed with the same MAC address when a dynamic user attempts to come online.
Recommended actions
1. Use the display access-user command to check whether an online static user with the same MAC address really exists.
2. If yes, no action is required.
3. If not, contact Technical Support.
Only static leased users are permitted
Message
Only static leased users are permitted
Possible reasons
The interface was configured with static leased sessions, and the access user did not match the configuration.
Recommended actions
No action is required.
Packet Authenticator Error
Message
Packet Authenticator Error
Possible reasons
In IPoE Layer 3 access mode, DHCP users are blocked by using the quiet timer.
Recommended actions
Use the reset ip subscriber chasten user quiet command to manually clear the blocking state of blocked users or wait the quiet timer to expire before bringing the users online again.
PPP authentication method error
Message
PPP authentication method error
Possible reasons
The device was configured with CHAP, and the client used PAP for authentication.
Recommended actions
Use the ppp authentication-mode command to change the authentication mode.
ppp chasten
Message
ppp chasten
Possible reasons
A PPP user was blocked because the number of authentication failures of the user reached the limit in the specified authentication period.
Recommended actions
Bring the user online again after the quiet timer expires.
PPP IPCP negotiate fail
Message
PPP IPCP negotiate fail
Possible reasons
· An invalid IP address is assigned, or an IP address failed to be assigned.
· Unknown packets were received.
· The BRAS device did not receive a configure ack packet for a configure request after the wait timer expired.
Recommended actions
Examine the device configuration, collect PPP protocol packet information, and contact Technical Support.
PPP IPCP terminate
Message
PPP IPCP terminate
Possible reasons
The device received an ipcp terminal request from the client and forcibly logged out the user.
Recommended actions
No action is required.
PPP IPv6CP negotiate fail
Message
PPP IPv6CP negotiate fail
Possible reasons
· Unknown packets were received.
· The BRAS device did not receive a configure ack packet for a configure request after the wait timer expired.
Recommended actions
1. Verify that the device configuration is correct.
2. If the problem persists, contact Technical Support.
PPP IPv6CP terminate
Message
PPP IPv6CP terminate
Possible reasons
The device received an ipv6cp terminal request from the client and forcibly logged out the user.
Recommended actions
No action is required.
PPP loopback detected
Message
PPP loopback detected
Possible reasons
PPP negotiation packets were looped which might be caused by link failures.
Recommended actions
Troubleshoot link failures, and contact Technical Support.
PPP magicnumber check fail
Message
PPP magicnumber check fail
Possible reasons
Magic number check was enabled for PPP, and the negotiated magic numbers were different.
Recommended actions
Use the undo ppp magic-number-check command to disable magic number check for PPP.
PPP negotiate fail
Message
PPP negotiate fail
Possible reasons
The PPP negotiation was interrupted.
Recommended actions
1. Verify that the device configuration is correct.
2. If the problem persists, contact Technical Support.
PPP Recover failed
Message
PPP Recover failed
Possible reasons
The PPP session failed to be recovered.
Recommended actions
Contact Technical Support.
PPP recv ip6cp Protocol Reject
Message
PPP recv ip6cp Protocol Reject
Possible reasons
The device received an IPv6CP reject packet, which might indicate option negotiation failures.
Recommended actions
1. Verify that the device configuration is correct.
2. If the problem persists, contact Technical Support.
PPP recv ipcp Protocol Reject
Message
PPP recv ipcp Protocol Reject
Possible reasons
The device received an IPCP reject packet, which might indicate option negotiation failures.
Recommended actions
1. Verify that the device configuration is correct.
2. If the problem persists, contact Technical Support.
PPP up recv ip6cp again
Message
PPP up recv ip6cp again
Possible reasons
· Repeated IPv6CP negotiation packets were received when the IPv6CP is in open state. This might be because the client re-initiated a connection after being disconnected.
· IPv6CP negotiation packets were retransmitted.
Recommended actions
1. Use the display system internal ucm statistics packets command to check whether packet loss occurred.
2. Capture packets and troubleshoot link failures.
3. If the problem persists, contact Technical Support.
PPP up recv ipcp again
Message
PPP up recv ipcp again
Possible reasons
· Repeated IPCP negotiation packets were received when the IPCP is in open state. This might be because the client re-initiated a connection after being disconnected.
· IPCP negotiation packets were retransmitted.
Recommended actions
1. Use the display system internal ucm statistics packets command to check whether packet loss occurred.
2. Capture packets and troubleshoot link failures.
3. If the problem persists, contact Technical Support.
PPP user request
Message
PPP user request
Possible reasons
The PPP user initiated a Terminate Request to go offline.
Recommended actions
Establish a dialup connection again from the client.
PPP username is null
Message
PPP username is null
Possible reasons
The ppp username check command is executed, and the device received online requests that do not carry usernames.
Recommended actions
If the administrator requires that online requests carry usernames, no action is required. Otherwise, execute the undo ppp username check command to allow users to come online without usernames in online requests.
PPP wait chap response time out
Message
PPP wait chap response time out
Possible reasons
The device failed to receive a CHAP response after the timer expired. The device retransmitted challenge requests for the maximum number of times. This was because the client was disconnected or the link failed.
Recommended actions
1. Verify that it is not the client that initiated the disconnection.
2. Troubleshoot link failures.
3. If the problem persists, contact Technical Support.
PPP wait pap request time out
Message
PPP wait pap request time out
Possible reasons
· The device failed to receive a PAP request after the timer expired. This might be because the client was disconnected.
· The link failed.
Recommended actions
1. Verify that it is not the client that initiated the disconnection.
2. Troubleshoot link failures.
3. If the problem persists, contact Technical Support.
PPP wait pap response time out
Message
PPP wait pap response time out
Possible reasons
· The device failed to receive a CHAP response after the timer expired. The device retransmitted challenge requests for the maximum number of times. This was because the client was disconnected.
· The link failed.
Recommended actions
1. Verify that it is not the client that initiated the disconnection.
2. Troubleshoot link failures.
3. If the problem persists, contact Technical Support.
PPP with echo fail
Message
PPP with echo fail
Possible reasons
· Intermediate devices drop or modify PPP probe packets.
· Link failures existed.
· The device itself dropped ND probe packets because the access mode, interface state, or user information was incorrect.
Recommended actions
View the difference between the login time and logout time, and view probe configuration. Execute the display ppp packet statistics command to view the packet sending and receiving to identify where packets are lost, and troubleshoot the problem based on the packet loss information. If you cannot find out the packet loss reason, contact Technical Support.
PPPoE agency failed to start PPP
Message
PPPoE agency failed to start PPP
Possible reasons
The system failed to start PPP negotiation for the PPPoEA user.
Recommended actions
Contact Technical Support.
PPPOE send pads failed
Message
PPPoE send pads failed
Possible reasons
The device failed to send PADS packets.
Recommended actions
Contact Technical Support.
PPPoEA session information failed to be synchronized between slots
Message
PPPoEA session information failed to be synchronized between slots
Possible reasons
The system failed to synchronize session information about PPPoEA users among slots.
Recommended actions
Contact Technical Support.
proxy with smooth fail
Message
proxy with smooth fail
Possible reasons
In a vBRAS CUPS system, the CU was disconnected.
Recommended actions
Contact Technical Support.
Radius authentication and authorization do not same
Message
Radius authentication and authorization do not same
Possible reasons
The RADIUS authentication server and authorization server used during RADIUS authentication are different servers.
Recommended actions
Verify that the authentication and authorization methods use the same RADIUS scheme in an ISP domain.
If the authentication and authorization methods use different RADIUS schemes, configure the same RADIUS scheme in the ISP domain.
<Sysname> system-view
[Sysname] domain name test
[Sysname-isp-test] authentication login radius-scheme rd
[Sysname-isp-test] authorization login radius-scheme rd
RADIUS authentication rejected
Message
RADIUS authentication rejected
Possible reasons
RADIUS authentication requests from users were rejected.
Recommended actions
Contact the server administrator to obtain the rejection reason.
Re-DHCP for IPoE Web authentication
Message
Re-DHCP for IPoE Web authentication
Possible reasons
When re-DHCP for IPoE Web authentication enabled, users need to log out and then log in again after receiving accounting responses.
Recommended actions
No action is required.
Receive padt packet from user
Message
Receive padt packet from user
Possible reasons
The device received a PADT packet from a client. The client sent a PADT packet to go offline proactively.
Recommended actions
No action is required.
RedisDBM block
Message
RedisDBM block
Possible reasons
Users were denied access because RMDB was performing data self-recovery or UP migration was in progress.
Recommended actions
Bring users online after data self-recovery or UP migration is completed.
RedisDBM clear
Message
RedisDBM clear
Possible reasons
In an RMDB network, a UP was moved out of a BRAS-VM, and the corresponding users were deleted.
Recommended actions
No action is required.
RedisDBM deactive
Message
RedisDBM deactive
Possible reasons
In an RMDB network, the device logged out sessions that had not completed negotiation before PPP sessions stared to recover.
Recommended actions
Bring users online after data self-recovery and PPP session recovery are completed.
Remote interface offline
Message
Remote interface offline
Possible reasons
In a vBRAS CUPS system, users were logged out because the interface on a UP was deactivated and was not managed by the CPU.
Recommended actions
No action is required.
Server is disabled
Message
Server is disabled
Possible reasons
PPPoE was disabled on the user access interface, and the interface enabled with PPPoE was deleted.
Recommended actions
No action is required.
Service unavailable
Message
Service unavailable
Possible reasons
The internal connection between the PPP module and the UCM module was not established.
Recommended actions
Contact Technical Support.
Service-type mismatch with local-user's
Message
Service-type mismatch with local-user's
Possible reasons
The service type of users is not an allowed service type configured for local users on the device.
Recommended actions
Use the display local-user command to check whether the service type of users is an allowed service type configured for local users If not, use the service-type command to modify the service type.
session time out
Message
session time out
Possible reasons
The session timed out, and the user was logged out.
Recommended actions
Enable RADIUS packet debugging to check whether the Session-Timeout attribute existed in accounting-update response packets from the accounting server or whether the value of the Session-Timeout attribute is 0.
No action is required.
Static user not config
Message
Static user not config
Possible reasons
The user information did not match the configured IPoE static user information.
· For a user that initiated IPoE sessions by sending NS or NA packets, if its packet cannot match a static session or a roaming-capable user in the Web authentication phase and the user cannot come online in loose mode, the user cannot come online.
· For a user that initiated IPoE sessions by sending ARP packets, if its packet cannot match a static session or a roaming-capable user in the Web authentication phase and the user cannot come online in loose mode, the user cannot come online.
Recommended actions
1. Check the configured IPoE static user information.
2. If the issue persists, contact Technical Support.
Status Error
Message
Status Error
Possible reasons
In a vBRAS CUPS system, the state of the user access interface is not master after a master/backup UP switchover. This might be because both the master interface and backup interface failed.
Recommended actions
Check whether both the master interface and backup interface failed. If yes, no action is required. If not, contact Technical Support.
TACACS authentication rejected
Message
TACACS authentication rejected
Possible reasons
The server rejected the TACACS authentication request of a user.
Recommended actions
1. Verify that the shared keys on the device and the HWTACACS server match.
If the shared keys on the device and the HWTACACS server do not match, modify the shared key in the HWTACACS scheme to match the shared key on the HWTACACS server.
2. Use the correct username and password to come online again.
3. If the problem persists, contact Technical Support.
Tacacs continue authentication failed
Message
Tacacs continue authentication failed
Possible reasons
During the HWTACACS authentication process, the HWTACACS client sent the HWTACACS server a continue-authentication packet that includes the login password, and the HWTACACS server returned an authentication failure packet.
Recommended actions
1. Verify that the shared keys on the device and the HWTACACS server match.
If the shared keys on the device and the HWTACACS server do not match, modify the shared key in the HWTACACS scheme to match the shared key on the HWTACACS server.
2. Use the correct username and password to come online again.
3. If the problem persists, contact Technical Support.
Tacacs follow authentication failed
Message
Tacacs follow authentication failed
Possible reasons
During the HWTACACS authentication process, the device failed to select a secondary HWTACACS server for authentication.
Recommended actions
1. Verify that the shared keys on the device and the HWTACACS server match.
If the shared keys on the device and the HWTACACS server do not match, modify the shared key in the HWTACACS scheme to match the shared key on the HWTACACS server.
2. Use the display memory command to view the memory usage. If the memory usage is high, reduce online users or disable unnecessary services.
3. If the problem persists, contact Technical Support.
Tacacs restart authentication failed
Message
Tacacs restart authentication failed
Possible reasons
Authentication to another HWTACACS server still failed.
Recommended actions
1. Verify that the shared keys on the device and the HWTACACS server match.
If the shared keys on the device and the HWTACACS server do not match, modify the shared key in the HWTACACS scheme to match the shared key on the HWTACACS server.
2. Use the correct username and password to come online again.
3. If the problem persists, contact Technical Support.
TERM with Ifnet down
Message
TERM with Ifnet down
Possible reasons
The access interface went down at the network layer, causing subnet-leased users to go offline.
Recommended actions
Use the display interface command to view the physical layer state and link layer state of the access interface. If physical layer state and link layer state are not up, troubleshoot link failures.
The address state is incorrect
Message
The address state is incorrect
Possible reasons
No gateway IP addresses were configured in the IP address pool, and no gateway IP address was configured on the interface.
Recommended actions
Check the configuration of the IP address pool and the interface.
The authorized vpn is invalid
Message
The authorized vpn is invalid
Possible reasons
The authorized VPN did not exist on the device.
Recommended actions
Create an authorization VPN for AAA on the device.
The BRAS user associated with the PPPoEA user is offline
Message
The BRAS user associated with the PPPoEA user is offline
Possible reasons
The BRAS user associated with the PPPoEA user went offline.
Recommended actions
Identify the reason that the BRAS user went offline and resolve the issue.
The drv does not support
Message
The drv does not support
Possible reasons
The device did not support access of the user.
Recommended actions
Contact Technical Support.
The IPoE lease user is conflict with the static user
Message
The IPoE lease user is conflict with the static user
Possible reasons
For an unclassified-IP user, if its packet matches both an interface-leased session and a static session, the user cannot come online.
Recommended actions
1. Verify that the interface is not configured with both a leased session and a static session.
2. If the problem persists, contact Technical Support.
The memory reached the restart threshold
Message
The memory reached the restart threshold
Possible reasons
The users could not come online because the memory usage reached the alarm threshold.
Recommended actions
Bring the users online when memory usage dropped below the alarm threshold. You can use the display memory command to view the memory usage.
The NAT instance was unbound from CGN-UP backup profile
Message
The NAT instance was unbound from CGN-UP backup profile
Possible reasons
In an N:1 warm backup scenario of a vBRAS CUPS system, users were logged out because a CGN-UP backup profile was deleted from the CP.
Recommended actions
Do not delete the CGN-UP backup profile when online users exist.
The non-static user is kicked off the line by the static user
Message
The non-static user is kicked off the line by the static user
Possible reasons
When a static user came online, a dynamic online user with the same MAC address was logged out.
Recommended actions
No action is required.
The number of terminals on this interface exceeds limit
Message
The number of terminals on this interface exceeds limit
Possible reasons
The number of access users on an interface reached the configured maximum.
Recommended actions
Check whether the number of access users on an interface really reached the configured maximum. If not, contact Technical Support.
The number of terminals on this machine exceeds limit
Message
The number of terminals on this machine exceeds limit
Possible reasons
The number of access users reached the maximum.
Recommended actions
Check whether the number of access users really reached the maximum by using the display access-user count command. If not, contact Technical Support.
The number of users exceeds limit
Message
The number of users exceeds limit
Possible reasons
The number of access users reached the maximum allowed by the device.
Recommended actions
Use the display access-user count command to check whether the number of access users really reached the maximum allowed by the device.
The PPPoEA user already exists
Message
The PPPoEA user already exists
Possible reasons
The device received a PPPoE agent request from a PPPoEA user that is already online.
Recommended actions
Contact Technical Support.
The PPPoEA user already exists
Message
The PPPoEA user already exists
Possible reasons
The device received a PPPoE agent request from a PPPoEA user that is already online.
Recommended actions
Contact Technical Support.
The PPPoEA user does not exist in the PPPoE module
Message
The PPPoEA user does not exist in the PPPoE module
Possible reasons
Information about the PPPoEA user does not exist in the PPPoE module.
Recommended actions
Contact Technical Support.
The PPPoEA user failed to select an access interface
Message
The PPPoEA user failed to select an access interface
Possible reasons
The PPPoEA user group name is incorrect or the access interface is down.
Recommended actions
1. Verify the configuration of the pppoe-agency bind command and make sure PPPoE agency interfaces and PPPoE agency groups are bound correctly.
2. Execute the display interface interface-type interface-number command to view interface status and verify that both the physical state and the protocol state of the interface are up.
3. If the issue persists, contact Technical Support.
The PPPoEA user failed to select an access interface because agency is not enabled
Message
The PPPoEA user failed to select an access interface because agency is not enabled
Possible reasons
PPPoE agency is not enabled on the correct interface by using the pppoe-agency bind command.
Recommended actions
1. Verify the configuration of the pppoe-agency bind command and make sure PPPoE agency interfaces and PPPoE agency groups are bound correctly.
2. If the issue persists, contact Technical Support.
The PPPoEA user failed to select an access interface because the interface control block does not exist
Message
The PPPoEA user failed to select an access interface because the interface control block does not exist
Possible reasons
The interface control block does not exist.
Recommended actions
1. Verify the configuration of the pppoe-agency bind command and make sure PPPoE agency interfaces and PPPoE agency groups are bound correctly.
2. If the issue persists, contact Technical Support.
The PPPoEA user failed to select an access interface because the interface is not permitted to access
Message
The PPPoEA user failed to select an access interface because the interface is not permitted to access
Possible reasons
The PPPoEA user attempts to access the network through an interface on the backup device in the VSRP group.
Recommended actions
1. Examine the VSRP instance state of the device. If the device is the backup device, no action is required.
2. If the issue persists, contact Technical Support.
The PPPoEA user failed to select an access interface because the interface is physically down
Message
The PPPoEA user failed to select an access interface because the interface is physically down
Possible reasons
The interface is down.
Recommended actions
1. Execute the display interface interface-type interface-number command to view interface status and verify that both the physical state and the protocol state of the interface are up.
2. If the issue persists, contact Technical Support.
The PPPoEA user failed to switch the negotiation slot
Message
The PPPoEA user failed to switch the negotiation slot
Possible reasons
The PPPoEA user failed to switch the negotiation slot.
Recommended actions
Contact Technical Support.
The protocol stack on which the base service depends is IPv4
Message
The protocol stack on which the base service depends is IPv4
Possible reasons
The IP address type on which the main service of IPoE users depends is configured as IPv4, and the user cannot come online in the IPv6 stack because it has not come online in the IPv4 stack. To configure the IP address type on which the main service of IPoE users depends, use the ip subscriber basic-service-ip-type ipv4 command or the ip subscriber authentication-method command with the basic-service-ipv4 keyword specified.
Recommended actions
Verify if the IPv4 dependency is configured based on the actual network requirements.
· If yes, no action is required.
· If no, change the dependency setting as needed.
The protocol stack on which the base service depends is IPv6
Message
The protocol stack on which the base service depends is IPv6
Possible reasons
The IP address type on which the main service of IPoE users depends is configured as IPv6, and the user cannot come online in the IPv4 stack because it has not come online in the IPv6 stack. To configure the IP address type on which the main service of IPoE users depends, use the ip subscriber basic-service-ip-type ipv6 command.
Recommended actions
Verify if the IPv6 dependency is configured based on the actual network requirements.
· If yes, no action is required.
· If no, change the dependency setting as needed.
The source IP address of the L2TP tunnel does not support backup
Message
The source IP address of the L2TP tunnel does not support backup
Possible reasons
In a 1:1 hot backup, N:1 warm backup, or 1:N warm backup network, L2TP users are logged off after a LAC UP master/backup switchover. This issue occurs if the L2TP tunnel is established by using the source end IP address specified by the tunnel up-id up-id source-ip source-ip-address [ vpn-instance vpn-instance-name ] command.
Recommended actions
Confirm if it is acceptable that L2TP users must come online again after a master/backup switchover.
· If yes, make L2TP users come online from the new master LAC UP.
· If no, change the source end IP address used to establish L2TP tunnels to prevent L2TP users from being logged off again at a master/backup switchover. For example, use either of the following commands to specify the source end IP address:
¡ l2tp-up-backup master up-id backup up-id lac-source-ip source-ip-address [ vpn-instance vpn-instance-name ] master-cost cost backup-cost cost
¡ l2tp-up-backup lac-source-ip-pool { ip-pool ip-pool-name | ip-pool-group ip-pool-group-name } [ vpn-instance vpn-instance-name ] master-cost cost backup-cost cost
The user conflicts with an online user with the same DHCP client ID
Message
The user conflicts with an online user with the same DHCP client ID
Possible reasons
The PPPoE user requests an IP address from DHCP, but DHCP detects that an online user using the same DHCP client ID (formed by MAC address and VLAN) as the new user exists on the current device. The new user fails to come online.
Recommended actions
Use the display access-user command in any view on the BRAS device to verify if an online user using the same MAC address and VLAN as the new user exists on the device.
· If such a user exists, verify if the user access interface is configured with remote address dhcp client-identifier with the session-info keyword specified.
¡ If the setting is not configured, execute the remote address dhcp client-identifier with the session-info keyword specified as needed. After the command execution, make the user come online again. If the user fails to come online again, contact Technical Support.
¡ If the setting is configured, contact Technical Support.
· If such a user does not exist, contact Technical Support.
If users of other types than PPPoE fail to come online, contact Technical Support.
The user group of the BRAS user changed
Message
The user group of the BRAS user changed
Possible reasons
The user-group attribute of the BRAS user was changed to a group that does not support PPPoE agency through COA on the AAA server, or the undo user-group command was executed on the device to delete the user group of the BRAS user.
Recommended actions
No action is required.
The user with the same MAC address already exists on the backup interface
Message
The user with the same MAC address already exists on the backup interface
Possible reasons
In a UP backup network, a user requests to come online from an interface, but the CP detects that an online user using the same VLAN and MAC address as the new user exists on the backup interface of the access interface. The new user fails to come online.
Recommended actions
Verify if the online user is a normal user.
· If yes, no action is required.
· If no, use the cut access-user command to delete the online user on the backup interface, and then make the new user come online.
The user with the same IP address already exists on the backup interface
Message
The user with the same IP address already exists on the backup interface
Possible reasons
In a UP backup network, a user requests to come online from an interface, but the CP detects that an online user using the same IP address as the new user exists on the backup interface of the access interface. The new user fails to come online.
Recommended actions
Verify if the online user is a normal user.
· If yes, no action is required.
· If no, use the cut access-user command to delete the online user on the backup interface, and then make the new user come online.
The user's 802.1X client has not come online
Message
The user's 802.1X client has not come online.
Possible reasons
In an 802.1X authentication network, if the BRAS device receives an ARP packet, unknown-sourced IP packet, or NS/NA packet from a user before the user's 802.1X client comes online from an interface enabled with static 802.1X authentication, the BRAS device rejects the user to come online as a static 802.1X user. Static 802.1X authentication can be configured by using the ip subscriber static-dot1x-user enable command.
Recommended actions
First make the user's 802.1X client come online. Then, make the user visit any network or ping its own gateway to trigger sending of ARP packets, unknown-sourced IP packets, or NS/NA packets to come online.
The VPN bound to the IPoE static user and the authorized VPN are different
Message
The VPN bound to the IPoE static user and the authorized VPN are different
Possible reasons
IPoE static user could not come online because the VPN bound to the IPoE static user was different from the AAA-authorized VPN.
Recommended actions
Modify the VPN bound to the IPoE static user or the AAA-authorized VPN to make them the same.
The VPN to which the subscriber belongs has been deleted
Message
The VPN to which the subscriber belongs has been deleted
Possible reasons
The VPN instance to which a user belonged was deleted.
Recommended actions
If the VPN instance should not be deleted, re-create it.
Tunnel with session null
Message
Tunnel with session null
Possible reasons
A session was deleted because the L2TP configuration was modified (such as modifying the VT number by using the allow l2tp command). The tunnel was deleted with the session.
Recommended actions
No action is required.
UCM notifies the PPPoEA user to go offline
Message
UCM notifies the PPPoEA user to go offline
Possible reasons
The UCM module notifies the PPPoEA user to go offline.
Recommended actions
Contact Technical Support.
UCM portswitch process fail
Message
UCM portswitch process fail
Possible reasons
An IPoE user fails to roam due to internal errors.
Recommended actions
Contact Technical Support.
Unmatched Vpn-Instance
Message
Unmatched Vpn-Instance
Possible reasons
The AAA-authorized VPN was different from the VPN configured on the access interface.
Recommended actions
Modify the AAA-authorized VPN or the VPN on the access interface to make them the same.
UP mode change
Message
UP mode change
Possible reasons
Online users on an interface were logged out because the interface was added to a UP backup profile.
Recommended actions
1. Verify that online users on an interface are logged out because the interface is added to a UP backup profile.
2. Contact Technical Support.
UP mode is standby
Message
UP mode is standby
Possible reasons
In a UP backup network, users could not come online on an interface because the interface was a backup interface.
Recommended actions
1. Bring the users online after the failure is recovered or the switchover is completed.
2. If the problem persists, contact Technical Support.
UP Switch NO IfBackup
Message
UP Switch NO IfBackup
Possible reasons
In a vBRAS CUPS system with UP backup, the backup interface is invalid after a master/backup UP switchover.
Recommended actions
Check the VLAN termination or user VLAN configuration of subinterfaces of the master and backup interfaces. For example, if you configure VLAN termination for VLAN 100 on the subinterface of the master interface, you must also configure VLAN termination for VLAN 100 on the subinterface of the backup interface.
UP Switch Offline
Message
UP Switch Offline
Possible reasons
In a vBRAS CUPS system with UP backup, a user was logged out during a master/backup UP switchover performed when the user was in unstable state (for example, when the user was coming online.)
Recommended actions
1. Verify that the master/backup UP switchover is performed while the user is coming online.
2. If the master/backup UP switchover is not performed while the user is coming online, contact Technical Support.
UPLB Delete
Message
UPLB Delete
Possible reasons
In a vBRAS CUPS system, the corresponding users were deleted because the UP was moved.
Recommended actions
No action is required.
User binding attributes mismatch with local-user's
Message
User binding attributes mismatch with local-user's
Possible reasons
During local authentication, the attributes of a user were inconsistent with the binding attributes configured for the local user.
Recommended actions
Use the display local-user command check whether the attributes of a user are inconsistent with the binding attributes configured for the local user. If not, use the bind-attribute command to modify the binding attributes in local user view.
User is in local-user blacklist
Message
User is in local-user blacklist
Possible reasons
With the password control function configured, the device adds a user to the blacklist if the user fails local authentication. When the user fails the maximum number of consecutive attempts, the device does not allow the user log in as configured.
Recommended actions
1. Use the display password-control blacklist command in any view to check whether the user is on the blacklist.
2. If the user is on the blacklist, execute the reset password-control blacklist command in user view to remove the blacklisted user.
3. Bring the user online again.
User request
Message
User request
Possible reasons
· IPoE was disabled on the interface.
· L2TP negotiation failed, and a CDN packet was sent to notify the remote end to terminate session negotiation and tear down the session.
Recommended actions
If the user went offline not because the access configuration was disabled, contact Technical Support.
VSRP status change
Message
VSRP status change
Possible reasons
· In a VSRP environment, sessions that had not completed negotiation were disconnected during a master/backup switchover.
· In a VSRP environment, the backup device cannot connect users.
Recommended actions
No action is required.
Web user request
Message
Web user request
Possible reasons
A Web user initiated an offline request.
Recommended actions
No action is required.
Web with unknown error
Message
Web with unknown error
Possible reasons
During Web re-authentication, the user was in modify state.
Recommended actions
Contact Technical Support.
When the IPoE Web user is coming online in postauth by inheriting PPPoE user info, the BRAS rejects Web access requests from the user
Message
When the IPoE Web user is coming online in postauth by inheriting PPPoE user info, the BRAS rejects Web access requests from the user
Possible reasons
When an IPoE Web user of the preauthentication domain attempts to come online in the postauthentication domain by inheriting PPPoE user information, the BRAS device denies the Web online request upon receiving the request. The user then uses the inherited information to come online in the postauthentication domain.
Recommended actions
No action is required.
