- Table of Contents
- Related Documents
-
| Title | Size | Download |
|---|---|---|
| 01-Text | 1018.54 KB |
Contents
About the H3C Cloudnet platform
View the cloud-managed AP list
Manage bulk configuration templates
Manage private software versions
View operation logs or login logs
About the H3C Cloudnet platform
H3C Cloudnet platform is a new IT operations platform targeted at Wi-Fi operations companies, O2O enterprises, and medium- and small-sized enterprises.
H3C Cloudnet platform merges H3C WLAN products into one platform, allowing for online network monitoring, device O&M, O2O services operation, and seamless incorporation with third-party platforms. It offers the following benefits:
· Manageability—You can monitor the entire network in real time for fast failure location and troubleshooting, deploy services as needed to monitor employee and user traffic, and tune your running services accordingly.
· Reliability—H3C Cloudnet platform provides only monitor and deployment services and does not process network services. When the network connection is unavailable, the system enables the portal fail-permit feature immediately so that authenticated users can continue to access the network and unauthenticated and new users can access the network without being authenticated. In addition, the Cloudnet platform is deployed across data centers for data backup and it uses the microservices architecture for distributed deployment to ensure uninterrupted services.
· High security—H3C Cloudnet platform uses UniCloud for deployment and provides attack protection, ACL, vFirewall, application firewall, and database access control to ensure application and data security.
· Cost effective—Provides tenants with free network management and authentication services in the cloud and incorporated third-party services. Users can customize the third-party services as needed, and only some applications are charged.
Table 1 displays the network management menus available for a branch or site.
|
Level 1 |
Level 2 |
Level 3 |
Branch |
Site |
|
Network |
Tenants |
√ |
√ |
|
|
Dashboard |
√ |
× |
||
|
Sites |
√ |
√ |
||
|
Devices |
√ |
√ |
||
|
Organization |
√ |
√ |
||
|
Endpoints |
Client Statistics |
Client Summary |
√ |
√ |
|
Client Details |
√ |
√ |
||
|
Traffic Summary |
√ |
√ |
||
|
Traffic Details |
√ |
√ |
||
|
Endpoints |
Critical Clients |
√ |
√ |
|
|
Cameras |
√ |
√ |
||
|
Monitor |
ACs |
Summary |
× |
√ |
|
AP Summary |
× |
√ |
||
|
AP Details |
√ |
√ |
||
|
Cloud APs |
Dashboard |
× |
√ |
|
|
AP List |
× |
√ |
||
|
Routers |
Summary |
× |
√ |
|
|
4G/5G |
× |
√ |
||
|
App Ranking |
× |
√ |
||
|
User Ranking |
× |
√ |
||
|
AP Summary |
× |
√ |
||
|
AP Details |
√ |
√ |
||
|
Switches |
Summary |
× |
× |
|
|
AP Summary |
× |
√ |
||
|
AP Details |
× |
√ |
||
|
Settings |
Autodeploy |
√ |
√ |
|
|
Bulk Cfg Templates |
√ |
√ |
||
|
ACs |
Wireless Services |
× |
√ |
|
|
AP Settings |
× |
√ |
||
|
WLAN Security |
× |
√ |
||
|
Service Settings |
× |
√ |
||
|
Basic Settings |
× |
√ |
||
|
Authentication |
× |
√ |
||
|
Users |
× |
√ |
||
|
802.1X Auth |
× |
√ |
||
|
GUI Bulk Settings |
√ |
× |
||
|
CLI Bulk Settings |
√ |
× |
||
|
Maintain |
Upgrade |
√ |
√ |
|
|
Private Versions |
√ |
√ |
||
|
CLI Helper |
× |
√ |
||
|
File System |
× |
√ |
||
|
Restore |
× |
√ |
||
|
Compare Cfg |
√ |
√ |
||
|
Device Operation |
√ |
√ |
||
|
Health Check |
√ |
√ |
||
|
Tools |
√ |
√ |
||
|
Replace Devices |
√ |
√ |
||
|
Messages |
Alarms |
√ |
√ |
|
|
SMS Details |
√ |
√ |
||
|
Operation Logs |
√ |
√ |
||
|
System Messages |
√ |
√ |
||
|
Fault Reports |
√ |
√ |
||
|
System |
SMS Gateway |
√ |
√ |
|
|
Service Switch |
√ |
√ |
||
|
Labels |
√ |
√ |
||
|
Subaccounts |
√ |
√ |
||
|
Open Platforms |
√ |
√ |
||
|
Account |
√ |
√ |
||
|
Device Unbinding |
√ |
√ |
||
Table 2 Asset management
|
Level 1 |
Level 2 |
|
Service |
Endpoints |
|
Assets |
Manage your network
You are placed on the Network grid menu after you log in to the Cloudnet platform.
Network
Manage tenants
This task is available only for MSP accounts.
Perform this task to manage tenants and networks, management requests, and inactivated accounts. The created tenants will be managed by the MSP account directly.
View tenant information and manage tenants
1. From the left navigation pane, select Network > Tenants.
The Tenant Info tab displays information about managed tenants and device association status.
2. To create a tenant, click Create Tenant, and then configure the tenant as follows:
¡ Specify tenant information, including username (tenant name), enterprise name, email address, and password.
¡ Agree to the user agreement.
¡ Click Complete.
3. To access the Web interface of a tenant, click the tenant name in the Tenant Info list. To return to the Web interface of the MSP account, click the account name at the upper right corner, select Change Account, and then click Back to MSP Account.
4. To approve or deny tenant management requests, click Requests to Approve. Select the requests and then click Approve or Deny.
5. To view inactivated accounts, click Unactivated Accounts.
The list that opens displays email-registered accounts that have not been activated.
View the tenant management record
1. From the left navigation pane, select Network > Tenants.
2. Click the Records tab to view the record of tenant management approval, denial, and withdrawal operations.
Access the dashboard
For more information, see H3C Cloudnet Deployment Guide.
Manage site information
View site information
1. From the left navigation pane, select Network > Sites.
2. Select a branch and a site from the top of the work pane.
The Site Summary tab displays the following information about the selected site:
¡ Site Summary—Total device quantity and online device quantity in each category, or online client quantity. You can click the down chevron of a tile to expand the detailed information. To adjust the columns to display, click the Columns icon +/- at the end of the table header.
- Device Information—Information about devices in the site, including online state, device name, category, model, site, and device version. You can manage devices in the site in this area. For more information, see "Manage devices."
- AP Details—Information about APs in the site, including AP name, model, site, AC name, AC SN, MAC address, and version. To filter APs, click Online, Offline, All, or Invalid. To view detailed information about an AP, click the AP name.
- Online Client List & Client Remarks—Information about APs in the site, including AP name, model, site, AC name, AC SN, MAC address, and version. To edit the remarks of a client, click the remarks column for the client.
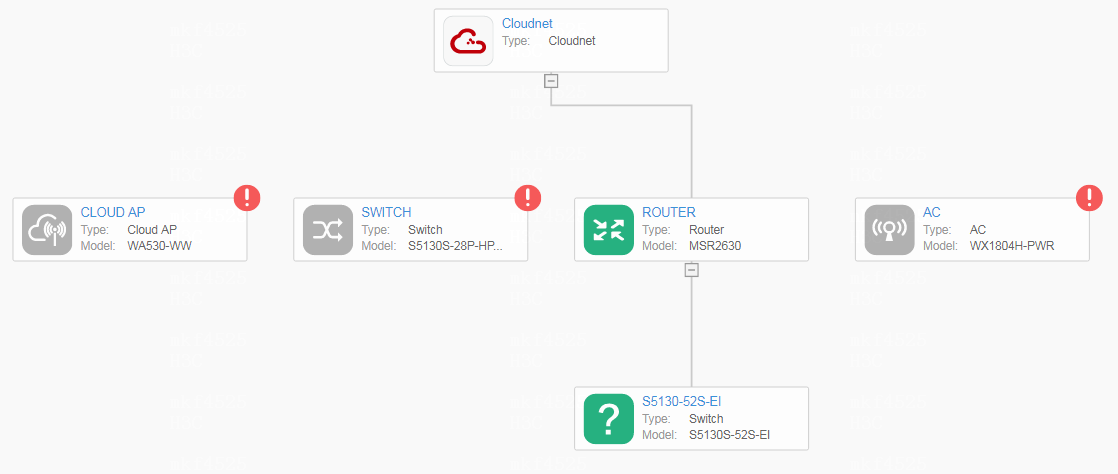
¡ Network Topology—The system automatically discovers devices in the site through LLDP and creates a topology. If the system cannot identify a device, such as a device registered in another site or a non-H3C device, it marks the device icon with a question mark (?), which represents a virtual node.
|
|
NOTE: The topology cannot display IRF fabrics and port aggregation. |
Figure 1 Network topology
Manage devices
1. From the left navigation pane, select Network > Sites.
2. Select a branch and a site from the top of the work pane.
3. On the Site Summary tab, click the Device List down chevron in the AC or Cloud AP tile.
The Device Information list opens.
4. To remove devices from the site, select the devices, and then click Delete.
5. To restart devices, select the devices, and then click Restart.
6. To disconnect devices from the cloud network and connect again, select the devices, and then click Reset Cloud Connection.
7. To upgrade devices, select the devices, and then click Update. To upgrade the software to a specific version, go to the Maintenance > Software Upgrade page. For more information, see "Upgrade device software."
8. To configure a device from the CLI, select the device, and then click CLI Helper. For more information, see "Use the CLI helper."
9. To manage the file system of a device, select the device, and then click File System. For more information, see "Access the file system."
10. To access the local Web interface of a device, select the device, and then click Local Management. This task is available only for online devices of specific models.
11. To save the running configuration of a device, select the device, and then click Save Config.
12. To view detailed information about a device or manage a device, click the device name.
The window that opens at the right of the page displays device basics, port, operation, and configuration information as well as configuration shortcuts. You can click Details to open the device details page.
Manage the site topology
Only the tenant can edit the topology.
To manage the site topology:
1. From the left navigation pane, select Network > Sites.
2. Select a branch and a site from the top of the work pane.
3. On the Site Summary tab, perform the following tasks to edit the topology:
¡ To
discover new devices, click the Details icon ![]() . The dialog box that opens
displays newly discovered devices.
. The dialog box that opens
displays newly discovered devices.
- To restart device discovery, click Rediscover.
- To register devices in the site, select target devices and then click Register.
¡ To update the topology after a topology change, click Recalculate. The system automatically recalculates the topology after you manually add, delete, or register devices.
¡ To refresh the topology, click Refresh. To enable automatic topology refreshing, enable Auto Refresh. This operation triggers the system to refresh the topology at intervals of 10 seconds in the coming hour.
¡ To zoom in or zoom out the topology, click the Zoom In or Zoom Out icon. To change the topology orientation, click Vertical or Horizontal. If the canvas cannot display all devices at the same time after modification, you can drag a device icon to adjust the display.
¡ To display device IP addresses or interface names, select Show IP Address or Show Interface Name. To display only nodes of specific levels, select the levels from the list. Options include Expand All, Level One Nodes, Level Two Nodes, and Level Three Nodes.
¡ To view basic, detailed, and running information about a device and manage a device, click the device icon.
¡ To add a device manually, click the Details icon and then click the Incorrectly Displayed Devices tab. Only specific devices, such as ACG devices, can be added manually as gateway devices. The following states are available for incorrectly displayed devices:
- Unknown Version—Cloudnet cannot obtain version information for the device.
- Version Not Supported—Cloudnet cannot obtain hardware information for the device.
- NETCONF Connection Not Established—Connection errors exist between the device and Cloudnet.
- LLDP Disabled—LLDP is disabled on the device.
- Other.
¡ To
download the topology, click the Download icon ![]() .
.
Endpoints
View client statistics
Perform this task to view network access information such client and traffic statistics.
General restrictions and guidelines
· Associated clients include clients that have passed and have not passed authentication.
· If no authentication is configured, authenticated clients are counted as 0.
View client summary
Perform this task to view summary about currently online, first-access, multiple-access (associated), and total clients, and average online duration.
Restrictions and guidelines
· Data comparison
¡ You cannot compare statistics for the current day.
¡ You can compare client statistics for the same site or for different sites as needed. When you compare statistics for the same site:
- You can compare the client trend and average online duration in one day by clicking the date twice.
- If you compare the client trend and average online duration in two different time ranges, the number of days in the time ranges must be the same.
¡ When you compare statistics for different sites, you can compare only statistics on the same day or in the same time range.
¡ If you specify a time range that spans multiple days, statistics about the current day are not collected.
· Client distribution by week visit quantity/week visits trend
¡ If you select a single day, the system displays the client data for the week that includes the specified day. For example, if you select 2018-05-23, the system displays the client data from 2018-05-21 to 2018-05-27.
¡ If you select multiple days, the system displays the client data for the weeks that include the specified days. For example, if you select 2018-05-20 to 2018-05-21, the system displays the client data from 2018-05-14 to 2018-05-20 and 2018-05-21 to 2018-05-27.
Procedure
1. From the left navigation pane, select Endpoints > Client Statistics > Client Summary.
2. Select a branch and a site from the top of the work pane.
3. To compare client statistics in the specified time range, click Data Comparison in the Client Trend area.
4. To compare the average length of stay for clients in the specified time range, click Data Comparison in the Average Online Duration Trend area.
Parameters
· Client statistics
¡ Online Clients: Number of online clients in all sites.
¡ Avg Online Duration: Daily average online duration per client for each site. If you select a time range that spans more than one day, statistics on all these days are counted as a sum.
· Client Rank
¡ By Quantity
- Top 5: Top 5 dates when a site has the most clients or top 5 sites with the most clients.
- Bottom 5: Top 5 dates when a site has the least clients or top 5 sites with the least clients. If the current day is selected, this graph displays statistics for the past 7 days.
¡ Online Duration Ranking
- Top 10: Top 10 clients that have the longest online duration for a site or multiple sites.
· Access User Proportion: Proportions of first-access clients and multiple-access clients during the specified time range.
· Client Trend: Hourly client trend for the selected day or the daily client trend for the selected time range. A client is counted as one client even if the client has accessed the network multiple times in five minutes or a day.
¡ Data Comparison: Compares data in specified sites and time ranges.
· By Client Vendor: Distribution of clients by client vendor.
· By SSID: Distribution of clients by SSID.
· Online Duration Proportion: Distribution of clients by online duration. The statistics are cumulative. For example, if a client has accessed a site twice, the client is counted as two clients and the length of stay is the sum of the two accesses.
· Average Online Duration Trend: Average online duration of all clients by day. If you select Today, the statistics for the past seven days are displayed.
¡ Data Comparison: Compares data in specified sites and time ranges.
· Number of Week Visits/Week Visits Trend: Distribution of clients by number of week visits.
View client details
Perform this task to view online or offline client information and export the data for analysis.
Restrictions and guidelines
You can select only one site.
The tables display only default
information. To view more information, click the Columns icon ![]() and then select the target columns to
display.
and then select the target columns to
display.
Procedure
1. From the left navigation pane, select Endpoints > Client Statistics > Client Details.
2. Select a branch and a site from the top of the work pane.
3. To view detailed information about associated clients, click Associated Clients.
4. To view detailed information about authenticated clients, click Authenticated Clients.
Parameters
· Online Clients: Detailed information about all online clients in the current site.
· Client History: Detailed information about all offline clients within the past one to seven days.
View traffic summary
Perform this task to view summary about real-time client traffic or client traffic trend in the specified time range and compare traffic statistics in one site or between different sites.
Restrictions and guidelines
· If you specify a time range that spans multiple days, day-on-day statistics are not displayed.
· If you select Today, the statistics for the past seven days are displayed.
· You cannot compare statistics for the current day.
· You can compare traffic statistics for the same site or for different sites as needed. When you compare statistics for one site:
¡ You can compare the traffic statistics in one day by clicking the date twice.
¡ If you compare the traffic statistics in two different time ranges, the number of days in the time ranges must be the same.
· When you compare statistics for different sites, you can compare only statistics on the same day or in the same time range.
Procedure
1. From the left navigation pane, select Endpoints > Client Statistics > Traffic Summary.
2. Select a branch and a site from the top of the work pane.
3. To compare traffic statistics in the specified time range, click Data Comparison in the Total Traffic Trend area.
4. To compare traffic statistics per person in the specified time range, click Data Comparison in the Rank of Traffic per Person area.
Parameters
· Traffic statistics: Total upload and download traffic, upload and download traffic per person, and day-on-day traffic ratio and peak traffic within 30 days.
· Total Traffic Ranking: Top 5 and bottom 5 traffic by day or by site.
· Client Traffic Ranking: Top 10 traffic by client or by site.
· Total Traffic Trend: Total traffic trend during the specified time range.
· Rank of Traffic per Person: Top 5 and bottom 5 traffic per person by day or by site.
View traffic details
Perform this task to view online or offline client traffic information and export the data for analysis.
Restrictions and guidelines
You can select only one site.
Procedure
1. From the left navigation pane, select Endpoints > Client Statistics > Traffic Details.
2. Select a branch and a site from the top of the work pane.
3. To view detailed traffic information about associated clients, click Associated Clients.
4. To view detailed traffic information about authenticated clients, click Authenticated Clients.
Parameters
· Online Client Traffic: Detailed traffic information about all online clients in the current site.
· Client Traffic History: Detailed traffic information about all offline clients within the past one to seven days.
Manage smart endpoints
Manage critical endpoints
Perform this task to monitor and manage critical endpoints as assets. The system can generate critical endpoint online and offline messages.
Procedure
1. From the left navigation pane, select Endpoints > Endpoints > Critical Clients.
2. Select a branch and a site from the top of the work pane.
The page that opens displays the following information:
¡ Summary: Summary about critical clients in the site or branch, including total, online, and offline clients, disassociated clients and APs, and disassociated clients and APs today.
¡ Alarms: Alarms generated for frequent client disassociations, client disassociations, and client associations in the specified time range. For how to configure alarm subscription, see "Subscribe to alarms."
¡ Traffic Top 10: Top 10 clients or sites with the most traffic.
¡ Disassociations Top 10: Top 10 clients with the most disassociations.
¡ Sites with Critical Clients: Total number of critical clients and number of online critical clients in each site.
¡ Client Trend: Trend for online and offline critical clients.
¡ Real-Time Client Statistics: Real-time critical client statistics in the current site or branch. To filter critical clients, click Filter, enter the filter criteria, and then click Search.
¡ Client Disassociation Log: Disassociation log information for critical clients.
3. To add a critical client, click Add Critical Clients. You will be redirected to the Endpoints page. For more information about endpoints assets, see "Manage assets."
Manage cameras
The system can automatically identify and display camera information when a camera is connected to the system. Alternatively, you can manually add cameras to the system.
Restrictions and guidelines
· For camera identification to take effect, the device must have LLDP enabled and support EPA.
· For the device to support camera identification by MAC address mask, you must upgrade the device to Release 6320 or a higher version.
Procedure
1. From the left navigation pane, select Endpoints > Endpoints > Cameras.
2. Select a branch and a site from the top of the work pane.
The Camera Monitoring tab displays the following information:
¡ Statistics: Numbers of online, offline, and today's offline cameras, and total number of cameras.
¡ Alarms: Alarms generated for camera offline events and traffic anomalies in the specified time range. For how to configure alarm subscription, see "Subscribe to alarms."
¡ Traffic Ranking: Top 5 and bottom 5 cameras by traffic amount in the specified time range.
¡ Disassociations Top 10: Top 10 cameras with the most disassociations.
¡ Online/Offline Events Trend: Trend for online and offline events of cameras.
¡ Camera List: Statistics about cameras in the site, including state, MAC address, uplink device, and VLAN.
¡ Offline Event Logs: Offline event logs for cameras in the site. To export logs, click Export.
¡ Scheduled Task List: Information about scheduled tasks for cameras, including task name, action, schedule, run mode, and involved cameras.
¡ Camera Details: Camera, PoE, and traffic details for a specified camera. To view the details, click the MAC address for the camera.
3. To manage cameras, perform the following tasks:
¡ To discover cameras, click Discover. The system will obtain switch and router information and identify cameras and synchronize the information to Cloudnet.
¡ To shield a camera, select that camera, and then click Shield on top of the camera list. The shielded cameras will be added to the denylist.
¡ To perform power management for a camera, select that camera, click PoE, and then select Enable, Disable, or Restart to enable, disable, or restart PoE power supply for that camera.
¡ To schedule PoE power supply for a camera, perform the following steps:
- Select that camera, and then click Scheduled Task.
- In the dialog box that opens, enter the task name, select an action, specify the time range, and then click OK. The created scheduled task will be displayed in the scheduled task list.
¡ To delete,
start, stop, or edit a scheduled task, or edit the camera list in a scheduled
task, click ![]() ,
, ![]() ,
, ![]() ,
, ![]() , or
, or ![]() in the Actions column for that
task.
in the Actions column for that
task.
¡ To view the camera list in a scheduled task, click the number link in the Cameras column for that task.
¡ To delete scheduled tasks in bulk, select one or multiple tasks, click Delete on top of the task list, and then click OK in the dialog box that opens.
4. To configure camera identification, click the Camera Identification tab:
¡ To add a camera, click Add, enter the MAC address, mask, and device name, and then click Submit.
¡ To
edit a camera, click ![]() in the Actions for that
camera.
in the Actions for that
camera.
¡ To
delete a camera, click ![]() in the Actions column
for that camera. To bulk delete cameras, select the cameras, click Delete on top of
the list, and then click OK in the dialog box that opens.
in the Actions column
for that camera. To bulk delete cameras, select the cameras, click Delete on top of
the list, and then click OK in the dialog box that opens.
¡ To refresh the camera list, click Refresh.
¡ To
view shielded cameras, click Denylist. To remove a camera from the denylist, click ![]() in the Actions column for that camera. To
remove multiple cameras in bulk from the denylist, select the cameras, and then
click Delete on top of the denylist.
in the Actions column for that camera. To
remove multiple cameras in bulk from the denylist, select the cameras, and then
click Delete on top of the denylist.
Monitor
Monitor devices
Restrictions and guidelines
· This task is available for ACs, routers, and switches.
· To obtain more information about a device, connect the device to the Cloudnet platform.
· You can view operation logs within a maximum of one month.
· If you specify a time range that spans multiple days, CPU, memory and rate statistics about the current day are not collected.
· The system collects CPU and memory usage and uplink and downlink rates every 5 minutes. To view data in multiple days, shrink the horizontal scrollbar and then drag it left or right.
· To view the uplink and downlink rates at a specific time point, hover over that time point in the trend graph.
Procedure
1. From the left navigation pane, select Monitor > Device_Category > Summary.
2. Select a branch, a site, and a device from the top of the work pane.
3. Perform device operations as needed.
Tasks available for all devices
1. To view the CPU and memory usage trend, click Expand from the Operating Info tile.
The logs record operations on Cloudnet account, IP address, and device configuration.
2. To view device association and disassociation records, click Expand from the Device State tile.
3. To view the rate trend, click Expand from the Realtime Rate tile. To set the rated bandwidths, click Set Rated Bandwidth.
4. To view AP ranking by disassociation quantity in the specified time range, click Expand from the AP Info tile. The Top10 APs with Most Disassociations graph opens.
5. To view the client association trend in the specified time range, click Expand from the Client Info tile. If the time range spans one day, the system displays client statistics by hour. If the time range spans multiple days, the system displays client statistics by day.
6. To view the alarm logs, click the Alarm Logs tab.
The list that opens displays information about alarms generated on the device in the specified time range, including notification method, severity, alarm state, alarm type, site, device, content, and generation time.
¡ To adjust the columns to display, click the Columns icon +/-.
¡ To filter alarms, click Filter, and then specify the filtering criteria as needed.
¡ To export the displayed alarms, click Export.
¡ To mark specific alarms as read, select the alarms and then click Mark as Read.
¡ To mark all alarms as read, click Mark All as Read.
7. To use the ping, trace, or AP locating tool, click the Tools tab. For more information, see "Use tools to manage devices."
Tasks available only for ACs and routers
1. To view the AP list, click the AP List tab.
The list that opens displays AP information, including AP name, SN, model, MAC, and version.
¡ To adjust the columns to display, click the Columns icon +/-.
¡ To filter APs, click Online, Offline, All, or Invalid.
¡ To change the name of an AP, click the AP name.
2. To view the client list, click the Client List tab.
The list that opens displays client information, including client MAC, IP, vendor, associated AP, SSID, online duration, RSSI, frequency, channel, association time, and client mode. To adjust the columns to display, click the Columns icon +/-.
Tasks available only for switches
1. To view interface statistics, click the Summary tab.
The list that opens displays interface statistics, including interface type, link state, PoE support, inbound rate, outbound rate, inbound unicasts, outbound unicasts, inbound non-unicasts, outbound non-unicasts, discarded inbound non-error packets, and discarded outbound non-error packets.
¡ To adjust the columns to display, click the Columns icon +/-.
¡ To clear statistics about specific interfaces, select the interfaces, and then click Bulk Delete.
¡ To clear all statistics, click Clear All.
2. To configure interfaces, click the Interface Management tab, select interfaces to manage, configure interface parameters, and then click Submit.
Available parameters include management state, duplex mode, interface type, PVID, rate, flow control, and bandwidth. You can view the configuration result from the interface list below.
3. To manage VLAN settings, click the VLAN tab.
The list that opens displays VLAN information, including VLAN ID, untagged ports, tagged ports, VLAN interface IP, subnet mask, and VLAN description.
¡ To
view all the tagged or untagged ports, click the ![]() icon.
icon.
¡ To
edit a VLAN, click the Edit icon ![]() .
.
¡ To
delete a VLAN, click the Delete icon ![]() .
.
¡ To delete the specified VLANs, click Custom Deletion.
¡ To add a VLAN, click Add.
4. To configure link aggregation, click the Link Aggregation tab.
The list that opens displays link aggregation information, including aggregation group ID, description, aggregation mode, and member ports.
¡ To
view all the member ports of a group, click the ![]() icon.
icon.
¡ To
edit an aggregation group, click the Edit icon ![]() for
that group. You can edit the aggregation type, aggregation mode, description,
and member ports.
for
that group. You can edit the aggregation type, aggregation mode, description,
and member ports.
¡ To
delete an aggregation group, click the Delete icon ![]() .
.
¡ To add an aggregation group, click Add.
¡ To delete specific aggregation groups, select the groups, and then click Bulk Delete.
5. To configure port isolation, click the Port Isolation tab.
The list that opens displays link aggregation information, including isolation group ID and member ports.
¡ To
view all the member ports of a group, click the ![]() icon.
icon.
¡ To
edit an isolation group, click the Edit icon ![]() for
the group. You can edit the member ports.
for
the group. You can edit the member ports.
¡ To
delete an isolation group, click the Delete icon ![]() .
.
¡ To add an isolation group, click Add.
¡ To delete specific isolation groups, select the groups, and then click Bulk Delete.
Parameters
· Device Score
¡ Remaining Bandwidth: By ratio of the
egress bandwidth to the total available bandwidth. A lower ratio, a higher
score. To set the rated bandwidths, click ![]() next
to this field.
next
to this field.
¡ Online AP Ratio: By ratio of online APs to the total number of APs. More online APs, higher score.
¡ Client Rate: By rate of low-rate clients to the total number of APs. Fewer low-rate clients, higher score.
¡ Security Score: By number of rogue APs in the WLAN. Less rogue APs, higher score.
¡ Wireless Environment: By interference state. Less interference, higher score.
¡ System Health: By CPU and memory usages. Lower CPU and memory usages, higher score. The system takes the lower score between them.
· Panel Info: Information about ports on the device panel, including port name, operating state, configured rate, actual rate, duplex mode, link type, and port description. To view information about a port, click the port.
For panel information about switches, see "Configure basic settings."
· Set Rated Bandwidth: Uplink and downlink rates of a device in the specified time range. To set the rated bandwidths, click Set Rated Bandwidth. After you set the rated bandwidths, the rated bandwidth values in the graph will change accordingly. You must configure the rated bandwidths to be the same those you have purchased from your service provider.
· Device State: Device state shown by score. A device is scored by CPU usage and memory usage and the system uses the lower one of the two scores as the device score. The lower the usage, the higher the score.
· Uplink Bandwidth: Uplink bandwidth shown by score. The uplink bandwidth is scored by its usage. The lower the usage, the higher the score.
· Interface Capability: Capability of interfaces in up status shown by score. Interfaces in up state are scored by interface rate and operating mode. The system uses the average score of all up interfaces as the interface capability score.
View AP summary
Restrictions and guidelines
· This task is available for ACs, routers, and switches.
· You can select a single site or a branch that contains multiple sites.
· The system does not count APs that go offline unexpectedly as offline APs.
Procedure
1. From the left navigation pane, select Monitor > Device_Category > AP Summary.
2. Select a branch and a site from the top of the work pane.
3. To view real-time traffic ranking of all
APs, click the Info icon ![]() at the upper right corner of
the Realtime AP Traffic Top 5 area.
at the upper right corner of
the Realtime AP Traffic Top 5 area.
4. To view real-time user ranking of all APs,
click the Info icon ![]() at the upper right corner of
the Realtime AP User Top 5 area.
at the upper right corner of
the Realtime AP User Top 5 area.
Parameters
· AP statistics: Number of online, offline, total, and invalid APs.
· Realtime AP Traffic Top 5: Top 5 APs with the most downlink traffic.
· Realtime AP User Top 5: Top 5 APs with the most associated clients.
· AP Disassociations: Distribution of APs by the number of disassociations.
· AP Disassociation Reason: Distribution of APs by disassociation reason.
· AP Disassociations Top 10: Top 10 APs with the most disassociations. The system counts AP disassociations by day.
View AP details
Restrictions and guidelines
This task is available only for ACs, routers, and switches.
You can view only event and disassociation details within 30 days.
Procedure
1. From the left navigation pane, select Monitor > Device_Category > AP Details.
2. Select a branch and a site from the top of the work pane.
3. On the APs tab, view AP details and manage APs as follows:
¡ To edit the name of an AP, click the AP name link.
¡ To
edit the columns to display, click the ![]() icon.
icon.
4. To view radio details, click the Radios tab.
5. To view AP event details, click the Events tab.
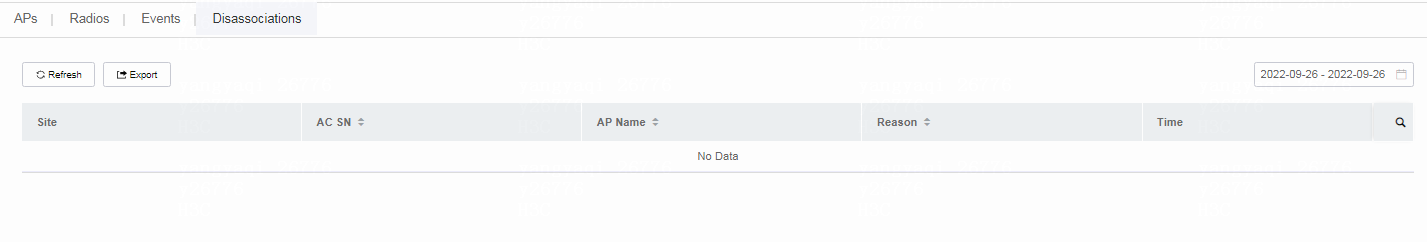
6. To view AP disassociation details, click the Disassociations tab.
7. To refresh the page, click Refresh.
8. To export AP or radio information, click Export. To export event or disassociation information, select a time range, and then click Export.
Figure 2 Viewing AP details
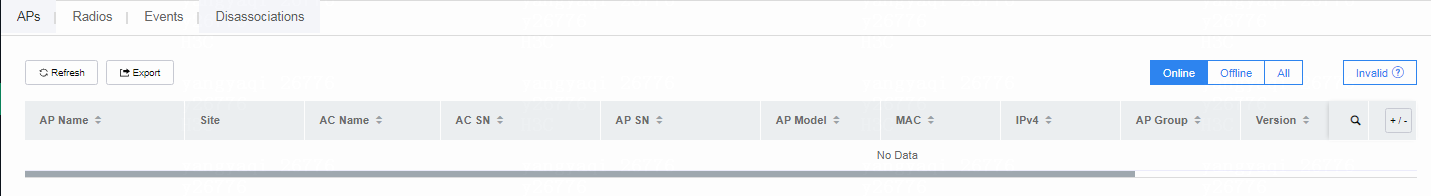
Figure 3 Viewing radio details
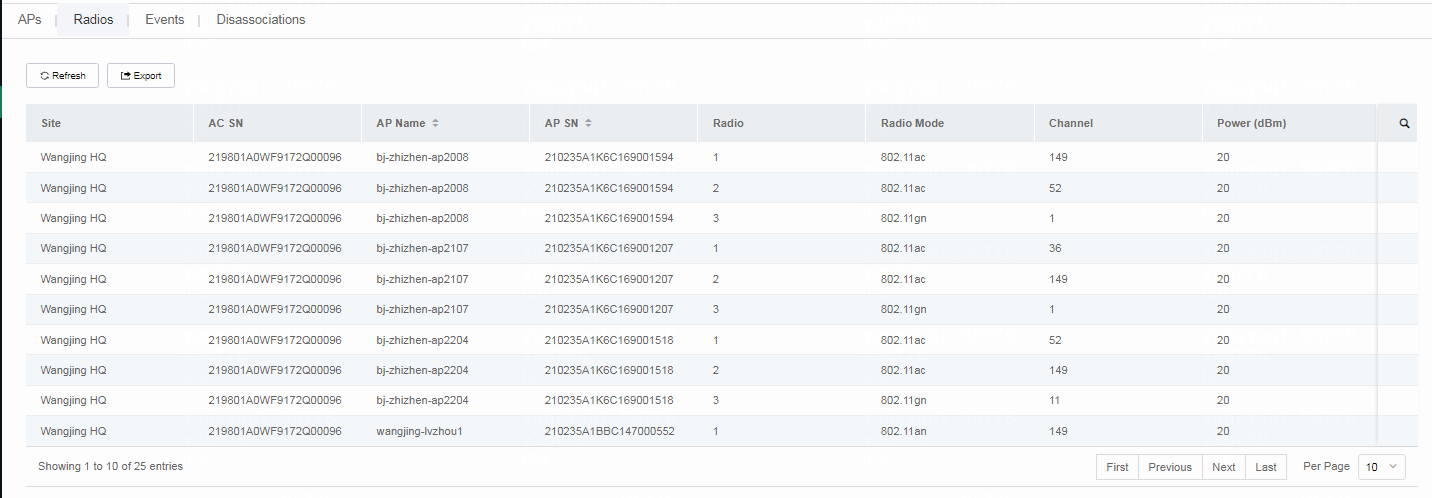
Figure 4 Viewing event details
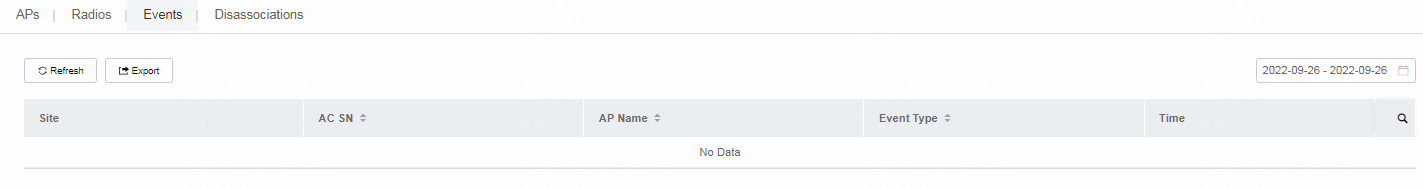
Figure 5 Viewing disassociation details
View cloud-managed AP summary
Restrictions and guidelines
This task is available only for cloud-managed APs.
Procedure
1. From the left navigation pane, select Monitor > Cloud APs > Dashboard.
2. Select a branch and a site from the top of the work pane.
Parameters
· AP statistics: Numbers of online, offline, and total cloud-managed APs.
· Top 5 APs by Traffic: Five APs with the most total traffic today in the current site.
· Top 5 APs by Endpoints: Five APs with the most online endpoints in real time in the current site.
· Top5 APs by Alarms: Five APs with the most alarms in the current site.
View the cloud-managed AP list
Restrictions and guidelines
This task is available only for cloud-managed APs.
Procedure
1. From the left navigation pane, select Monitor > Cloud APs > AP List.
2. Select a branch and a site from the top of the work pane.
The page that opens displays AP information, including AP online state, MAC address, version, and radio information.
3. To adjust the columns to display, click the Columns icon +/-.
4. To view the updated information, click Refresh to refresh the list.
5. To export the AP list, click Export.
6. To search for specific APs, click Filter, specify AP name, MAC address, local IP address, and version as needed, select a state, configure Advanced Search as needed, and then click Search.
7. To view detailed information about an AP, click the AP name.
The State tab opens and displays AP basics, CPU and memory usage, and uplink and downlink traffic information collected during the current day.
¡ To view operation logs and alarms generated on the AP, click the Event tab.
¡ To view client association trend and online client information, click the Client tab. The system collects client statistics at intervals of five minutes. You can click the MAC address of a client in the Online Client Info list to view the client details, including client state and statistics.
¡ To use the ping, trace, or AP locating tool, click the Tools tab.
The AP locating tool turns on the AP LED for a maximum of 30 minutes to help locate the AP. The previous LED state will be restored once you leave the page.
Manage 4G/5G settings
Restrictions and guidelines
This task is available only for routers.
View 4G/5G information and manage 4G/5G devices
Procedure
1. From the left navigation pane, select Monitor > Routers > 4G/5G.
2. Select a branch and a site from the top of the work pane.
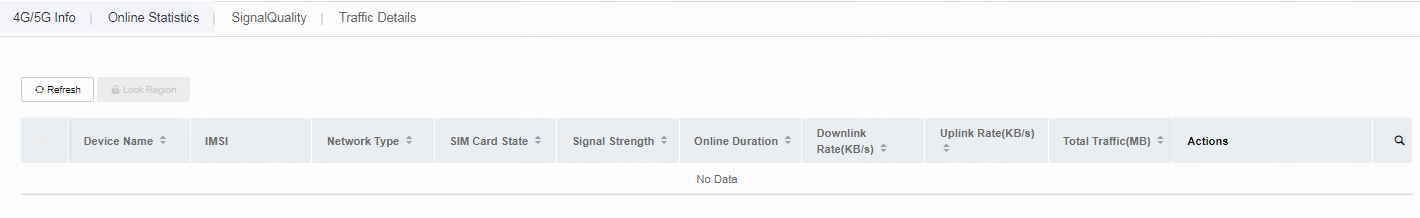
The 4G/5G Info tab opens and displays information about 4G/5G devices in the site.
3. To locate a device in the GIS map, click the
GIS location icon ![]() for the device.
for the device.
The GIS map displays all the devices in the map. Online devices are blue colored, offline devices are gray colored, and the current device is red colored. You can click a device icon to view device information.
By default, the system displays the automatically calculated device locations. To adjust the location of a device manually, drag the device icon to the correct location. To restore the default location, click Reset Location.
4. To enable region lock alarming, click the
region lock icon ![]() for a device or select
devices and then click Lock Region.
for a device or select
devices and then click Lock Region.
This feature enables the system to generate an alarm when a device moves out of the locked region.
5. To enable threshold alarming, click the
traffic threshold icon ![]() for a device and
set the threshold.
for a device and
set the threshold.
This feature enables the system to generate an alarm when the total traffic on the device exceeds the threshold.
6. To enable signal strength alarming, click
the signal strength threshold icon ![]() for a
device and set the threshold.
for a
device and set the threshold.
This feature enables the system to generate an alarm when the total traffic on the device exceeds the threshold.
7. To view device details, click the details
icon ![]() for a device.
for a device.
The page that opens displays device configuration and basics.
8. To test network connectivity, click the link
test icon ![]() for a device, and set the destination IP
address, test interface, and alarm threshold.
for a device, and set the destination IP
address, test interface, and alarm threshold.
With this feature configured, the device tests network connectivity between the specified interface and destination IP address at intervals of 5 minutes. If the number of failures exceeds the threshold, the system generates an alarm.
Figure 6 4G/5G Info tab
Parameters
· Device Name: Device name specified when the device was added to Cloudnet.
· IMSI: IMSI number of the SIM card.
· Network Type: Service provider type of the SIM card.
· SIM Card State: Online state of the SIM card.
· Signal Strength: Signal strength of the SIM card.
· Online Duration: Online duration of the SIM card.
· Downlink Rate (KB/s): Downlink rate of the SIM card interface.
· Uplink Rate (KB/s): Uplink rate of the SIM card interface.
· Total Traffic (MB): Total traffic of the SIM card.
View online statistics
Procedure
1. From the left navigation pane, select Monitor > Routers > 4G/5G.
2. Select a branch and a site from the top of the work pane.
3. Click the Online Statistics tab.
You can view the device online summary, device distribution by service provider, and device distribution by signal strength.
Parameters
· Online State Summary: Displays device distribution by online state in a pie chart.
· Online Devices & Offline Devices: Displays the number of online devices and the number of offline devices.
· Online Rate Alarm: Set the online rate alarm threshold. When the online rate of devices in the site drops below the threshold, the system generates an alarm.
· View Online Rate Trend: Click to view the online rate trend of devices in the site in the past month.
· By Service Provider: Displays device distribution and device online rate by service provider.
· By Signal Strength: Displays device distribution by signal strength level. Available levels include Excellent, Good, Normal, Bad, and No Signal.
View signal quality
1. From the left navigation pane, select Monitor > Routers > 4G/5G.
2. Select a branch and a site from the top of the work pane.
3. Click the Signal Quality tab.
The page that opens displays the device name, IMSI, and signal strength.
4. To view the signal strength history of a device within a month, click the signal quality trend icon in the Actions column for that device.
View traffic details
1. From the left navigation pane, select Monitor > Routers > 4G/5G.
2. Select a branch and a site from the top of the work pane.
3. Click the Traffic Details tab.
The page that opens displays the uplink traffic, downlink traffic, and total traffic of devices in the site in a bar chart.
4. To view the traffic and rate analysis summary, click View Details.
You can click icons in the Actions column to view the traffic trend or rate trend in the past month.
View app ranking information
Restrictions and guidelines
This task is available only for routers.
Procedure
1. From the left navigation pane, select Monitor > Routers > App Ranking.
2. Select a branch and a site from the top of the work pane.
3. Select a time range, today, this week, this month, or customize. If you select Customize, select a time range in the calendar.
4. Click an app name. The doughnut chart on the left displays the traffic usage for the app. The trend graph on the right displays the uplink and downlink traffic trends for the app.
5. To refresh the page, click ![]() .
.
View user ranking information
Restrictions and guidelines
This task is available only for routers.
Procedure
1. From the left navigation pane, select Monitor > Routers > User Ranking.
2. Select a branch and a site from the top of the work pane.
3. Select a time range, today, this week, this month, or customize. If you select Customize, select a time range in the calendar.
4. Click an IP address. The doughnut chart on the left displays the traffic usage for the user at this IP address. The trend graph on the right displays the uplink and downlink traffic trends for the user.
5. To refresh the page, click ![]() .
.
Settings
For more information about authentication settings and user management, see H3C Cloudnet Authentication User Guide.
Manage autodeploy templates
You can apply an autodeploy template to a site to automatically configure specific devices at device association, which reduces configuration workloads.
Manage autodeploy templates for ACs and routers
1. From the left navigation pane, select Settings > Autodeploy.
2. To add an autodeploy template for ACs or routers, click Add, configure the following parameters as needed, and then click OK:
¡ Template—Specify the template name.
¡ Device Model—Specify the model of devices to apply the template to.
¡ Description—Specify the template description.
¡ Copy Settings—Select whether to copy settings from an existing autodeploy template.
¡ VLANs, Probe, Authentication, Bandwidth, Self-Defined—Specify VLAN, probe, authentication, bandwidth, and other configurations.
3. To bind an autodeploy template to a site,
click the Bind icon ![]() for that template. Click Bind, select the
templates to bind, and then click OK.
for that template. Click Bind, select the
templates to bind, and then click OK.
4. To unbind autodeploy templates from a site, click
the Bind icon ![]() for that template. Select the
templates and then click Unbind.
for that template. Select the
templates and then click Unbind.
5. To view the bound sites, click the number link in the Bound Sites column.
6. To edit an autodeploy template, click the Edit icon ![]() for that template.
for that template.
7. To view the application record, click the View History
icon ![]() for the template.
for the template.
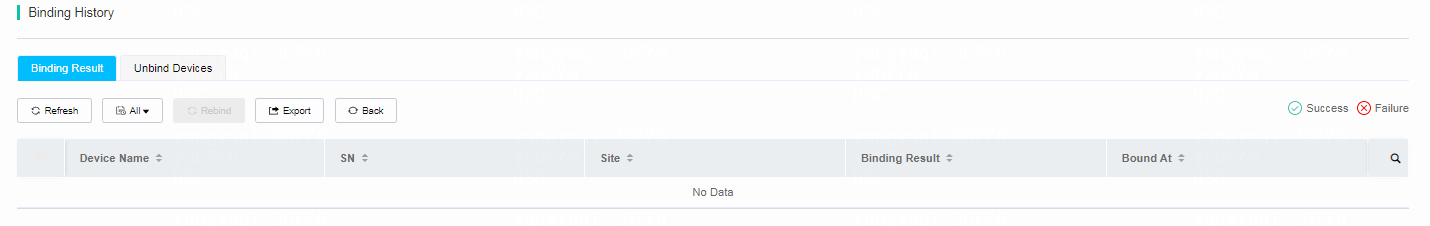
¡ On the Binding Result tab, you can perform the following tasks:
- To refresh the binding result, click Refresh.
- To filter the result by time range, click One Day, and then select a time range. Options include One Day, One Week, One Month, and All.
- To rebind devices, select the devices and then click Rebind. The system will deploy the template settings to the devices.
- To export all the binding result, click Export.
Figure 7 Binding result
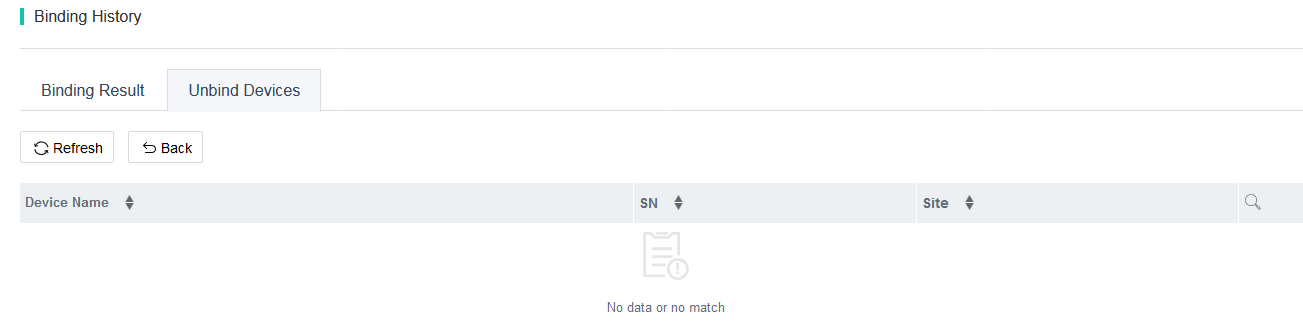
¡ On the Unbind Devices tab, you can click Refresh to refresh the unbind device list.
Figure 8 Unbind device list
8. To delete an autodeploy template, click the Delete icon ![]() for that template, and then click OK in the dialog
box that opens.
for that template, and then click OK in the dialog
box that opens.
Manage autodeploy templates for switches
You can configure autodeploy templates for switches in CLI mode or GUI mode.
In CLI mode, you can create configurations by using custom command lines and deploy more comprehensive configurations on devices.
Only the Demo 6511, ESS 1105P01, and later versions support GUI mode.
To manage deploy templates for switches:
1. From the left navigation pane, select Settings > Autodeploy.
2. To add an autodeploy template for ACs, click Add, configure the following parameters as needed, and then click OK:
¡ Template—Specify the template name.
¡ Device Model—Specify the model of devices to apply the template to.
¡ Description—Specify the template description.
¡ Copy Settings—Select whether to copy settings from an existing autodeploy template.
¡ VLANs, Probe, Authentication, Bandwidth, Self-Defined—Specify VLAN, probe, authentication, bandwidth, and other configurations.
In GUI mode, specify the template name, device model, and description, and then click OK. Then, edit the template as instructed.
3. To bind an autodeploy template to a site,
click the Bind icon ![]() for that template. Click Bind, select the
templates to bind, and then click OK.
for that template. Click Bind, select the
templates to bind, and then click OK.
4. To unbind autodeploy templates from a site,
click the Bind icon ![]() for that template. Select the
templates and then click Unbind.
for that template. Select the
templates and then click Unbind.
5. To view the bound sites, click the number link in the Bound Sites column.
6. To edit an autodeploy template, click the Edit icon ![]() for that template.
for that template.
7. To view the application record, click the View History
icon ![]() for the template.
for the template.
¡ On the Binding Result tab, you can perform the following tasks:
- To refresh the binding result, click Refresh.
- To filter the result by time range, click One Day, and then select a time range. Options include One Day, One Week, One Month, and All.
- To rebind devices, select the devices and then click Rebind. The system will deploy the template settings to the devices.
- To export all the binding result, click Export.
¡ On the Unbind Devices tab, you can click Refresh to refresh the unbind device list.
8. To delete an autodeploy template, click the Delete icon ![]() for that template, and then click OK in the dialog
box that opens.
for that template, and then click OK in the dialog
box that opens.
Manage bulk configuration templates
Perform this task to bulk configure and deploy services such as VLAN, port, and WLAN services on devices.
Manage AC templates
Restrictions and guidelines
When adding an AC template, follow these guidelines:
· If you select 802.1X for the encryption service, you must configure an 802.1X authentication user on the RADIUS server.
· For the 802.1X authentication to take effect, make sure the related settings are correct. You can use an 802.1X template on the same device in the site, or you can configure settings directly on the ACs > 802.1X Auth page. For more information, see "Configure 802.1X authentication."
· The Signal Strength Change Threshold and Filter Random MAC features take effect only when the wireless probe is enabled.
· Only devices of Custom 5405, Release 1038P05, or a higher version support the Domain Name Whitelist and Domain Name Blacklist features.
· If a domain name is in the domain name whitelist and blacklist at the same time, the blacklist takes effect.
Procedure
1. From the left navigation pane, select Settings > Bulk Cfg Templates > AC Templates.
2. To add an AC template, click Add. Configure the following parameters as needed, and then click OK:
¡ Name—Specify the template name.
¡ Description—Specify the template description.
On the Wireless Basic Settings tab:
¡ Basic Settings:
- Wireless Service Name—Specify the wireless service name.
- SSID—Specify the SSID.
- Encryption—Configure the encryption service. If you select PSK, you must configure and enter the PSK password during client association. If you select Off, the encryption service is disabled. If you select 802.1X, you must use the 802.1X authentication method to authenticate clients with an authentication server.
¡ Advanced Settings:
- Service State—Turn on or turn off the wireless service. If you turn off a wireless service, endpoints connected to the service will go offline.
- Hide SSID—Hiding SSIDs disables devices from discovering the wireless service to enhance network security. If you want to connect to the hidden service, you must enter the SSID on the device for association.
- Layer 2 Isolation—Disables users from communicating with each at Layer 2.
- Guaranteed Bandwidth—Specify the bandwidth ratio to guarantee downlink bandwidth for each wireless service when the network is congested. Make sure the bandwidth ratio of all wireless services is not higher than 100%.
- VLAN—A client is added to VLAN 1 by default after the client is connected to the wireless service.
On the Probe Settings tab:
¡ Probe—Turn on the probe feature as needed to detect clients that are not connected to the WLAN.
¡ Filter Random MAC—To improve endpoint privacy security, devices of some vendors send probe request packets with random MAC addresses, which causes interference for the wireless probe to collect information. To address this issue, you can use this feature to filter these packets.
¡ Signal Strength Change Threshold—Turn off or turn on and specify the threshold. For a device detected by the probe AP again, if the signal strength change of the device is below the threshold, the system will not update the corresponding entry.
On the Domain Name Whitelist tab:
¡ Add—Click Add, specify the domain name, and click OK. The number of added entries cannot exceed 32.
¡ Delete—Click the Delete icon ![]() in the list for a
target domain, or you can select multiple domains and click
Delete.
in the list for a
target domain, or you can select multiple domains and click
Delete.
On the Domain Name Blacklist tab:
¡ Add—Click Add, specify the domain name, and click OK. The number of added entries cannot exceed 32.
¡ Delete—Click the Delete icon ![]() in the list for a
target domain, or you can select multiple domains and click
Delete.
in the list for a
target domain, or you can select multiple domains and click
Delete.
On the DPI Settings tab:
Turn on the DPI feature as needed to record application behaviors and analyze user network behaviors.
3. To apply an AC template, click the Apply icon ![]() for that template. On the page that
opens, configure the branch and site, select ACs from the list, and click Apply.
for that template. On the page that
opens, configure the branch and site, select ACs from the list, and click Apply.
4. To view the application record, click the Records icon ![]() for the
template. On the page that opens, you can perform the following tasks:
for the
template. On the page that opens, you can perform the following tasks:
¡ To filter the result by time range, click One Day, and then select a time range. Options include One Day, One Week, One Month, and All.
¡ To re-apply devices, select the devices and then click Reapply.
¡ To export all the application statistics, click Export.
5. To edit an AC template, click the Edit icon ![]() for that template. Edit the template as needed.
for that template. Edit the template as needed.
6. To delete an AC template, click the Delete icon ![]() for that template. In the dialog box that opens, click OK.
for that template. In the dialog box that opens, click OK.
Manage switch templates
1. From the left navigation pane, select Settings > Bulk Cfg Templates > Switch Templates.
2. You can perform the following tasks to add a switch template in CLI mode or GUI mode.
¡ To add a switch template in GUI mode, select GUI to access the Template List page and click Add. Enter the template name, select a device model, and click OK.
After configuration, you are navigated to the template editing page. Edit the template as needed.
¡ To add a switch template in CLI mode, select CLI to access the Template List page and click Add. Enter the template name and description, configure the template settings as needed, input command as formatted in the examples, and click OK. On the page that opens, click OK and you will be navigated to the template application page.
3. To apply a switch template, click the Apply icon ![]() for that template. On the page that
opens, configure the branch and site, select switches from the list, and click Apply.
for that template. On the page that
opens, configure the branch and site, select switches from the list, and click Apply.
4. To view the application record, click the Records icon ![]() for the
template. On the page that opens, you can perform the following tasks:
for the
template. On the page that opens, you can perform the following tasks:
¡ To filter the record by time range, click One Day, and then select a time range. Options include One Day, One Week, One Month, and All.
¡ To view failure details of settings that failed to be issued by CLI, click Show Detail.
¡ To re-apply devices, select the devices and then click Reapply.
5. To edit a switch template, click the Edit icon ![]() for that template. Edit the template as needed.
for that template. Edit the template as needed.
6. To delete a switch template, click the Delete icon ![]() for that template. In
the dialog box that opens, click OK.
for that template. In
the dialog box that opens, click OK.
Manage 802.1X templates
Perform this task to configure 802.1X authentication template and RADIUS scheme template.
Only ACs, routers, and switches support this feature.
The cloud platform is not used as an authentication server but you can configure information for an external 802.1X authentication server on the platform. You must configure the 802.1X authentication user account and password on the RADIUS server.
1. From the left navigation pane, select Settings > Bulk Cfg Templates > 802.1X Templates.
2. To add a RADIUS scheme template, click the RADIUS Scheme Template tab and click Add. Configure the template as needed.
3. To add an 802.1X authentication template, select the 802.1X Auth Template tab and click Add. Configure the template as needed.
In wireless mode, select EAP for Auth Protocol. Advanced Settings is only available for wired access authentication.
4. To apply a template, click the Apply icon ![]() for that template on the 802.1X Auth Template tab. On the page that opens, specify the site, device category,
device name, access method, and ports, click Add, and then click Apply.
for that template on the 802.1X Auth Template tab. On the page that opens, specify the site, device category,
device name, access method, and ports, click Add, and then click Apply.
5. To view the application record, click the History icon ![]() for that template. On the page that
opens, you can perform the following tasks:
for that template. On the page that
opens, you can perform the following tasks:
¡ To filter the record by time range, click One Day, and then select a time range. Options include One Day, One Week, One Month, and All.
¡ To re-apply devices, select the devices and then click Reapply.
6. To edit a template, click the Edit icon ![]() for that template. Edit the template as needed.
for that template. Edit the template as needed.
7. To delete a template, click the Delete icon ![]() for that template. In
the dialog box that opens, click OK.
for that template. In
the dialog box that opens, click OK.
Manage cloud AP templates
Configure command lines under the guidance of professionals.
You can create a maximum of 10 Configlets in one bulk configuration template.
1. From the left navigation pane, select Settings > Bulk Cfg Templates > Cloud AP Templates.
2. To add a cloud AP template, click Add, enter the template name and description, configure the following settings as needed, and then click OK:
¡ On the Wi-Fi Settings tab, enable State to show the Wi-Fi list. Click the SSID in the list for a target service and configure SSID parameters as needed, such as Auto SSID, SSID, Wireless Service, Forwarding Mode, and Encryption. For more information about Wi-Fi settings, see "Configure Wi-Fi settings."
¡ On the CLI tab, enable State and click Please add. On the page that opens, select All or Select for a specific model and click OK. After adding a model, enter the description, configure command lines as formatted in the example, and click OK. After configuring one model, click Add to add other models. You can configure a maximum of 10 models.
3. To apply a template, click the Apply icon ![]() in the Actions column for that template. On
the page that opens, specify the branch and site and click Apply.
in the Actions column for that template. On
the page that opens, specify the branch and site and click Apply.
4. To view the application record, click the Records icon ![]() in the Actions column for that template. On
the page that opens, to re-apply devices, select sites and click Reapply.
in the Actions column for that template. On
the page that opens, to re-apply devices, select sites and click Reapply.
Configure an AC
Configure wireless services
1. From the left navigation pane, select Settings > ACs > Wireless Services.
2. Select a branch, a site, and a device from the top of the work pane.
3. To add a wireless service, click Add, configure wireless service settings as needed, and then click Submit to finish adding or click Next to bind APs to this wireless service.
4. To bind APs to an existing wireless service,
click the Bind icon ![]() for that wireless service,
click the Unbound APs tab, select APs (radios), and then click Bind.
for that wireless service,
click the Unbound APs tab, select APs (radios), and then click Bind.
5. To unbind a wireless service, click the Bind icon ![]() for that wireless service, select APs (radios)
on the Bound APs tab, and then click Unbound.
for that wireless service, select APs (radios)
on the Bound APs tab, and then click Unbound.
The wireless service binding is available for only manual APs, including APs converted from auto APs.
6. To view information about bound APs, click the number in the Bound APs column.
7. To edit a wireless service, click the Edit icon ![]() for that wireless service.
for that wireless service.
8. To delete a wireless service, click the Delete icon ![]() for that wireless service.
for that wireless service.
9. To synchronize information about locally created wireless services to the Cloudnet platform, click Sync.
You can synchronize only wireless services that have an SSID configured.
Configure AP settings
This task is available only for ACs of version 5418 or later. The AP list displays only manual APs, including APs converted from auto APs.
To configure AP settings:
1. From the left navigation pane, select Settings > ACs > AP Settings.
2. Select a branch, a site, and a device from the top of the work pane.
3. To configure an AP, click the Edit icon ![]() for that AP. You can also click the AP
name, state, channel, power, or bandwidth link of an AP to edit the specific
field.
for that AP. You can also click the AP
name, state, channel, power, or bandwidth link of an AP to edit the specific
field.
4. To synchronize locally configured AP settings to Cloudnet, click Sync.
5. To export displayed AP information, click Export.
Configure WLAN security
This task is available only for ACs of Release 5442, ESS1050 or a higher version.
To configure attack detection:
1. From the left navigation pane, select Settings > ACs > WLAN Security.
2. Select a branch, a site, and a device from the top of the work pane. Click the Attack Detection tab.
3. Enable attack detection.
4. Specify the detection level.
¡ If
you specify High, Medium,
or Low for the detection level, the system has
predefined the detection items. The ![]() icon represents
that the detection item supports countermeasures.
icon represents
that the detection item supports countermeasures.
¡ If you specify Custom for the detection level, configure the detection items and countermeasure items as needed.
5. Select sensor APs. Select APs in the Available list
and click the ![]() icon to add the APs to the Selected list.
You can select a maximum of 128 APs.
icon to add the APs to the Selected list.
You can select a maximum of 128 APs.
6. To simplify the procedure, click Copy SSID Detection Cfg to copy sensor AP configuration from the SSID Detection page.
To view wireless security monitoring information, access the Smart O&M > Security > Attack Detection page.
To configure SSID detection:
1. From the left navigation pane, select Settings > ACs > WLAN Security.
2. Select a branch, a site, and a device from the top of the work pane. Click the SSID Detection tab.
3. Enable SSID detection.
4. Configure detection rules and countermeasure
state. Click Add. In the window that opens, select
an SSID rule or MAC rule, specify the matching criterion, and enable
countermeasure as needed. To add a rule, click the ![]() icon.
You can configure a maximum of 10 rules for SSID detection. To edit a rule,
click the Edit icon
icon.
You can configure a maximum of 10 rules for SSID detection. To edit a rule,
click the Edit icon ![]() in the SSID
detection rule list.
in the SSID
detection rule list.
5. Select sensor APs. Select APs in the Available list and click the ![]() icon
to add the APs into the Selected list. You can
select a maximum of 128 APs.
icon
to add the APs into the Selected list. You can
select a maximum of 128 APs.
6. To simplify the procedure, click Copy SSID Detection Cfg to copy sensor AP configuration from the SSID Detection page.
To view wireless security monitoring information, access the Smart O&M > Security > SSID Detection page.
To configure MAC spoofing detection:
1. From the left navigation pane, select Settings > ACs > WLAN Security.
2. Select a branch, a site, and a device from the top of the work pane. Click the MAC Spoofing Detection tab.
3. Click Sync from Device to synchronize configured wireless services from the local to Cloudnet.
4. To enable MAC spoofing detection for all wireless services, click Enable All. To enable MAC spoofing detection for a specific wireless service, click the enabling icon for that service.
To view wireless security monitoring information, access the Smart O&M > Security > MAC Spoofing Detection page.
Configure basic network settings
Only the MSG360 series supports this feature.
Access the network basics page
1. From the left navigation pane, select Settings > ACs > Basic Settings.
2. Select a branch, a site, and a device from the top of the work pane.
3. To synchronize locally configured basic network settings to Cloudnet, click Sync.
Configure auto refresh
For the system to refresh the page automatically, enable auto refresh. This feature enables the system to refresh the page at intervals of 5 minutes in the coming hour.
Configure external network settings
1. To configure Internet settings, click the Internet tab.
¡ To add an Internet connection, click Add, and then configure the interface as needed:
- Select an interface.
- Specify the connection description. Question marks (?) are not allowed.
- Specify the MTU.
- Specify the connection method. The main connection is the active connection and the backup connection becomes active only when the main connection fails.
- Specify backup interfaces if the connection is the main connection.
- Select whether to enable connectivity test between the WAN port and the destination addresses.
- Select whether to enable auto switchover between the primary and backup WAN ports when connection to the primary port fails.
This task is available only when connectivity test is enabled.
Figure 9 Configuring Internet settings

¡ To edit
an Internet connection, click the Edit icon ![]() for that interface.
for that interface.
¡ To
delete an Internet connection, click the Delete icon ![]() for
that interface.
for
that interface.
¡ To delete Internet connections in bulk, select the connections, and then click Bulk Delete.
¡ To test port connectivity, specify one or more addresses to test in the WAN Port Connectivity Test field. If you enabled connectivity test, the system will test connectivity to the addresses at specific intervals and generate the average latency trend graph.
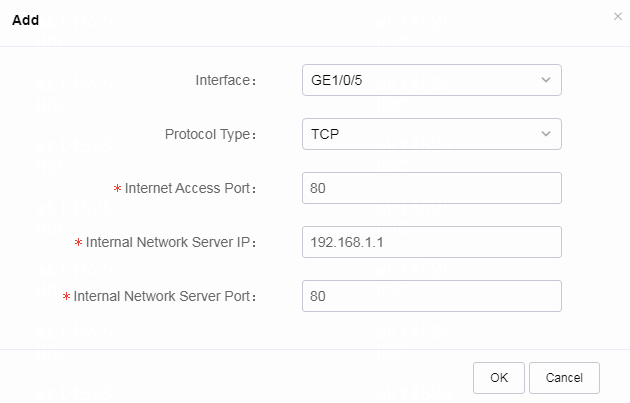
2. To configure Internet address mappings, click the Address Mapping tab.
An address mapping defines the mapping relations between an internal server address/port number and the NAT address/port number, which allows external users to access the internal server through NAT.
¡ To add an address mapping, click Add, and then configure the mapping as needed.
- Select an interface that connects to the Internet.
- Select TCP or UDP as the protocol type.
- Select the Internet access port.
- Specify the Internal network server IP.
- Specify the Internal network server port.
Figure 10 Configuring Internet address mapping
¡ To
delete an Internet address mapping, click the Delete icon ![]() for
that mapping.
for
that mapping.
¡ To delete Internet address mappings in bulk, select the mappings, and then click Bulk Delete.
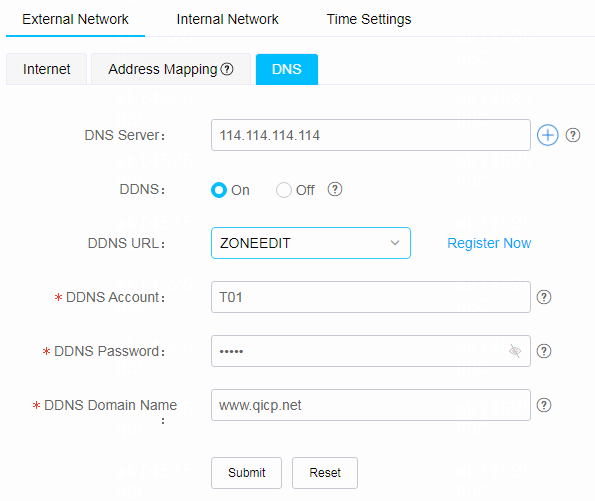
3. To configure DNS and DDNS settings, click the DNS tab.
DNS provides static mapping relations between domain names and IP addresses. If a node IP address changes and the system parses an incorrect IP address from the originally mapping relation, an access failure occurs.
Dynamic domain name system (DDNS) updates the mapping relations between domain names and IP addresses dynamically, which ensures a correct domain name parsing.
¡ Specify DNS servers. You can specify a maximum of six DNS servers.
¡ Enable DDNS, select a DDNS URL, and click Register Now to register a DDNS account and password and obtain a DDNS domain name. Specify the DDNS account, password, and domain name.
Figure 11 Configuring DNS settings
Configure internal network settings
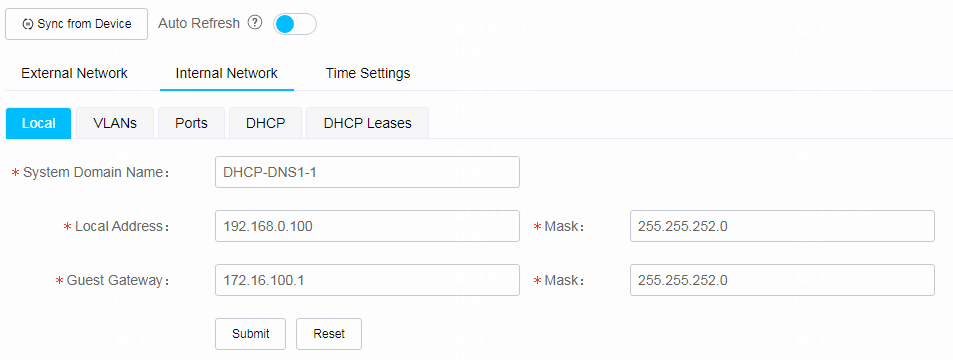
1. To configure local settings, click the Local tab and configure the settings as needed.
¡ Specify the system domain name.
¡ Specify the local address, IP address of VLAN-interface 1.
¡ Specify the guest gateway address, IP address of VLAN-interface 100.
Figure 12 Configuring local settings
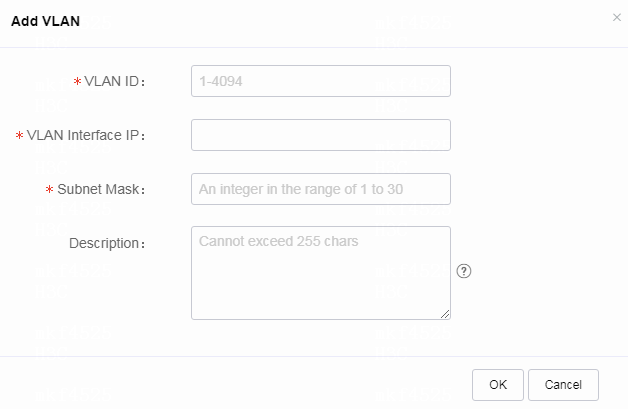
2. To configure VLAN settings, click the VLANs tab.
VLAN 1 and VLAN 100 cannot be deleted.
¡ To add a VLAN, click Add VLAN and configure the VLAN as needed.
- Specify the VLAN ID.
- Specify the VLAN interface IP.
- Specify the subnet mask.
- Specify the description. Question marks (?) are not allowed.
Figure 13 Adding a VLAN
¡ To view member port information for a VLAN, click the number in the Member Ports field.
¡ To delete specific VLANs, click Custom Delete and specify the IDs of the VLANs to delete.
¡ To delete VLANs in bulk, select the VLANs, and then click Bulk Delete.
¡ To
delete a specific VLAN, click the Delete
icon ![]() for that
VLAN.
for that
VLAN.
¡ To
edit a VLAN, click the Edit icon ![]() for that VLAN.
for that VLAN.
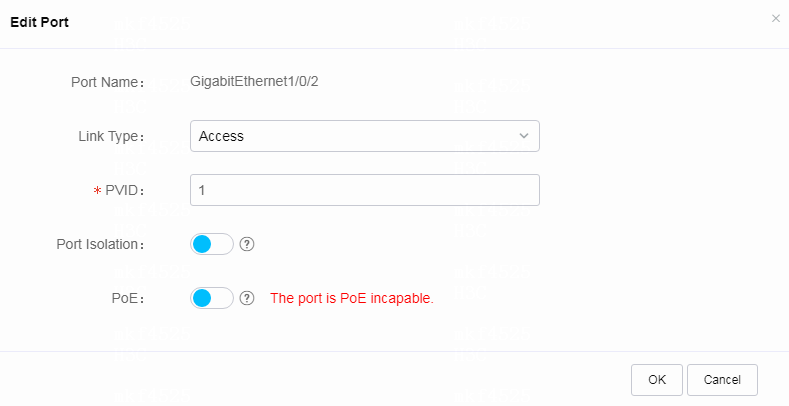
3. To configure port settings, click the Ports tab.
The page that opens displays port configuration.
To edit a port, click the Edit icon ![]() for that port. You can edit the link
type, PVID, permit VLANs, port isolation, and PoE.
for that port. You can edit the link
type, PVID, permit VLANs, port isolation, and PoE.
Figure 14 Editing a port
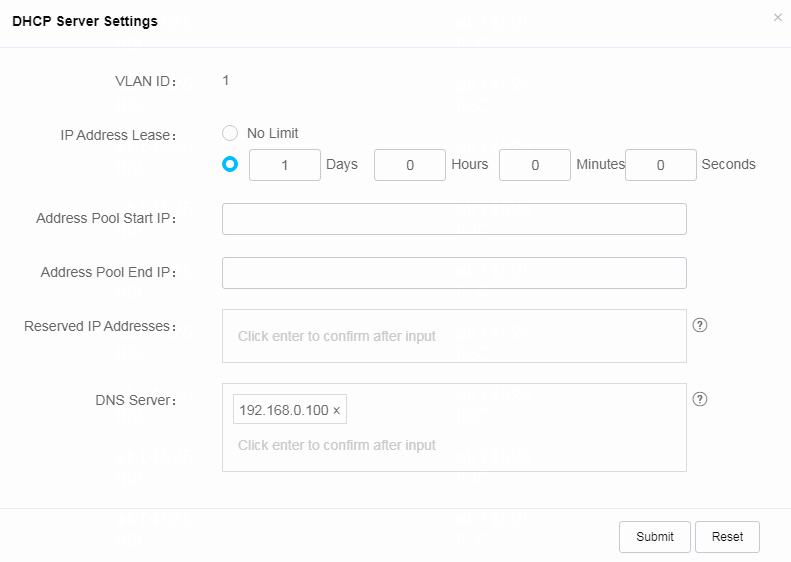
4. To configure DHCP settings, click the DHCP tab.
The page that opens displays DHCP configuration, including IP segment, lease, and assigned addresses.
¡ To
configure DHCP server settings, click the Edit icon ![]() for
an entry. You can configure the IP address lease, address pool start address, address
pool end address, reserved IP addresses, and DNS server.
for
an entry. You can configure the IP address lease, address pool start address, address
pool end address, reserved IP addresses, and DNS server.
Figure 15 Configuring DHCP server settings
¡ To configure
static bindings for a VLAN, click the Static Binding icon ![]() . You can click Add to add a
static binding between an IP address and a MAC address.
. You can click Add to add a
static binding between an IP address and a MAC address.
5. To view DHCP leases, click the DHCP Leases tab.
The page that opens displays information about DHCP leases, including IP assignment method and lease remaining time.
Configure time settings
1. To configure time settings, click the Time Settings tab and configure the settings as needed.
¡ Select a time zone.
¡ Select whether to enable NTP.
¡ Specify recommended and custom NTP servers. You can specify a maximum of five custom NTP servers.
2. Click Apply.
Configure service settings
1. From the left navigation pane, select Settings > ACs > Service Settings.
2. Enable DPI report statistics (DRS) as needed.
With this feature enabled, you can access the Endpoints > User Analysis > Behavior Analysis page to view statistics about applications and websites visited by users.
3. To enable or disable WLAN probe, select the APs, and then click Enable/Disable WLAN Probe.
Configure 802.1X authentication
You can configure settings for the 802.1X authentication server on the cloud platform but do not use the cloud platform as the authentication server. To configure the 802.1X authentication user account and password, use the RADIUS server.
1. From the left navigation pane, select Settings > ACs > 802.1X Auth.
2. Select a branch and a site from the top of the work pane.
3. Select the Auth Policy tab. Enable Auth State, select the authentication protocol, and click Submit. In wireless mode, specify EAP for the authentication protocol.
4. Select the RADIUS scheme tab. Click Add and configure the RADIUS scheme as needed.
5. Select the Apply to Device tab. Select the access method, configure the RADIUS scheme, and specify the authentication port. Configure the advanced settings as needed. Click Add and then click Submit.
Configure ACs in bulk
1. From the left navigation pane, select Settings > ACs > Bulk Settings.
2. Click GUI or CLI.
|
|
CAUTION: Use the CLI function under the guidance of professionals. |
3. To add a configuration template, click Add, configure the template settings as needed, and then click Save. To apply the configuration template, click OK in the confirmation dialog box that opens, select target devices, and then click Apply.
4. To apply a configuration template that has
been created, click the Apply icon ![]() for that template, select a
branch from the upper right corner of the work pane, select target devices, and
then click Apply.
for that template, select a
branch from the upper right corner of the work pane, select target devices, and
then click Apply.
5. To view template deployment results, click History. To reapply a history template that has failed to be applied, click Reapply. To export the history, click Export.
6. To edit a configuration template, click the Edit icon ![]() for that template.
for that template.
7. To delete a configuration template, click
the Delete icon ![]() for that template.
for that template.
Configure cloud-managed APs
Configure wireless services
Access the WLAN settings page
1. From the left navigation pane, select Settings > Cloud APs > WLAN Settings.
2. Select a branch and a site from the top of the work pane.
Configure the region code
Select a region code based on the actual location of the device, and then click OK.
The region code determines the working band, channel, and transmit power of radios. Make sure you specify a correct region code that does not violate the local regulations.
Figure 16 Selecting a region code
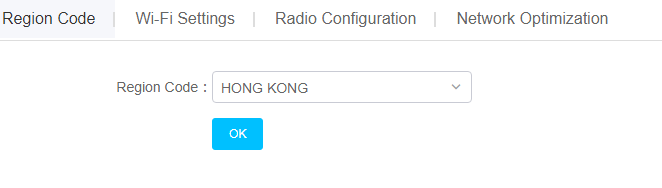
Configure Wi-Fi settings
1. Click the Wi-Fi Settings tab.
2. To configure wireless service settings,
click the down chevron icon ![]() for the wireless
service field.
for the wireless
service field.
The list that opens displays all or enabled services.
¡ To enable or disable services, select the services, and then click Enable Service or Disable Service.
¡ To hide or show SSIDs, select the services, and then click Hide SSID or Show SSID.
¡ To edit a wireless service, click the service name. Configure the service parameters as needed, including auto SSID, SSID, service status, forwarding mode, encryption, authentication, authentication fail permit, and client MACs filtering settings.
|
|
NOTE: · If auto SSID is enabled, you must click Auto SSID Setting Sync to deploy changes to devices after manually changing the AP name or importing APs. · If you specify 802.1X encryption for the device and Built-In Server for the AAA server configuration, the cloud-managed AP acts as the RADIUS server to provide services. You can configure 802.1X authentication user account and password on the cloud platform. For more information, see H3C Cloudnet Authentication User Guide. If you specify External Server for the AAA server configuration, you can configure the authentication server, accounting server, and ISP domain settings. You must configure 802.1X authentication user account and password on the external RADIUS server. |
3. To configure whitelist and blacklist
settings, click the down chevron icon ![]() for the
domain name whitelist and blacklist field.
for the
domain name whitelist and blacklist field.
The system does not authenticate domain names in the whitelist and forbids access from domain names in the blacklist. If you add a domain name to both the whitelist and the blacklist, the blacklist entry takes effect.
As a best practice, add all domain names that do not require authentication to the whitelist.
4. To configure advanced settings, click the
down chevron icon ![]() for the advanced settings field,
configure the following features, and then click OK:
for the advanced settings field,
configure the following features, and then click OK:
¡ 5GHz-Preferred—Enables dual-band clients to prefer to access 5 GHz radios.
¡ 5GHz Load Balance—Hides the SSID of a 5 GHz radio if the number of associated clients reaches 40 and the client quantity gap between the radio and another 5 GHz radio reaches 10. SSID hiding will be disabled if the associated client quantity or quantity gap drops below the corresponding threshold.
¡ WLAN Probe—Enables the device to snoop wireless packets to monitor the wireless environment.
Configure radio settings
1. Click the Radio Configuration tab.
2. Select a scenario for the site. Each scenario defines a set of default settings. Scenario options include:
¡ High Density Coverage—Specifies high-density AP deployment, such as large conference rooms, dining rooms, exhibition halls, and collocation offices.
¡ Hotels—Applies to scenarios where one AP covers one to two rooms.
¡ Office—Applies to scenarios where one AP covers one to two rooms.
¡ Shops—Applies to low-density AP deployment with enough channel resources.
¡ Default—Specifies default deployment, which is applicable to most scenarios.
¡ Custom—Uses customized radio bandwidth and power settings.
3. To edit radio settings, click the Edit icon for the cloud-managed AP, and then configure the radio state, channel, power, and bandwidth as needed.
Figure 17 Editing radio settings
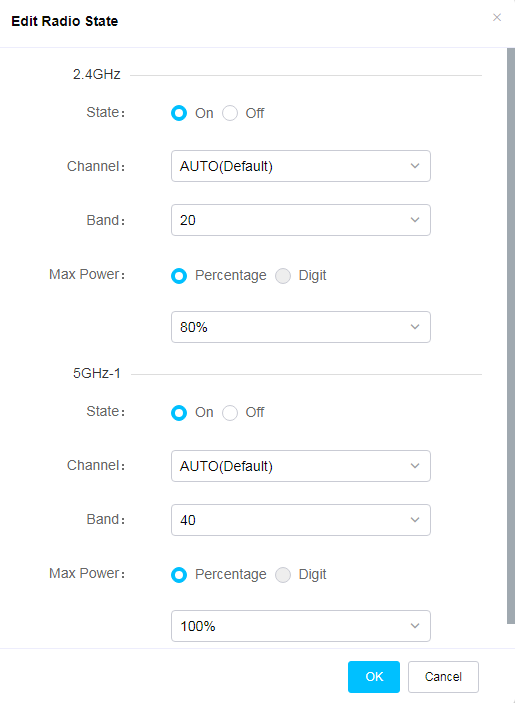
4. Enable configuration synchronization for cloud-managed APs.
With this feature enabled, the system synchronizes configurations from the cloud to the cloud-managed APs at specified intervals.
With this feature disabled, newly added cloud-managed APs cannot obtain configurations from the cloud, and configuration changes on the cloud cannot be deployed to offline APs. This might cause configuration inconsistency on devices and on the cloud.
Enable the Oasis mode
By default, a fit AP operates as a cloud-managed AP automatically after connecting to the Cloudnet platform for the first time if the fit AP is not registered on an AC. To manually change the mode of a fit AP to cloud, you must first enable the Oasis mode.
Restrictions and guidelines
Only fit APs of Release 2433P03 support this task.
Make sure the fit AP has been added to the Cloudnet platform. To add fit APs to the Cloudnet platform, access the Network > Devices page and then click Add.
Procedure
1. From the left navigation pane, select Settings > Cloud APs > Oasis Mode.
2. Select a branch and a site from the top of the work pane.
3. Enable the Oasis mode.
Figure 18 Enabling the Oasis mode
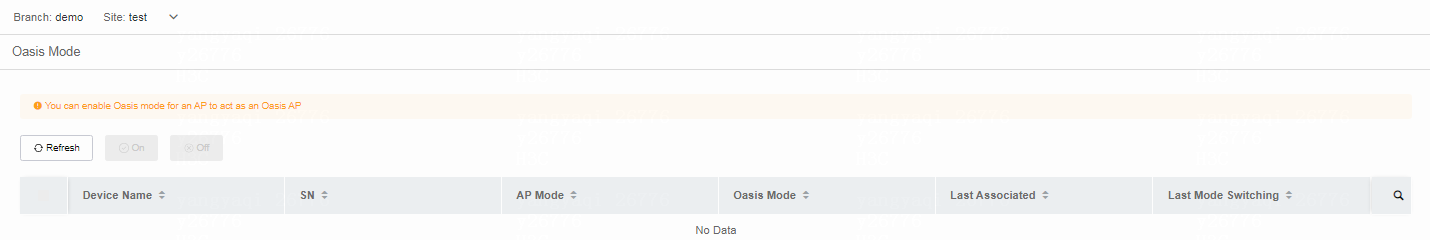
Manage login settings
Procedure
1. From the left navigation pane, select Settings > Cloud APs > Login.
2. Select a branch and a site from the top of the work pane.
3. Configure the password for local Web access and configure management Wi-Fi settings.
You can use the management Wi-Fi to access and manage a cloud-managed AP. The default SSID of the management Wi-Fi is H3C_XXXXXX, where XXXXXX is the last six digits of the MAC address of the AP.
4. Enable SSH as needed. By default, SSH is disabled for login.
5. Enable Telnet as needed. By default, Telnet is enabled for login.
Support for SSH and Telnet depends on the device model.
Figure 19 Managing login settings
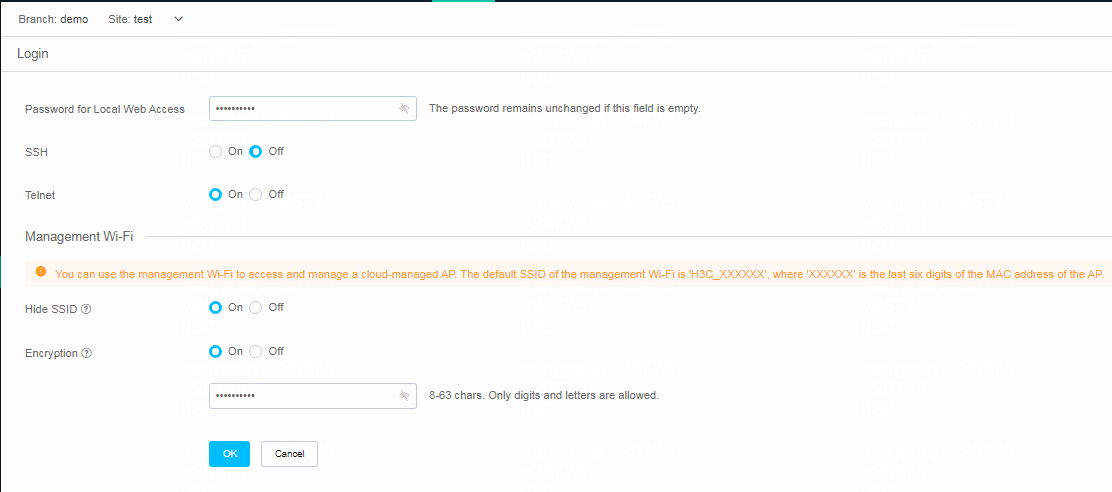
Parameters
· Password for Local Web Access: Set the password for accessing the local Web interface of cloud-managed APs. The password must be a case-sensitive string of 10 to 53 characters from at least two of the following categories: uppercase letters, lowercase letters, digits, and special characters. The password cannot contain a username or the reverse letters of a username.
· Hide SSID: Disable clients from discovering the SSID through active scanning. To access the WLAN, clients must enter the SSID to perform passive scanning. This enhances network security.
· Encryption: Enable the system to encrypt client traffic to enhance network security.
Configure command lines
Use this feature under the guidance of professionals.
1. From the left navigation pane, select Settings > Cloud APs > CLI.
2. Select a branch and a site from the top of the work pane.
3. To configure command lines, select the CLI tab. Click Add, select All or Select for a specific model, and click OK. After adding a model, enter the description and configure command lines as formatted in the examples and click OK. After configuring one model, click Add to add other models. You can configure a maximum of 10 models.
4. To view the application result for a template, click Records.
Configure routers
Configure wireless services for a built-in AC
1. From the left navigation pane, select Settings > Routers > Wireless Services.
2. Select a branch, a site, and a device from the top of the work pane.
3. Configure wireless services. For more information, see "Configure wireless services."
Configure wireless services for a fat AP
1. From the left navigation pane, select Settings > Routers > Fat APs.
2. Select a branch, a site, and a device from the top of the work pane.
3. To add a wireless service, click Add, configure wireless service settings as needed, and then click OK.
4. To edit a wireless service, click the Edit icon ![]() for that wireless service.
for that wireless service.
5. To delete a wireless service, click the Delete icon ![]() for that wireless service.
for that wireless service.
6. To synchronize information about locally created wireless services to the Cloudnet platform, click Sync.
You can synchronize only wireless services that have an SSID configured.
Configure AP settings
Restrictions and guidelines
Only routers of version 5418 or later support this task.
The AP list displays only manual APs, including APs converted from auto APs.
Procedure
1. From the left navigation pane, select Settings > Routers > AP Settings.
2. Select a branch, a site, and a device from the top of the work pane.
3. To configure an AP, click the Edit icon ![]() for that AP. You can also click the AP
name, state, channel, power, or bandwidth link of an AP to edit the specific
field.
for that AP. You can also click the AP
name, state, channel, power, or bandwidth link of an AP to edit the specific
field.
4. To synchronize locally configured AP settings to Cloudnet, click Sync.
5. To export displayed AP information, click Export.
Configure WLAN security
Perform this task to configure client blacklist or whitelist. The blacklist forbids clients from accessing wireless services provided by a device and the whitelist permits only specified clients to access the wireless services. If you configure both the blacklist and whitelist, only the whitelist takes effect.
Restrictions and guidelines
You can add a maximum of 1024 blacklist entries or whitelist entries.
Procedure
1. From the left navigation pane, select Settings > Routers > WLAN Security.
2. Select a branch, a site, and a device from the top of the work pane.
You are placed on the Blacklist tab.
3. Configure the blacklist as needed.
¡ To add a client to the blacklist, click Add.
¡ To delete clients from the blacklist, select the clients, and then click Bulk Delete.
¡ To synchronize blacklist entries configured on the device, click Sync.
4. To configure the whitelist, click the Whitelist tab.
¡ To add a client to the whitelist, click Add.
¡ To delete clients from the whitelist, select the clients, and then click Bulk Delete.
¡ To synchronize whitelist entries configured on the device, click Sync.
Configure basic network settings
1. From the left navigation pane, select Settings > Routers > Basic Settings.
2. Select a branch, a site, and a device from the top of the work pane.
You are placed on the Local tab.
3. To synchronize locally configured basic network settings to Cloudnet, click Sync from Device.
4. On the Local tab, configure the following local settings:
¡ System Domain Name: Name of the device.
¡ Local Address: IP address of VLAN-interface 1 on the device.
¡ Mask: IP address mask.
Figure 20 Configuring local settings
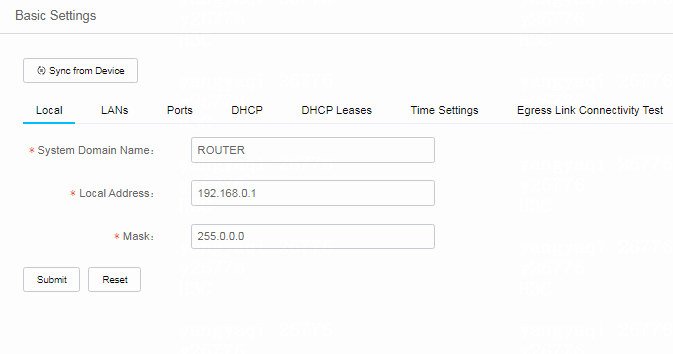
5. To configure LAN settings, click the LANs tab.
You cannot delete VLAN 1.
¡ To add a VLAN, click Add, and then configure the VLAN as needed.
- Specify the VLAN ID.
- Specify an IP address for the VLAN interface.
- Specify a subnet mask for the interface IP address.
- Specify a VLAN description. Question marks (?) are not allowed.
¡ To add a LAN interface, click Add, click the LAN tab, and then configure the LAN interface as needed.
- Select an interface.
- Specify an IP address for the interface.
- Specify a subnet mask for the interface IP address.
¡ To view member ports of a VLAN, click the number link in the Member Ports column.
¡ To delete specific VLANs, click Custom Delete, and then specify the IDs of VLANs to delete.
¡ To delete VLANs or LAN interfaces in bulk, select the VLAN or LAN interface entries, and then click Bulk Delete.
¡ To
delete a VLAN or LAN interface, click the Delete icon ![]() for
that VLAN or LAN interface.
for
that VLAN or LAN interface.
¡ To
edit a VLAN or LAN interface, click the Edit icon ![]() for
that VLAN or LAN interface.
for
that VLAN or LAN interface.
6. To configure port settings, click the Ports tab.
The page that opens displays port configuration.
To edit a port, click the Edit icon ![]() for that port. You can edit the link
type, PVID, permitted VLANs, port isolation, and PoE settings.
for that port. You can edit the link
type, PVID, permitted VLANs, port isolation, and PoE settings.
Figure 21 Editing a port
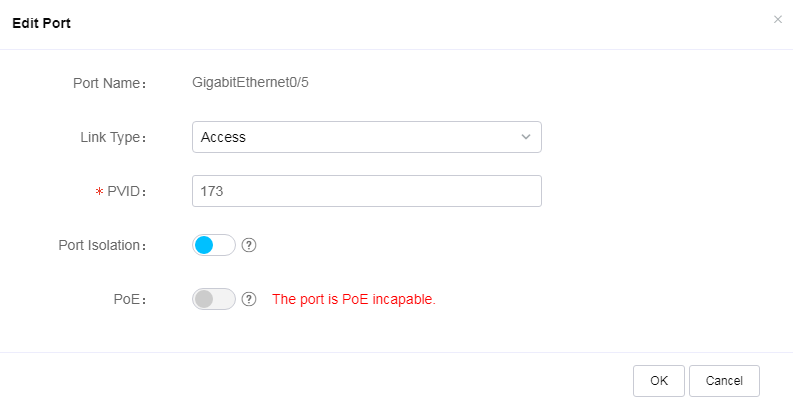
7. To configure DHCP settings, click the DHCP tab.
The page that opens displays DHCP configuration, including IP segment, lease, and assigned addresses.
¡ To
configure DHCP server settings, click the Edit icon ![]() for
an entry. You can configure the IP address lease, address pool start address,
address pool end address, reserved IP addresses, and DNS server.
for
an entry. You can configure the IP address lease, address pool start address,
address pool end address, reserved IP addresses, and DNS server.
¡ To
configure static bindings, click the Static Binding icon ![]() for an entry. You can click Add to add a
static binding between an IP address and a MAC address.
for an entry. You can click Add to add a
static binding between an IP address and a MAC address.
¡ To reserve IP addresses from all address pools, click Global Reserved Addresses.
8. To view DHCP leases, click the DHCP Leases tab.
The page that opens displays information about DHCP leases, including IP assignment method and lease remaining time.
9. To configure time settings, click the Time Settings tab.
¡ Select a time zone.
¡ Select whether to enable NTP.
¡ Specify recommended and custom NTP servers.
10. To test egress link connectivity, click the Egress Link Connectivity Test tab.
Only MSR series device supports this feature.
¡ Enable wired link test as needed. If you select On for this feature, configure the test address, test interface, and alarm threshold.
¡ Enable 4G link test as needed. If you select On for this feature, configure the test address, test interface, and alarm threshold.
Figure 22 Configuring egress link connectivity test
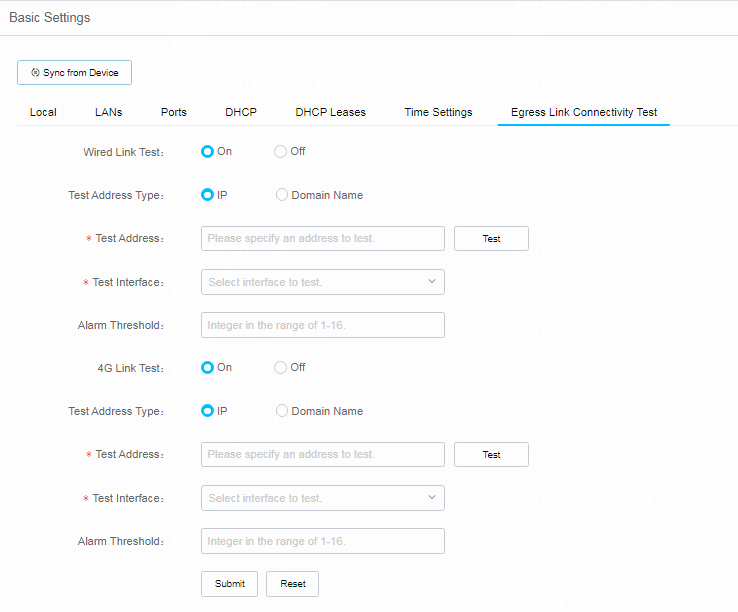
Configure service settings
1. From the left navigation pane, select Settings > Routers > Service Settings.
2. To enable or disable WLAN probe, select the APs, and then click Enable/Disable WLAN Probe.
Configure VPN settings
1. From the left navigation pane, select Settings > Routers > VPN.
2. Configure VPN settings.
Configure bulk settings
1. From the left navigation pane, select Settings > Routers > Bulk Settings.
2. Configure bulk settings. For more information, see "Configure ACs in bulk."
Configure 802.1X authentication
From the left navigation pane, select Settings > Routers > 802.1X Auth.
For more information, see "Configure 802.1X authentication."
Configure switches
View switch summary
1. From the left navigation pane, select Settings > Switches > Summary.
2. Select a branch and a site from the top of the work pane.
The page that opens displays statistics about switches in the site, including online state, device name, SN, type, software version, branch, and site.
3. To manage a device, click the Basic Settings
icon ![]() for that device.
for that device.
Configure basic settings
1. From the left navigation pane, select Settings > Switches > Basic Settings.
2. Select a branch and a site from the top of the work pane.
The page that opens displays basic info, panel info, interface settings, and interface list.
Basic information about a switch includes the device name, model, MAC address, device SN, and version.
The Panel Info area displays software version, interface type and state, and PoE state information for a switch.
3. Perform the following tasks in the Panel Info area:
¡ To enable auto refreshing of port states on the switch panel, select Auto Refresh. The system refreshes the port states on the switch panel every 5 minutes in an hour.
¡ To view module information for a switch, select a switch from the Member list, and then select a module from the Module list.
¡ To synchronize basic settings on the switch to Cloudnet, click Synchronize.
¡ To restart PoE interfaces in bulk, select one or multiple interfaces, and then click Bulk Restart PoE Interfaces.
4. On the Summary tab, perform the following tasks:
a. View statistics about interfaces on the switch, including the following:
- Interface type
- Link state
- Whether PoE is supported
- Inbound and outbound rates
- Inbound and outbound unicasts
- Inbound and outbound non unicasts
- Discarded inbound and outbound non-error packets
b. To customize the columns to be displayed on the interface list, click + / -.
c. To clear statistics about specific interfaces, click Bulk Delete. To clear statistics about all interfaces, click Clear All.
5. To manage an interface, select that interface on the device panel. You will be placed on the Interface Management tab.
6. Configure interface settings such as management state, duplex mode, interface type, PVID, rate, flow control, and bandwidth as required, and then click Submit.
The configured settings will be displayed on the interface list.
7. To manage VLAN settings, click the VLANs tab.
The page that opens displays VLAN information, including VLAN ID, untagged ports, tagged ports, VLAN interface IP, subnet mask, and VLAN description.
¡ To view all the tagged or untagged ports in a VLAN, click the number link in the Tagged Ports or Untagged Ports column for that VLAN.
¡ To
edit a VLAN, click the Edit icon ![]() in the Actions column
for that VLAN.
in the Actions column
for that VLAN.
¡ To
delete a VLAN, click the Delete icon ![]() in the Actions column
for that VLAN.
in the Actions column
for that VLAN.
¡ To delete specified VLANs, click Custom Deletion, enter VLAN IDs or VLAN ID ranges, and then click OK.
¡ To add a VLAN, click Add.
8. To configure link aggregation, click the Link Aggregation tab.
The page that opens displays link aggregation information, including aggregation group ID, description, aggregation mode, and member ports.
¡ To
view all the member ports of a group, click the ![]() icon
in the Member Ports column for that group.
icon
in the Member Ports column for that group.
¡ To
edit an aggregation group, click the Edit icon ![]() in
the Actions column for that group. You can edit the aggregation type,
aggregation mode, description, and member ports.
in
the Actions column for that group. You can edit the aggregation type,
aggregation mode, description, and member ports.
¡ To
delete an aggregation group, click the Delete icon ![]() in
the Actions column for that group.
in
the Actions column for that group.
¡ To add an aggregation group, click Add.
¡ To delete specific aggregation groups, select the groups, and then click Bulk Delete.
9. To configure port isolation, click the Port Isolation tab.
The page that opens displays link aggregation information, including isolation group ID and member ports.
¡ To
view all the member ports of a group, click the ![]() icon
in the Port List column for that group.
icon
in the Port List column for that group.
¡ To
edit an isolation group, click the Edit icon ![]() in
the Actions column for that group. You can edit the member ports.
in
the Actions column for that group. You can edit the member ports.
¡ To
delete an isolation group, click the Delete icon ![]() in
the Actions column for that group.
in
the Actions column for that group.
¡ To add an isolation group, click Add.
¡ To delete specific isolation groups, select the groups, and then click Bulk Delete.
10. To configure PoE settings, click the PoE tab.
The PIs tab displays statistics about PIs, including detection state, current power, peak power, and port priority.
¡ To configure a PI, select that PI in the device panel, enable or disable PoE, configure PI settings such as port priority and maximum power as needed.
¡ To restart a PI, click Restart in the Restart PI column for that PI.
¡ To restart multiple PIs, select the PIs, and then click Bulk Restart PIs.
11. To manage the PSE, click the PSE tab:
¡ To enable or disable non-standard PD detection, click On or Off for the Non-Standard PD Detection field.
¡ Specify the power alarm threshold, and click Submit.
Configure wireless services
1. From the left navigation pane, select Settings > Switches > Wireless Services.
2. Select a branch, a site, and a device from the top of the work pane.
3. Configure wireless services. For more information, see "Configure wireless services."
Configure AP settings
1. From the left navigation pane, select Settings > Switches > AP Settings.
2. Select a branch, a site, and a device from the top of the work pane.
3. Configure AP settings. For more information, see "Configure AP settings."
Configure 802.1X authentication
From the left navigation pane, select Settings > Switches > 802.1X Auth.
For more information, see "Configure 802.1X authentication."
Maintain
Upgrade device software
Restrictions and guidelines
You can upgrade only online devices.
Offline download is available only for upgrade by device.
A recommended version is an optimal version recommended based on the upgrade risks and performance. A recommended version is selected by default.
Procedure
1. From the left navigation pane, select Maintain > Upgrade.
2. Select a branch and a site from the top of the work pane.
3. Click the Upgrade by Device or Upgrade by Model tab, select the version number, select the devices or models, and then click Upgrade.
4. In the dialog box that opens, select an upgrade method, and then click OK. Options include Upgrade and Reboot, Upgrade, Save, and Reboot, and Upgrade Only.
5. To download a software version, select the version number, select the devices or models, and then click Offline Download.
6. To view upgrade details, click the Upgrade Details tab.
¡ The Devices Being Upgraded area displays current software version, upgrade progress, and upgrade start time for the devices being upgraded.
¡ The Upgraded Devices area displays current software version, upgrade state, and failure reason for the upgraded devices.
Manage private software versions
1. From the left navigation pane, select Maintain > Private Versions.
The page that opens displays the version name, applicable device model, category, and devices, and version description for the private software versions.
2. To manage private software versions, perform the following tasks:
¡ To
delete a version, click the Delete icon ![]() in the Actions column
for that version. To delete one or multiple version in bulk, select the versions,
and then click Delete on top of the version list.
in the Actions column
for that version. To delete one or multiple version in bulk, select the versions,
and then click Delete on top of the version list.
¡ To
edit a version, click the Edit icon ![]() in the Actions column
for that version. You can edit all information excluding image file.
in the Actions column
for that version. You can edit all information excluding image file.
¡ To
upgrade a version, click the Upgrade icon ![]() in the Actions column
for that version. For more information, see "Upgrade device software."
in the Actions column
for that version. For more information, see "Upgrade device software."
¡ To refresh the version list, click Refresh on top of the version list.
3. To upload a version, click the Version Upload tab, configure the following parameters, and then click OK:
¡ Version Name: Specify a name for the version.
¡ Version Description: Specify a description for the version.
¡ Device Model: Select a device category, and then select models, or enter a model keyword in the field to filter device models, and then select the models.
¡ Image File: Click Select File to select a file, and then click Open. You can upload a maximum of 10 versions.
Use the CLI helper
Restrictions and guidelines
This task is available only for ACs, routers, switches, and specific cloud-managed APs.
To use this feature, make sure the device is enabled with Telnet and configured with a username and strong password. The default weak password cannot be used for connection.
Procedure
1. From the left navigation pane, select Maintain > CLI Helper.
2. Select a branch, a site, and a device from the top of the work pane.
3. Enter the username and password and click Connect in Password Verification for Telnet Login.
4. To view basic device information, network information, or monitoring information, click Basic Info, Network Info, or Monitoring Info in the Common Commands area to the right of the page.
5. To set the cache size, click Set Cache.
6. To export operation records, select Export Records, configure the export file name, and click OK.
Access the file system
This task is available only for ACs, routers, switches, and specific cloud-managed APs.
To access the file system:
1. From the left navigation pane, select Maintain > File System.
2. Select a branch, a site, and a device from the top of the work pane.
3. Click General or Advanced to switch the display mode.
4. In general mode, click Manage for a specific file type.
5. To upload a file, make sure the AC has sufficient space, click Upload, and then select the file to upload. File upload is available only in Advanced mode.
6. To download a file, select the file, and then click Download.
7. To rename a file, select the file, and then click Rename. You cannot rename a folder.
8. To delete a file, select the file, and then click Delete. Deleted files cannot be restored. Use this function with caution.
Restore the configuration
This task is available only for ACs, routers, switches, and specific cloud-managed APs.
To restore device configuration:
1. From the left navigation pane, select Maintain > Restore.
2. Select a branch, a site, and a device from the top of the work pane.
3. To add a restore point, click Create, enter the reason, specify whether to use this file as the next startup configuration file, and then click OK.
4. To restore the current configuration of the device to the specified restore point, select the target configuration file, and then click Restore.
5. To configure automatic backup, click Auto Backup, specify the backup interval, and then specify the maximum number of backup copies. For more information, see "Enable or disable services."
Maximum number of backup copies is the maximum number of configuration files that you want Cloudnet to save for configuration restoration.
If you select Weekly as the backup interval, the system backs up configuration automatically on every Sunday. If you select Monthly as the backup interval, the system backs up configuration automatically at 01:00 to 04:00 the first day of every month. If the device is offline, the system retries at 06:00 to 09:00, 11:00 to 13:00, and 19:00 to 21:00.
6. To view detailed information about a restore
point, click the Details icon ![]() .
.
7. To delete a restore point, click the Delete
icon ![]() .
.
Compare configuration
Restrictions and guidelines
You can only import configuration files with a size smaller than 10 M.
Procedure
1. From the left navigation pane, select Maintain > Compare Cfg.
2. To compare local configurations, click Load Local Configuration File or click the Load
Local Configuration File icon ![]() in the upper right corner, and then
select a local file.
in the upper right corner, and then
select a local file.
3. To compare configurations on devices, perform the following tasks:
a. Click Read Device Configuration File or
click the Read Device Configuration
File icon ![]() in
the upper right corner.
in
the upper right corner.
b. In the dialog box that opens, select a site, select a device, select a configuration, Running, Local, Cloud-Backed Up, and then click OK. If the device is offline, you can select only Cloud-Backed Up.
Configuration differences will be highlighted, and number of different command lines will be displayed at the bottom of the page.
Maintain devices
Restrictions and guidelines
You can restart only online devices.
Procedure
1. From the left navigation pane, select Maintain > Device Operation.
2. Select a branch and a site from the top of the work pane.
3. Click a device tab.
4. On the page that opens, select a device.
5. To save the running configuration on the device and then restart the device, click Save Config and Restart. During the restart process, the device is unavailable. Use this option with caution.
6. To restart the device immediately, click Restart. This operation removes unsaved configuration on the device. During the restart process, the device is unavailable. Use this option with caution.
7. To configure scheduled restart, click Scheduled Restart, select a restart policy, and configure a schedule. This operation removes unsaved configuration on the device. During the restart process, the device is unavailable. Use this option with caution.
8. To remove scheduled restart settings, click Remove Scheduled Restart Settings.
9. To save the configuration, click Save Config.
10. To reconnect the device to the Cloudnet platform, click Reset Cloud Connection. Use this option when Cloudnet connection errors occur.
Perform a health check
1. From the left navigation pane, select Maintain > Health Check.
2. To configure health check, click Configure Health Check.
3. On the Health Check Items tab, select health check items as needed, and then click Save. Required items cannot be selected.
4. Click the Devices to Check tab, perform the following tasks, and then click Save.
¡ To add devices to the health check list, click Add Devices, select By Device or By Site, select target devices, and then click Add Selected Devices or Add Selected Sites. To add all devices or all sites, click Add All Devices or Add All Sites.
¡ To remove devices from the health check list, select target devices, and then click Delete Devices.
¡ To remove sites from the health check list, select target sites, and then click Delete Sites.
5. On the Health Check page, click Health Check Tasks.
6. Select a health check schedule, and then click OK. Options include the following:
¡ Immediate—Performs a health check for the device immediately.
¡ One-Off—You select a time point at a specific day, and the system will perform a health check at the specified time point.
¡ Scheduled—You select a schedule, By Day, By Week, or By Month, and then select a time point.
7. To cancel a health check, click Cancel.
8. To view the health check report, click View History Report.
The page that opens displays the health check records. The system saves a maximum of 50 health check records.
¡ To filter health records by time, select a time range at the upper right corner.
¡ To
delete a health check record, click the Delete icon ![]() in the Actions column for that
record. To delete health check records in bulk, select the health records, and
then click Delete on top of the list.
in the Actions column for that
record. To delete health check records in bulk, select the health records, and
then click Delete on top of the list.
¡ To
view details about a health check, click the Details icon ![]() in
the Actions column for that record.
in
the Actions column for that record.
The page that opens displays basic info, device list, and issues found in the health check.
¡ To refresh the data in the health check record list, click Refresh.
Use tools to manage devices
Restrictions and guidelines
AP LED quiet mode configuration is available only for fit APs associated with an AC and cloud-managed APs.
Packet capture is available only for fit APs associated with an AC.
Procedure
1. From the left navigation pane, select Maintain > Tools.
2. Select a branch and a site from the top of the work pane.
3. To perform a ping operation, enter the destination address, and then click Execute on the Ping tab.
4. To use the advanced ping function, click Advanced, specify the destination IP address, source IP address, packet size, and packet quantity, and then click Execute.
The ping results will be displayed on the execution result list.
5. To view details about a successful ping operation, click View Details in the View Details column for that ping operation. To view the details in a graph, click Graph View. To view the details in a table, click Table View.
6. To perform a tracert operation, click the Trace tab, enter the destination address, and then click Execute.
7. To use the advanced tracert function, click Advanced, specify the destination IP address, source IP address, destination port, initial TTL, max TTL, timeout, and packet quantity, and then click Execute.
8. To view details about a successful tracert operation, click View Details in the View Details column for that tracert operation. To view the details in a graph, click Graph View. To view the details in a table, click Table View.
9. To configure AP LED quiet mode, click the AP LED Quiet Mode tab.
10. On the page that opens, enable LED quiet mode, select a quiet period, and then click Submit. If you select Custom as the quiet period, you must specify the start time and end time.
11. To configure packet capture, click the Capture tab.
12. On the Capture Configuration tab, perform the following tasks:
¡ To add a packet capture configuration, click Add, and then configure the following parameters.
To save the configuration only, click Save. To save the configuration and start packet capture, click Save and Start.
- Configuration Name: Specify a name for the packet capture configuration.
- Capture Type: Only Wireless is available.
- Capture Mode: Only Mirroring is available. In this mode, the system captures only packets transmitted on the current working channel, without wireless service interruption.
- AP: Click this field to select an AP, or click Advanced Filter to select an AP, and then click OK.
- Radio: Select a radio on the AP.
- Channel: The system automatically selects the working channel of the AP after you select a radio on the AP.
- Duration: Specify the packet capture duration. Packet capture stops automatically when the time has elapsed or when the size of the captured packets reaches 65536 KB.
- Filter Rule: Specify a filter rule. For more information, see the description to the right of this field.
¡ To edit
a capture configuration, click the Edit icon ![]() in
the Actions column for that configuration, and edit the settings as
needed. To save the configuration only, click Save. To save the configuration and
start packet capture, click Save and Start.
in
the Actions column for that configuration, and edit the settings as
needed. To save the configuration only, click Save. To save the configuration and
start packet capture, click Save and Start.
¡ To
delete a capture configuration, click the Delete icon ![]() in the Actions column for that
configuration. To delete one or multiple capture configurations in bulk, select
the configurations, and then click Delete on top of the list.
in the Actions column for that
configuration. To delete one or multiple capture configurations in bulk, select
the configurations, and then click Delete on top of the list.
¡ To
copy a capture configuration, click the Copy icon ![]() in the Actions column for that
configuration, and then change the configuration name. To save the
configuration only, click Save. To save the configuration and start packet capture, click Save and Start.
in the Actions column for that
configuration, and then change the configuration name. To save the
configuration only, click Save. To save the configuration and start packet capture, click Save and Start.
¡ To
start a packet capture task, click the Start icon ![]() in the Control column for that
task.
in the Control column for that
task.
¡ To refresh the packet capture list, click Refresh. To enable the system to refresh the list automatically, select Auto Refresh.
13. To view packet capture records, click the Capture Records
tab. To download a capture record, click the Download icon ![]() in the Actions column for that record.
in the Actions column for that record.
Replace devices
Perform this task to synchronize device configuration to Cloudnet and replace a device when the device fails.
To replace devices:
1. From the left navigation pane, select Maintain > Replace Devices.
2. Select a branch and a site from the top of the work pane.
3. On the Replacement tab, click the Sync Now icon ![]() in the Actions column for a device, and then
select Do Not Save or Save & Continue.
in the Actions column for a device, and then
select Do Not Save or Save & Continue.
4. For the system to automatically synchronize device configuration, enable Auto Sync, and then click Auto Sync Time to specify an auto sync time. Then the system will synchronize configuration changes to Cloudnet when the device comes online or at the specified time.
5. Click the Replacement icon ![]() in the Actions column for a
device, and then select Register
New Device & Replace or Replace with Registered Device.
in the Actions column for a
device, and then select Register
New Device & Replace or Replace with Registered Device.
6. To replace an AP, click Replace AP, and then enter the old AP SN and new AP SN.
7. To view replacement records, click the Records tab. You can refresh the page to view the most recent records.
Messages
Manage alarms
Restrictions and guidelines
You can edit the default alarm policy but cannot delete it.
View or export alarms
Procedure
1. From the left navigation pane, select Messages > Alarms.
The List tab displays alarm statistics collected during the specified time range.
2. To filter alarms, click Filter, specify the filtering criteria, and then click Search.
3. To export alarms, click Export.
The alarms will be exported to an Excel file.
4. To mark alarms as read, select target alarms and click Mark as Read.
5. To mark all alarms as read, click Mark All as Read.
6. To delete alarms, select target alarms and click Delete.
Parameters
· Alarm Trend: Displays the alarm trend by alarm quantity.
· Alarm Severity: Displays alarm distribution by alarm severity.
· Alarm Type Top 5: Displays the five alarm types with the most alarms.
· Alarm Info: Displays the alarm list.
Subscribe to alarms
Procedure
1. From the left navigation pane, select Messages > Alarms.
2. Click the Subscription tab.
3. To add an alarm policy, click Add and then configure policy settings as needed.
4. To edit an alarm policy, click the Edit icon for that policy. Then, configure policy settings as needed.
Parameters
· By Area: Enable or disable alarm generation by area. After you enable this function, the system generates alarms only for APs in the selected areas.
· Notification: Select the method through which alarms are notified. Options include:
¡ Display but Not Push.
¡ Email—Send alarm emails to the email addresses bound to the selected accounts. The system can send a maximum of 50 alarm emails to alarm receivers in a site every day, and a maximum of 1000 alarm emails to all receivers in all sites every day. The actual numbers might be higher.
· Triggered: Select the time during which alarms can be notified.
· Maintenance: Select a time range during which alarm notification or generation is forbidden.
· Info Sync: With info sync enabled, the system adds CPU usage, memory usage, channel usage, and online client quantity to the log content for the following types of logs: high channel usage, too many access clients.
· Accounts: Select the accounts that can receive the alarms.
· Alarm Info: Select types and severity levels of alarms to be notified. Available severity levels include Tip, Info, Minor, Major, and Critical. For device CPU, device memory, and AP bulk dropped alarms, you must also specify the alarm thresholds.
View SMS details
1. From the left navigation pane, select Messages > SMS Details.
2. To export SMS details, click Export.
3. To delete an SMS detail entry, click Delete for that SMS detail entry.
View operation logs or login logs
1. From the left navigation pane, select Messages > Operation Logs.
2. To view operation logs, click the Operation Logs tab. You can click User Operation Logs to view site or device import logs.
3. To view login logs, click the Login Logs tab.
View system messages
From the left navigation pane, select Messages > System Messages.
1. To mark one or more system messages as read, select target system messages and click Mark as Read.
2. To search for specific system messages, enter key words in the search box and click the search icon.
Manage fault reports
The system allows users to scan a QR code and report faults during network operation. You can perform this task to view, export, and processor the reported faults and configure fault report subscription.
The system saves fault reports generated in the last 12 months.
Export the QR code for fault reporting
1. From the left navigation pane, select Messages > Fault Reports.
2. Click Export QR Code for Fault Reporting.
3. Select the site, and then click Export.
View detailed fault report information
1. From the left navigation pane, select Messages > Fault Reports.
The page that opens displays brief information about fault reports, including site name, location, fault type, source, report time, and time of the most recent process.
2. Click the Details icon ![]() for
a fault report.
for
a fault report.
The page that opens displays detailed information about the report. You can specify the processing state and the processing record for the report.
Process a fault report
1. From the left navigation pane, select Messages > Fault Reports.
You can select a processing state for each report on the brief information page or specify the processing state and record for a report from the detailed information page.
2. Click the Details icon ![]() for
a fault report.
for
a fault report.
3. Specify the processing state and the processing record.
4. Click Submit.
Process a fault report
1. From the left navigation pane, select Messages > Fault Reports.
2. Click the Alarms Subscription link in the notes area.
For more information, see "Subscribe to alarms."
System
Enable or disable services
Restrictions and guidelines
Only Customer 5412 and later versions support smart O&M.
Configuration synchronization is enabled for cloud-managed APs by default. As a best practice, keep it enabled, and disable it only when you want to use locally configured settings on the APs.
Procedure
1. From the left navigation pane, select System > Service Switches.
2. On the Smart O&M tab, enable or disable smart O&M. For more information about smart O&M, see H3C Cloudnet Smart Operations and Maintenance User Guide.
3. To enable auto backup for a device, click the Auto Backup tab, select ON in the Service State column for that device, specify the backup interface and max backup copies, and then click OK. To enable auto backup for multiple devices in bulk, select the devices, click On on top of the list, specify the backup interface and max backup copies, and then click OK.
4. To disable autobackup for a device, select OFF in the Service State column for that device, and then click OK in the dialog box that opens. To disable auto backup for multiple devices in bulk, select the devices, click Off on top of the list, and then click OK in the dialog box that opens.
5. To view backup information
for a device, click the View icon ![]() in the Actions column
for that device.
in the Actions column
for that device.
6. To view backup information
for a device when a lot of records exist in the list, click the ![]() icon in the upper right corner of the
list, specify the device name or device SN.
icon in the upper right corner of the
list, specify the device name or device SN.
7. To enable or disable configuration synchronization for a cloud-managed AP, click the Cloud-Managed AP Config Sync tab.
8. On the page that opens, select ON or OFF in the Service State column for that AP, and then click OK. To enable or disable configuration synchronization for multiple cloud-managed APs in bulk, select the APs, click On or Off on top of the list, and then click OK.
9. To view or edit settings for a cloud-managed
AP, click the View icon ![]() in the Actions column
for that AP.
in the Actions column
for that AP.
Configure labels
1. From the left navigation pane, select System > Labels.
2. Click Add. Enter a label name, select a
color, and then click OK. To add more labels, click ![]() .
.
3. To synchronize a label from an AP group, click the Sync from Groups tab, select Obtain AP Groups for AC, Obtain AP Groups for Hotel, or Obtain AP Groups for Area, select a device, select an AP group, and then click OK.
4. To delete a label, click the Delete icon ![]() in the Actions column for that label, and
then click OK in the dialog box that opens. To delete one or multiple labels in
bulk, select the labels, and then click Delete on top of the label list.
in the Actions column for that label, and
then click OK in the dialog box that opens. To delete one or multiple labels in
bulk, select the labels, and then click Delete on top of the label list.
5. To edit a label, click the Edit icon ![]() in the Actions column for that label, edit
the label name and color as needed, and then click OK.
in the Actions column for that label, edit
the label name and color as needed, and then click OK.
6. To bind a label to from APs, perform the following tasks:
a. Click the Bind icon ![]() in the Actions column or click the number in the Bound APs column for that label.
in the Actions column or click the number in the Bound APs column for that label.
b. Select a site, select APs to bind to the
label in the Unbound APs area, click ![]() , and
then click OK.
, and
then click OK.
c. To unbind a label from APs, select the APs
in the Bound APs area, click ![]() , and then click OK.
, and then click OK.
7. To filter labels, click ![]() in the upper right corner of the list,
and then enter filter criteria.
in the upper right corner of the list,
and then enter filter criteria.
8. To filter APs by label and reboot APs, access the Smart O&M > APs > AP Reboot page and configure settings. For more information, see H3C Cloudnet Smart Operations and Maintenance User Guide.
Manage subaccounts
About this task
The Cloudnet platform provides five levels of accounts. A first-level account is called a tenant (super account) and accounts of any other level are called subaccounts. Each tenant can manage a maximum of 500 subaccounts. A parent account has the following permissions:
· Manage its subaccounts.
· View subaccounts and sites created by its subaccounts, if any.
· View operation logs about its subaccounts.
For a subaccount, the supported Cloudnet features are determined by its role and the manageable branches and sites are authorized by its parent account. A subaccount can have the following roles:
· Full-Privilege—Has the same privileges as a tenant and can create subaccount.
· Monitor—Has monitoring privileges and does not have configuration and management privileges. This type of account cannot create subaccounts.
· O&M—Has configuration and management privileges and can create subaccounts.
· Demonstration—Has only read privileges to all modules and cannot create subaccounts.
· Operations—Is in charge of operations related services such as user traffic analysis and advertisement pushing and can create subaccounts.
· Configuration—Has network configuration privileges and can create subaccounts.
Procedure
1. From the left navigation pane, select System > Subaccounts.
2. To add a subaccount, click the Add icon ![]() for the account and then configure
subaccount settings as needed.
for the account and then configure
subaccount settings as needed.
3. To assign branch and
site permissions to a subaccount, click the Permission icon ![]() for that account
and then select branches and sites as needed.
for that account
and then select branches and sites as needed.
4. To edit a subaccount, click the Edit icon ![]() for that
account and then configure account settings as needed.
for that
account and then configure account settings as needed.
5. To delete a subaccount, click the Delete icon ![]() for that account.
for that account.
Configure open platforms
1. From the left navigation pane, select System > Open Platforms.
2. To activate open APIs for third-party platforms, click Activate. The page displays the authentication key if open APIs have been activated.
3. To download the API file, click Download File. The file provides information about H3C Cloudnet platform APIs and the methods to configure API-related settings.
4. To push authenticated user information, click Edit. This feature requires the user to be capable of development. For more information, see H3C Cloudnet Authentication User Guide.
Manage your account
Restrictions and guidelines
When you configure IP login limit, follow these restrictions and guidelines:
· With this feature configured, you can use the account to log in to Cloudnet only at specific IP addresses. If the login request is from an IP address out of the specified IP range, the system prompts username or password error.
· After you enable IP login limit, the system displays the current network egress IP address and adds the address to the permitted range by default.
· You can add a maximum of 30 IP address ranges as the permitted ranges.
· Each octet of an IP address must be an integer in the range of 0 to 255. The first octet of an address cannot be 0 or 127 or in the range of 224 to 225.
Procedure
1. From the left navigation pane, select System > Account.
2. On the Account Management tab, edit account settings as needed.
¡ In the Basic Info area, edit the account password, email address, and profile photo (up to 2 M) or delete the account.
¡ In the Service Info area, select the industry, specify the enterprise name, and edit the enterprise logo.
¡ In the Contact Info area, specify the contact address.
3. To configure security settings, click the Account Security Settings tab, and then configure login email notification, login verification, login lockout, and IP login limit as needed.
4. To configure MSP account settings, click the MSP Management tab.
¡ To specify the current account as a general account, select General Account, select whether to authorize MSP management, specify the other settings, and then click OK.
The Request Records list displays MSP management requests of the current account. You can view the request approval status and click the cancellation icon for an entry to revoke the authorization.
¡ To specify the current account as an MSP account, select MSP account, select whether to enable auto approval, and then click Manage Tenants to access the Tenants page.
Auto approval enables the system to approve all hosting requests automatically. For more information about tenant management, see "Manage tenants."
Unbind a device
Only ACs of 5420 or later support device unbinding.
Only tenants can unbind devices form the Cloudnet platform. A tenant can perform up to five unbind operations in a day.
For more information about device unbinding, see H3C Cloudnet Deployment Guide.
Manage assets
Manage assets
1. On the top navigation bar, select Service > Assets.
2. From the left navigation pane, select Assets.
The page that opens displays the asset list.
3. To filter assets, click Filter, specify criteria such as asset type, asset number, and site name and then click Search.
4. To synchronize asset online states, click Synchronize Online State.
5. To synchronize the last association time for all assets, click Synchronize
6. To add an asset, click Add, on the page that opens, specify the asset type, asset number, and site name, and click OK.
7. To edit an asset, click the Edit icon ![]() for that asset, edit information as
needed, and click OK.
for that asset, edit information as
needed, and click OK.
8. To synchronize assets, click Auto Sync, on the page that opens, select settings as needed, and click OK.
The system synchronizes all device information of the account to the platform for unified management.
9. To export assets, perform the following tasks:
¡ To export assets by criteria, click Export by Criteria, specify the label, state, and asset life, and click OK.
¡ To export all assets, click Export All.
The Safari browser does not support the export feature.
10. To manage asset labels, click Label Management and perform the following tasks:
¡ To add a label, click Add, specify the label name and remarks, and click OK.
¡ To
delete a label, click the Delete ![]() icon
for that label. In the dialog box that opens, click OK.
icon
for that label. In the dialog box that opens, click OK.
11. To delete assets, select the assets, and then click Bulk Delete. In the dialog box that opens, click OK.
Manage endpoint assets
1. On the top navigation bar, select Service > Assets.
2. From the left navigation pane, select Endpoints.
The page that opens displays the endpoint list.
3. To filter assets, click Filter, specify filters such as endpoint type, online state, and endpoint name, and then click Search.
4. To add an endpoint, click Add, and the perform the following tasks on the page that opens:
¡ Enter the endpoint name and MAC address.
¡ Select the site to which the endpoint belongs, select an endpoint category, and specify a validity period, and then click OK.
¡ Add other properties as needed, and then click OK.
5. To edit an endpoint, click the MAC address of that asset, edit the information as needed, and then click OK.
6. To export endpoints, click Export.
7. To import endpoints, click Import, click Download Template, enter required information in the template, select the template, and then click OK.
8. To add properties to an endpoint, click Add Properties, and
specify the property name and default property value. To add more properties,
click ![]() . To delete a property, click
. To delete a property, click ![]() .
.
9. To delete one or multiple endpoints, select the endpoints, and then click Delete on top of the list. In the dialog box that opens, click OK.
