- Table of Contents
- Related Documents
-
| Title | Size | Download |
|---|---|---|
| 01-Text | 272.77 KB |
Contents
About smart operations and maintenance
Operate and maintain your network
View client health information
View client health information in common mode
View client health information in expert mode
View authentication analysis results
View association and disassociation analysis results
View VIP client health information in common mode
View VIP client health information in expert mode
About smart operations and maintenance
By integrating cloud, network, and endpoint, H3C Cloudnet smart operations and maintenance (O&M) provides network monitoring anywhere anytime and device O&M with ease. It offers excellent user experience through displaying network monitoring data in a clear and organized way. In addition, smart O&M provides abundant data, such as basic device information, health information, channel heatmaps, client event history and health information, greatly lowering the cost for network inspection.
Restrictions and guidelines
· Only H3C WLAN devices except for Xiaobei routers and WTU420 devices support smart O&M.
· For ACs of a version lower than 5412, some functions are unavailable or the displayed data is incorrect. Please upgrade your software to the most recent version.
· For cloud-managed APs, you can use smart O&M functions without enabling the smart O&M feature. For specific cloud-managed APs, some smart O&M functions are unavailable.
· If no device exists in a site, no data will be displayed.
Operate and maintain your network
Access the smart O&M menu
1. On the top navigation bar, click Network.
2. From the left navigation pane, select System > Service Switch.
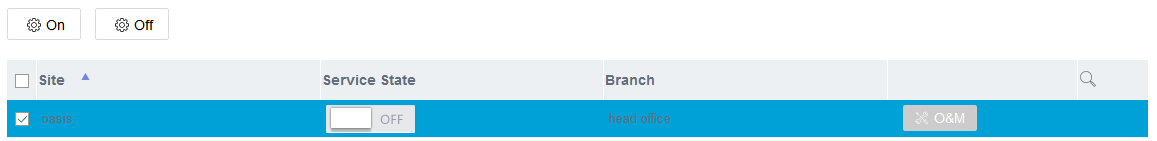
3. Select a site, and then click On.
Figure 1 Enabling smart O&M
4. To access the smart O&M menu, use the following methods:
¡ Click
the Advanced Maintenance icon ![]() for the site.
for the site.
¡ Click Smart O&M on the top navigation bar.
Access the dashboard
Procedure
1. Access the Smart O&M menu.
You are placed on the Dashboard page.
2. Select a site and a device from the top of the page.
Parameters
· Network Health: Displays the score of the entire network. The network is graded based on the AC, AP, and client scores in the site.
· Health Status: Displays the proportion of each network health state in the site during the specified time range based on statistics collected at intervals of 5 minutes.
· Affected AP Statistics: Displays the proportion of APs affected by network issues and the proportion of APs not affected by network issues.
· Affected Client Statistics: Displays the proportion clients affected by network issues and the proportion of clients not affected by network issues.
· Alarms: Displays the number of alarms at each severity level, the total number of alarms, and the number of active alarms.
· Online Devices: Displays the online device quantity and total device quantity by device type. If you select only one AC, the system displays only information about APs associated with the AC.
· Health Scores: Displays the health score trend of ACs, APs, and clients during the selected time range in the site. The system collects health statistics at intervals of 5 minutes. The displayed time interval varies by the specified time span.
¡ AC Health: Displays AC scores in a trend graph. ACs are graded based on CPU usage and traffic.
¡ AP Health: Displays AP scores in a trend graph. APs are graded based on channel usage, client quantity, and client RSSI.
¡ Client Health: Displays client scores in a trend graph. Clients are graded based on channel usage, RSSI, and roaming frequency.
You can click the AC, AP, or client health link to access the detailed health information page.
· Issue Distribution: Displays statistics about issues occurred on all devices or the specified device during the selected time range in the site.
· Issue Trend: Displays issue trend during the selected time range. You can filter issues by issue type. The system collects issue statistics at intervals of 10 minutes.
· Client Association Trend: Displays the number of associated clients on all devices or the specified device during the selected time range in the site. The system collects client statistics at intervals of 5 minutes. The displayed time interval varies by the specified time span.
· Traffic Trend: Displays uplink and downlink traffic trend on all devices or the specified device during the selected time range in the site. The system collects traffic statistics at intervals of 5 minutes. The displayed time interval varies by the specified time span.
Manage issues
View issue information
Restrictions and guidelines
· Issue statistics displayed on the page are collected from the specified device during the selected time range, unless otherwise stated.
· Issues reported by an AP might occur on the AP or a client associated with the AP, or in the WLAN environment. Network administrators must analyze an issue step by step to find the root cause.
Procedure
1. Access the Smart O&M menu.
2. To access the Issue Analysis page, use the following methods:
¡ On the Dashboard page, click an issue type in the Issue Distribution area.
¡ From the left navigation pane, select Issues > Issue Analysis.
3. Select a site and a device from the top of the page.
4. Click the Dashboard icon ![]() or an issue
type.
or an issue
type.
Parameters
For the dashboard:
· Issue Distribution: Displays all issues occurred on all devices or the specified device during the selected time range in the site.
· Issue Trend: Displays the trend of issues. You can filter issues by issue type. The system collects issue statistics at intervals of 10 minutes.
· Affected AP Statistics: Displays the proportion of affected APs and the proportion of unaffected APs.
· Affected Client Statistics: Displays the proportion of affected clients and the proportion of unaffected clients.
For a specific issue type:
· Statistics: Displays the numbers of issues, involved APs, involved clients, and online clients. For network access failures and WLAN environment issues, the system collects statistics at intervals of 5 minutes. For the other issues, the system collects statistics at intervals of 10 minutes.
You can use the scroll bar below the chart to adjust the time range displayed in the line chart.
To view detailed information for a specific moment, click the point of time on the X coordinate in the line chart.
· Statistics Analysis: Displays the cause distribution and issue trend by cause. This tab is available only for some issue types.
· Involved APs: Displays information about APs affected by the issues, including AP name, AC, issue occurrences, and involved client quantity. This tab is available only for some issue types.
To view detailed information about an AP or AC, click the AP or AC name.
To view raw data about an AP and the issue type, click the issue occurrences.
· Involved Clients: Displays information about clients affected by the issues, including client MAC address, vendor, IP address, issue occurrences, and the most recent occurrence time. This tab is available only for some issue types.
To view raw data about a client and the issue type, click the issue occurrences.
· Raw Data: Displays detailed information about issues of the type, including the occurrence time and client, AP, AC, and radio information.
The items displayed vary by issue type.
To view detailed information about an AP or AC, click the AP or AC name.
· Impact: Displays issue influence by occurrence or client. Each rectangle represents a specific issue and has the numbers of occurrences for the top N involved items (device, client, or vendor) displayed on it. A larger rectangle represents a greater impact.
View alarm information
Restrictions and guidelines
Issue statistics displayed on the page are collected from the specified device during the selected time range, unless otherwise stated.
Procedure
1. Access the Smart O&M menu.
2. To access the Alarms page, use the following methods:
¡ On the Dashboard page, click Total or Active in the Issue Distribution area.
¡ From the left navigation pane, select Issues > Alarms.
You are placed on the Alarm List tab.
3. Select a site from the top of the page.
Parameters
· Alarm Trend: Displays the alarm quantity trend.
· Alarm Severity: Displays the numbers of generated alarms and cleared alarms by severity level. The severity levels include critical, major, minor, info, and tip.
· Alarm Type Top 5: Displays the top 5 alarm types that have the most alarms.
· Alarm Info: Allows you to filter and export alarms.
¡ To filter alarms, click Filter, specify the target alarm severity, state, type, site, and device, and then click Search.
¡ To clear the filtering criteria, click Reset.
¡ To export the displayed alarms, click Export. The alarms will be saved as an electronic form in compressed format.
¡ To mark alarms as read in bulk, select the alarms, and then click Mark As Read.
¡ To mark all alarms as read, click Mark All As Read.
Subscribe to alarms
Perform this task to send alarms to network administrators through WeChat messages, emails, or short messages.
Restrictions and guidelines
By default, the system can send up to 50 alarm emails to recipients in a site or up to 1000 alarm emails to recipients in all sites every day. The actual upper limit might be higher if the service provider settings change.
Procedure
1. Access the Smart O&M menu.
2. To access the Alarms page, use the following methods:
¡ On the Dashboard page, click Total or Active in the Issue Distribution area.
¡ From the left navigation pane, select Issues > Alarms.
3. Select a site from the top of the page.
4. Click the Subscription tab.
5. To add an alarm policy, click Add, and then specify the parameters as needed.
You can create a maximum of 9 alarm policies (excluding the default policy).
6. To edit an alarm policy, click the Edit icon ![]() for the policy, and then edit the
parameters as needed.
for the policy, and then edit the
parameters as needed.
7. To delete an alarm policy, click the Delete icon ![]() for the policy.
for the policy.
Parameters
· Maintenance: Allow the system to generate but not push alarms or disable the system from generating alarms during the specified time period.
· Alarm Info: Select alarms to notify and specify the alarm severity levels.
View client statistics
View client health information
Restrictions and guidelines
The displayed time interval varies by the specified time span.
Procedure
1. Access the Smart O&M menu.
2. To access the Client Health page, use the following methods:
¡ From the left navigation pane, select Clients > Wireless > Health.
¡ From the left navigation pane, select Dashboard, and then click Client Health in the Health Scores area.
3. Select a site and a device from the top of the page.
4. To view detailed information about clients associated with 5 GHz, 2.4 GHz or all radios, click the bar for a specific moment in the Client Health graph.
The Client Performance Details area displays detailed information about the clients. To display more columns, click the + / - icon, and then select the target columns.
5. To save the data about clients associated with 5 GHz, 2.4 GHz or all radios, click Export in the Client Performance Details area. The data will be saved as an electronic form in compressed format.
6. To view health statistics about clients associated with 5 GHz, 2.4 GHz, or all radios, click 5 GHz, 2.4 GHz, or All, respectively in the Client Health graph.
7. To view detailed information about a client, click the MAC address link of the client in the Client Performance Details area.
8. To view detailed information about the AP associated with a client, click the associated AP link in the Client Performance Details area.
9. To view detailed information about the AC associated with a client, click the associated AC link in the Client Performance Details area.
Parameters
· Excellent: The client has a score of 80 or higher.
· Good: The client has a score in the range of 65 (included) to 80.
· Average: The client has a score smaller than 65.
View client health information in common mode
Restrictions and guidelines
· The system collects client connection statistics at intervals of 5 minutes.
· The displayed time interval varies by the specified time span.
· For ACs, only ACs of version 5420 or higher supports deep analysis. Before using deep analysis on the Cloudnet, execute the wlan client inspect enable command in AP view or AP group view from the CLI of the device.
Procedure
1. Access the Smart O&M menu.
2. To access the Client Health page, use the following methods:
¡ From the left navigation pane, select Clients > Wireless > Health.
¡ From the left navigation pane, select Dashboard, and then click Client Health in the Health Scores area.
3. Select a site and a device from the top of the page.
4. Click the MAC address link of a client in the Client Performance Details area. You are placed on the Client Info tab.
5. To view detailed information about the AP or AC associated with the client, click the AP or AC name in the Connection Info area.
Parameters
· Statistics: Displays client uplink rate, downlink rate, and average signal strength.
· Basic Client Info: Displays MAC, IP, IPv6, vendor, client mode, and username about the client.
· Connection Info: Displays the client online status, access service, associated AP, and associated AC. To view detailed information about an AP or AC, click the AP or AC name.
· Score Trend: Displays the client score for a specific moment when you hover over the trend graph and displays troubleshooting suggestions when you hover over a low score.
· Client Logs: Displays client online, offline, and roaming events and client operation exceptions.
¡ Rate Level: Displays packet transmission information between AP and client by rate level range when you click Rate Level, which is available for an offline event or online event of an online client.
¡ Deep Analysis: Displays the packet exchange process when you click Deep Analysis, which is available for an online event, online failure event, and DHCP lease extension event.
¡ Packet Failure Percentage: Number of packets that have failed to be sent at a certain rate level to the total number of packets sent at that rate level.
View client health information in expert mode
Restrictions and guidelines
The displayed time interval varies by the specified time span.
Procedure
1. Access the Smart O&M menu.
2. To access the Client Health page, use the following methods:
¡ From the left navigation pane, select Clients > Wireless > Health.
¡ From the left navigation pane, select Dashboard, and then click Client Health in the Health Scores area.
3. Select a site and a device from the top of the page.
4. Click the MAC address link of a client in the Client Performance Details area, and then click the Expert Mode tab.
Parameters
· Basic Client Info: Displays MAC, IP, IPv6, vendor, client mode, and protocol type about the client.
· Health Report: Displays metrics and their current values and reference values.
¡ The current value is the average value of each metric in the previous statistics collection period.
¡ If the
current value exceeds the reference value, a red icon ![]() appears after the reference value.
appears after the reference value.
¡ If the client is offline, the current value displays the client information before it goes offline.
· Client Connection Info: Displays signal strength, uplink and downlink traffic, uplink and downlink rate, retransmission rates, packet loss rate, latency, channel usage, and radio load.
To view detailed information, click the trend graph for a specific metric.
· Neighbor Client: Displays the number of clients (including the client itself) that come online on the same radio as a client during each time period. To view detailed information about the clients, click the bar for a specific moment in the graph.
· Client Logs: Displays client online, offline, and roaming events and client operation exceptions. To edit columns to display, click the + / - icon.
¡ Rate Level: Displays packet transmission information between AP and client by rate level range when you click Detail in the Rate Level column, which is available for an offline or online event of an online client.
¡ Deep Analysis: Displays the packet exchange process when you click Detail in the Deep Analysis column, which is available for an online event and online failure event.
¡ DHCP Lease Extend: Displays the packet exchange process when you click Detail in the DHCP Lease Extend column, which is available for a DHCP lease extension event.
¡ Packet Failure Percentage: Number of packets that have failed to be sent at a certain rate level to the total number of packets sent at that rate level.
View authentication analysis results
Procedure
1. Access the Smart O&M menu.
2. From the left navigation pane, select Clients > Wireless > Access Analysis.
You are placed on the Authentication tab.
3. Select a site and a device from the top of the page.
Parameters
· Access Success Rate Trend: Displays distribution of clients by access success rate in the specified time range. The system collects client statistics at intervals of 5 minutes. The displayed time interval varies by the specified time span.
· By Avg Durations: Displays distribution of clients by average association and authentication durations every hour, every day, or every week. If you click Week at the upper right of the graph, the graph displays statistics in the last week.
The association and authentication duration of clients that fail to access the network will not be counted.
· By Avg Authentication Durations: Displays distribution of clients by average 802.1X and MAC authentication durations every hour, every day, or every week. If you click Week at the upper right of the graph, the graph displays statistics in the last week.
The authentication duration of clients that fail the authentication will not be counted.
View association and disassociation analysis results
Restrictions and guidelines
The system collects the statistics every hour.
Procedure
1. Access the Smart O&M menu.
2. From the left navigation pane, select Clients > Wireless > Access Analysis.
3. Click the Association and Disassociation tab.
4. Select a site and a device from the top of the page.
5. To save the data, click Export in the target area. The data will be saved as an electronic form in compressed format.
Parameters
· By Abnormal Accesses: Displays the abnormal client access trend. The system collects statistics every hour. Only reasons about clients with the top 10 abnormalities are displayed.
· By Disassociations: Displays the client disassociation trend. The system collects statistics every hour. Only reasons about clients with the top 10 disassociations are displayed.
· Abnormal Clients Top 100: Displays statistics about clients with access exceptions at a specific time when you click the bar for that time in the By Abnormal Accesses graph.
· APs with Most Abnormal Clients Top 100: Displays statistics about APs with which clients with access exceptions were associated at a specific time when you click the bar for that time in the By Abnormal Accesses graph.
· Disassociated Clients Top 100: Displays top 100 disassociated clients at a specific time when you click the bar for that time in the By Disassociations graph.
· APs with Most Disassociated Clients Top 100: Displays top APs with the most disassociated clients at a specific time when you click the bar for that time in the By Disassociations graph.
View IP monitoring results
Restrictions and guidelines
· IPv4 address monitoring is enabled by default. You can execute the undo client ipv4-snooping dhcp-learning enable or undo client ipv4-snooping arp-learning enable command in wireless service template view to disable the client from obtaining IPv4 addresses through DHCP or ARP, respectively.
· IPv6 address monitoring is disabled by default. You can execute the client ipv6-snooping dhcpv6-learning enable or client ipv6-snooping nd-learning enable command in wireless service template view to enable the client to obtain IPv6 addresses through DHCPv6 or ND, respectively.
Procedure
1. Access the Smart O&M menu.
2. From the left navigation pane, select Clients > Wireless > Access Analysis.
3. Click the IP Monitoring tab.
4. Select a site and a device from the top of the page.
5. To view detailed information about a client, click the MAC address link in the IPv4 Monitor table.
6. To view detailed information about IPv4
monitoring, click the IPv4 Monitor
Details icon ![]() for the target client in the IPv4 Monitor table.
for the target client in the IPv4 Monitor table.
7. To view detailed information about IPv4
monitoring, click the IPv6 Monitor Details icon ![]() for the target
client in the IPv6 Monitor table.
for the target
client in the IPv6 Monitor table.
8. To save the data, click Export. The data will be saved as an electronic form in compressed format.
Parameters
· IPv4 Monitor: Displays information about clients when they obtain an IPv4 address through DHCP for the first time.
· IPv4 Monitor Details: Displays detailed information about IPv4 monitor for the target client.
· IPv6 Monitor: Displays information about clients when they obtain an IPv6 address through DHCPv6 for the first time.
· IPv6 Monitor Details: Displays detailed information about IPv6 monitor for the target client.
· Online Duration—Time elapsed since a client came online and to the time when the client obtained an IPv4 or IPv6 address for the first time.
· Detection Via—The method used to obtain an IPv4 or IPv6 address for a client when it comes online or it's IP addresses change.
View client statistics
Restrictions and guidelines
The system collects statistics about client quantity and traffic at intervals of 5 minutes.
The displayed time interval varies by the specified time span.
Procedure
1. Access the Smart O&M menu.
2. From the left navigation pane, select Clients > Wireless > Summary.
3. Select a site and a device from the top of the page.
Parameters
· By WLAN Service: Displays distribution of clients by associated wireless services.
· By Vendor: Displays distribution of clients by vendor.
· By Authentication Method: Displays client statistics by authentication method.
· By AP Group: Displays client statistics by AP group.
· Client Association Trend (By AP Group): Displays the top 32 AP groups that have the most associated clients on all devices or the specified device during the selected time range. To save the data, click Export. The data will be saved as an electronic form in compressed format.
· Client Association Trend (By Wireless Service): Displays the top 16 wireless services that have the most associated clients on all devices or the specified device during the selected time range. To save the data, click Export. The data will be saved as an electronic form in compressed format.
· Client Association Trend (By Frequency Band): Displays distribution of 2.4 GHz and 5 GHz clients.
· Client Traffic Trend (By Frequency Band): Displays client statistics by total uplink and downlink traffic.
View network information
View AC information
Restrictions and guidelines
· The displayed time interval varies by the specified time span.
· The system collects statistics about CPU usage and memory usage at intervals of 10 minutes and collect statistics about port traffic at intervals of 5 minutes.
Procedure
1. Access the Smart O&M menu.
2. To access the AC Health page, use the following methods:
¡ From the left navigation pane, select Network > ACs.
¡ From the left navigation pane, select Dashboard, and then click AC Health in the Health Scores area.
3. Select a site from the top of the page.
4. To view detailed AC information, use the following methods:
¡ Click the name of an AC in the AC List area.
¡ From the left navigation pane, select Network > APs > Health, and then click an AC name in the AP Radio Details area.
¡ From the left navigation pane, select Network > APs > AP Statistics, click the AP Disassociations tab, and then click an associated AC name in the AP Disassociation Details list.
Parameters
AC Health
· AC statistics: Displays the number of online ACs, total ACs, and AC distribution by model.
· AC List: Displays information about all ACs in the current site. To display more columns, click the + / - icon, and then select the target columns.
¡ Uplink Rate (LAN)—Rate of packets received from all LAN ports.
¡ Downlink Rate (LAN)—Rate of packets sent from all LAN ports.
¡ Uplink Rate (WAN)—Rate of packets received from all WAN ports.
¡ Downlink Rate (WAN)—Rate of packets sent from all WAN ports.
To edit the name of an AC, click the Edit icon ![]() for the AC.
for the AC.
· AC CPU Usage Top 5: Displays the top 5 ACs with the highest CPU usage at the time when the last statistics collection was performed. The system collects AC CPU usage statistics at intervals of 10 minutes.
· AC Memory Usage Top 5: Displays the top 5 ACs with the highest memory usage at the time when the last statistics collection was performed. The system collects AC memory usage statistics at intervals of 10 minutes.
AC Details
· Basic AC Info: Displays AC name, MAC, SN, model, software version, and last reboot reason.
For ACs in an IRF fabric, multiple values are displayed in MAC, SN, and Last Reboot Reason fields.
· AC Capabilities: Displays the maximum number of APs, maximum number of clients, and license information.
· AC Score: Displays the AC score. The system also displays the reasons if the AC score is low.
· CPU Usage: Displays the CPU usage trend of the AC.
· Memory Usage: Displays the memory usage trend of the AC.
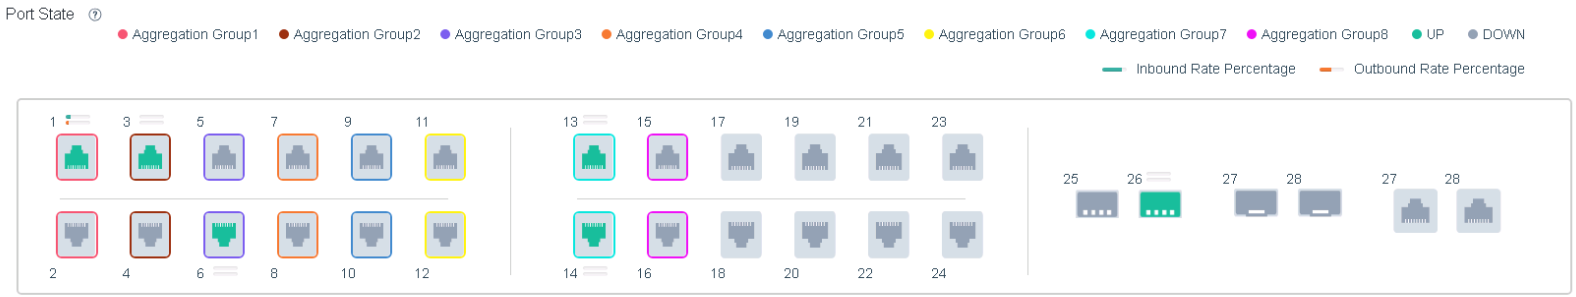
· Port State: Displays port states. To view traffic information for a port. Click the port on the device panel. Ports of the same border color belong to the same aggregation group.
The Port Traffic section displays traffic information for all ports if no port is specified.
¡ Outbound Rate—Actual transmission rate to the negotiated rate on the port.
¡ Inbound Rate—Actual receiving rate to the negotiated rate on the port.
View AP health information
Restrictions and guidelines
· The displayed time interval varies by the specified time span.
· The system collects statistics about client traffic at intervals of 5 minutes.
Procedure
1. Access the Smart O&M menu.
2. To access the AP Health page, use the following methods:
¡ From the left navigation pane, select Network > APs > Health.
¡ From the left navigation pane, select Dashboard, and then click AP Health in the Health Scores area.
3. Select a site and a device from the top of the page.
4. To view health information for all AP radios in the site, click the bar for a specific moment in the AP Health graph.
5. To save the data in the AP Radio Details area, click Export. The data will be saved as an electronic form in compressed format.
6. To view detailed AP information, use the following methods:
¡ Click the name of an AP in the AP Radio Details list.
¡ From the left navigation pane, select Network > APs > AP Statistics, and then click an AP name in the Online AP list.
¡ From the left navigation pane, select Network > APs > AP Statistics, click the AP Disassociations tab, and then click an AP name in the AP Disassociation Details list.
7. To view detailed information about the AC associated with an AP, click the AC name in an AP list.
Parameters
AP Health
· AP Health: Displays AP health scores. Excellent: ≥ 80. Good: 65 (included) to 80. Average: ≤ 65.
· AP Radio Details: Displays detailed health information for all APs in the site. To display more columns, click the + / - icon, and then select the target columns.
AP Details
· Basic AP Info: Displays AP name, MAC, model, associated AC, associated radios, uptime, association, and last reboot reason.
· AP Score Trend: Displays the AP score for each statistics collection period in the specified time range.
· Radio Info: Displays real-time and history radio usage in the specified time range. To view the details, click the trend graph.
· Online Client Info: Displays the quantity of online clients in each statistics collection period in the specified time range. To view information about online clients for a moment, click the corresponding bar in the graph. The list that opens displays client MAC address, IPv4 address, IPv6 address, username, authentication method, score, experience, associated AP, associated radio, associated AC, and SSID.
¡ To customize the columns to display, click the + / - icon.
¡ To view detailed information about a client, click the client's MAC address.
¡ To view detailed information about an AC, click the AC name.
· Client Traffic: Displays the uplink and downlink traffic of clients for each statistics collection period in the specified time range.
· CPU Usage Trend/Memory Usage Trend: Displays the CPU usage and memory usage for each statistics collection period in the specified time range.
· AP Logs: Displays AP events and causes, including AP online and offline events.
View channel analysis
Restrictions and guidelines
The system collects statistics about 5 GHz and 2.4 GHz channels at intervals of 5 minutes.
Procedure
1. Access the Smart O&M menu.
2. From the left navigation pane, select Network > APs > Channel Analysis.
3. Select a site and a device from the top of the page.
4. To adjust the number of data entries in the 5 GHz Channels or 2.4 GHz Channels area, hover over the list and then rotate your mouse wheel.
5. To view the channel usage details, click the data for a specific channel at a specific moment in the 5 GHz Channels or 2.4 GHz Channels area. The Channel Usage Details area displays the channel usage details at that moment.
View AP statistics
Procedure
1. Access the Smart O&M menu.
2. From the left navigation pane, select Network > APs > AP Statistics.
You are placed on the APs tab.
3. Select a site and a device from the top of the page.
4. To view AP disassociation information, click the AP Disassociations tab.
5. To view AP association failure information, click the AP Association Failures tab.
Parameters
APs
· AP Info: Displays information about online, offline, invalid, or all APs. An AP is invalid if the system cannot obtain the AP's serial number.
¡ For online APs, this graph displays AP statistics by AP model and client quantity.
¡ For offline APs, this graph displays AP statistics by AP model and disassociation reason.
¡ For all APs, this graph displays AP statistics by AP model and client quantity. Invalid APs are not included.
· Online/Offline/All AP List:
¡ The Online AP List displays the AP name, online client quantity, associated AC, radio quantity, and uptime information.
¡ The Offline AP List displays the AP name, associated AC, radio quantity, disassociation reason, and disassociation time information.
¡ The All AP List displays the AP name, current state, online client quantity, associated AC, radio quantity, and uptime information.
To adjust the columns to display, click the + / - icon.
To save the data, click Export. The data will be saved as an electronic form in compressed format.
AP Disassociations
· By Disassociation Reason: Displays AP statistics by disassociation reason in the last seven days.
· By Disassociation Quantity: Displays AP statistics by disassociation quantity in the last seven days.
· AP Disassociation Details: Displays detailed AP disassociation information when you click the bar for a day in the By Disassociation Reason or By Disassociation Quantity graph.
To view detailed information about an AP or AC, click the AP or AC name in the list.
To save the data, click Export. The data will be saved as an electronic form in compressed format.
AP Association Failures
· By Association Failure Reason: Displays AP statistics by association failure reason in the last seven days.
· By Association Failure Quantity: Displays AP statistics by association failure quantity in the last seven days.
· AP Association Failure Details: Displays detailed AP association failure information when you click the bar for a day in the By Association Failure Reason or By Association Failure Quantity graph.
To view detailed information about an AP or AC, click the AP or AC name in the list.
To save the data, click Export. The data will be saved as an electronic form in compressed format.
Manage network optimization
Perform one-key optimization
One-key optimization allows you to optimize commonly used AP parameters in bulk for APs to operate in optimal state.
Restrictions and guidelines
For ACs, only ACs of version 5428 or higher support one-key optimization.
Perform one-key optimization
1. Access the Smart O&M menu.
2. From the left navigation pane, select Optimization > One-Key Optimize.
You are placed on the Optimization Settings tab.
3. Select a site and a device from the top of the page.
4. Add or edit a space.
¡ To add a space, click Click to Add Space and configure the space parameters as needed.
¡ To
edit a space, click the Edit icon ![]() at the upper right corner of the space
tile.
at the upper right corner of the space
tile.
5. Click the Optimization Progress tab.
6. Click Optimize for the target space.
After the optimization finishes, the page displays information about the optimization, including optimized AP quantity, start time, duration, and comparison of the original parameters and new parameters.
If the optimization fails, the page displays reasons for the failure.
Delete a space
1. Access the Smart O&M menu.
2. From the left navigation pane, select Optimization > One-Key Optimize.
3. Select a site and a device from the top of the page.
4. Click the Optimization History tab.
5. Click the Delete icon ![]() at the
upper right corner of the space tile.
at the
upper right corner of the space tile.
View optimization records
1. Access the Smart O&M menu.
2. From the left navigation pane, select Optimization > One-Key Optimize.
3. Select a site and a device from the top of the page.
4. Click the Optimization History tab.
The history list is empty if the system has not performed any optimization operations.
5. To view detailed information about an optimization, click View Details for the optimization record.
Parameters
· Scenario Type: Specify the scenario type. The system provides different optimization policies for different scenarios.
· Range: Specify the APs to optimize by room, AP group, or AP model.
· Items to Adjust: Select the items to adjust. Options include channel, bandwidth, and transmit power.
Perform one-key diagnosis
One-key diagnosis performs a thorough health check of all ACs in the site to discover potential issues. The system also provides suggestions against discovered issues.
Prerequisites
Before performing one-key diagnosis in a site, enable smart O&M for the site.
Restrictions and guidelines
Cloud-managed APs do not support one-key diagnosis.
For ACs, only ACs of version 5412 or higher support one-key diagnosis.
Perform one-key diagnosis
1. Access the Smart O&M menu.
2. From the left navigation pane, select Optimization > One-Key Diagnosis.
3. Select a site and a device from the top of the page.
4. Click View Check Items and select items to check as needed and then click OK.
The required items cannot be cleared.
5. Click Diagnose.
After the diagnosis finishes, the page displays the numbers of passed items, failed items, optimizable items, undiagnosable items, and skipped items. To view detailed items of a type, click the item quantity. To view all items, click the total item quantity.
For a site with multiple ACs, an item is marked failed if one AC fails to pass the item check. For an AC associated with multiple APs, the device is marked failed for an item check if one AP fails to pass the item check.
6. Optimize the network as needed.
¡ For failed items and optimizable items, click Expand Repair Suggestions to view the optimization suggestions. To manually configure the devices, click CLI Helper in the list. To troubleshoot the potential issues, click the details to access the Alarms page.
¡ For undiagnosable items, verify that the corresponding devices are connected to the network correctly. An undiagnosable item indicates that the system failed to obtain the required data.
View optimization records
1. Access the Smart O&M menu.
2. From the left navigation pane, select Optimization > One-Key Diagnosis.
3. Select a site and a device from the top of the page.
4. Click History Diagnosis Info.
5. To view information about a diagnosis, click its diagnosis result.
The system can save a maximum of 16 diagnosis records and save a record for a maximum of 6 days. If the maximum record limit is reached, the system deletes the oldest record before adding a new record.
View VIP device information
Cloud-managed APs do not support viewing VIP device information.
View VIP AP statistics
Perform this task to view VIP AP health or detailed information.
Prerequisites
Execute the ap-name ap-name command in monitor group view from the CLI of the device to add a VIP AP to the monitor group. The AP will report information about the associated clients and its running information to the AC, which will report the information to the Cloudnet.
Restrictions and guidelines
Only the software version of 5420 or higher supports this feature.
The system collects statistics at intervals of 2 minutes.
Procedure
1. Access the Smart O&M menu.
2. From the left navigation pane, select VIP > VIP APs.
3. Select a site and a device from the top of the page.
4. To view health information for all APs in the site, click the bar for a specific moment in the By AP Health graph.
5. To view detailed AP information, click the name of an AP in the Online VIP AP List area.
6. To view detailed information about the AC associated with a VIP AP, click the AC name in the Online VIP AP List area.
Parameters
See "Parameters."
View VIP client statistics
Perform this task to view VIP client health information, quantity, or details.
Prerequisites
Execute the client-mac mac-address command to add a client to the VIP client group. The AP associated with the client will report information about the VIP client to the AC, which will report the information to the Cloudnet.
Restrictions and guidelines
Only the software version of 5420 or higher supports the VIP client monitor function.
The system collects statistics about VIP clients at intervals of 2 minutes.
Procedure
1. Access the Smart O&M menu.
2. From the left navigation pane, select VIP > VIP Clients.
3. Select a site and a device from the top of the page.
4. To view detailed information about VIP clients associated with 5 GHz, 2.4 GHz or all radios, click the bar for a specific moment in the By Client Health graph.
The VIP Client List area displays detailed information about the VIP clients. To customize the columns to display, click the + / - icon, and then select the target columns.
5. To view detailed information about a VIP client, click the MAC address link of the client in the VIP Client List area.
6. To view detailed information about the AP associated with a VIP client, click the associated AP link in the VIP Client List area.
7. To view detailed information about the AC associated with a VIP client, click the associated AC link in the VIP Client List area.
8. To customize the columns to display, click the + / - icon.
Parameters
See "Parameters."
View VIP client health information in common mode
Restrictions and guidelines
· The system collects statistics at intervals of 5 minutes.
· Only the software version of 5420 or higher supports this feature.
Procedure
1. Access the Smart O&M menu.
2. From the left navigation pane, select VIP > VIP Clients.
3. Select a site and a device from the top of the page.
4. Click the MAC address link of a VIP client in the VIP Client List area. You are placed on the Client Info tab.
5. To view detailed information about the AP or AC associated with the client, click the AP or AC name in the Connection Info area.
Parameters
See "Parameters."
View VIP client health information in expert mode
Procedure
1. Access the Smart O&M menu.
2. From the left navigation pane, select VIP > VIP Clients.
3. Select a site and a device from the top of the page.
4. Click the MAC address link of a VIP client in the VIP Client List area, and then click the Expert Mode tab.
Parameters
See "Parameters."
