- Table of Contents
-
- 11-Network Management and Monitoring Configuration Guide
- 00-Preface
- 01-System maintenance and debugging configuration
- 02-NTP configuration
- 03-PTP configuration
- 04-Information center configuration
- 05-SNMP configuration
- 06-RMON configuration
- 07-NQA configuration
- 08-Mirroring configuration
- 09-sFlow configuration
- 10-Process monitoring and maintenance configuration
- 11-EAA configuration
- 12-CWMP configuration
- 13-NETCONF configuration
- 14-Packet capture configuration
- Related Documents
-
| Title | Size | Download |
|---|---|---|
| 06-RMON configuration | 98.09 KB |
Sample types for the alarm group and the private alarm group
Configuring the RMON statistics function
Creating an RMON Ethernet statistics entry
Creating an RMON history control entry
Configuring the RMON alarm function
Displaying and maintaining RMON settings
Ethernet statistics group configuration example
History group configuration example
Alarm function configuration example
Configuring RMON
Overview
Remote Network Monitoring (RMON) is an enhancement to SNMP. It enables proactive remote monitoring and management of network devices and subnets. An RMON monitor periodically or continuously collects traffic statistics for the network attached to a port on the managed device. The managed device can automatically send a notification when a statistic crosses an alarm threshold, so the NMS does not need to constantly poll MIB variables and compare the results.
RMON uses SNMP notifications to notify NMSs of various alarm conditions such as broadcast traffic threshold exceeded. In contrast, SNMP reports function and interface operating status changes such as link up, link down, and module failure. For more information about SNMP notifications, see "Configuring SNMP."
H3C devices provide an embedded RMON agent as the RMON monitor. An NMS can perform basic SNMP operations to access the RMON MIB.
RMON groups
Among standard RMON groups, H3C implements the statistics group, history group, event group, alarm group, probe configuration group, and user history group. H3C also implements a private alarm group, which enhances the standard alarm group. The probe configuration group and user history group are not configurable from the CLI. To configure these two groups, you must access the MIB.
Statistics group
The statistics group samples traffic statistics for monitored Ethernet interfaces and stores the statistics in the Ethernet statistics table (ethernetStatsTable). The statistics include:
· Number of collisions.
· CRC alignment errors.
· Number of undersize or oversize packets.
· Number of broadcasts.
· Number of multicasts.
· Number of bytes received.
· Number of packets received.
The statistics in the Ethernet statistics table are cumulative sums.
History group
The history group periodically samples traffic statistics on interfaces and saves the history samples in the history table (etherHistoryTable). The statistics include:
· Bandwidth utilization.
· Number of error packets.
· Total number of packets.
The history table stores traffic statistics collected for each sampling interval.
Event group
The event group controls the generation and notifications of events triggered by the alarms defined in the alarm group and the private alarm group. The following are RMON alarm event handling methods:
· Log—Logs event information (including event time and description) in the event log table so the management device can get the logs through SNMP.
· Trap—Sends an SNMP notification when the event occurs.
· Log-Trap—Logs event information in the event log table and sends an SNMP notification when the event occurs.
· None—Takes no actions.
Alarm group
The RMON alarm group monitors alarm variables, such as the count of incoming packets (etherStatsPkts) on an interface. After you create an alarm entry, the RMON agent samples the value of the monitored alarm variable regularly. If the value of the monitored variable is greater than or equal to the rising threshold, a rising alarm event is triggered. If the value of the monitored variable is smaller than or equal to the falling threshold, a falling alarm event is triggered. The event group defines the action to take on the alarm event.
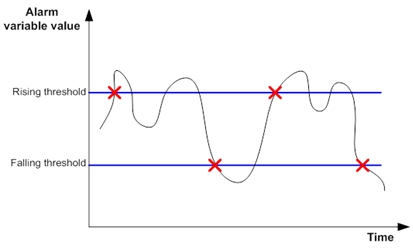
If an alarm entry crosses a threshold multiple times in succession, the RMON agent generates an alarm event only for the first crossing. For example, if the value of a sampled alarm variable crosses the rising threshold multiple times before it crosses the falling threshold, only the first crossing triggers a rising alarm event, as shown in Figure 1.
Figure 1 Rising and falling alarm events
Private alarm group
The private alarm group enables you to perform basic math operations on multiple variables, and compare the calculation result with the rising and falling thresholds.
The RMON agent samples variables and takes an alarm action based on a private alarm entry as follows:
1. Samples the private alarm variables in the user-defined formula.
2. Processes the sampled values with the formula.
3. Compares the calculation result with the predefined thresholds, and then takes one of the following actions:
¡ Triggers the event associated with the rising alarm event if the result is equal to or greater than the rising threshold.
¡ Triggers the event associated with the falling alarm event if the result is equal to or less than the falling threshold.
If a private alarm entry crosses a threshold multiple times in succession, the RMON agent generates an alarm event only for the first crossing. For example, if the value of a sampled alarm variable crosses the rising threshold multiple times before it crosses the falling threshold, only the first crossing triggers a rising alarm event.
Sample types for the alarm group and the private alarm group
The RMON agent supports the following sample types:
· absolute—RMON compares the value of the monitored variable with the rising and falling thresholds at the end of the sampling interval.
· delta—RMON subtracts the value of the monitored variable at the previous sample from the current value, and then compares the difference with the rising and falling thresholds.
Protocols and standards
· RFC 4502, Remote Network Monitoring Management Information Base Version 2
· RFC 2819, Remote Network Monitoring Management Information Base Status of this Memo
Configuring the RMON statistics function
RMON implements the statistics function through the Ethernet statistics group and the history group. The statistics function is available only for Layer 2 Ethernet interfaces.
The Ethernet statistics group provides the cumulative statistic for a variable from the time the statistics entry is created to the current time. For more information about the configuration, see "Creating an RMON Ethernet statistics entry."
The history group provides statistics that are sampled for a variable for each sampling interval. The history group uses the history control table to control sampling, and it stores samples in the history table. For more information about the configuration, see "Creating an RMON history control entry."
Creating an RMON Ethernet statistics entry
|
Command |
Remarks |
|
|
1. Enter system view. |
system-view |
N/A |
|
2. Enter Ethernet interface view. |
interface interface-type interface-number |
N/A |
|
3. Create an RMON Ethernet statistics entry. |
rmon statistics entry-number [ owner text ] |
By default, no RMON Ethernet statistics entry exists. You can create only one RMON statistics entry for an Ethernet interface. You can create a maximum of 200 RMON statistics entries on a device. When the limit is reached, you cannot add new entries. |
Creating an RMON history control entry
You can configure multiple history control entries for one interface, but you must make sure their entry numbers and sampling intervals are different.
You can create a history control entry successfully even if the specified bucket size exceeds the available history table size. RMON will set the bucket size as closely to the expected bucket size as possible.
To create an RMON history control entry:
|
Step |
Command |
Remarks |
|
1. Enter system view. |
system-view |
N/A |
|
2. Enter Ethernet interface view. |
interface interface-type interface-number |
N/A |
|
3. Create an RMON history control entry |
rmon history entry-number buckets number interval sampling-interval [ owner text ] |
By default, no RMON history control entries exist. You can create multiple RMON history control entries for an Ethernet interface. You can create a maximum of 200 RMON history control entries on a device. When the limit is reached, you cannot add new entries. |
Configuring the RMON alarm function
When you configure the RMON alarm function, follow these guidelines:
· To send notifications to the NMS when an alarm is triggered, configure the SNMP agent as described in "Configuring SNMP" before configuring the RMON alarm function.
· For a new event, alarm, or private alarm entry to be created:
¡ The entry must not have the same set of parameters as an existing entry.
¡ The maximum number of entries is not reached.
Table 1 shows the parameters to be compared for duplication and the entry limits.
Table 1 RMON configuration restrictions
|
Entry |
Parameters to be compared |
Maximum number of entries |
|
Event |
· Event description (description string) · Event type (log, trap, logtrap, or none) · Community name (security-string) |
60 |
|
Alarm |
· Alarm variable (alarm-variable) · Sampling interval (sampling-interval) · Sample type (absolute or delta) · Rising threshold (threshold-value1) · Falling threshold (threshold-value2) |
60 |
|
Private alarm |
· Alarm variable formula (prialarm-formula) · Sampling interval (sampling-interval) · Sample type (absolute or delta) · Rising threshold (threshold-value1) · Falling threshold (threshold-value2) |
50 |
To configure the RMON alarm function:
|
Step |
Command |
Remarks |
|
1. Enter system view. |
system-view |
N/A |
|
2. (Optional.) Create an event entry in the event table. |
rmon event entry-number [ description string ] { log | log-trap security-string | none | trap security-string } [ owner text ] |
By default, the RMON event table does not contain entries. |
|
3. Create an entry in the alarm table or private alarm table. |
·
Create an entry in the alarm table: ·
Create an entry in the private alarm
table: |
By default, the RMON alarm table and the private alarm table do not contain entries. You can associate an alarm with an event that has not been created yet, but the alarm will trigger the event only after the event is created. |
Displaying and maintaining RMON settings
Execute display commands in any view.
|
Task |
Command |
|
Display RMON statistics. |
display rmon statistics [ interface-type interface-number] |
|
Display RMON history control entries and history samples. |
display rmon history [ interface-type interface-number ] |
|
Display RMON alarm entries. |
display rmon alarm [ entry-number ] |
|
Display RMON private alarm entries. |
display rmon prialarm [ entry-number ] |
|
Display RMON event entries. |
display rmon event [ entry-number ] |
|
Display log information for event entries. |
display rmon eventlog [ entry-number ] |
RMON configuration examples
Ethernet statistics group configuration example
Network requirements
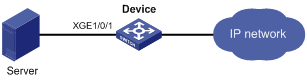
As shown in Figure 2, create an RMON Ethernet statistics entry on the device to gather cumulative traffic statistics for Ten-GigabitEthernet 1/0/1.
Configuration procedure
# Create an RMON Ethernet statistics entry for Ten-GigabitEthernet 1/0/1.
<Sysname> system-view
[Sysname] interface ten-gigabitethernet 1/0/1
[Sysname-Ten-GigabitEthernet1/0/1] rmon statistics 1 owner user1
# Display statistics collected by the RMON agent for Ten-GigabitEthernet 1/0/1.
<Sysname> display rmon statistics ten-gigabitethernet 1/0/1
EtherStatsEntry 1 owned by user1 is VALID.
Interface : Ten-GigabitEthernet1/0/1<ifIndex.3>
etherStatsOctets : 21657 , etherStatsPkts : 307
etherStatsBroadcastPkts : 56 , etherStatsMulticastPkts : 34
etherStatsUndersizePkts : 0 , etherStatsOversizePkts : 0
etherStatsFragments : 0 , etherStatsJabbers : 0
etherStatsCRCAlignErrors : 0 , etherStatsCollisions : 0
etherStatsDropEvents (insufficient resources): 0
Incoming packets by size:
64 : 235 , 65-127 : 67 , 128-255 : 4
256-511: 1 , 512-1023: 0 , 1024-1518: 0
# Get the traffic statistics from the NMS through SNMP. (Details not shown.)
History group configuration example
Network requirements
As shown in Figure 3, create an RMON history control entry on the device to sample traffic statistics for Ten-GigabitEthernet 1/0/1 every minute.
Configuration procedure
# Create an RMON history control entry to sample traffic statistics every minute for Ten-GigabitEthernet 1/0/1. Retain up to eight samples for the interface in the history statistics table.
<Sysname> system-view
[Sysname] interface ten-gigabitethernet 1/0/1
[Sysname-Ten-GigabitEthernet1/0/1] rmon history 1 buckets 8 interval 60 owner user1
# Display the history statistics collected for Ten-GigabitEthernet 1/0/1.
[Sysname-Ten-GigabitEthernet1/0/1] display rmon history
HistoryControlEntry 1 owned by user1 is VALID
Sampled interface : Ten-GigabitEthernet1/0/1<ifIndex.3>
Sampling interval : 60(sec) with 8 buckets max
Sampling record 1 :
dropevents : 0 , octets : 834
packets : 8 , broadcast packets : 1
multicast packets : 6 , CRC alignment errors : 0
undersize packets : 0 , oversize packets : 0
fragments : 0 , jabbers : 0
collisions : 0 , utilization : 0
Sampling record 2 :
dropevents : 0 , octets : 962
packets : 10 , broadcast packets : 3
multicast packets : 6 , CRC alignment errors : 0
undersize packets : 0 , oversize packets : 0
fragments : 0 , jabbers : 0
collisions : 0 , utilization : 0
Sampling record 3 :
dropevents : 0 , octets : 830
packets : 8 , broadcast packets : 0
multicast packets : 6 , CRC alignment errors : 0
undersize packets : 0 , oversize packets : 0
fragments : 0 , jabbers : 0
collisions : 0 , utilization : 0
Sampling record 4 :
dropevents : 0 , octets : 933
packets : 8 , broadcast packets : 0
multicast packets : 7 , CRC alignment errors : 0
undersize packets : 0 , oversize packets : 0
fragments : 0 , jabbers : 0
collisions : 0 , utilization : 0
Sampling record 5 :
dropevents : 0 , octets : 898
packets : 9 , broadcast packets : 2
multicast packets : 6 , CRC alignment errors : 0
undersize packets : 0 , oversize packets : 0
fragments : 0 , jabbers : 0
collisions : 0 , utilization : 0
Sampling record 6 :
dropevents : 0 , octets : 898
packets : 9 , broadcast packets : 2
multicast packets : 6 , CRC alignment errors : 0
undersize packets : 0 , oversize packets : 0
fragments : 0 , jabbers : 0
collisions : 0 , utilization : 0
Sampling record 7 :
dropevents : 0 , octets : 766
packets : 7 , broadcast packets : 0
multicast packets : 6 , CRC alignment errors : 0
undersize packets : 0 , oversize packets : 0
fragments : 0 , jabbers : 0
collisions : 0 , utilization : 0
Sampling record 8 :
dropevents : 0 , octets : 1154
packets : 13 , broadcast packets : 1
multicast packets : 6 , CRC alignment errors : 0
undersize packets : 0 , oversize packets : 0
fragments : 0 , jabbers : 0
collisions : 0 , utilization : 0
# Get the traffic statistics from the NMS through SNMP. (Details not shown.)
Alarm function configuration example
Network requirements
As shown in Figure 4, configure the device to monitor the incoming traffic statistic on Ten-GigabitEthernet 1/0/1, and send RMON alarms when the following events occur:
· The 5-second delta sample for the traffic statistic crosses the rising threshold (100).
· The 5-second delta sample for the traffic statistic drops below the falling threshold (50).
Configuration procedure
# Configure the SNMP agent (the device) with the same SNMP settings as the NMS at 1.1.1.2. This example uses SNMPv1, read community public, and write community private.
<Sysname> system-view
[Sysname] snmp-agent
[Sysname] snmp-agent community read public
[Sysname] snmp-agent community write private
[Sysname] snmp-agent sys-info version v1
[Sysname] snmp-agent trap enable
[Sysname] snmp-agent trap log
[Sysname] snmp-agent target-host trap address udp-domain 1.1.1.2 params securityname public
# Create an RMON Ethernet statistics entry for Ten-GigabitEthernet 1/0/1.
[Sysname] interface ten-gigabitethernet 1/0/1
[Sysname-Ten-GigabitEthernet1/0/1] rmon statistics 1 owner user1
[Sysname-Ten-GigabitEthernet1/0/1] quit
# Create an RMON event entry and an RMON alarm entry to send SNMP notifications when the delta sample for 1.3.6.1.2.1.16.1.1.1.4.1 exceeds 100 or drops below 50.
[Sysname] rmon event 1 trap public owner user1
[Sysname] rmon alarm 1 1.3.6.1.2.1.16.1.1.1.4.1 5 delta rising-threshold 100 1 falling-threshold 50 1 owner user1
|
|
NOTE: 1.3.6.1.2.1.16.1.1.1.4.1 is the object instance for Ten-GigabitEthernet 1/0/1, where 1.3.6.1.2.1.16.1.1.1.4 represents the object for total incoming traffic statistics, and 1 is the RMON Ethernet statistics entry index for Ten-GigabitEthernet 1/0/1. |
# Display the RMON alarm entry.
<Sysname> display rmon alarm 1
AlarmEntry 1 owned by user1 is VALID.
Sample type : delta
Sampled variable : 1.3.6.1.2.1.16.1.1.1.4.1<etherStatsOctets.1>
Sampling interval (in seconds) : 5
Rising threshold : 100(associated with event 1)
Falling threshold : 50(associated with event 1)
Alarm sent upon entry startup : risingOrFallingAlarm
Latest value : 0
# Display statistics for Ten-GigabitEthernet 1/0/1.
<Sysname> display rmon statistics ten-gigabitethernet 1/0/1
EtherStatsEntry 1 owned by user1 is VALID.
Interface : Ten-GigabitEthernet1/0/1<ifIndex.3>
etherStatsOctets : 57329 , etherStatsPkts : 455
etherStatsBroadcastPkts : 53 , etherStatsMulticastPkts : 353
etherStatsUndersizePkts : 0 , etherStatsOversizePkts : 0
etherStatsFragments : 0 , etherStatsJabbers : 0
etherStatsCRCAlignErrors : 0 , etherStatsCollisions : 0
etherStatsDropEvents (insufficient resources): 0
Incoming packets by size :
64 : 7 , 65-127 : 413 , 128-255 : 35
256-511: 0 , 512-1023: 0 , 1024-1518: 0
# Query alarm events on the NMS. (Details not shown.)
On the device, alarm event messages are displayed when events occur.