- Table of Contents
- Related Documents
-
| Title | Size | Download |
|---|---|---|
| 06-System Maintenance and Debugging Configuration | 146.26 KB |
1 System Maintenance and Debugging
System Maintenance and Debugging
Introduction to System Debugging
Ping and Tracert Configuration Example
l Support of the H3C WA series WLAN access points (APs) for features may vary by AP model. For more information, see Feature Matrix.
l The interface types and the number of interfaces vary by AP model.
l The term AP in this document refers to common APs, wireless bridges, and mesh APs.
l The models listed in this document are not applicable to all regions. Please consult your local sales office for the models applicable to your region.
This chapter includes these sections:
l System Maintenance and Debugging
l Ping
l Tracert
l Ping and Tracert Configuration Example
System Maintenance and Debugging
You can use the ping command and the tracert command to verify the current network connectivity, and use the debug command to enable debugging and thus to diagnose system faults based on the debugging information.
Ping
Introduction
You can use the ping command to verify whether a device with a specified address is reachable, and to examine network connectivity.
The ping function is implemented through the Internet Control Message Protocol (ICMP):
1) The source device sends an ICMP echo request to the destination device.
2) The source device determines whether the destination is reachable based on whether it receives an ICMP echo reply; if the destination is reachable, the source device determines the link quality based on the numbers of ICMP echo requests sent and replies received, determines the distance between the source and destination based on the round trip time of ping packets.
Configuring Ping
Follow the step below to configure the ping function:
|
To do… |
Use the command… |
Remarks |
|
Check whether a specified address in an IP network is reachable |
ping [ ip ] [ -a source-ip | -c count | -f | -h ttl | -i interface-type interface-number | -m interval | -n | -p pad | -q | -r | -s packet-size | -t timeout | -tos tos | -v | -vpn-instance vpn-instance-name ] * host |
Required Use either approach The ping command is applicable in an IPv4 network; the ping ipv6 command is applicable in an IPv6 network. Available in any view |
|
ping ipv6 [ -a source-ipv6 | -c count | -m interval | -s packet-size | -t timeout ] * host [ -i interface-type interface-number ] |
![]()
l For a low-speed network, you are recommended to set a larger value for the timeout timer (indicated by the -t parameter in the command) when configuring the ping command.
l Only the directly connected segment address can be pinged if the outgoing interface is specified with the -i argument
l You can use the debugging ip icmp command to enable ICMP module debugging and view the interactions of ICMP packets during the ping process.
l Support for the ping ipv6 command depends on your device module.
Ping Configuration Example
Network requirements
As shown in Figure 1-1, check whether Device A and Device C can reach each other. If they can reach each other, get the detailed information of routes from Device A to Device C.
Figure 1-1 Ping network diagram
Configuration procedure
# Use the ping command to display whether Device A and Device C can reach each other.
<DeviceA> ping 1.1.2.2
PING 1.1.2.2: 56 data bytes, press CTRL_C to break
Reply from 1.1.2.2: bytes=56 Sequence=1 ttl=254 time=205 ms
Reply from 1.1.2.2: bytes=56 Sequence=2 ttl=254 time=1 ms
Reply from 1.1.2.2: bytes=56 Sequence=3 ttl=254 time=1 ms
Reply from 1.1.2.2: bytes=56 Sequence=4 ttl=254 time=1 ms
Reply from 1.1.2.2: bytes=56 Sequence=5 ttl=254 time=1 ms
--- 1.1.2.2 ping statistics ---
5 packet(s) transmitted
5 packet(s) received
0.00% packet loss
round-trip min/avg/max = 1/41/205 ms
# Get the detailed information of routes from Device A to Device C.
<DeviceA> ping -r 1.1.2.2
PING 1.1.2.2: 56 data bytes, press CTRL_C to break
Reply from 1.1.2.2: bytes=56 Sequence=1 ttl=254 time=53 ms
Record Route:
1.1.2.1
1.1.2.2
1.1.1.2
1.1.1.1
Reply from 1.1.2.2: bytes=56 Sequence=2 ttl=254 time=1 ms
Record Route:
1.1.2.1
1.1.2.2
1.1.1.2
1.1.1.1
Reply from 1.1.2.2: bytes=56 Sequence=3 ttl=254 time=1 ms
Record Route:
1.1.2.1
1.1.2.2
1.1.1.2
1.1.1.1
Reply from 1.1.2.2: bytes=56 Sequence=4 ttl=254 time=1 ms
Record Route:
1.1.2.1
1.1.2.2
1.1.1.2
1.1.1.1
Reply from 1.1.2.2: bytes=56 Sequence=5 ttl=254 time=1 ms
Record Route:
1.1.2.1
1.1.2.2
1.1.1.2
1.1.1.1
--- 1.1.2.2 ping statistics ---
5 packet(s) transmitted
5 packet(s) received
0.00% packet loss
round-trip min/avg/max = 1/11/53 ms
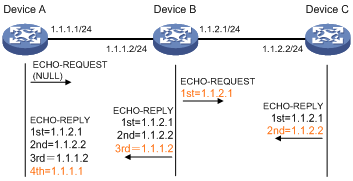
The principle of ping –r is as shown in Figure 1-1.
1) The source (Device A) sends an ICMP echo request with the RR option being empty to the destination (Device C).
2) The intermediate device (Device B) adds the IP address (1.1.2.1) of its outbound interface to the RR option of the ICMP echo request, and forwards the packet.
3) Upon receiving the request, the destination device copies the RR option in the request and adds the IP address (1.1.2.2) of its outbound interface to the RR option. Then the destination device sends an ICMP echo reply.
4) The intermediate device adds the IP address (1.1.1.2) of its outbound interface to the RR option in the ICMP echo reply, and then forwards the reply.
5) Upon receiving the reply, the source device adds the IP address (1.1.1.1) of its inbound interface to the RR option. Finally, you can get the detailed information of routes from Device A to Device C: 1.1.1.1 <-> {1.1.1.2; 1.1.2.1} <-> 1.1.2.2.
Tracert
Introduction
By using the tracert command, you can trace the Layer 3 devices involved in delivering an IP packet from source to destination to check whether a network is available. This is useful for identification of failed node(s) in the event of network failure.
Figure 1-2 Tracert diagram
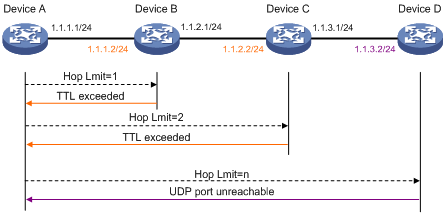
The tracert function is implemented through ICMP, as shown in Figure 1-2:
1) The source (Device A) sends a packet with a TTL value of 1 to the destination (Device D). The UDP port of the packet is a port number that will not be used by any application of the destination.
2) The first hop (Device B) (the Layer 3 device that first receives the packet) responds by sending a TTL-expired ICMP error message to the source, with its IP address 1.1.1.2 encapsulated. In this way, the source device can get the address (1.1.1.2) of the first Layer 3 device.
3) The source device sends a packet with a TTL value of 2 to the destination device.
4) The second hop (Device C) responds with a TTL-expired ICMP error message, which gives the source device the address (1.1.2.2) of the second Layer 3 device.
5) The above process continues until the ultimate destination device is reached. No application of the destination uses this UDP port. Therefore, the destination replies a port unreachable ICMP error message with the destination IP address 1.1.3.2.
6) When the source device receives the port unreachable ICMP error message, it knows that the packet has reached the destination, and it can get the addresses of all the Layer 3 devices involved to get to the destination device (1.1.1.2, 1.1.2.2, 1.1.3.2).
Configuring Tracert
Follow these steps to configure tracert:
|
To do… |
Use the command… |
Remarks |
|
Enter system view |
system-view |
— |
|
Enable the sending of ICMP timeout packets |
ip ttl-expires enable |
Required Disabled by default. |
|
Enable the sending of ICMP destination unreachable packets |
ip unreachables enable |
Required Disabled by default. |
|
Display the routes from source to destination |
tracert [ -a source-ip | -f first-ttl | -m max-ttl | -p port | -q packet-number | -vpn-instance vpn-instance-name | -w timeout ] * host |
Required Use either approach The tracert command is applicable in an IPv4 network; the tracert ipv6 command is applicable in an IPv6 network. Available in any view |
|
tracert ipv6 [ -f first-ttl | -m max-ttl | -p port | -q packet-number | -w timeout ] * host |
![]()
Support for the tracert ipv6 command depends on your device model.
System Debugging
Introduction to System Debugging
The device provides various debugging functions. For the majority of protocols and features supported, the system provides corresponding debugging information to help users diagnose errors.
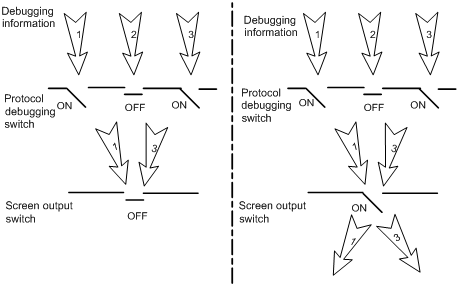
The following two switches control the display of debugging information:
l Protocol debugging switch, which controls protocol-specific debugging information.
l Screen output switch, which controls whether to display the debugging information on a certain screen.
As Figure 1-3 illustrates, suppose the device can provide debugging for the three modules 1, 2, and 3. Only when both the protocol debugging switch and the screen output switch are turned on can debugging information be output on a terminal.
Figure 1-3 The relationship between the protocol and screen output switch
Configuring System Debugging
Output of the debugging information may reduce system efficiency. The debugging commands are usually used by administrators in diagnosing network failure. After completing the debugging, disable the corresponding debugging function, or use the undo debugging all command to disable all the debugging functions.
Output of debugging information is related to the configurations of the information center and the debugging commands of each protocol and functional module. Displaying the debugging information on a terminal (including console or VTY) is a common way to output debugging information. You can also output debugging information to other destinations. For more information, see Information Center in the Network Management and Monitoring Command Reference. By default, you can output debugging information to a terminal by following these steps:
|
To do… |
Use the command… |
Remarks |
|
Enable the terminal monitoring of system information |
terminal monitor |
Optional The terminal monitoring on the console is enabled by default and that on the monitoring terminal is disabled by default. Available in user view |
|
Enable the terminal display of debugging information |
terminal debugging |
Required Disabled by default Available in user view |
|
Enable debugging for a specified module |
debugging { all [ timeout time ] | module-name [ option ] } |
Required Disabled by default Available in user view |
|
Display the enabled debugging functions |
display debugging [ interface interface-type interface-number ] [ module-name ] |
Optional Available in any view |
![]()
You must configure the debugging, terminal debugging and terminal monitor commands first to display the detailed debugging information on the terminal. For more information about the terminal debugging and terminal monitor commands, see Information Center in the Network Management and Monitoring Command Reference.
Ping and Tracert Configuration Example
Network requirements
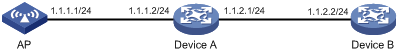
As shown in Figure 1-4, AP failed to telnet Device B. Now it is required to determine whether the AP and Device B can reach each other. If they cannot reach each other, you need to locate the failed nodes in the network.
Figure 1-4 Ping and tracert network diagram
Configuration procedure
# Use the ping command to display whether the AP and Device B can reach each other.
<AP> ping 1.1.2.2
PING 1.1.2.2: 56 data bytes, press CTRL_C to break
Request time out
Request time out
Request time out
Request time out
Request time out
--- 1.1.2.2 ping statistics ---
5 packet(s) transmitted
0 packet(s) received
100.00% packet loss
# The AP and Device B cannot reach each other. Use the tracert command to determine failed nodes.
<AP> system-view
[AP] ip ttl-expires enable
[AP] ip unreachables enable
[AP] tracert 1.1.2.2
traceroute to 1.1.2.2(1.1.2.2) 30 hops max,40 bytes packet, press CTRL_C to bre
ak
1 1.1.1.2 14 ms 10 ms 20 ms
2 * * *
3 * * *
4 * * *
5
<DeviceA>
The output shows that the AP and Device B cannot reach each other; the AP and Device A can reach each other; an error occurred on the connection between Device A and Device B. In this case, you can use the debugging ip icmp command to enable ICMP debugging on AP and Device B to check whether the devices send or receive the specified ICMP packets, or you can use the display ip routing-table command to display whether a route exists between the two devices.