| Title | Size | Downloads |
|---|---|---|
| H3C SeerEngine-SDWAN Controller Troubleshooting Guide-E62XX-5W200-book.pdf | 1.73 MB |
- Table of Contents
- Related Documents
-
H3C SeerEngine-SDWAN Controller
Troubleshooting Guide
Document version: 5W200-20210413
Copyright © 2021 New H3C Technologies Co., Ltd. All rights reserved.
No part of this manual may be reproduced or transmitted in any form or by any means without prior written consent of New H3C Technologies Co., Ltd.
Except for the trademarks of New H3C Technologies Co., Ltd., any trademarks that may be mentioned in this document are the property of their respective owners.
The information in this document is subject to change without notice.
Contents
Collecting SeerEngine-SDWAN controller operating information
Collecting network topology information
Collecting SeerEngine-SDWAN controller log information
A page is displayed incompletely or some functions are unavailable
Troubleshooting incomplete topology
Device location anomaly in the topology
Incomplete physical link information
Troubleshooting device management
Device not on the device list or autodiscovered device list
Device on the autodiscovered device list is removed after it is automatically reported
Failure of a device to come online
Anomaly of device information obtained
Troubleshooting topology management
An automatically reported link is gray
Failure to obtain link information
Troubleshooting adjacency SID label allocation
Adjacency SID label function anomaly
Adjacency SID label allocation failure
Troubleshooting prefix SID label allocation
Prefix SID label function anomaly
Prefix SID label allocation failure
Troubleshooting application group instance path selection
No path for an application group instance
Unexpected path for an application group instance
No path adjustment when the application group instance does not meet the SLA profile requirements
No TE or visibility after an application group is added
Troubleshooting service traffic forwarding
Service traffic is not forwarded according to the specified path
TCP-based service access failure
Troubleshooting branch scenarios
Device failure to come online through zero-touch deployment in a branch scenario
VXLAN tunnel/overlay network deployment failure in a branch scenario
Application group TE failure and traffic forwarding anomaly in a branch scenario
VXLAN VPN member creation failure
VXLAN VPN member status anomaly
Traffic forwarding failure after VXLAN VPN creation
Link bandwidth statistics anomaly
Link quality statistics anomaly
Quality sampling statistics errors
Application group bandwidth statistics anomaly
Application group bandwidth statistics exceeds the actual bandwidth
Application statistics anomaly on a link
Application rate limiting failure
No response on the history information pages
Troubleshooting product licensing
Failure to obtain the device information file
Prompting invalid license file during license file registration
Trial license expires and becomes invalid
Troubleshooting MongoDB cluster synchronization
Long big data synchronization time in a database cluster
Troubleshooting controller operations
Abnormal exit of the controller due to insufficient disk space
Normal exit failure of the controller due to inexistence of port files
Controller cluster failure because two members fail
Introduction
This document provides information about troubleshooting common software and hardware issues with the H3C SeerEngine-SDWAN controller.
General guidelines
To help identify the cause of the issue, collect system and configuration information, including:
· Versions of the H3C SeerEngine-SDWAN controller and Linux operation system.
· Symptom, time of failure, and configuration.
· Network topology information, including the network diagram, port connections, and points of failure.
· For more information about collecting the network topology information and log information, see “Collecting SeerEngine-SDWAN controller operating information.”
· Steps you have taken and their effects.
· All commands you have executed and their outputs.
Collecting SeerEngine-SDWAN controller operating information
Collecting network topology information
To view the network topology information:
1. Enter the login address of the controller GUI in a browser (for example, Chrome) to enter the GUI login page.
The login address format is http://Controller_IP_address:10080/portal/, for example, http://192.168.116.33:10080/portal/.
2. On the login page, enter the username and password, and click Log In.
3. On the homepage, click Application-Driven WAN to enter the SeerEngine-SDWAN controller GUI.
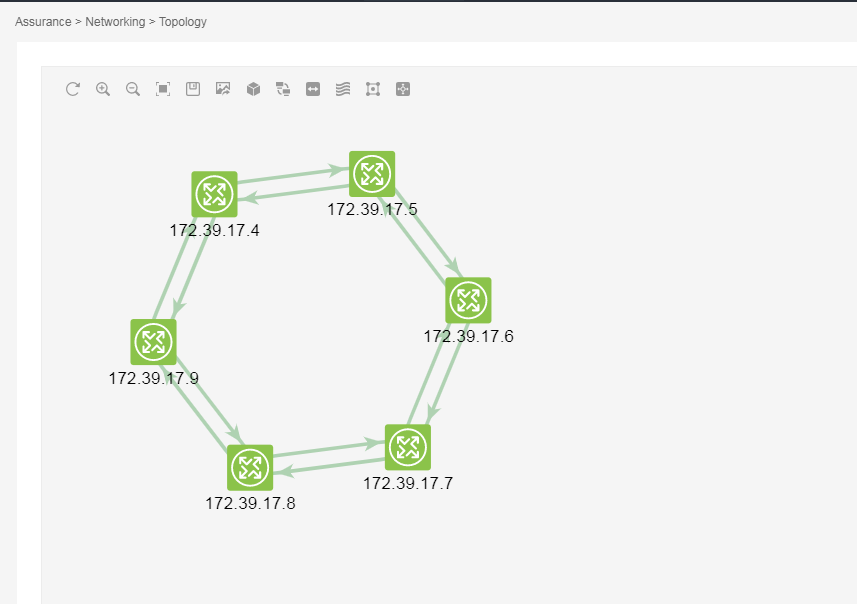
4. On the top navigation bar, click Assurance.
5. From the navigation pane, select Networking > Topology to enter the topology information page. On the page, you can view the global network topology information, including all devices and links.
Figure 1 Topology information page
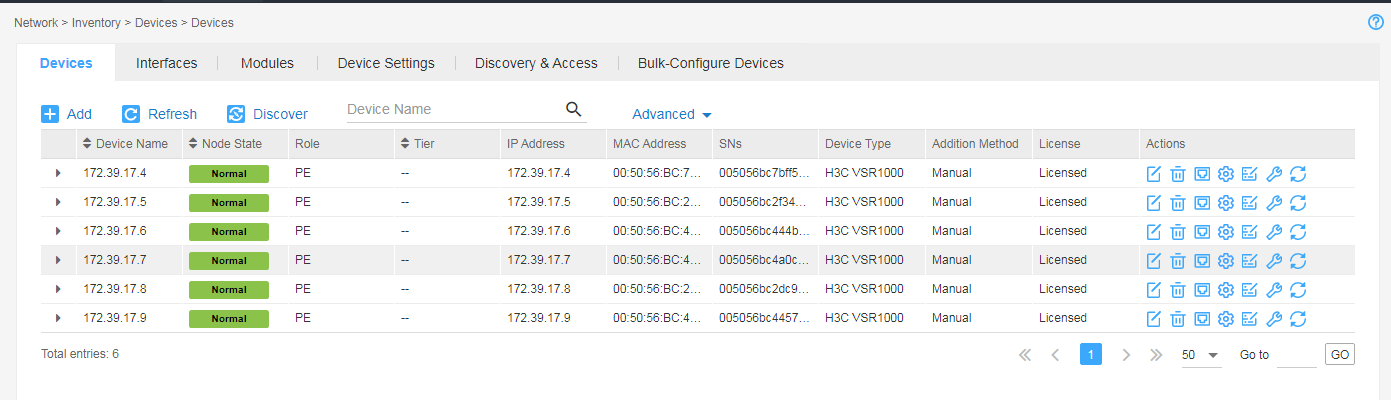
6. On the top navigation bar, click Network.
7. From the navigation pane, select Inventory > Devices to enter the device management page. On the page, you can view the complete information of each device.
Figure 2 Device management page
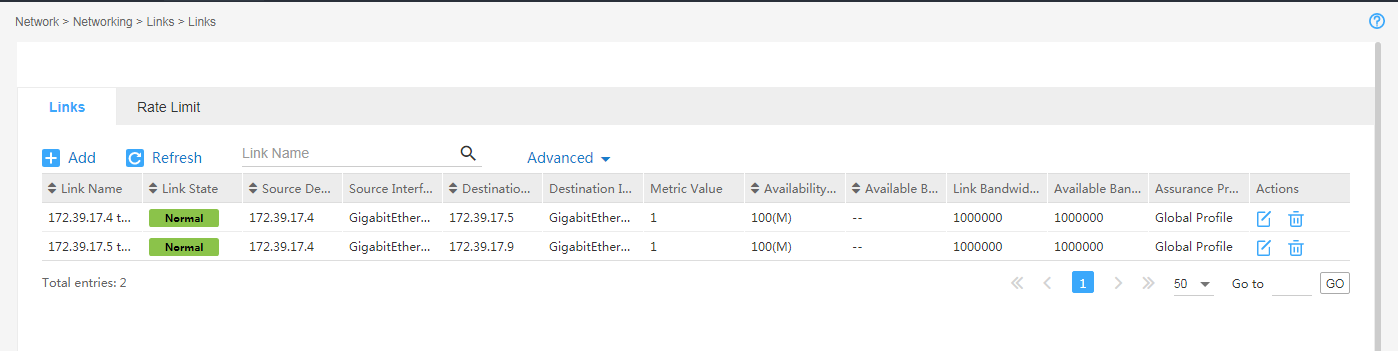
8. On the top navigation bar, click Network.
9. From the navigation pane, select Inventory > Physical Links to enter the physical link management page. On the page, you can view the complete information of each link.
Figure 3 Physical link management page
Collecting SeerEngine-SDWAN controller log information
Collecting diagnosis logs
Diagnosis logs are generated during the operation of the SeerEngine-SDWAN controller. The diagnosis logs are saved in the /var/log/h3c-diag/VCFCWAN/adwan/adwanlog directory. You can export all diagnosis logs on the GUI or export all files in the directory through SecureFX or SSH. Try to collect all files to facilitate troubleshooting.
To export the SeerEngine-SDWAN controller diagnosis logs on the GUI:
1. Enter the login address of the controller GUI in a browser (for example, Chrome) to enter the GUI login page.
The login address format is http://Controller_IP_address:10080/portal/, for example, http://192.168.116.33:10080/portal/.
2. On the login page, enter the username and password, and click Log In.
3. Click Settings on the homepage. On the top navigation bar, click Logs. From the navigation pane, select Information. Click the Diagnosis Logs tab. From the Component list, select SeerEngine-SDWAN. Then, click Export to export all diagnosis logs of the controller, including netconf.log and karaf.log files.
Figure 4 Exporting the data
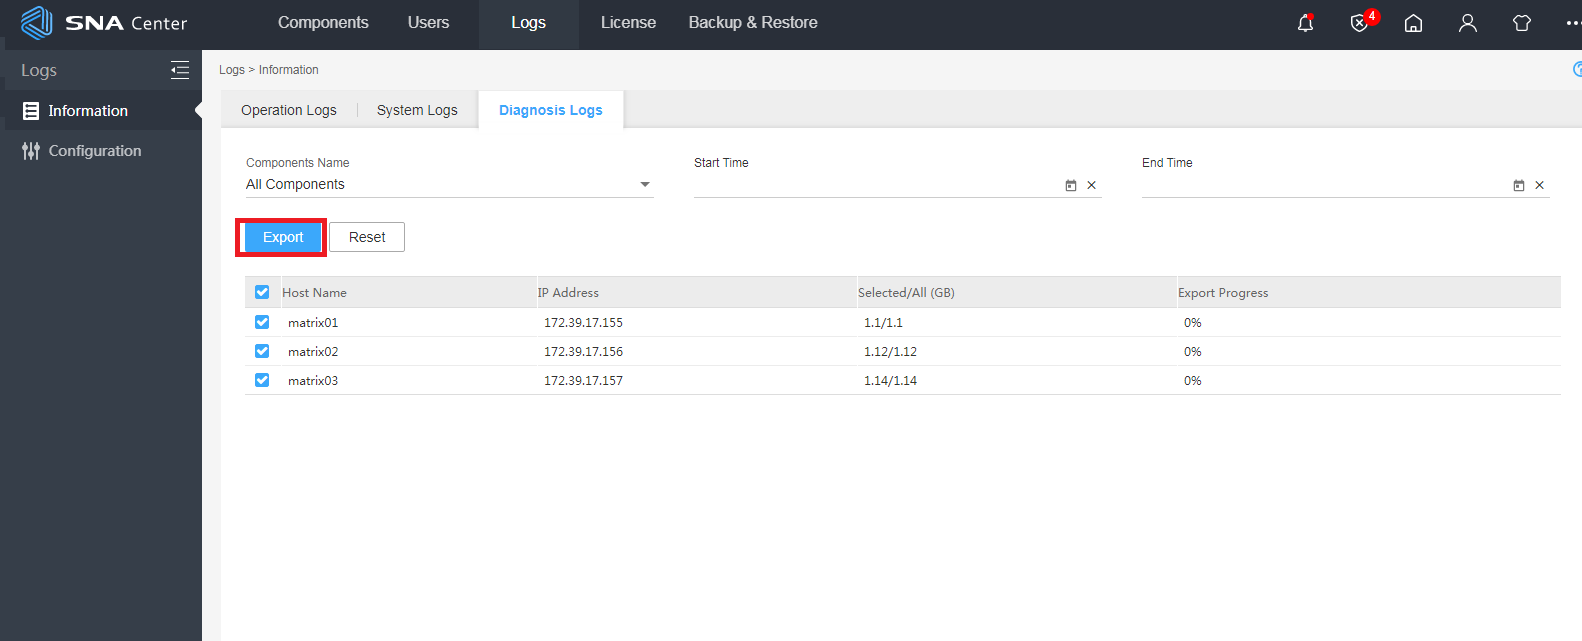
Table 1 Introduction to SeerEngine-SDWAN controller diagnosis logs
|
Category |
File name |
Contents |
|
netconf directory |
netconf.log |
Record generated by the NETCONF module. |
|
karaf.log |
karaf.log.* |
Record generated by ODL. |
|
|
NOTE: · When the current karaf.log file is full and a new file will be generated, the SeerEngine-SDWAN controller automatically renames the old file as karaf_{year}-{week}_{sequence number in the week of the year}.log.zip. The sequence number in the week of the year argument increases as the number of files increases. · When the SeerEngine-SDWAN controller exits abnormally, you can only export all files in the directory through SecureFX or SSH. |
Collecting operation logs and system logs
To export the SeerEngine-SDWAN controller operation logs and system logs on the GUI:
1. Enter the login address of the controller GUI in a browser (for example, Chrome) to enter the GUI login page.
The login address format is http://Controller_IP_address:10080/portal/, for example, http://192.168.116.33:10080/portal/.
2. On the login page, enter the username and password, and click Log In.
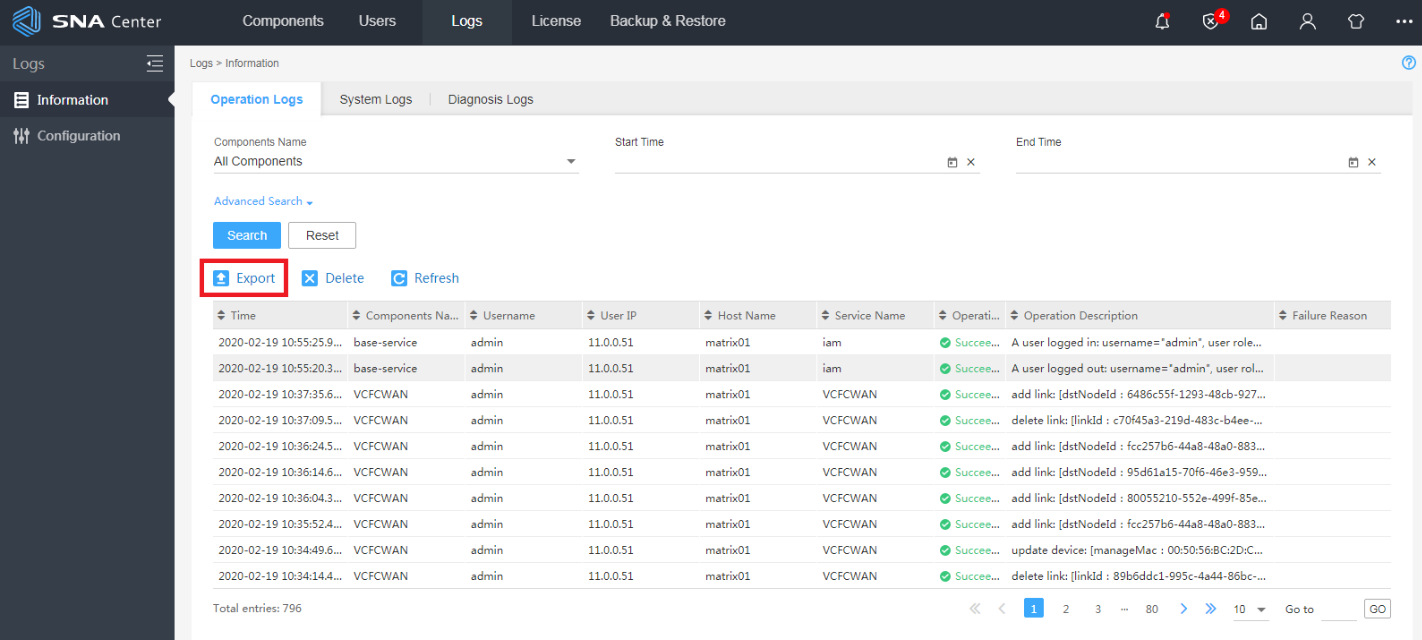
3. Click Settings on the homepage. On the top navigation bar, click Logs. From the navigation pane, select Information. Click the Operation Logs tab. From the Component list, select SeerEngine-SDWAN. Select a time range. Then, click Export to export all operation logs within the specified time range.
Figure 5 Exporting the data
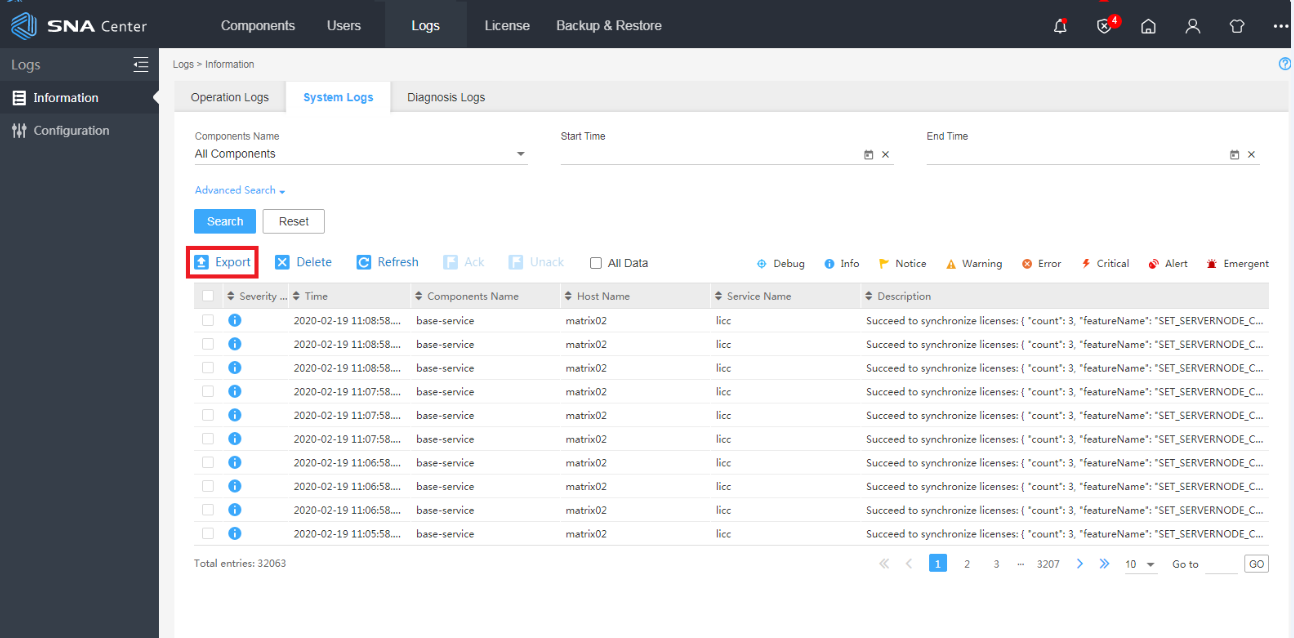
4. Click the System Logs tab. From the Component list, select SeerEngine-SDWAN. Select a time range. Then, click Export to export all system logs of the controller within the specified time range.
Figure 6 Exporting the data
Contacting technical support
If you cannot resolve an issue after using the troubleshooting procedures in this document, contact H3C Support.
The following is the contact information for H3C Support:
· Telephone number—400-810-0504.
· E-mail—[email protected].
Troubleshooting page access
This section provides troubleshooting information for common page access issues.
A page is displayed incompletely or some functions are unavailable
Symptom
After you enter the IP address of the SeerEngine-SDWAN controller in the address bar of a browser, the page is displayed incompletely or some functions are unavailable.
Solution
Possible reasons are:
· The browser version is too low and does not support HTML5.
· The resolution of the screen is too low.
To resolve the issue:
1. Verify that the browser version is a version recommended in the controller installation guide.
2. If the issue persists, contact H3C Support.
Slow page response
Symptom
When you access a page in the browser, the page response is slow.
Solution
Possible reasons are:
· The network is abnormal or the network quality is low.
· The client configuration does not meet the requirements.
To resolve the issue:
1. Check the network quality. As a best practice, make sure the network latency is no higher than 200 ms.
2. Verify that the available memory of the client PC is no lower than 4GB.
3. If the issue persists, contact H3C Support.
Page access failure
Symptom
After you enter the IP address of the SeerEngine-SDWAN controller in the address bar of a browser, the system prompts that the page cannot be accessed.
Solution
Possible reasons are:
· The network between the client and the server where the SeerEngine-SDWAN controller is installed is abnormal, or port 80 of the server is disabled.
· The node server on the GUI for the server where the SeerEngine-SDWAN controller is installed exits abnormally.
To resolve the issue:
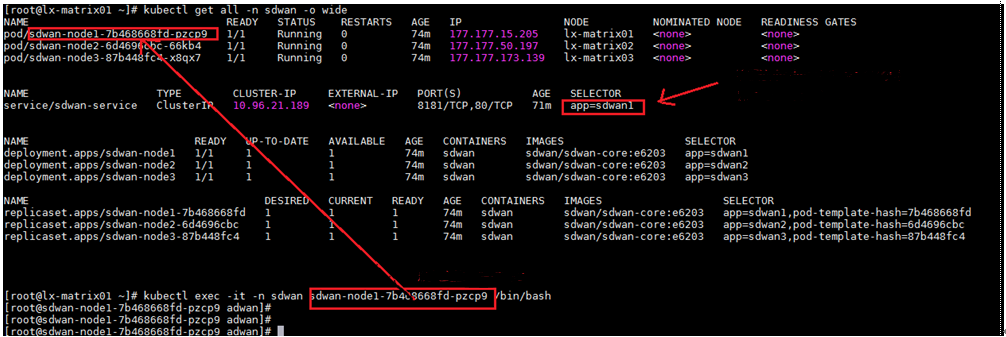
1. When the Matrix cluster is stable, execute the following command on any Matrix server to determine the master SeerEngine-SDWAN controller.
kubectl get all -n sdwan -o wide

2. If app=sdwan1 is displayed in the SELECTOR field, sdwan-node1 is the master controller. This rule also applies to other controllers.
3. Execute the following command to log in to the master SeerEngine-SDWAN controller. Input the actual master controller ID in the shaded parameter.
kubectl exec -it -n sdwan sdwan-node1-7b468668fd-pzcp9 /bin/bash
4. Execute the ps -ef | grep jx command. Identify whether the node process appears. If the process does not appear, execute the following command to restart the foreground process:
cd /opt/ADWAN-WEB/
nohup jx_ub64v8/jx adwan-web.jx &
5. Exit the controller.
exit
6. If the issue persists, contact H3C Support.
Troubleshooting incomplete topology
This section provides troubleshooting information for common incomplete topology issues.
Before installing the SeerEngine-SDWAN controller, make sure the network is well prepared to avoid topology information anomalies.
Incomplete node information
Symptom
On the topology management or device management page, the number of devices displayed is different from the actual number of devices in the network. The node information is incompletely collected.
Solution
To resolve the issue:
1. Locate each device that is not reported. Use the ping command to identify whether the device and the controller can communicate properly. If the communication fails, troubleshoot the network. If the communication succeeds, proceed with the following steps.
2. Re-establish the BGP-LS peer relationship:
a. On the top navigation bar, click Network.
b. From the navigation pane, select Networking > Network Design.
c. Clear the BGP-LS option.
d. Five minutes later, re-select the BGP-LS option.
3. Execute the display bgp peer link-state command at the CLI of the device to view the number of nodes collected by BGP.
¡ If the node counts are still different, check the network configuration.
¡ If the number of nodes collected by BGP is the same as the actual number of nodes in the network and the issue is still not resolved, proceed with the following steps.
4. If the nodes are still incompletely collected, perform one of the following tasks:
¡ Restart the controller.
After the controller is restarted, the controller will re-connect to devices. This operation will cause service interruption. Please perform this operation with caution. If the live network does not allow restarting the controller, you can manually add devices or contact H3C Support.
¡ Manually add devices:
- On the top navigation bar, click Network.
- From the navigation pane, select Inventory > Devices.
- Click Add.
- On the dialog box that opens, manually add device information, and click OK.
Device location anomaly in the topology
Symptom
The location of a device is abnormal or garbled characters appear in the topology.
Solution
When the controller is upgraded from version E2108 or earlier to version E2109 or layer, the device location information might be lost. As a result, the location of a device is abnormal or garbled characters appear in the topology. In this case, you must set the device locations again.
To resolve the issue:
1. On the top navigation bar, click Network.
2. From the navigation pane, select Inventory > Devices to enter the device management page.
3. In the Actions column, click the ![]() icon
for the device, and select Relocate.
icon
for the device, and select Relocate.
4. On the dialog box that opens, relocate the device.
5. Enter the topology management page to identify whether the device location is normal.
6. If the issue persists, contact H3C Support.
Incomplete physical link information
Symptom
On the physical link page, the number of links displayed is different from the actual number of links in the network. The link information is incompletely collected.
Solution
To resolve the issue:
1. On the top navigation bar, click Network.
2. From the navigation pane, select Inventory > Devices to enter the device management page.
3. Click the Discovery & Access tab. Identify whether the BGP-LS Topology Autodiscovery option is selected.
¡ If this option is not selected, select it and click OK.
¡ If this option has been selected, clear it, click OK, select it again, and click OK.
4. Re-establish the BGP-LS peer relationship:
a. On the top navigation bar, click Network.
b. From the navigation pane, select Networking > Network Design.
c. Clear the BGP-LS option.
d. Five minutes later, re-select the BGP-LS option.
5. Execute the display bgp link-state command at the CLI of the device to view the number of links collected by BGP.
¡ If the link counts are still different, check the network configuration.
¡ If the number of links collected by BGP is the same as the actual number of links in the network and the issue is still not resolved, proceed with the following steps.
6. If the links are still incompletely collected, perform the following tasks:
¡ Restart the controller.
After the controller is restarted, the controller will re-connect to devices. This operation will cause service interruption. Please perform this operation with caution. If the live network does not allow restarting the controller, you can manually add links or contact H3C Support.
¡ Manually add links:
- On the top navigation bar, click Network.
- From the navigation pane, select Inventory > Physical Links.
- Click Add.
- On the dialog box that opens, manually add link information, and click OK.
Troubleshooting device management
This section provides troubleshooting information for common device management issues.
Device not on the device list or autodiscovered device list
Symptom
After a device is configured to automatically report itself, the device cannot be queried on the device list or autodiscovered device list.
Solution
To resolve the issue:
1. Troubleshoot incomplete device reporting as described in “Troubleshooting incomplete topology.”
2. Re-configure the device to report itself in the H3C SeerEngine-SDWAN controller:
a. On the top navigation bar, click Network.
b. From the navigation pane, select Inventory > Devices to enter the device management page.
c. Click the Discovery & Access tab.
d. On the tab, configure the device registration, device discovery, and device management parameters, and click OK.
3. If the issue persists, contact H3C Support.
Device on the autodiscovered device list is removed after it is automatically reported
Symptom
After a device is configured to automatically report itself, the device can be queried on the autodiscovered device list but is removed soon.
Solution
The possible reason is that the device serial number or MAC address conflicts with that of another device.
To resolve the issue:
1. Log in to the device through Telnet or SSH, and execute the display license device-id command to view the serial number (SN) of the device.
2. If the serial number of the device conflicts with that of a device on the device list, contact H3C Support.
3. If the serial number of the device is empty, identify whether the MAC address of the device conflicts with that of a device on the device list. If a MAC address conflict exists, contact H3C Support.
Failure of a device to come online
Symptom
A newly added device cannot come online.
Solution
Possible reasons are:
· The management channel is unavailable.
· No license node is available.
· No license matches the network scenario.
· The serial number and management IP of the device do not match.
· The device does not have a version number or the device vendor is unknown.
· The device conflicts with another device.
· The MTU set is too big.
· The configuration is being recovered.
To resolve the issue:
1. On the top navigation bar, click Network.
2. From the navigation pane, select Inventory > Devices to enter the device management page.
3. Click the name of the device that cannot come online to view the offline reason. Troubleshoot the issue according to the offline reason.
4. If the device fails to come online because the management channel is unavailable, the controller cannot connect to the device through NETCONF.
a. Identify whether the device and the controller can communicate smoothly and verify that the bidirectional latency is smaller than 900 ms.
b. Identify whether the NETCONF configuration is correct.
- If the NETCONF configuration is correct, proceed with the following steps.
- If the NETCONF configuration is incorrect, configure NETCONF as follows.
<H3C> system-view
[H3C] netconf soap http enable
[H3C] netconf soap https enable
[H3C] netconf ssh server enable
[H3C] line vty 0 4
[H3C-line-vty0-4] authentication-mode scheme
[H3C-line-vty0-4] user-role network-operator
5. Identify whether the NETCONF template configuration of the controller is correct.
a. On the top navigation bar, click Network.
b. From the navigation pane, select Settings > Templates.
c. Click the NETCONF Templates tab.
d. Identify whether the NETCONF template configuration is consistent with the NETCONF configuration on the device.
e. If the NETCONF template configuration is
inconsistent with the NETCONF configuration on the device, click the ![]() icon for the NETCONF template in the Actions column, and
select Edit.
icon for the NETCONF template in the Actions column, and
select Edit.
f. On the Edit NETCONF Template dialog box that opens, edit the NETCONF template configuration to make it consist with the NETCONF configuration on the device.
6. If the device fails to come online because no license node is available, the current node count has reached the upper limit allowed by the license. In this case, choose one of the following options:
¡ Buy more license nodes.
¡ Delete or isolate devices that have applied for license nodes and do not need to be managed. To delete or isolate a device:
- On the top navigation bar, click Network.
- From the navigation pane, select Inventory > Devices to enter the device management page.
- Click the Devices tab.
- In the Actions column, click the ![]() icon
for a device that has applied for a license node but does not need to be
managed, click Maintain for the device to place the
device in maintenance state, and click Delete to delete the device.
icon
for a device that has applied for a license node but does not need to be
managed, click Maintain for the device to place the
device in maintenance state, and click Delete to delete the device.
7. If the device fails to come online because the serial number and management IP of the device do not match, the manually input serial number does not match the actual serial number of the device with the specified management IP address or the device has been replaced. In this case, set the serial number of the device to empty or the exact value as follows:
a. On the top navigation bar, click Network.
b. From the navigation pane, select Inventory > Devices to enter the device management page.
c. Click the Devices tab.
d. In the Actions column, click the ![]() icon for the device,
and select Edit.
icon for the device,
and select Edit.
e. On the dialog box that opens, edit the device serial number, and click OK.
8. If the device fails to come online because the device does not have a version number or the device vendor is unknown, the controller cannot connect to the device through SNMP. To configure SNMP correctly:
a. On the top navigation bar, click Network.
b. From the navigation pane, select Settings > Templates.
c. Click the SNMP Templates tab.
d. On the tab, identify whether the SNMP template configuration is consistent with that on the device.
e. If the SNMP template configuration is inconsistent, click the ![]() icon
for the SNMP template in the Actions column, and select Edit.
icon
for the SNMP template in the Actions column, and select Edit.
f. On the dialog box that opens, modify the SNMP template configuration to make it consist with the SNMP configuration on the device.
9. If the device fails to come online because the device conflicts with another device, the key attributes of the device are completely or partially the same as those of another device. To resolve the issue:
a. Identify whether the serial number of the device conflicts with that of another device. For more information, see “Device on the autodiscovered device list is removed after it is automatically reported.”
b. On the top navigation bar, click Network.
c. From the navigation pane, select Inventory > Devices.
d. Click the Interfaces tab.
e. On the tab, identify whether the interface MAC addresses of devices conflict, and identify whether the IP addresses and masks of devices conflict.
10. If the device fails to come online because the set MTU is too big, perform the following tasks:
a. Execute the vi /opt/WAN_APP1000/etc/log4j2.xml command to modify INFO to DEBUG to enable the debugging mode for the NETCONF logs.
<Logger name="com.h3c.swan.config.util.NetConfConnectMgr" level="DEBUG" additivity="false">
<AppenderRef ref="netconf"/>
</Logger>
<Logger name="com.h3c.swan.config.DistributeConfig" level="DEBUG" additivity="false">
<AppenderRef ref="netconf"/>
</Logger>
<Logger name="com.h3c.swan.config.AsynchronousDistributeConfig" level="DEBUG" additivity="false">
<AppenderRef ref="netconf"/>
</Logger>
b. Execute the following command to view the DEBUG logs of NETCONF. If the useTime field value is more than 5000 ms, NETCONF packet sending times out. In this case, proceed with the following steps.
tailf /opt/WAN_APP1000/data/log/netconf/netconf.log | grep “keep alive timeout, [useTime]”
c. Execute the following command to view the TCP connections of the controller, and identify whether the Recv-Q and Send-Q buffers are full. If the MTU value (1500 bytes by default) is exceeded, modify the MTU of the controller to 1300 bytes.
netstat –nat | grep 830,
The following section takes CentOS Linux release 7.5.1804 as an example to describe how to modify the MTU. You can modify the MTU in one of the following methods:
¡ Execute the ifconfig command to modify the MTU. This configuration does not take effect after the system is restarted. As a best practice, modify the MTU through modifying the configuration file.
ifconfig eth0 mtu 1300 up
¡ Modify the MTU through modifying the configuration file.
- Execute the following command to open the NIC configuration file.
vi /etc/sysconfig/network-scripts/ifcfg-eth0
- Add the following contents to the configuration file, save the configuration, and exit.
MTU=1300
:wq
- Restart the NIC to make the configuration take effect.
service network restart
11. If the device fails to come online because the configuration is being recovered, the configuration recovery is in progress. Some card failure alarms exist in the alarms. To resolve the issue:
a. On the top navigation bar, click Network.
b. From the navigation pane, select Inventory > Devices.
c. Click the Modules tab.
d. If some cards are displayed as abnormal on the tab, the device fails to come online because of configuration recovery failure caused by card failures. In this case, troubleshoot the card failures.
12. If the issue persists, contact H3C Support.
Anomaly of device information obtained
Symptom
The device information obtained is incomplete or not the latest data.
Solution
To resolve the issue:
1. Identify whether the device and the controller can communicate smoothly. Verify that the bidirectional latency is shorter than 900 ms and the packet loss rate is smaller than 10%.
2. Identify whether the device has SNMP and NETCONF enabled, and whether the user has the corresponding privileges.
¡ If the user role configuration is correct, proceed with the following steps.
¡ If the user role configuration is incorrect, execute the following commands at the CLI:
<H3C> system-view
[H3C] line vty 0 4
[H3C-line-vty0-4] authentication-mode scheme
[H3C-line-vty0-4] user-role network-operator
3. Identify whether the SNMP template and NETCONF template configuration bound to the device in the controller is consistent with that on the device:
a. On the top navigation bar, click Network.
b. From the navigation pane, select Settings > Templates.
c. View the SNMP template configuration and NETCONF template configuration.
d. If the SNMP or NETCONF template
configuration is inconsistent, click the ![]() icon for the SNMP
or NETCONF template in the Actions column, and select Edit. On
the dialog box that opens, modify the SNMP or NETCONF template configuration to
make it consist with the SNMP or NETCONF configuration on the device.
icon for the SNMP
or NETCONF template in the Actions column, and select Edit. On
the dialog box that opens, modify the SNMP or NETCONF template configuration to
make it consist with the SNMP or NETCONF configuration on the device.
4. If the configurations above are correct, perform the following tasks:
a. On the top navigation bar, click Network.
b. From the navigation pane, select Inventory > Devices to enter the device management page.
c. Click the Devices tab.
d. In the Actions column, click the ![]() icon
for the device, and select Synchronize.
icon
for the device, and select Synchronize.
e. Verify that the device data is refreshed.
5. If the issue persists, contact H3C Support.
Device/link state anomaly
Symptom
Device colors include green for online, blue for unknown, gray for offline, yellow for critical alarm, and red for alert alarm. Link colors include green for online and gray for offline.
When a device is colored red or yellow, the device has abnormal alarms, and you must troubleshoot the issue. When a device or link is colored gray, the device or link is offline, and you must troubleshoot the issue according to the network scenario.
Solution
To resolve the issue:
1. When a device is colored blue, the device state is unknown.
2. When a device is colored gray, resolve the issue as described in “Failure of a device to come online.”
3. When a device is colored yellow, access the Alarms page, and resolve the alarms on the device.
4. When a device is colored red, access the Alarms page, and resolve the alarms on the device.
5. When a link is colored gray, the link state is down. In this case, identify whether the interfaces at both ends of the link are down.
Troubleshooting topology management
This section provides troubleshooting information for common topology management issues.
A manually added link is gray
Symptom
A manually add link is gray.
Solution
Possible reasons are interfaces of the link are down or the link information is inconsistent with that on the device.
To resolve the issue:
1. On the top navigation bar, click Network.
2. From the navigation pane, select Inventory > Devices.
3. Click the Interfaces tab.
4. Identify whether the interfaces at both ends of the link are down.
¡ If an interface is down, enter the following commands at the CLI of the device:
<H3C> system-view
[H3C] interface GigabitEthernet 1/1/0
[H3C-GigabitEthernet1/1/0] undo shutdown
¡ If both interfaces are up, perform the following tasks:
- On the top navigation bar, click Network.
- From the navigation pane, select Inventory > Devices to enter the device management page.
- Click the Devices tab.
- In the Actions column, click the ![]() icon
for a device, and select Edit.
icon
for a device, and select Edit.
- On the page that opens, click OK. Identify whether the device information is refreshed.
5. If the issue persists, contact H3C Support.
An automatically reported link is gray
Symptom
An automatically reported link is gray.
Solution
To resolve the issue:
1. On the top navigation bar, click Network.
2. From the navigation pane, select Inventory > Devices to enter the device management page.
3. Click the Discovery & Access tab.
4. Identify whether the BGP-LS Topology Autodiscovery option is selected.
¡ If this option is not selected, select it and click OK.
¡ If this option has been selected, clear it, click OK, select it again, and click OK.
5. Perform the tasks as described in “A manually added link is gray.” According to the protocol used for reporting links, choose one of the following options:
¡ If the link is reported through IS-IS, enter the following commands at the CLI of each device of the link:
<H3C> system-view
[H3C] interface GigabitEthernet 1/1/0
[H3C-GigabitEthernet1/1/0] isis circuit-type p2p
¡ If the link is reported through OSPF, enter the following commands at the CLI of each device of the link:
<H3C> system-view
[H3C] interface GigabitEthernet 1/1/0
[H3C-GigabitEthernet1/1/0] ospf network-type p2p
6. Re-establish the BGP-LS peer relationships:
a. On the top navigation bar, click Network.
b. From the navigation pane, select Networking > Network Design.
c. Clear the BGP-LS option.
d. Five minutes later, re-select the BGP-LS option.
7. If the issue persists, contact H3C Support.
Failure to obtain link information
Symptom
An exception occurred when information of automatically reported or manually added links was obtained.
Solution
To resolve the issue:
1. Choose one of the following options:
¡ Modify links:
- On the top navigation bar, click Network.
- From the navigation pane, select Networking > Physical Links.
- In the Actions column, click the ![]() icon
for the link, and select Edit.
icon
for the link, and select Edit.
- On the page that opens, modify abnormal parameters to expected parameters, and click OK.
¡ Modify devices:
- On the top navigation bar, click Network.
- From the navigation pane, select Inventory > Devices.
- In the Actions column, click the ![]() icon
for the device, and select Edit.
icon
for the device, and select Edit.
- On the page that opens, click OK.
- Identify whether the link data is refreshed.
¡ Delete links and add links again:
- On the top navigation bar, click Network.
- From the navigation pane, select Networking > Physical Links.
- In the Actions column, click the ![]() icon
for the link, and select Delete.
icon
for the link, and select Delete.
- After the link is successfully deleted, click Add in the upper right corner to add the link again.
2. If the issue persists, contact H3C Support.
Troubleshooting adjacency SID label allocation
This section provides troubleshooting information for common adjacency SID label allocation issues.
Adjacency SID label function anomaly
Symptom
After the SeerEngine-SDWAN controller is started, the adjacency SID label function cannot be used properly. In the current software version, only the carrier network supports allocating adjacency SID labels.
Solution
Possible reasons are:
· The devices do not come online.
· The links do not come online.
· The device roles are not set to P or PE.
· The adjacency SID label range is not set.
To resolve the issue:
1. On the top navigation bar, click Network. From the navigation pane, select Inventory > Devices. Identify whether devices have come online.
¡ If no devices have not come online, perform tasks as described in “Troubleshooting device management.”
¡ If any devices have come online, proceed with the following steps.
2. On the top navigation bar, click Network. From the navigation pane, select Inventory > Physical Links. Identify whether links have come online.
¡ If no links have not come online, perform tasks as described in “Troubleshooting topology management.”
¡ If any links have come online, proceed with the following steps.
3. On the top navigation bar, click Network. From the navigation pane, select Inventory > Devices. Identify whether the target device role is set to P or PE.
¡ If
the target device role is not set to P or PE, click the ![]() icon
for the device, select Edit, set the device role to P or PE on the page
that opens, and click OK.
icon
for the device, select Edit, set the device role to P or PE on the page
that opens, and click OK.
¡ If the target device role is set to P or PE, proceed with the following steps.
4. On the top navigation bar, click Network. From the navigation pane, select Inventory > Pools. Click the Labels tab, and select the label type as adjacency SID label. Identify whether the adjacency SID label range is set on the controller.
¡ If the adjacency SID label range is not set, set the label range.
¡ If the adjacency SID label range is set, proceed with the following steps.
5. If the issue persists, contact H3C Support.
Adjacency SID label allocation failure
Symptom
After adjacency SID label allocation is enabled, adjacency SID label allocation failures appear in the label allocation records.
Solution
Possible reasons are:
· The controller fails to establish a NETCONF connection to the target device.
· The controller fails to issue the label configuration to the target device.
To resolve the issue:
1. On the top navigation bar, click Network. From the navigation pane, select Inventory > Pools. Click the Labels tab. Hover over the label status column, and view the prompts.
2. If the prompt is BUILDCONNFAIL, identify whether the NETCONF configuration of the device is correct.
a. On the top navigation bar, click Network.
b. From the navigation pane, select Settings > Templates.
c. Click the NETCONF Templates tab. On the tab, identify whether the NETCONF template configuration is correct.
d. If the NETCONF template configuration is
inconsistent, click the ![]() icon for the NETCONF template in the Actions column, and
select Edit.
icon for the NETCONF template in the Actions column, and
select Edit.
e. On the dialog box that opens, edit the template configuration to make it consist with the NETCONF configuration on the device.
3. If the prompt is no label left, the adjacency SID label resources have been exhausted. To resolve the issue:
a. On the top navigation bar, click Network.
b. From the navigation pane, select Inventory > Pools.
c. Click the Labels tab, and modify the label range to add more adjacency SID label resources.
4. If the issue persists, contact H3C Support.
Troubleshooting prefix SID label allocation
This section provides troubleshooting information for common prefix SID label allocation issues.
Prefix SID label function anomaly
Symptom
After the SeerEngine-SDWAN controller is started, the prefix SID label function cannot be used properly. In the current software version, only the carrier network supports allocating prefix SID labels.
Solution
Possible reasons are:
· The devices do not come online.
· The prefix SID label range is not set.
· The prefix SID label allocation method is not set.
To resolve the issue:
1. On the top navigation bar, click Network. From the navigation pane, select Inventory > Devices. Identify whether devices have come online.
¡ If no devices have not come online, perform tasks as described in “Troubleshooting device management.”
¡ If any devices have come online, proceed with the following steps.
2. On the top navigation bar, click Policy. From the navigation pane, select Settings > TE & Visibility. Identify whether the prefix SID label range is set.
¡ If the prefix SID label range is not set, set the prefix SID label range.
¡ If the prefix SID label range is set, proceed with the following steps.
3. On the top navigation bar, click Policy. From the navigation pane, select Settings > TE & Visibility. Identify whether the label allocation method is set.
¡ If the label allocation method is not set, set the label allocation method.
¡ If the label allocation method is set, proceed with the following steps.
4. If the issue persists, contact H3C Support.
Prefix SID label allocation failure
Symptom
After prefix SID label allocation is enabled, prefix SID label allocation failures appear in the label allocation records.
Solution
Possible reasons are:
· The controller fails to establish a NETCONF connection to the target device.
· The loopback interface corresponding to the prefix SID label to be issued does not exist on the device.
· The loopback interface used by the prefix SID label on the device is not configured with an IP address.
· The OSPF process ID required for prefix SID label allocation does not exist on the device.
· The device does not support the prefix SID label range issued by the controller.
· Label configuration issuing times out.
· The device does not support prefix SID labels.
To resolve the issue:
1. On the top navigation bar, click Network.
2. From the navigation pane, select Inventory > Pools.
3. Click the Labels tab.
4. Set the label type to prefix SID label.
5. Hover over the label status column, and view the prompts.
6. If the prompt is Failed to establish a NETCONF connection to the device, perform the following tasks:
a. On the top navigation bar, click Network.
b. From the navigation pane, select Settings > Templates.
c. Click the NETCONF Templates tab. On the tab, identify whether the NETCONF template configuration is correct. If the NETCONF template configuration is inconsistent, perform the following tasks:
- Click the ![]() icon for the
NETCONF template in the Actions column, and select Edit.
icon for the
NETCONF template in the Actions column, and select Edit.
- On the dialog box that opens, modify the NETCONF template configuration to make it consist with the NETCONF configuration on the device.
7. If the prompt is Failed to establish a NETCONF connection to the device, identify whether the NETCONF configuration on the device is correct.
a. If the NETCONF configuration the device is correct, verify that the device and the controller can communicate properly.
b. If prefix SID label allocation still fails, proceed with the following steps.
8. If the prompt is Interface interface-name (Loopback interface number used by prefix SID label) does not exist, identify whether the loopback interface exists on the device.
a. If the loopback interface does not exist, create the loopback interface on the device.
b. If prefix SID label allocation still fails, proceed with the following steps.
9. If the prompt is Interface interface-name (Loopback interface number used by prefix SID label) does not have an IP address, identify whether the loopback interface on the device is configured with an IP address.
a. If the loopback interface on the device is not configured with an IP address, configure an IP address for the loopback interface.
b. If prefix SID label allocation still fails, proceed with the following steps.
10. If the prompt is The specified OSPF process ID does not exist on the device, identify whether the device is configured with an OSPF process ID corresponding to the process ID configured on the Policy > Settings > TE & Visibility page.
a. If the device is not configured with the OSPF process ID, create the OSPF process ID on the device.
b. If prefix SID label allocation still fails, proceed with the following steps.
11. If the prompt is The device does not support the prefix SID label range deployed by the controller, execute the display ospf segment-routing global-block command to identify whether the corresponding OSPF process on the device is configured with the prefix SID label range.
a. If the prefix SID label range configured on the device does not support the prefix SID label range issued by the controller, perform one of the following tasks:
- Execute the segment-routing global-block command to modify the prefix SID label range on the device.
- Modify the prefix SID label range issued by the controller on the Policy > Settings > TE & Visibility page.
b. If prefix SID label allocation still fails, proceed with the following steps.
12. If the prompt is The device does not support configuring the prefix SID labels, the device does not support prefix SID labels. To resolve this issue, perform the following tasks:
a. Upgrade the device software to the latest version.
b. If prefix SID label allocation still fails, proceed with the following steps.
13. If the issue persists, contact H3C Support.
Troubleshooting application group instance path selection
This section provides troubleshooting information for common issues with path selection for application group instances.
After an application group is added in the Web interface, the SeerEngine-SDWAN controller will calculate paths for application group instances in the application group.
No path for an application group instance
Symptom
1. On the top navigation bar, click Policy.
2. From the navigation pane, select Applications > Traffic Engineering.
3. On the page, you can view the path information of application group instances.
If the tunnel name and path details of an application group instance are empty, no path exists for the application group instance.
Solution
Possible reasons are:
· The network between devices is abnormal.
· The application group configuration is incorrect.
· The basic parameter settings are incomplete.
· The labels in the carrier network are not properly allocated.
To resolve the issue:
1. Identify whether the network between the source device and destination device is operating properly. If the network is not operating properly, troubleshoot the network.
2. Identify whether the basic information of the application group is completely configured:
a. On the top navigation bar, click Policy.
b. From the navigation pane, select Applications > Application Groups.
c. On the page, you can view the application group configuration information.
d. If the application list or application policy of the application group is empty, click the Edit icon for the application group in the Actions column, and add the related information.
3. If the network is a carrier network, first allocate labels to the network. For more information, see “Troubleshooting adjacency SID label allocation.”
4. If the issue persists, contact H3C Support.
Unexpected path for an application group instance
Symptom
The expected path for an application group instance is different from the actual path that the SeerEngine-SDWAN controller plans for the application group instance.
Solution
Possible reasons are:
· The expected path does not meet the SLA profile requirements.
· The bandwidth of the expected path does not meet the requirements.
To resolve the issue:
1. Identify whether the latency, jitter, and packet loss rate of the expected path meet the requirements in the SLA profile bound to the application group.
¡ If the expected path does not meet the SLA profile requirements, it is normal that the actual path is different from the expected path. You can adjust the SLA profile to make it conform to the expected path as follows:
- Navigate to the Policy > Applications > Traffic Engineering page.
- Click the ![]() icon for the
corresponding application group in the Actions column.
icon for the
corresponding application group in the Actions column.
- Select Optimize Path to trigger the application group to re-select a path.
¡ If the expected path meets the SLA profile requirements, proceed with the following steps.
2. Identify whether the available bandwidth of the expected path meets the minimum bandwidth value configured in the policy bound to the application group.
¡ If the available bandwidth of the expected path does not meet the policy requirements, it is normal that the actual path is different from the expected path. You can adjust the minimum bandwidth in the policy to make it conform to the expected path as follows:
- Navigate to the Policy > Applications > Traffic Engineering page.
- Click the ![]() icon for the
corresponding application group in the Actions column.
icon for the
corresponding application group in the Actions column.
- Select Optimize Path to trigger the application group to re-select a path.
¡ If the available bandwidth of the expected path meets the policy requirements, proceed with the following steps.
3. If the issue persists, contact H3C Support.
No path adjustment when the application group instance does not meet the SLA profile requirements
Symptom
When the application group instance does not meet the SLA profile path constraint requirements, the SeerEngine-SDWAN controller does not adjust the path for the application group instance as expected, and traffic is still forwarded along the original path.
Solution
The possible reason is that the link conditions in the whole network are not stables. As a result, there are not available paths for optimization and adjustment.
To resolve the issue:
1. Identify whether the latency, jitter, and packet loss rate requirements of the SLA profile bound to the application group are too strict. If the path constraint requirements are too strict, the system might fail to select another path that meets the requirements. In this case, degrade some requirements in the SLA profile so that the system can select another path.
2. Check the bandwidth usage of other links. If other links are congested, the system will not select from these links when performing path optimization. As a result, the path adjustment might fail. In this case, upgrade the bandwidth.
3. If the issue persists, contact H3C Support.
No TE or visibility after an application group is added
Symptom
Application traffic statistics cannot be collected and TE does not take effect after an application group is added to a carrier network.
Solution
Possible reasons are:
· Application coloring (CBTS) failed: When a device is deployed, the incoming interface is not configured (added to the LAN network). As a result, the controller does not issue a QoS policy corresponding to CBTS to the incoming interface.
· MPLS L3VPN traffic redirection failure: When multiple IGP areas exist, no tunnel policies are manually configured. As a result, traffic cannot be redirected to tunnels for forwarding.
· For visibility applications, the default tunnel configuration is incorrect.
· For TE applications, the TE tunnel configuration is incorrect.
· Fir inter-area applications, the inter-area configuration is incorrect.
To resolve the issue:
1. Identify whether the LAN interface is configured on the SeerEngine-SDWAN controller.
2. For MPLS L3VPN traffic, verify that the corresponding tunnel policy is configured in system view on the device.
#
tunnel-policy test default
select-seq strict cr-lsp lsp load-balance-number 32
#
3. After an application group is created, the SeerEngine-SDWAN controller automatically deploys the default tunnel. Traffic of the visibility applications is forwarded through this tunnel. Verify that the tunnel configuration on the device is correct and bound to correct labels.
[system]dis cur interface Tunnel
#
interface Tunnel1 mode mpls-te
ip address unnumbered interface LoopBack0
ospf 1 area 0.0.0.0
mpls enable
mpls ldp enable
mpls te signaling static
mpls te static-sr-mpls adwanLsp-0
mpls te igp shortcut
mpls te igp metric absolute 1
mpls te statistics service-class
mpls bfd echo
destination 1.2.1.1
bfd min-echo-receive-interval 1000
bfd detect-multiplier 3
#
4. Identify the tunnels to be examined based on tunnel destination addresses.
5. When a TE application group exists between two points, multiple SR-TE tunnels are issued. The service-class is not specified in the default tunnel, and the tunnel configuration does not have the mpls te service-class command configuration.
6. Query the label stack information about the path.
[system]dis cur | include "static-sr-mpls lsp"
static-sr-mpls lsp adwanLsp-0 out-label 16003
static-sr-mpls lsp adwanLsp-1 out-label 33
static-sr-mpls lsp adwanLsp-2 out-label 33
In the command output, adwanLsp-0 is the prefix SID label, which starts from 16000.
7. After a TE application group is created, the SeerEngine-SDWAN controller automatically deploys the corresponding TE tunnel. Traffic of the TE applications is forwarded through this tunnel.
[system]dis cur interface Tunnel
#
interface Tunnel2 mode mpls-te
ip address unnumbered interface LoopBack0
ospf 1 area 0.0.0.0
mpls enable
mpls ldp enable
mpls te signaling static
mpls te static-sr-mpls adwanLsp-1
mpls te service-class 1
mpls te igp shortcut
mpls te igp metric absolute 1
mpls te statistics
mpls bfd echo
destination 1.2.1.1
bfd min-echo-receive-interval 1000
bfd detect-multiplier 3
8. Identify the tunnels to be examined based on tunnel destination addresses.
9. Identify the service class marked for the application. Then, identify the TE tunnel according to the service class bound to the tunnel (mpls te service-class).
10. Query the label stack information about the path.
[system]dis cur | include "static-sr-mpls lsp"
static-sr-mpls lsp adwanLsp-0 out-label 16003
static-sr-mpls lsp adwanLsp-1 out-label 33
static-sr-mpls lsp adwanLsp-2 out-label 33
11. As shown in the command output, for LSP adwanLsp-1, the next-hop adjacency SID label is 33.
12. When common IP traffic is forwarded across areas, perform the following tasks:
¡ On the device side:
- Make sure the routes for inter-area common IP traffic forwarded through LAN interfaces are redistributed by using the network command in BGP.
- Make sure the priority of routes learned from IBGP is higher than the priority of other IGP routes, so that the next top of the traffic to the destination address is interface loopback 0 on the peer PE, and the traffic can be transmitted over the SR tunnel.
¡ On the controller side: Verify that the tunnel route-static preference 1 command is executed to redirect traffic to static routes.
Troubleshooting service traffic forwarding
This section provides troubleshooting information for common service traffic forwarding issues.
Service traffic is not forwarded according to the specified path
Symptom
After an application group is deployed as planned, traffic is not forwarded according to the specified path. The deployed path does not take effect.
Solution
The possible reason is that some configurations are improperly deployed.
To resolve the issue:
1. Identify whether the configuration on a network device conflicts with the configuration deployed by the controller.
¡ If conflicting configuration exists, delete it.
¡ If no conflicting configuration exists, proceed with the following steps.
2. When the controller is used to delete configuration, the configuration is not synchronously deleted on the device. When the controller deploys configuration again, the configuration deployment fails. In this case, contact H3C Support.
TCP-based service access failure
Symptom
When a packet is forwarded by MPLS, an MPLS header (4 bytes) is added to the packet. In the SR TE solution, multiple layers of MPLS headers might be added to the packet. As a result, the packet length is increased. If the interface MTU is not modified, the packet will be fragmented. In many TCP service packets, the FG field is set to 1 (cannot be fragmented). Therefore, some TCP packets are dropped because they cannot be fragmented.
Solution
To resolve the issue, select of the following solutions:
· Solution I: Identify whether the interconnecting WAN links between devices can transparently transmit large packets (the packet length depends on the TE hop count). If packets cannot be transparently transmitted, modify the MTU of WAN interfaces.
· Solution II: Modify the TCP MSS according to the network requirements. As a best practice, set the TCP MSS to 1300. This configuration reduces the negotiated TCP packet size, so that packets can be forwarded through MPLS without being fragmented.
¡ On an MSR/SR6600 router, execute the following commands on the incoming interface:
interface GigabitEthernet1/0
tcp mss 1300
¡ On an SR88 router, set the TCP MSS globally.
tcp modify-mss 1200
Troubleshooting branch scenarios
This section provides troubleshooting information for common branch scenario issues.
Device failure to come online through zero-touch deployment in a branch scenario
Symptom
The device cannot successfully come online through zero-touch deployment. In the controller, the device is in offline state. In this case, you need to identify whether the zero-touch deployment setup is correct on the controller, and log in to the device to troubleshoot the issue.
FYI: Procedure of device coming online
1. The controller deploys the device through the zero-touch deployment wizard, including the network configuration (Layer 3 network and Layer 2 network), O&M configuration, resource pool configuration, IPsec configuration, and authentication configuration. The device is imported to the controller through importing a device template.
2. The controller address is advertised in the user network as follows:
¡ MSTP link—The controller address must be advertised in the internal network, and redistributed to IGP routes.
¡ Internet link—The controller IP address must be mapped to the public network through NAT mirroring, with the protocol as TCP and port number as 19443.
3. The device is deployed via USB or URL to complete the basic route configuration and WebSocket configuration as follows:
¡ MSTP link—The IGP route configuration must be deployed to the WAN interface, so that the branch can learn the controller IP address through IGP. The WebSocket address is the controller’s southbound address with port number 19443.
¡ Internet link—Configure the next hop of the default route to point to the Internet egress. The WebSocket address is a public network address translated by NAT on the controller, with port number 19443.
4. The device actively establishes a WebSocket connection to the controller. The controller recognizes devices according to the imported device information, and deploys the management loopback interface IP address, SNMP configuration, and NETCONF configuration to the device.
¡ MSTP link—The management loopback interface IP address is redistributed to IGP routes corresponding to WAN interface.
¡ Internet link—Full-mesh IPsec tunnels are deployed between the Internet interfaces of the branch and HQ to protect the controller management channel. A protected flow is from the controller address to the device management interface address.
5. The controller connects to the management interface of the device through SNMP and NETCONF, and obtains the model, version, and interface information of the device. After the information is obtained, the device successfully comes online.
Solution
To resolve the issue:
1. Verify that the basic routes are normal. Verify that the device can successfully ping the controller's address (mapped public network address or internal address).
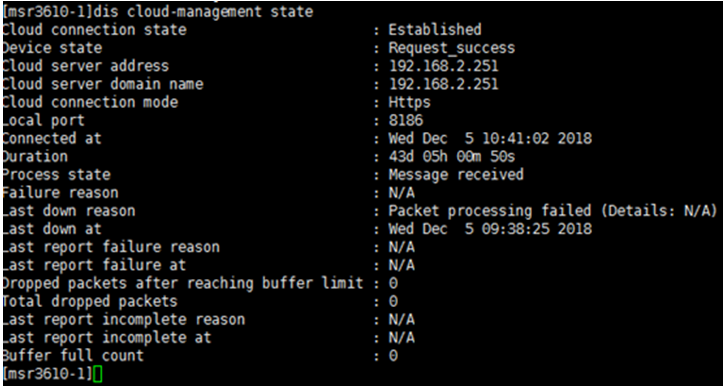
2. Examine the WebSocket connection state on the device. The following diagram shows the WebSocket connection state on the device:
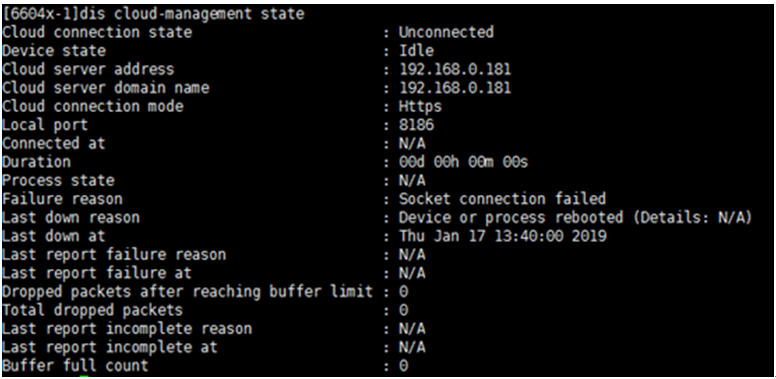
3. When the state is displayed as Unconnected, identify whether the sysname used when the controller imports the device is consistent with the device name. If they are consistent, capture packets on the controller, and identify whether the packets can reach the controller (the destination port number of the packets might be blocked along the path to the controller). The normal state is as shown in the following figure:
4. Identify whether the device management interface can reach the controller. Use the management loopback interface as the source address to ping the southbound address of the controller to identify whether the controller is reachable. If the controller is not reachable, check the related routes, and identify whether the next hop or outgoing interface of each route is correct. If a route is incorrect, manually modify the route.
5. For an Internet link, you must identify whether IPsec tunnels are established, as shown in the following diagram:
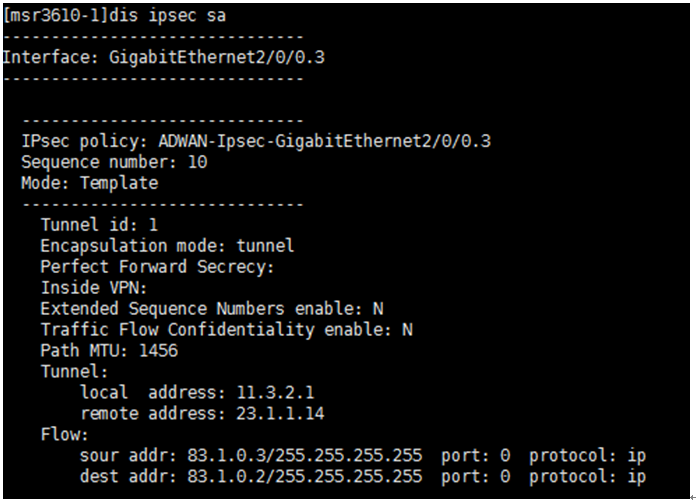
6. The Local and Remote fields represent the WAN interface addresses, and the Flow field represents the management loopback interface address and controller address.
7. Because the Internet link adds IPsec encapsulation to packets, you must configure the TCP MSS on the LAN interface of the HQ device, so that the TCP packets are not fragmented.
interface GigabitEthernet3/0/10
tcp mss 1200
VXLAN tunnel/overlay network deployment failure in a branch scenario
Symptom
When you query the overlay network on the topology page, the link information cannot be queried. Or, the corresponding tunnel information cannot be queried on the Policy > VPN > VXLAN Tunnels page. After the controller deploys VXLAN tunnels, the device will use VSI addresses to establish BGP peer relationships. As a result, the BGP peer relationships cannot be established because VXLAN tunnels are not deployed.
Solution
To resolve the issue:
1. Access the Wizard > Configuration Wizards > Zero-Touch Deployment Setup page, and configure resource pools. Identify whether the resource pool configuration can meet the VXLAN tunnel deployment requirements. The resource pools include:
¡ Tunnel encapsulation address pool—Whether the pool is enough for allocating one encapsulation address to each tunnel on each device.
¡ VSI interface address pool—For MPLS links, each tunnel uses a network segment with a 30-bit mask, and each VPN has a network segment. For Internet links, all VXLAN VPNs accessing the same cloud are in one subnet, which uses a network segment with a 23-bit mask currently. Make sure the resource pool can meet the address allocation requirements.
2. Verify that the controller properly deploys the BGP route configuration:
#
bgp 1000
peer 110.3.2.2 as-number 1003
peer 110.3.2.2 connect-interface Vsi-interface11
peer 110.3.2.3 as-number 1004
peer 110.3.2.3 connect-interface Vsi-interface11
peer 110.3.6.2 as-number 1004
peer 110.3.6.2 connect-interface Vsi-interface10
peer 110.3.6.4 as-number 1003
peer 110.3.6.4 connect-interface Vsi-interface10
#
address-family ipv4 unicast
balance 8
balance as-path-relax
preference 5 255 255
import-route direct route-policy b0faf245-8826-401e-8cfe-29791f072b84
import-route static route-policy b0faf245-8826-401e-8cfe-29791f072b84
import-route rip all-processes route-policy b0faf245-8826-401e-8cfe-29791f072b84
import-route ospf all-processes route-policy b0faf245-8826-401e-8cfe-29791f072b84
import-route isis all-processes route-policy b0faf245-8826-401e-8cfe-29791f072b84
peer 110.3.2.2 enable
peer 110.3.2.2 next-hop-local
peer 110.3.2.3 enable
peer 110.3.2.3 next-hop-local
peer 110.3.6.2 enable
peer 110.3.6.2 next-hop-local
peer 110.3.6.4 enable
peer 110.3.6.4 next-hop-local
3. Display the BGP peer relationship status, and verify that all peer relationships are successfully established.
<Hub1> display bgp peer ipv4
BGP local router ID: 192.168.30.140
Local AS number: 1000
Total number of peers: 4 Peers in established state: 4
* - Dynamically created peer
Peer AS MsgRcvd MsgSent OutQ PrefRcv Up/Down State
110.3.2.2 1003 1520 1780 0 5 23:52:53 Established
110.3.2.3 1004 1873 1572 0 5 23:52:54 Established
110.3.6.2 1004 1983 1988 0 5 0025h50m Established
110.3.6.4 1003 1842 1846 0 5 0025h50m Established
4. If a peer relationship fails to be established, use the ping command to identify whether the corresponding VSI interfaces can reach each other.
<Hub1> ping 110.3.2.2
Ping 110.3.2.2 (110.3.2.2): 56 data bytes, press CTRL+C to break
56 bytes from 110.3.2.2: icmp_seq=0 ttl=255 time=1.114 ms
56 bytes from 110.3.2.2: icmp_seq=1 ttl=255 time=0.555 ms
56 bytes from 110.3.2.2: icmp_seq=2 ttl=255 time=0.520 ms
56 bytes from 110.3.2.2: icmp_seq=3 ttl=255 time=0.523 ms
56 bytes from 110.3.2.2: icmp_seq=4 ttl=255 time=0.559 m
5. If the ping operation fails, identify whether the tunnel encapsulation addresses can be pinged, with the source address as the tunnel source address and the destination address as the tunnel destination address.
interface Tunnel3 mode vxlan
description ADWAN-Tunnel-3
source 110.2.0.5
destination 110.2.0.6
rir role server
#
<Hub1> ping -a 110.2.0.5 110.2.0.6
Ping 110.2.0.6 (110.2.0.6) from 110.2.0.5: 56 data bytes, press CTRL+C to break
56 bytes from 110.2.0.6: icmp_seq=0 ttl=255 time=0.620 ms
56 bytes from 110.2.0.6: icmp_seq=1 ttl=255 time=0.600 ms
56 bytes from 110.2.0.6: icmp_seq=2 ttl=255 time=0.443 ms
56 bytes from 110.2.0.6: icmp_seq=3 ttl=255 time=0.436 ms
56 bytes from 110.2.0.6: icmp_seq=4 ttl=255 time=0.544 ms
6. If the ping operation fails, find the route of the destination address, and identify whether the next hop and outgoing interface of the route are correct.
<Hub1>display ip routing-table 110.2.0.6
Summary count : 3
Destination/Mask Proto Pre Cost NextHop Interface
0.0.0.0/0 Static 60 0 110.1.1.2 GE3/0/0
Static 60 0 110.1.2.2 GE3/0/1
110.2.0.6/32 Static 1 0 110.1.1.2 GE3/0/0
7. The controller will automatically deploys static routes, with the destination addresses as the tunnel encapsulation addresses of the peers and the next hops as the public network outgoing interfaces. Identify whether the deployed routes are correct. If a route is abnormal, verify that the imported data on the topology is correct.
ip route-static 110.2.0.2 32 110.1.2.2 preference 1
ip route-static 110.2.0.4 32 110.1.2.2 preference 1
ip route-static 110.2.0.6 32 110.1.1.2 preference 1
ip route-static 110.2.0.7 32 110.1.1.2 preference 1
Application group TE failure and traffic forwarding anomaly in a branch scenario
Symptom
After application groups are created in the branch scenario, application group TE does not take effect and traffic cannot be forwarded between the branch and the HQ.
Solution
Identify whether applications are colored properly
1. Identify whether packets match defined applications. Execute the following command to view the ACL match conditions. If no packets match defined applications, identify whether the defined applications are correct.
[Hub1]display acl all
Advanced IPv4 ACL named ADWAN-ACL-PBRGigabitEthernet3/0/0, 1 rule,
ACL's step is 5
rule 0 permit ip source 110.1.1.1 0
Advanced IPv4 ACL named ADWAN-ACL-PBRGigabitEthernet3/0/1, 1 rule,
ACL's step is 5
rule 0 permit ip source 110.1.2.1 0
Advanced IPv4 ACL named ACL-71a9d989-29eb-4b3c-b801-445a2c327e28, 2 rules,
ACL's step is 5
rule 0 permit ip source 10.1.1.0 0.0.0.255 (714 times matched)
rule 1 permit ip destination 10.1.1.0 0.0.0.255
2. Display the QoS policies applied to the LAN interfaces. Identify the flow IDs marked for packets after packets match ACLs. For example, as shown in the following command output, flow ID 1 is marked for packets matching the ACL named ACL-71a9d989-29eb-4b3c-b801-445a2c327e28.
[Hub1]dis qos policy interface GigabitEthernet 3/0/3
Interface: GigabitEthernet3/0/3
Direction: Inbound
Policy: ADWAN-QPInGE3/0/3
Classifier: trafficClassifier10
Matched : 1840384 (Packets) 228206692 (Bytes)
5-minute statistics:
Forwarded: 5511/5467656 (pps/bps)
Dropped : 0/0 (pps/bps)
Operator: OR
Rule(s) :
If-match acl name ACL-71a9d989-29eb-4b3c-b801-445a2c327e28
Behavior: trafficBehavior11
Marking:
Remark tunnel-dscp cs5
Remark flow-id 1
Identify whether traffic is redirected properly
1. Find the routes to the destination address, and identify whether traffic is forwarded by tunnels.
[Hub1]display ip routing-table 10.1.2.1
Summary count : 4
Destination/Mask Proto Pre Cost NextHop Interface
10.1.2.0/24 BGP 5 0 110.3.2.2 Vsi11
BGP 5 0 110.3.6.4 Vsi10
2. If the routes are incorrect, first examine the BGP peer relationship status. If the BGP peers are normal, identify whether traffic is redirected properly.
#
bgp 1000
#
address-family ipv4 unicast
preference 5 255 255
import-route direct route-policy b0faf245-8826-401e-8cfe-29791f072b84
import-route static route-policy b0faf245-8826-401e-8cfe-29791f072b84
import-route rip all-processes route-policy b0faf245-8826-401e-8cfe-29791f072b84
import-route ospf all-processes route-policy b0faf245-8826-401e-8cfe-29791f072b84
import-route isis all-processes route-policy b0faf245-8826-401e-8cfe-29791f072b84
3. Identify whether the PBR policies are correct.
[Hub1]display route-policy
Route-policy: b0faf245-8826-401e-8cfe-29791f072b84
Permit : 6
if-match interface LoopBack1 GigabitEthernet3/0/3 GigabitEthernet3/0/10
Route-policy: f24432a0-90a1-41ed-bcc8-5bdb03ca2028
Permit : 5
apply as-path 65535
4. Identify whether the configuration of the LAN interfaces matching the PBR policy is correct. If the LAN interface configuration is incorrect, examine the LAN interface configuration of the device on the controller.
Identify whether the link affinity profile of the flow ID is correct
1. The device deploys link affinity profiles based on flow IDs. In the command output, sla 1 through sla 5 display the quality requirements of five SLA profiles on the controller. Identify whether the quality requirements are correct.
#
rir
probe sync-port 65500
server enable
probe connect interval 1000 timeout 900
sla 1
jitter threshold 10
delay threshold 500
packet-loss threshold 1
sla 2
jitter threshold 5
delay threshold 300
packet-loss threshold 1
sla 3
jitter threshold 5
delay threshold 150
packet-loss threshold 1
sla 4
jitter threshold 5
delay threshold 100
packet-loss threshold 1
sla 5
jitter threshold 3
delay threshold 50
packet-loss threshold 1
nqa 1
probe interval 3000
probe packet-number 10
probe packet-interval 1000
probe packet-timeout 1600
probe port 10000
flow 1
path link-type internet index 2 preference 1
path link-type internet index 4 preference 2
quality-policy sla 5 nqa 1
2. A flow is configured with a preferred link and bound to and SLA quality requirements. Identify whether the deployed link affinity profiles are correct. The corresponding VSI interfaces are configured with tunnel types, which can be used as a reference for comparison.
[Hub1]display current-configuration interface Vsi-interface
#
interface Vsi-interface10
ip address 110.3.6.3 255.255.254.0
qos apply policy ADWAN-QPInVsi-interface10 inbound
rir link-type internet index 4
#
interface Vsi-interface11
ip address 110.3.2.5 255.255.254.0
qos apply policy ADWAN-QPInVsi-interface11 inbound
rir link-type internet index 2
#
Troubleshooting VXLAN VPNs
This section provides troubleshooting information for common VXLAN VPN issues.
VXLAN VPN creation failure
Symptom
After you create a VXLAN VPN, add members to the VPN, and click OK, the VXLAN VPN fails to be created, and an error message is displayed in the upper right corner of the page.
Solution
According to the error messages, possible reasons are:
· failed to get port link-mode of AC-interface() in device()—Cannot identify the link mode (route or bridge) of the AC interface.
· the port link-mode of AC-interface() is bridge, but this device() doesn't support to create service instance—The AC interface is a Layer 2 interface, but the device is a routing device, which does not support creating service instances.
· the port link-mode of AC-interface() is route, but this device() don't support to bind VSI—The AC interface is a Layer 3 interface, but the device does not support binding Layer 3 interfaces to VSIs.
· the main-AC-interface() that port link-mode is router in device() for L2VPN has been used by other vxlanVpn—The AC interface has already acted as the main interface of another VPN, and cannot generate subinterfaces any more.
· the sub-interface of AC-interface() that port link-mode is router in device() has been used by other vxlanVpn—The AC interface has already acted as the subinterface of another VPN, and cannot act as a main interface any more.
To resolve the issue:
1. If the failed to get port link-mode of AC-interface() in device() message appears:
a. Access the Network > Inventory > Devices page.
b. Click the Devices tab.
c. In the Actions column, click the ![]() icon
for the device, and select Synchronize. Then, the controller will read
the interface mode of the device again.
icon
for the device, and select Synchronize. Then, the controller will read
the interface mode of the device again.
2. If the the port link-mode of AC-interface() is bridge, but this device() doesn't support to create service instance message appears, perform one of the following tasks on the device:
¡ Switch the link mode of the interface to route.
¡ Select another Layer 3 interface for creating the VPN.
3. If the the port link-mode of AC-interface() is route, but this device() don't support to bind VSI message appears, perform one of the following tasks on the device:
¡ Switch the link mode of the interface to bridge.
¡ Select another Layer 2 interface for creating the VPN.
4. If the the main-AC-interface() that port link-mode is router in device() for L2VPN has been used by other vxlanVpn message appears, perform one of the following tasks:
¡ Replace an interface.
¡ Delete the VPN that uses the AC interface as the main interface.
5. If the the sub-interface of AC-interface() that port link-mode is router in device() has been used by other vxlanVpn message appears, perform one of the following tasks:
¡ Replace an interface.
¡ Delete the VPN that uses the AC interface as the subinterface.
6. If the issue persists, contact H3C Support.
VXLAN VPN member creation failure
Symptom
After a VXLAN VPN is created, click the View button for the VXLAN VPN on the VXLAN management page. The VPN member state is displayed as Creation Failed.
Solution
Possible reasons are:
· The VXLAN ID already exists on the device.
· The generated VLAN ID for VLAN termination by subinterface has been terminated by another subinterface on the current main interface.
· The VLAN ID matched by the service instance already exists on another service instance.
To resolve the issue:
1. Check for the conflicting VXLAN ID, and manually delete the conflicting VXLAN ID. Alternatively, modify the VXLAN ID of the VPN. Then, remove the members and add members again.
2. Check for the conflicting VLAN ID for termination, and manually delete the VLAN ID. Alternatively, modify the VLAN ID for termination on the subinterface. Then, remove the members and add members again.
3. Check for the conflicting VLAN ID matched by the service instance, and manually delete the conflicting configuration. Alternatively, modify the VLAN ID of the service instance generated by the VXLAN. Then, remove the members and add members again.
4. If the issue persists, contact H3C Support.
VXLAN VPN member status anomaly
Symptom
After a VXLAN VPN is created, view the VPN member status. The status of some VPN members is abnormal.
Solution
Possible reasons are the controller is rebooted abnormally, the network connection fails, or devices are not online. As a result, a VPN member might stay in the Creating, Creation Failed, Updating, Update Failed, Deleting, or Delete Failed state.
To resolve the issue:
1. On the top navigation bar, click Network.
2. From the navigation pane, select Inventory > Devices.
3. Identify whether devices have come online properly. The status icon for a device operating properly is green. If devices have not come online properly, perform tasks as described in “Failure of a device to come online.”
4. Try to delete a VXLAN member. Identify whether the member can be deleted correctly.
5. If the issue persists, try to delete the VXLAN.
6. If deleting the VXLAN failed, delete all devices in the VXLAN on the Network > Inventory > Devices page. Then, the system will automatically delete the VXLAN.
Perform this task with caution because all data related to these devices will be cleared.
7. If the issue persists, contact H3C Support.
Traffic forwarding failure after VXLAN VPN creation
Symptom
Traffic cannot be forwarded properly after a VXLAN VPN is successfully created.
Solution
Possible reasons are:
· The tunnel interface is down on the device.
· The AC interface is down on the device.
· The tunnel source address and destination address cannot reach each other.
· Related VLAN configuration does not exist on the device or an interface is isolated by a VLAN.
· The local VLAN in the VLAN tag replacement policy for a VPN member is different from the actual VLAN of the user.
To resolve the issue:
1. Identify whether the AC interface is down on the device. If the AC interface is down, execute the undo shutdown command to bring up the interface.
2. Use the ping command to identify whether the tunnel source address and destination address can reach each other. If they cannot reach each other, verify that the network connectivity is normal.
3. Identify whether the device is configured with VLANs matching the VXLAN, and identify whether the device interfaces are assigned to the VLANs matching the VXLAN.
4. Identify whether the VLAN of a VPN user and the local VLAN in the VLAN tag replacement policy for a VXLAN member are the same. If they are different, modify the local VLAN in the VLAN tag replacement policy on the Policy > VPN > VXLANs > Manage VXLANs page.
5. If the issue persists, contact H3C Support.
Gray VPN links
Symptom
After a VXLAN VPN is created, view the VXLAN VPN links on the Topology page. The VPN links are gray.
Solution
Possible reasons are:
· The tunnel interface is down.
· Data on the controller is inconsistent with the device data.
To resolve the issue:
1. Use the ping command to identify whether the tunnel source address and destination address can reach each other. If they cannot reach each other, verify that the network connectivity is normal.
2. Configure the controller to read information about the device again:
a. On the top navigation bar, click Network.
b. From the navigation pane, select Inventory > Devices to enter the device management page.
c. Click the Devices tab.
d. In the Actions column, click the icon for the device, and select Synchronize.
3. If the issue persists, contact H3C Support.
Troubleshooting the dashboard
This section provides troubleshooting information for common dashboard issues.
Link bandwidth statistics anomaly
Symptom
When you click a link on the Topology page, the real-time bandwidth of the link is displayed as two hyphens (--).
Solution
Possible reasons are:
· The source device of the link does not have SNMP configuration or has SNMP configuration errors.
· The source device of the link does not have NETCONF configuration or has NETCONF configuration errors.
· The SeerEngine-SDWAN controller and the device cannot reach each other at Layer 3.
To resolve the issue:
1. Identify whether the SNMP configuration is correct on the source device of the link.
¡ If the configuration is correct, proceed with the following steps.
¡ If the configuration is incorrect, execute the following commands at the CLI of the device:
<H3C> system-view
[H3C] snmp-agent
2. Identify whether the NETCONF configuration is correct on the source device of the link.
¡ If the configuration is correct, proceed with the following steps.
¡ If the configuration is incorrect, execute the following commands at the CLI of the device:
<H3C> system-view
[H3C] netconf soap http enable
[H3C] netconf soap https enable
[H3C] netconf ssh server enable
[H3C] line vty 0 4
[H3C-line-vty0-4] authentication-mode scheme
[H3C-line-vty0-4] user-role network-operator
3. Use the ping command to identify whether the source device of the link and the controller can communicate properly.
¡ If they can communicate properly, proceed with the following steps.
¡ If they cannot communicate properly, troubleshoot the network.
4. Add the link again:
a. On the top navigation bar, click Network.
b. From the navigation pane, select Networking > Physical Links.
c. In the Actions column, click the ![]() icon
for the failed link, and select Delete.
icon
for the failed link, and select Delete.
d. After the link is successfully deleted, click Add in the upper right corner to add the link again.
5. If the issue persists, contact H3C Support.
Link quality statistics anomaly
Symptom
When you click a link on the Topology page, the link quality (including latency, jitter, and packet loss rate) of the link is displayed as two hyphens (--).
Solution
Possible reasons are:
· The source device of the link does not have SNMP configuration or has SNMP configuration errors.
· The source device of the link does not have NETCONF configuration or has NETCONF configuration errors.
· The SeerEngine-SDWAN controller and the device cannot reach each other at Layer 3.
To resolve the issue:
1. Identify whether the SNMP configuration is correct on the source device of the link.
¡ If the configuration is correct, proceed with the following steps.
¡ If the configuration is incorrect, execute the following commands at the CLI of the device:
<H3C> system-view
[H3C] snmp-agent
2. Identify whether the NETCONF configuration is correct on the source device of the link.
¡ If the configuration is correct, proceed with the following steps.
¡ If the configuration is incorrect, execute the following commands at the CLI of the device:
<H3C> system-view
[H3C] netconf soap http enable
[H3C] netconf soap https enable
[H3C] netconf ssh server enable
[H3C] line vty 0 4
[H3C-line-vty0-4] authentication-mode scheme
[H3C-line-vty0-4] user-role network-operator
3. Use the ping command to identify whether the source device of the link and the controller can communicate properly.
¡ If they can communicate properly, proceed with the following steps.
¡ If they cannot communicate properly, troubleshoot the network.
4. Add the link again:
a. On the top navigation bar, click Network.
b. From the navigation pane, select Networking > Physical Links.
c. In the Actions column, click the ![]() icon
for the failed link, and select Delete.
icon
for the failed link, and select Delete.
d. After the link is successfully deleted, click Add in the upper right corner to add the link again.
5. If the issue persists, contact H3C Support.
Quality sampling statistics errors
Symptom
When you click a link on the Topology page, the link quality statistics (including latency, jitter, and packet loss rate) displayed are different from the actual quality statistics.
Solution
Possible reasons are:
· The current controller configuration is imported data first.
· The NQA detection granularity is incorrect.
· The statistics on the device are incorrect.
To resolve the issue:
1. Check for the source of the link quality statistics displayed on the controller. Open the operations/oam:get-global-config file of the RESTCONF background to examine the value of the dataSource parameter.
¡ 0—Collected data first.
¡ 1—Imported data first.
¡ 2—Bandwidth imported and quality collected.
¡ 3—Quality imported and bandwidth collected.
If the data source is not set to 0 (collected data first) in the current controller configuration, set the data source to 0 (collected data first).
2. After a link is discovered in a carrier network, the controller will deploy NQA configuration to detect the per-priority link quality (including latency, jitter, and packet loss rate) of each link. For different O&M metric granularities, the deployed NQA parameters are different, and the detection granularities are different. To identify whether the quality sampling parameters are correctly configured:
a. On the top navigation bar, click System.
b. From the navigation pane, select System Settings > O&M.
c. Click the O&M tab, and identify whether the quality sampling parameters are correctly configured.
3. Identify whether the NQA detection results are correct by executing the following commands at the CLI of the device:
<H3C> system-view
[H3C] display nqa result
4. Examine the NQA detection results on the device. If the results are incorrect, troubleshoot the device.
5. If the issue persists, contact H3C Support.
Application group bandwidth statistics anomaly
Symptom
The application group bandwidth statistics are 0 or very small, and are different from the actual traffic bandwidth.
Solution
Possible reasons are:
· No applications are added to the application group.
· The applications in the application group cannot match actual traffic.
· The incoming interface of the actual traffic on the source device of the application group network scope is not configured as a LAN interface.
· The SeerEngine-SDWAN controller and the device cannot reach each other at Layer 3.
· The source device of the application group network scope does not have NETCONF configuration. As a result, NetStream configuration fails to be deployed.
To resolve the issue:
1. On the top navigation bar, click Policy.
2. From the navigation pane, select Applications > Application Groups.
3. Identify whether the application group has applications.
¡ If the application group does not have applications, add applications to the application group as follows:
- Access the Policy > Applications > Application Groups page.
- In the Actions column, click the ![]() icon
for the application group, and select Edit.
icon
for the application group, and select Edit.
- On the page that opens, click Add in the Application List column to define applications, and click Select to add the newly added applications to the application group.
¡ If the application group has applications, proceed with the following steps.
4. Identify whether the applications in the application group can match actual traffic.
¡ If the applications cannot match the actual traffic, modify the match rules of applications as follows:
- Access the Policy > Applications > Application Groups > Custom Application page.
- In the Actions column, click the ![]() icon
for an application, and select Edit.
icon
for an application, and select Edit.
- In the Application Match List column, edit the application match rules.
¡ If the applications can match traffic, proceed with the following steps.
5. Identify whether the incoming interface of the actual traffic on the source device of the application group is configured as a LAN interface.
¡ If the interface is not configured as a LAN interface, perform the following tasks:
- Access the Network > Inventory > Devices page.
- Click the Interfaces tab.
- Select a device from the Device Name list. In the Actions column of the interface list, click the ![]() icon for an interface, and select Edit.
icon for an interface, and select Edit.
- On the Edit Interface dialog box that opens, configure the access network as a LAN.
¡ If the interface is configured as a LAN interface, proceed with the following steps.
6. Use the ping command to identify whether the source device of the link and the controller can communicate properly.
¡ If the communication fails, troubleshoot the network.
¡ If the communication succeeds, proceed with the following steps.
7. Identify whether the NETCONF configuration is correct on the source device of the link.
¡ If the configuration is correct, proceed with the following steps.
¡ If the configuration is incorrect, execute the following commands at the CLI of the device:
<H3C> system-view
[H3C] netconf soap http enable
[H3C] netconf soap https enable
[H3C] netconf ssh server enable
[H3C] line vty 0 4
[H3C-line-vty0-4] authentication-mode scheme
[H3C-line-vty0-4] user-role network-operator
8. If the issue persists, contact H3C Support.
Application group bandwidth statistics exceeds the actual bandwidth
Symptom
The carrier network application group bandwidth statistics are higher than the actual traffic bandwidth.
Solution
The possible reason is that the application group has multiple applications, and rules of some applications are the same or overlap.
To resolve the issue:
1. Identify whether the application group has multiple applications and rules of some applications are the same or overlap.
2. If the application group has multiple applications and rules of some applications are the same or overlap, delete the applications with the same or overlapping rules.
3. If the issue persists, contact H3C Support.
Application statistics anomaly on a link
Symptom
No application group traffic statistics exist or the bandwidth statistics are 0 on a link.
Solution
Possible reasons are:
· The path planned by the application group does not contain the link. Therefore, no traffic passes through the link.
· The SeerEngine-SDWAN controller and the device cannot reach each other at Layer 3.
· The source device of the application group network scope does not have NETCONF configuration. As a result, data collection fails.
To resolve the issue:
1. Identify whether the path of the application contains the link.
¡ If the path does not contain the link, this issue is normal.
¡ If the path contains the link, proceed with the following steps.
2. Use the ping command to identify whether the source device of the link and the controller can communicate properly.
¡ If the communication fails, troubleshoot the network.
¡ If the communication succeeds, proceed with the following steps.
3. Identify whether the NETCONF configuration is correct on the source device of the link.
¡ If the configuration is correct, proceed with the following steps.
¡ If the configuration is incorrect, execute the following commands at the CLI of the device:
<H3C> system-view
[H3C] netconf soap http enable
[H3C] netconf soap https enable
[H3C] netconf ssh server enable
[H3C] line vty 0 4
[H3C-line-vty0-4] authentication-mode scheme
[H3C-line-vty0-4] user-role network-operator
4. If the issue persists, contact H3C Support.
Application rate limiting failure
Symptom
After application rate limiting is enabled, rate limiting does not take effect.
Solution
1. Identify whether the defined application to be rate-limited matches the actual traffic. The rate limiting configuration takes effect only on defined applications in the application group. If the defined application to be rate-limited does not match the actual traffic, re-defined applications according to the actual traffic.
2. On the corresponding device, identify whether the rate limiting configuration is deployed by the controller successfully and the deployed configuration is correct. If an error occurs, modify the rate limit value and deploy the configuration again. For the configuration to be successfully deployed, make sure the rate limit value is within the range supported by the device.
The application rate limiting configuration is as follows:
#
traffic classifier trafficClassifier10 operator or
if-match acl name ACL-2a2994e0-2338-4f66-acdb-7d6420465905
#
traffic behavior trafficBehavior0
remark mpls-exp 5
remark service-class 1
car cir 10000 cbs 625000 ebs 0 green pass red discard yellow pass
#
qos policy ADWAN-QPInXGE2/1/5.1
classifier trafficClassifier10 behavior trafficBehavior0
#
acl advanced name ACL-2a2994e0-2338-4f66-acdb-7d6420465905
In the configuration:
¡ The car cir 10000 cbs 625000 ebs 0 green pass red discard yellow pass command configures the rate limit as 10000 kbps.
¡ The acl advanced name ACL-2a2994e0-2338-4f66-acdb-7d6420465905 command configures the corresponding application match rule.
¡ The qos policy ADWAN-QPInXGE2/1/5.1 command applies a QoS policy to the LAN interface.
3. If the issue persists, contact H3C Support.
No response on the history information pages
Symptom
The link, device, and application history information pages do not respond.
Solution
Possible reasons are:
· The MongoDB database is not started.
· The MongoDB database conflicts.
To resolve the issue:
1. When the cluster is stable, execute the following command on any Matrix server to determine the master controller.
kubectl get all -n adwan-systemsdwan -o wide

2. Enter the container of the master controller. Input the actual master controller container ID in the shaded parameter.
kubectl exec -it -n sdwan sdwan-node1-7b468668fd-pzcp9 /bin/bash

3. Execute the ps -aux | grep mongodb command at the CLI to identify whether the MongoDB process is started.
¡ If the output is as shown in Figure 7, the MongoDB database has been started.
¡ If the MongoDB database is not started, enter the /opt/mongodb-linux/bin path, and execute the ./mongod --port 27017 --dbpath /opt/db command to start the MongoDB database.
Figure 7 The MongoDB database is started successfully
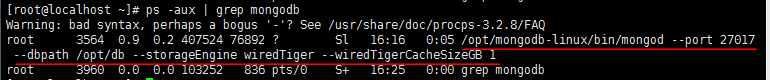
4. Identify whether the MongoDB database is installed in the default installation path /opt/mongodb-linux/. If the MongoDB database has been installed in any other path, uninstall the MongoDB database and install the MongoDB database again.
5. If the issue persists, shut down the SeerEngine-SDWAN controller, and identify whether the MongoDB process is shut down. If the MongoDB process is not shut down a long time after the H3C SeerEngine-SDWAN controller is shut down, shut down MongoDB process, and restart the H3C SeerEngine-SDWAN controller.
6. If the issue persists, contact H3C Support.
History statistics anomaly
Symptom
The history information page displays only the history information within the most recent 0 to 3 hours. When the time range selected is longer than 3 hours, the history information beyond 3 hours cannot be displayed.
Solution
The possible reason is that the system time of the SeerEngine-SDWAN controller was modified to an earlier time and then modified to the correct time.
To resolve the issue:
1. Enter the master controller as described in “No response on the history information pages.”
2. Enter the following commands at the console of the SeerEngine-SDWAN controller:
root@localhost:~$ /opt/mongodb-linux/bin/mongo
> use OAM
> db.RecordLastTime.drop()
> exit
3. If the issue persists, contact H3C Support.
Troubleshooting product licensing
This section provides troubleshooting information for common licensing issues.
Failure to obtain the device information file
Symptom
When you click Export on the Licenses page to obtain the device information file, the file cannot be exported properly.
Solution
A possible reason is that an exception occurs to obtaining the system file resources during the process of generating the device information file.
To resolve the issue:
1. Restart the H3C SeerEngine-SDWAN controller.
Restarting the controller will cause service interruption. Perform this operation with caution.
2. If the issue persists, contact H3C Support.
Prompting invalid license file during license file registration
Symptom
When the license file is registered on the System > Licenses page, the system prompts that the license file is invalid.
Solution
Possible reasons are:
· The license file to be registered is not requested for the current H3C SeerEngine-SDWAN controller.
· The hardware (for example, NIC) of the server where the SeerEngine-SDWAN controller is installed has been replaced.
To resolve the issue:
1. Request a new license file for the current H3C SeerEngine-SDWAN controller.
2. If the issue persists, contact H3C Support.
Trial license expires and becomes invalid
Symptom
In the H3C SeerEngine-SDWAN controller, the temporary (trial) license has been installed and the controller operates properly. After a period of time, when the controller is managing devices, the controller prompts that it cannot obtain valid license information. For example, newly added devices cannot come online because no license is available.
Solution
A possible reason is that the trial license expires and becomes invalid, and cannot be used any more.
To resolve the issue:
1. Access the System > Licenses page. On the Activation Files tab, view the license status information. The Expired state means the corresponding license has expired. If no license is in the In use state, all licenses installed in the current system are unavailable.
2. Request a new license file for the H3C SeerEngine-SDWAN controller and install the license file.
3. If the issue persists, contact H3C Support.
Troubleshooting MongoDB cluster synchronization
This section provides troubleshooting information for common MongoDB cluster synchronization issues.
Initial cluster setup failure
Symptom
After the controller cluster is started, the MongoDB cluster cannot be established. View the related logs in the /opt/WAN_APP1000/data/log directory. The message has data already, cannot initiate set. All members except initiator must be empty exists.
Solution
The possible reason is that more than one of the controllers in the cluster have non-empty MongoDB databases.
To resolve the issue:
1. When the cluster is stable, execute the following command on any Matrix server to determine the master controller.
kubectl get all -n adwan-systemsdwan -o wide

2. Enter the container of the master controller. Input the actual master controller container ID in the shaded parameter.
kubectl exec -it -n sdwan sdwan-node1-7b468668fd-pzcp9 /bin/bash

3. Repeat the steps above to enter each controller and identify whether data exists in the MongoDB database file /opt/db. Make sure that no more than one controller has non-empty MongoDB databases.
4. If the issue persists, contact H3C Support.
Related data cannot be displayed on the secondary controller after the controller cluster is established
Symptom
After the controller cluster is established, the TE history and O&M data (for example, data and link information) cannot be displayed on the OM or topology page of the secondary controller.
Solution
The possible reason is that data synchronization between the primary controller and secondary controller has not completed.
To resolve the issue:
1. Enter the master controller as described in “Initial cluster setup failure.”
2. Enter the following commands at the console of the primary controller to view the member status:

3. Use the rs.status() command to identify whether the stateStr value of each MongoDB member (identified by _id) is PRIMARY or SECONDARY. PRIMARY means the controller is the primary controller, and SECONDARY means the controller is a secondary controller. If the stateStr value is any other value, database synchronization between the members has not completed. Try again later.
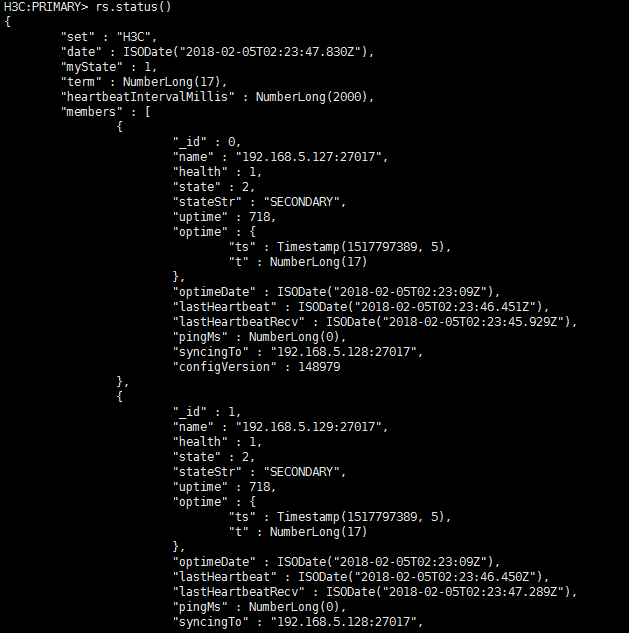
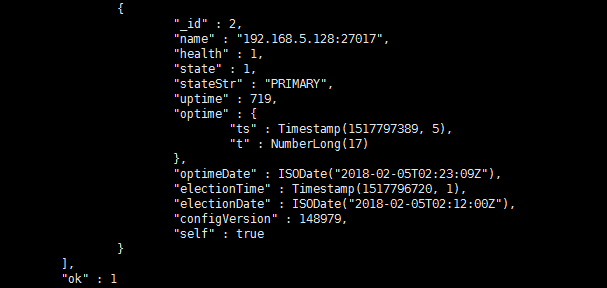
4. If the issue persists, contact H3C Support.
Related data cannot be displayed on the primary and secondary controllers after the controller cluster is established
Symptom
After the controller cluster is established, the primary and secondary controllers are in normal state, and databases contain data. However, the data cannot be displayed on the GUI.
Solution
The possible reason is that the data written into the database has errors. For example:
· Data is manually constructed in the database, but the constructed data has errors.
· When the controller writes data into the MongoDB database, the system does not distinguish the primary and secondary controllers. As a result, the secondary controller writes incorrect data into the database. In normal conditions, only the primary controller can write data into the database. Therefore, data errors might occur and data is displayed abnormally.
To resolve the issue:
1. Enter the master controller as described in “Initial cluster setup failure.”
2. When the SeerEngine-SDWAN controller is started, enter the database to view the TE logs, for example.
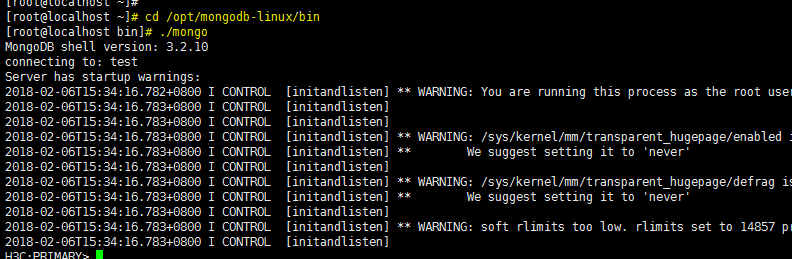
3. Execute the following commands to view the database-related information:
¡ show dbs: Displays all databases.
¡ use ADJUSTLOG_DATA: Uses the TE log database.
¡ show collections: Displays the data collections in databases.
¡ db.COLLECTION_ALL.find(): Displays the data in a data collection in the database.
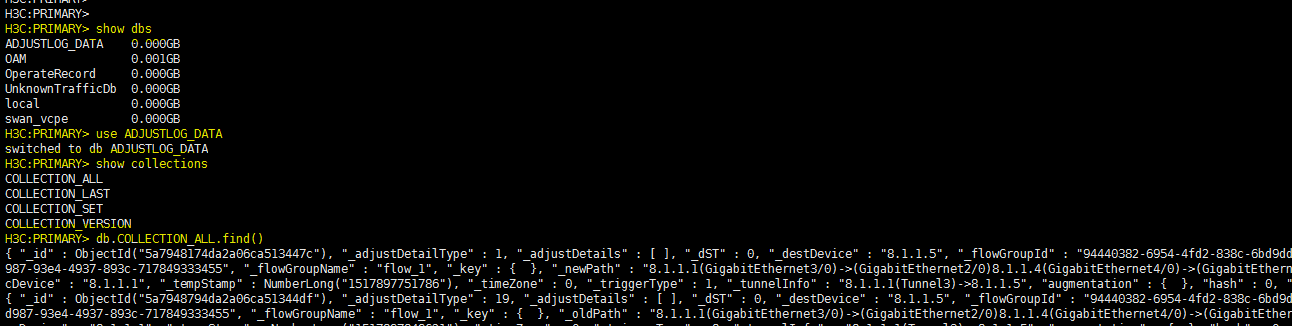
4. Identify whether the data saved in the database is correct. Identify whether a record is inserted multiple times at the same time, and the parameters of these entries are all -1. If yes, the record cannot be read. For example:
{"_id":ObjectId("5a6937114da2a048637993b7"),"uuid":"0763f161-e68a-4593-85ec-ee77e1afe5e4", "delay" : NumberLong(-1), "jitter" : NumberLong(-1), "packageLossRate" : -1, "timeStamp" : NumberLong("1516844760000"), "bandwidth" : NumberLong(-1), "bandwidthPercentage" : NumberLong(-1), "flowGroupsBandwidthList" : [ ] }
5. If the SeerEngine-SDWAN controller is not started, the database is also not started. In this case, you can execute the following command to manually start the database, and execute the commands above to view the database information. When starting the database, make sure the database directory and port number are correct.
![]()
6. If the issue persists contact H3C Support.
Long big data synchronization time in a database cluster
Symptom
When the MongoDB cluster is initially established, the secondary database is empty. Therefore, the primary database will synchronize all its data to the secondary database. If the primary database has a large amount of data, the data synchronization takes a long time. During the data synchronization process, the secondary database stays in the STARTUP2 state. As a result, the MongoDB-related services on the controller are unavailable temporarily.
Take the TE log database as an example. When the number of TE logs reaches 10 million, the TE log size is about 1.1GB, as shown in Figure 3. In this case, the data synchronization time between the primary and secondary MongoDB databases is about 10 minutes. During the synchronization process, the secondary database stays in the STARTUP2 state, as shown in Figure 4. After data synchronization is complete, the secondary database state becomes SECONDARY.
NOTE: A database in STARTUP2 state is unavailable, and database in SECONDARY state is available.
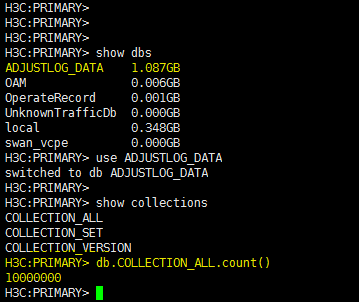
Figure 9 Secondary database state during the data synchronization process
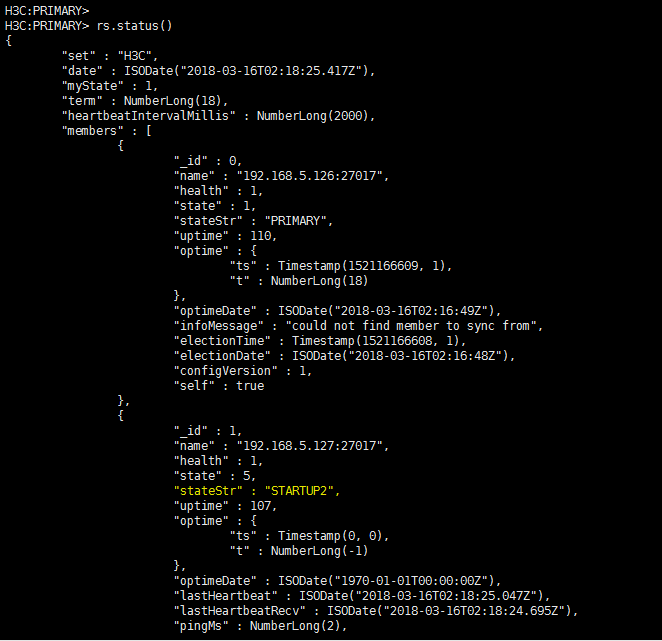
Solution
You can manually synchronize the data to fasten the data synchronization progress.
To resolve the issue:
1. Start the MongoDB cluster, and execute the ps -ef | grep mongo command to identify whether the MongoDB cluster progress is properly started.
Figure 10 Viewing the MongoDB cluster process
![]()
2. Verify that the MongoDB cluster process is started.
3. Enter the master controller as described in “Initial cluster setup failure.”
4. Execute the following commands to enter the MongoDB client and view the database state. If the state of each secondary MongoDB database is STARTUP2, the cluster is successfully established.
Figure 11 Enter the database client and view the database status
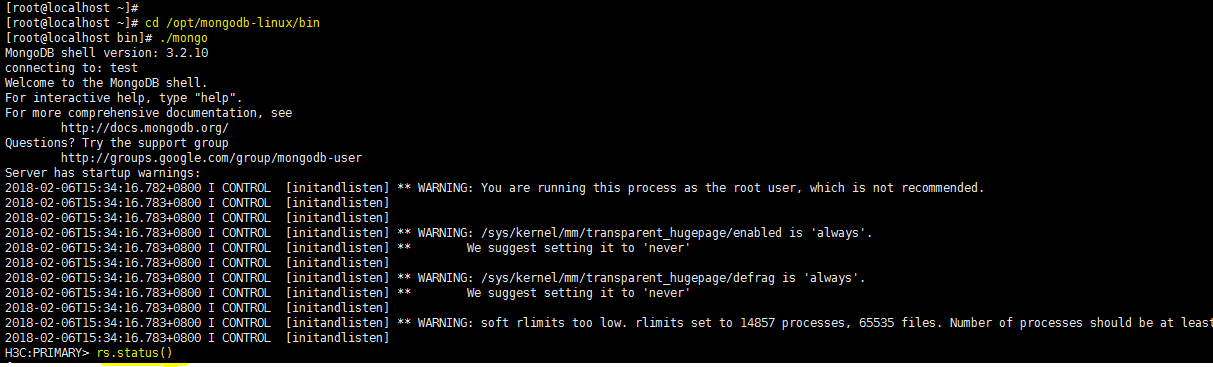
5. Execute the adwan stop command to stop all controllers in the cluster.
6. Delete the /opt/db folder of the secondary MongoDB database, or modify the folder name.
7. Copy the /opt/db folder of the primary MongoDB database to the folder (/opt) of each secondary database.
8. Start all controllers in the cluster.
9. If the issue persists, contact H3C Support.
Troubleshooting controller operations
This section provides troubleshooting information for common controller operation issues.
Abnormal exit of the controller due to insufficient disk space
Symptom
The SeerEngine-SDWAN controller exits abnormally, and cannot be restarted. The disk usage reaches 100%, and no free space is available. The system will save the diagnosis logs about abnormal exit to the /opt/adwan-backup/ruptlog directory.
Solution
When the disk usage exceeds 80%, the system will send an alarm about insufficient disk space. In this case, you should promptly clear the disk to release the space or expand the disk capacity to avoid influence on the controller operation. When the disk space is insufficient, the controller will exit abnormally and cannot be restarted. Restarting the controller might also damage the data file in the /opt/WAN_APP1000/data directory. After the file is damaged, the controller cannot be started even if the disk space is sufficient.
To resolve the issue:
1. When the cluster is stable, execute the following command on any Matrix server to determine the master controller.
kubectl get all -n adwan-systemsdwan -o wide
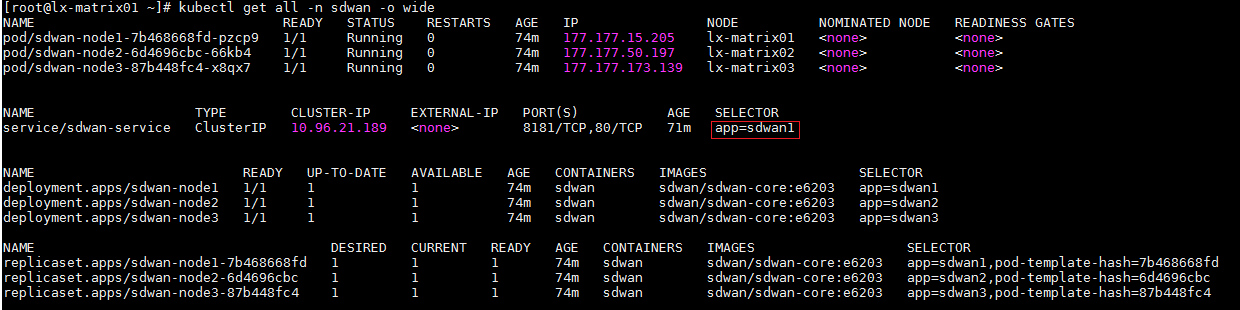
2. Execute the following command to enter the master controller container. Input the actual master controller container ID in the shaded parameter.
kubectl exec -it -n sdwan sdwan-node1-7b468668fd-pzcp9 /bin/bash

3. Use the adwan stop command to stop the controller, and then clear the system disk space. For example, during the upgrade process of the controller, the original data and configuration of the controller will be saved in the corresponding directories in the /opt/adwan-backup directory. After multiple upgrades, there might be multiple backup files. You can manually clear some old backup files in the backup directory as needed to release the disk space. As a best practice, make sure the disk has a free space ratio of 20%.
4. After clearing the disk space, use the adwan start command to start the controller again.
5. If the controller cannot be started, the possible reason is that the data file is damaged. In this case, delete the data, lock, and cache files in the /opt/WAN_APP1000 directory, and try again.
6. If the issue persists, contact H3C Support.
Normal exit failure of the controller due to inexistence of port files
Symptom
After the adwan stop command is executed on a controller, the controller cannot exit normally, and the system displays a message showing /opt/WAN_APP1000/data/port shutdown port file doesn't exist. The container is not running.
Solution
The possible reason is that the user incorrectly modifies the contents of the hosts file in the /etc directory of the system. As a result, the local IP address recorded in the file is inconsistent with the current system IP address. In this case, the controller cannot exit normally.
To resolve the issue:
1. Enter the master controller as described in “Abnormal exit of the controller due to insufficient disk space.”
2. Identify whether the local IPv4 address in the /etc/hosts file is the default (127.0.0.1) or consistent with the current system IP address.
[root@localhost ~]# cat /etc/hosts
127.0.0.1 localhost localhost.localdomain localhost4 localhost4.localdomain4
::1 localhost localhost.localdomain localhost6 localhost6.localdomain6
3. If they are inconsistent, use the vi editor to modify the local IPv4 address to 127.0.0.1 in the /etc/hosts file.
As a best practice, do not modify the local IPv4 address to the current system IP address. If you modify the local IPv4 address to the current system IP address, the controller might fail if you modify the system IP address later.
4. Execute the adwan stop command to identify whether the controller can exit normally.
5. If the issue persists, contact H3C Support.
Controller cluster failure because two members fail
Symptom
In the current software version, a controller cluster can contain only three members. When two members in the cluster fail, the cluster cannot operate properly, and the remaining one controller will enter the emergency mode. In the emergency mode, a controller cannot deploy configuration and can only view configuration.
Solution
In this case, you must log in to the controller operating properly, and use a new server to repair faulty nodes in the cluster.
To resolve the issue:
1. Create two new servers, which are to replace the two faulty nodes. Make sure the IP address, username, password, host name, and NIC settings of a new server are the same as the faulty server to be replaced. This section takes one new server as an example.
2. Power off the faulty server, connect the new server to the network, and power on the new server.
3. On the server operating properly, enter https://ip_address:8443/matrix/ui in the address bar to log in to SNA Installer, enter the username (admin by default) and password (admin@123 by default), and click Log In.
4. Access the Deploy > Applications > Details page to view the details of the controller node.
On the details page, you can view the node name and IP address of the controller operating properly.
5. Use this IP address in the http://IP_address:8585 URL to access the controller and view the corresponding services.
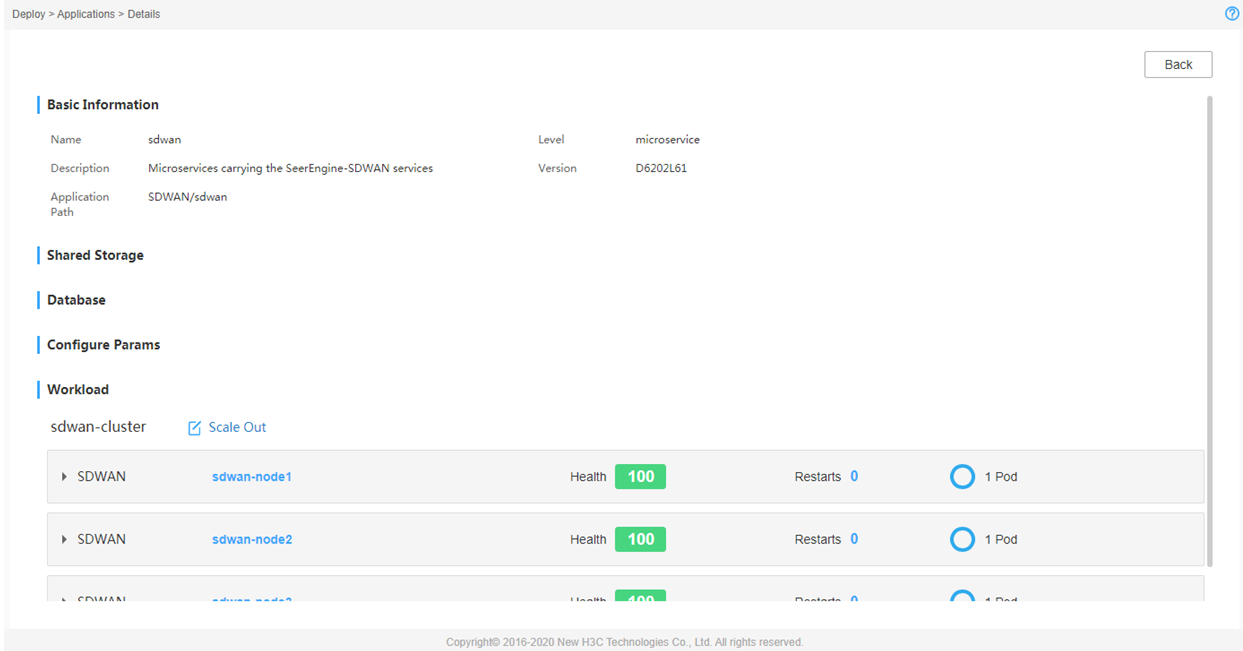
6. Access the Deploy > Clusters > Deploy Cluster page of SNA Installer. On this page, click the Settings icon for a faulty node in the upper right corner and select Repair from the menu that opens.
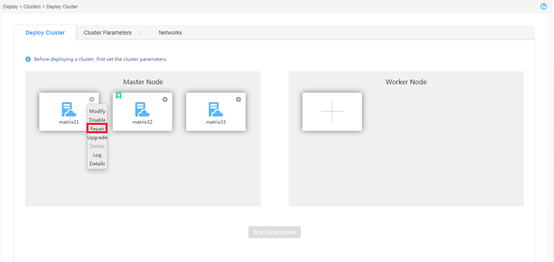
7. In the dialog box that opens, perform one of the following tasks:
¡ Select Upload an RPM package of the same version as the node for repairing, upload the repairing file, and then click Apply.
¡ Select Use the existing node deployment file in the system for repairing, and then click Apply.
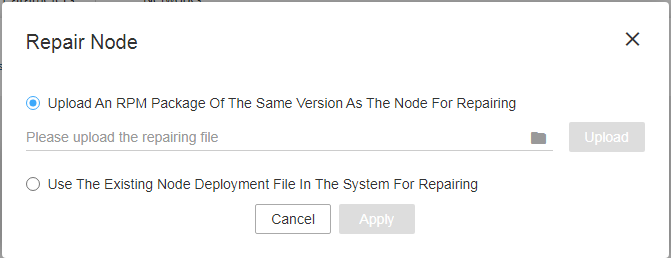
8. Wait until the node is repaired. After the node is repaired, the repaired node will enter the normal state and be colored blue. After the node is repaired, the current page is still in emergency mode. You must log out and then log in to SNA Installer again by using the northbound service VIP.
9. Repeat the steps above to repair the other faulty server.
10. If the issue persists, contact H3C Support.
