| Title | Size | Downloads |
|---|---|---|
| H3C SeerEngine-SDWAN Controller System Alarm Messages Reference-E62XX-5W200-book.pdf | 316.07 KB |
- Related Documents
-
|
|
|
H3C SeerEngine-SDWAN Controller |
|
System Alarm Messages Reference |
|
|
|
|
Document version: 5W200-20210413
Copyright © 2021 New H3C Technologies Co., Ltd. All rights reserved.
No part of this manual may be reproduced or transmitted in any form or by any means without prior written consent of New H3C Technologies Co., Ltd.
Except for the trademarks of New H3C Technologies Co., Ltd., any trademarks that may be mentioned in this document are the property of their respective owners.
The information in this document is subject to change without notice.
Contents
Configuring alarm email notification settings
Configuring alarm threshold triggers
Exporting or deleting all alarms
Link jitter reaching threshold
Link packet loss rate reaching threshold
Link bandwidth usage reaching threshold
Device CPU usage reaching threshold
Device temperature reaching threshold
Device free memory lower than threshold
Failure to obtain device model
Device disconnection from controller
Disconnection from MongoDB host
Controller memory usage reaching threshold
Controller hard disk usage reaching threshold
Introduction
The system generates alarm messages when problems arise on the network, such as when the SeerEngine-SDWAN controller, database, device, or link reports an error or fault during runtime.
This document describes how to use the system alarm function, the supported alarms, their explanations and recommended actions. The manual is intended for reference by system administrators to troubleshoot problems in the system maintenance process.
Displaying alarm messages
As shown in Figure 1, the SeerEngine-SDWAN controller displays alarms in the system on the Assurance > Networking > Alarms page. See Table 1 for the alarm field descriptions.
To view alarm messages:
1. Log in to H3C SNA Center.
2. On the top navigation bar, click Assurance.
3. From the navigation pane, select Networking > Alarms.
The Alarms page displays all alarms in the system, as shown in Figure 1.
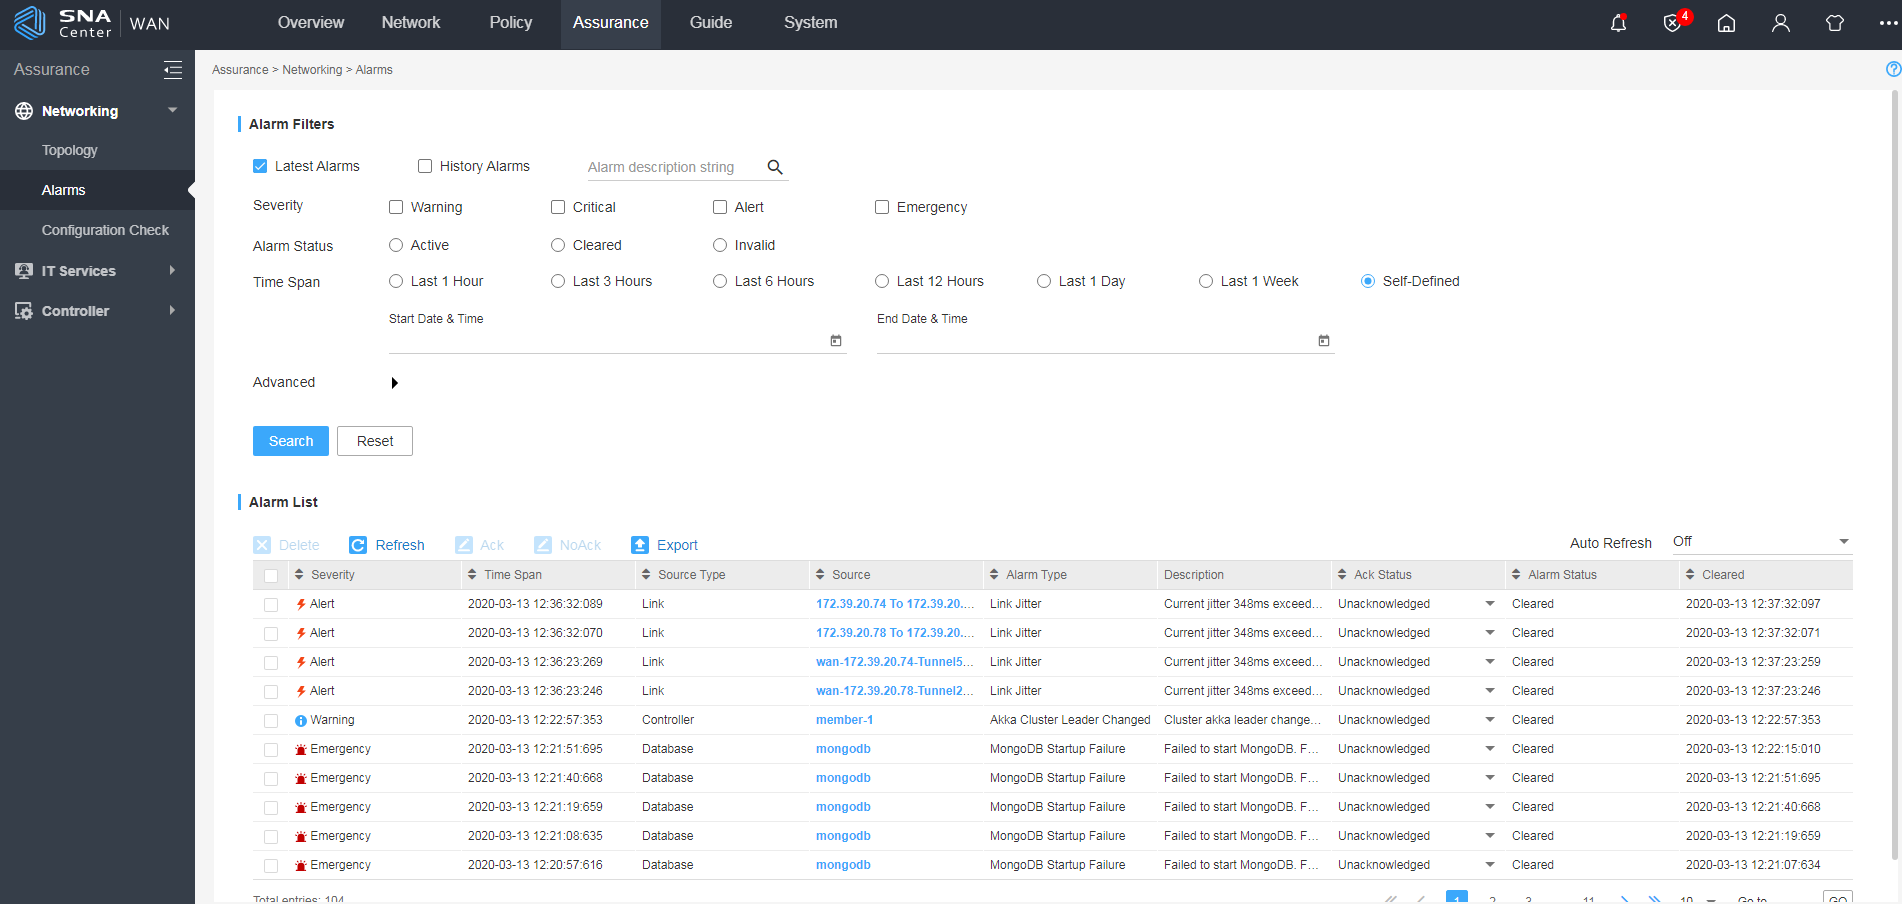
|
Field |
Description |
|
Severity |
Alarm severity level. In descending order of level, the severities are emergency, alert, critical, and warning. Threshold-triggered alarms are assigned a severity (critical or alert) according to the violated threshold. Other types of alarms are assigned a severity according to the alarm content. |
|
Ack Status |
Indicates whether the alarm is unacknowledged or acknowledged. Administrators can change the Ack Status for received alarms. |
|
Alarm Status |
Current state of the alarm, which can be active, cleared, or invalid. The cleared state indicates that the alarm has been recovered. The invalid state indicates that the alarm source has been deleted. |
|
Source Type |
Type of the alarm source, including link, device, database, and controller. |
|
Alarm Type |
Alarm type, which varies by alarm source type. · Device alarm types include device CPU usage, device temperature, free memory, device down, device restarted after software upgrade, device model not obtained, controller & device connection lost, device info conflict, module failure, unstable module state, module serial number conflict, module replacement, submodule anomaly, and submodule replacement. · Link alarm types include link down, link delay, link jitter, link packet loss, and link bandwidth usage. · Database alarm types include MongoDB startup failure, MongoDB connection failure, MongoDB connection lost, MongoDB host connection lost, datastore not available, and database backup failure. · Controller alarm types include controller memory usage, controller drive usage, controller CPU usage, and Akka cluster leader changed. |
|
Source |
Name of the resource that generated the alarm. · For device alarms, the alarm source is the device name. · For link alarms and VXLAN status, delay, and packet loss alarms, the alarm source is the link name. · For controller alarms, the alarm source is the role of the controller in the controller cluster. In a standalone environment where the controller is deployed only on one host, the alarm source is member-1. · For database alarms: ¡ For MongoDB-related alarms, the alarm source is MongoDB. ¡ For datastore not available alarms, the alarm source is the controller IP address. ¡ For database backup failure alarms, the alarm source is the controller name. |
|
Description |
Description for the alarm content, which contains details about the involved alarm event or error. |
|
Time Span |
Date and time when the alarm was generated. |
|
Cleared |
Date and time when the alarm was cleared. |
Managing alarms
On the Assurance > Networking > Alarms page, you can view alarms generated by supported alarm sources, including devices, links, databases, and the SeerEngine-SDWAN controller. You can use the alarm filters to filter the alarm messages to be displayed. For the alarms displayed, you can acknowledge, delete, or export them.
Filtering alarms
1. In the Alarm Filters area, configure the alarm filters as needed.
By default, only the basic alarm filters are displayed. Expand the Advanced alarm filters to set the advanced alarm filters as needed.
2. Click Search.
The matching alarms will be displayed in the alarm list.
3. To clear the specified alarm filters and display all alarms, click Reset.
Refreshing the alarm list
· To refresh the alarm list immediately, click Refresh on top of the alarm list.
· To enable automatic refreshing of the alarm list, select the auto refresh interval from the Auto Refresh list. Options are 1 minute, 2 minutes, 5 minutes, and 10 minutes. To disable the auto refreshing function, select Off. By default, auto refreshing is disabled.
Deleting alarms
· To delete specific alarms, select the alarms and then click Delete. On the confirmation dialog box that opens, click OK.
· To clear all alarms, navigate to the System > System Settings > Alarm Settings page, and then click Clear Alarms in the Export and Delete area.
Changing the ACK status of alarms
1. To set the ACK status for alarms in batches, select the alarms on the alarm list and then click Ack or NoAck. Click OK on the confirmation dialog box that opens.
2. To set the ACK status for alarms individually, select Acknowledged or Unacknowledged from the Ack Status list for the alarm, and then click OK on the confirmation dialog box that opens.
Exporting alarms
1. To export the alarms on the alarm list, click Export. The alarms will be exported to the default path of your Web browser.
2. To export all alarms, navigate to the System > System Settings > Alarm Settings page, and then click Export Alarms in the Export and Delete area.
Configuring alarm settings
You can configure the following alarm settings on the System > System Settings > Alarm Settings page:
· Alarm Email Notification Settings—Configure the recipient email addresses, specify the alarm severity levels and metrics. The system will automatically send alarm emails to the specified recipient if the alarms of the specified severity and metrics are generated.
· Alarm Threshold Triggers—Configure the alarm trigger and alarm thresholds.
· Export and Delete—Export or delete all alarms.
Configuring alarm email notification settings
1. Navigate to the System > System Settings > Alarm Settings page:
a. Click the System icon ![]() in the upper
right corner of the Web interface.
in the upper
right corner of the Web interface.
b. From the navigation pane, select System Settings.
c. Click the Alarm Settings tab.
2. Expand the Alarm Email Notification Settings area.
3. Configure the following parameters:
a. Enter a semicolon-separated list of email recipients addresses.
b. Enter the email title. The default is SeerEngine-SDWAN ALARM.
c. Specify the SMTP email server address and port number. Email servers in domain environments cannot be used.
d. Specify the username and password of the email sender.
e. Select the severity levels and types of the alarms.
The system will automatically send alarm emails to the specified recipients if alarms of the specified severity and metrics are generated.
4. Click Save.
Configuring alarm threshold triggers
1. Navigate to the System > System Settings > Alarm Settings page.
2. In the Alarm Threshold
Triggers area, click the
Edit icon ![]() in the Action column for an alarm metric.
in the Action column for an alarm metric.
3. In the Alarm Trigger Control window that opens, perform the following steps as needed:
a. Select Alarm Trigger to enable displaying alarms of the selected alarm type on the Alarms page. If you disable the alarm trigger for an alarm type, alarms of that type are still generated but will not be displayed on the on the Alarms page.
b. Select the alarm threshold triggers as needed. For example, select Critical Alarm to enable generation of critical level alarms for the selected alarm type.
The types of supported alarm threshold triggers vary by the alarm type selected.
If you enable a lower-level alarm threshold trigger for an alarm type, all higher level alarm threshold triggers are enabled for the alarm type by default.
c. For certain types of alarms, you can also set the alarm thresholds. For example, you can set the critical and alert alarm thresholds for Link Packet Loss (%) alarms.
The critical and alert thresholds of device CPU usage, device temperature, and free memory alarms are predefined by the system and cannot be edited.
Exporting or deleting all alarms
1. Navigate to the System > System Settings > Alarm Settings page.
2. In the Export and Delete area, perform the following tasks as needed:
3. Click the Edit icon ![]() in the
Action column for an alarm
metric.
in the
Action column for an alarm
metric.
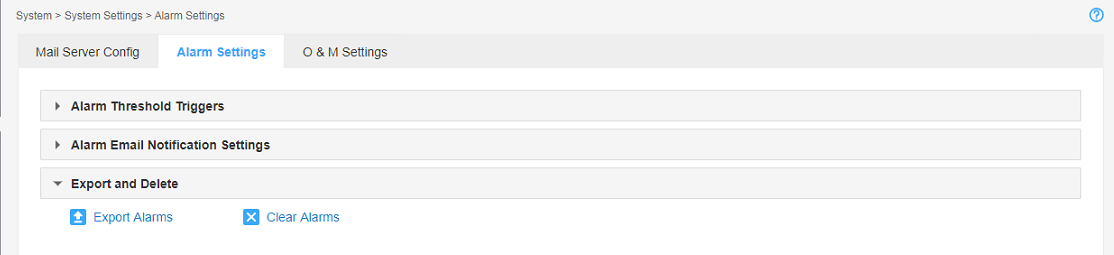
¡ Click Export Alarms to export all alarms in a report and save the report to the local device.
¡ Click Clear Alarms to clear all alarms.
Figure 2 Exporting and clearing all alarms
Using this document
This document categorizes system alarm messages by software module.
This document explains messages in tables. Table 2 describes information provided in these tables.
Table 2 Message explanation table contents
|
Item |
Content |
Example |
|
Message text |
Presents the message description. |
Current CPU usage $2 exceeded alarm threshold $1 |
|
Variable fields |
Briefly describes the variable fields in the order that they appear in the message text. The variable fields are numbered in the "$Number" form to help you identify their location in the message text. |
$1: CPU usage threshold. $2: Current CPU usage percentage. |
|
Severity level |
Provides the severity level of the message. |
Warning, Emergency |
|
Example |
Provides a real message example. |
Current CPU usage 86% exceeded alarm threshold 85% |
|
Explanation |
Explains the message, including the event or error cause. |
When the CPU usage of the device reaches the CPU usage threshold, the system sends a log message for the event. When the CPU usage of the device drops below the threshold, the system sets the state of the alarm to cleared. The thresholds for CPU usage are configurable. By default, the thresholds are as follows: · For the H3C MSR series of devices, only the Emergency threshold is set, and the threshold value is 99%. · For devices of other models, the Warning threshold is 85%, and the Emergency threshold is 90%. |
|
Recommended action |
Provides recommended actions. |
If the alarm is not cleared for a long time, contact H3C Support. |
Alarm messages
LINK
This section contains the link alarm messages.
Link down
|
Message text |
Link status changed to down |
|
Variable fields |
N/A |
|
Severity level |
Emergency |
|
Example |
Link status changed to down |
|
Explanation |
When a link goes down, the system sends an alarm for the event. When the link comes up again, the system changes the alarm state to recovered. |
|
Recommended action |
Verify the online status of the link related devices, interfaces, and BGP peers. |
Link delay reaching threshold
|
Message text |
Current delay $2 exceeded alarm threshold $1 |
|
Variable fields |
$1: Link delay threshold. $2: Current link delay. |
|
Severity level |
Warning, Emergency |
|
Example |
Current delay 250ms exceeded alarm threshold 200ms |
|
Explanation |
When the delay of a link reaches the link delay threshold, the system sends an alarm message for the event. When the link delay drops below the threshold, the system sets the state of the alarm to cleared. The alarm thresholds for link delay are configurable. By default, the Warning threshold is 200 ms, and the Emergency threshold is 500 ms. |
|
Recommended action |
This alarm notifies users of the current network quality. No action is required. |
Link jitter reaching threshold
|
Message text |
Current jitter $2 exceeded alarm threshold $1 |
|
Variable fields |
$1: Link jitter threshold. $2: Current link jitter. |
|
Severity level |
Warning, Emergency |
|
Example |
Current jitter 50ms exceeded alarm threshold 50ms |
|
Explanation |
When the jitter of a link reaches the link jitter threshold, the system sends an alarm message for the event. When the link jitter drops below the threshold, the system sets the state of the alarm to cleared. The alarm thresholds for link jitter are configurable. By default, the Warning threshold is 50 ms, and the Emergency threshold is 200 ms. |
|
Recommended action |
This alarm notifies users of the current network quality. No action is required. |
Link packet loss rate reaching threshold
|
Message text |
Current packet loss ratio $2 exceeded alarm threshold $1 |
|
Variable fields |
$1: Packet loss rate threshold of the link. $2: Current packet loss rate of the link. |
|
Severity level |
Warning, Emergency |
|
Example |
Current packet loss ratio 35% exceeded alarm threshold 30% |
|
Explanation |
When the packet loss rate of a link reaches the packet loss rate threshold, the system sends an alarm message for the event. When the packet loss rate of the link drops below the threshold, the system sets the state of the alarm to cleared. The alarm thresholds for link packet loss rate are configurable. By default, the Warning threshold is 30%, and the Emergency threshold is 50%. |
|
Recommended action |
This alarm notifies users of the current network quality. No action is required. |
Link bandwidth usage reaching threshold
|
Message text |
Current bandwidth usage ratio $2 exceeded alarm threshold $1 |
|
Variable fields |
$1: Link bandwidth usage threshold. $2: Current link bandwidth usage ratio. |
|
Severity level |
Warning, Emergency |
|
Example |
Current bandwidth usage 80% exceeded alarm threshold 90% |
|
Explanation |
When the bandwidth usage of a link reaches the link bandwidth usage threshold, the system generates an alarm for the event. When the bandwidth usage of the link drops below the threshold, the system sets the state of the alarm to cleared. The alarm thresholds for link bandwidth usage are configurable. By default, the Warning threshold is 80%, and the Emergency threshold is 90%. |
|
Recommended action |
This alarm notifies users of the current link bandwidth usage. No action is required. |
DEVICE
This section contains the device alarm messages.
Device CPU usage reaching threshold
|
Message text |
Current CPU usage $2 exceeded alarm threshold $1 |
|
Variable fields |
$1: CPU usage threshold. $2: Current CPU usage percentage. |
|
Severity level |
Warning, Emergency |
|
Example |
Current CPU usage $2 exceeded alarm threshold $1 |
|
Explanation |
When the CPU usage of the device reaches the CPU usage threshold, the system sends a log message for the event. When the CPU usage of the device drops below the threshold, the system sets the state of the alarm to cleared. The thresholds for CPU usage are configurable. By default, the thresholds are as follows: · For the H3C MSR series of devices, only the Emergency threshold is set, and the threshold value is 99%. · For devices of other models, the Warning threshold is 85%, and the Emergency threshold is 90%. · |
|
Recommended action |
If the alarm is not cleared for a long time, contact H3C Support. |
Device temperature reaching threshold
|
Message text |
Current temperature $2 exceeded alarm threshold $1 |
|
Variable fields |
$1: Temperature threshold. $2: Current temperature of the device. |
|
Severity level |
Warning, Emergency |
|
Example |
Current temperature 68°C exceeded alarm threshold 65°C |
|
Explanation |
When the temperature of the device reaches the temperature threshold, the system generates an alarm for the event. When the temperature of the device drops below the threshold, the system sets the state of the alarm to cleared. The thresholds for device temperature are configurable. By default, the thresholds are as follows: · For the H3C MSR series of devices, the Warning threshold is 65°C, and the Emergency threshold is 75°C. · For the H3C SR6600 series of devices, the Warning threshold is 72°C, and the Emergency threshold is 77°C. · For devices of other models, the Warning threshold is 75°C, and the Emergency threshold is 88°C. · |
|
Recommended action |
Verify that the equipment room environment and the device operating environment meet the requirements. |
Device free memory lower than threshold
|
Message text |
Current free memory $2 is lower than alarm threshold $1 |
|
Variable fields |
$1: Free memory threshold. $2: Current free memory. |
|
Severity level |
Warning, Emergency |
|
Example |
Current free memory 135MB is lower than alarm threshold 256MB |
|
Explanation |
When the free memory of the device drops below the free memory threshold, the system generates an alarm for the event. When the free memory of the device reaches the threshold, the system sets the state of the alarm to cleared. The thresholds for device free memory are configurable. By default, the thresholds are as follows: · For the H3C MSR series of devices, the Warning threshold is 256 MB, and the Emergency threshold is 96MB. · For devices of other models, the Warning threshold is 128 MB, and the Emergency threshold is 48 MB. · |
|
Recommended action |
If the alarm is not cleared for a long time, contact H3C Support. |
Device offline
|
Message text |
Device went offline. Reason: $1 |
|
Variable fields |
$1: Reason why the device was offline. See Table 3 for the possible reasons. |
|
Severity level |
Emergency |
|
Example |
Device went offline. Reason: UnReachable |
|
Explanation |
A device went offline. |
|
Recommended action |
Take actions according to the device offline reason. |
Table 3 Device offline reasons and recommended actions
|
Device offline reason |
Recommended action |
|
UnManageable |
Verify that the device is not isolated. If the device is isolated, remove the isolation. |
|
UnReachable |
· Verify that the alarm is not generated because the controller goes down and temporarily losses connectivity to managed devices. Such alarms will be automatically cleared after the controller reconnects to the devices. · Verify network connectivity to the device and fix detected problems, if any. · Verify that NETCONF settings on the device and controller are correct. |
|
NoLicense |
Install licenses as needed. |
|
NoSceneLicense |
Verify that the license matches the network scenario. If they do not match, change the network scenario or install a matching license. |
|
SameIpNotSn |
Verify that the device serial number is correct. |
|
BadSceneToLicense |
Select the correct network scenario. |
|
GetLicenseError |
Request and install the license again. |
|
NoGetLicense |
Verify that the license is registered. |
|
NoSoftVersion |
Verify that the NETCONF settings on the device and controller are correct. |
|
UnknownCompany |
· Verify that the NETCONF settings on the device and controller are correct. · Verify that the device and the controller can reach each other. |
|
DeviceConflictNoSoftVersion |
Verify that the device attributes are correctly specified on the device management page. |
|
WebSocket connection disconnected |
Verify that the device and the controller can reach each other, and the WebSocket configuration is correct on the device and the controller. |
|
WebSocket subconnection disconnected |
Check the connectivity status of the WebSocket subconnection on the device side. · If the subconnection is disconnected, reconnect the WebSocket subconnection on the device. · If the subconnection is normal, contact the technical support. |
Device restart
|
Message text |
The device restarted after the controller upgraded software for it. |
|
Variable fields |
N/A |
|
Severity level |
Info |
|
Example |
The device restarted after the controller upgraded software for it. |
|
Explanation |
A device restarted after the controller upgraded software for the device. |
|
Recommended action |
No action is required. |
Failure to obtain device model
|
Message text |
Failed to get the device model |
|
Variable fields |
N/A |
|
Severity level |
Emergency |
|
Example |
Failed to get the device model |
|
Explanation |
The controller failed to obtain the device model. |
|
Recommended action |
Verify that the NETCONF configuration is correct on the device and controller. Or, manually configure the device model information on the controller. |
Device disconnection from controller
|
Message text |
The connection between controller and device is disconnected |
|
Variable fields |
N/A |
|
Severity level |
Emergency |
|
Example |
The connection between controller and device is disconnected |
|
Explanation |
When a device is disconnected from the controller, the system generates an alarm for the event. The alarm message text varies depending on how the device was added to the controller: · If the device was manually added to the controller, the message text is Connection Lost. · If the device was automatically discovered by OpenFlow, the message text is OpenFlow Connection Lost. |
|
Recommended action |
Verify that the NETCONF configurations are correct on the device and the controller. |
Device conflict
|
Message text |
The device conflicts with device $2. Reason: $1 |
|
Variable fields |
$1: Reason for the conflict. $2: Name of the device that conflicts with the current device. |
|
Severity level |
Emergency |
|
Example |
The device conflicts with device1. Reason: IP |
|
Explanation |
The devices had conflicted IP address, MAC address, or serial number. |
|
Recommended action |
Edit device information or delete one of the devices. |
Module failure
|
Message text |
The board fails. Please handle the board as soon as possible. Board position: $2 |
|
Variable fields |
$1: Reason for the failure. $2: Location of the module. |
|
Severity level |
Emergency |
|
Example |
The board fails. Please handle the board as soon as possible. Board position: 2/4 |
|
Explanation |
A module was damaged, restarted, or removed during operation. |
|
Recommended action |
· If the module was restarting, wait for the restart to complete. · If the module has been removed, navigate to the Network > Inventory > Devices page of the SeerEngine-SDWAN controller, click the Modules tab, and then click Ack Removal for the module to invalidate the alarm. · If the module is damaged, contact H3C Support. |
Module running exception
|
Message text |
The board is running exceptionally. Board position $1 |
|
Variable fields |
$1: Location of the module. |
|
Severity level |
Warning |
|
Example |
The board is running exceptionally. Board position: 2/4 |
|
Explanation |
A module encountered a running or startup exception. |
|
Recommended action |
Navigate to the Network > Inventory > Devices page of the SeerEngine-SDWAN controller, click the Modules tab, and then view the operating state of the module. If the module cannot resume normal operating state after a period of time, contact H3C Support. |
Module serial number conflict
|
Message text |
The boards of the device have the same serial number. Board positions: $1 |
|
Variable fields |
$1: Location of the module. |
|
Severity level |
Warning |
|
Example |
The boards of the device have the same serial number. Board positions: 3/4, 2/4 |
|
Explanation |
Two modules on a device have the same serial number. |
|
Recommended action |
Remove one of the conflicting module. If one of the conflicting modules is the MPU, remove the other module. |
Module replace
|
Message text |
The board of the device is replaced. Board position: $1 |
|
Variable fields |
$1: Location of the module. |
|
Severity level |
Emergency |
|
Example |
The board of the device is replaced. Board position: 2/4 |
|
Explanation |
The controller detected that a module's serial number changed. |
|
Recommended action |
· If the module has been replaced, navigate to the Network > Inventory > Devices page of the SeerEngine-SDWAN controller, click the Modules tab, and then click Ack Replaced for the module to invalidate the alarm. · If the module is not replaced, contact H3C Support. |
Submodule fault
|
Message text |
There is a fault on the sub card. Please handle it as soon as possible. Sub card position: $1 |
|
Variable fields |
$1: Location of the submodule. |
|
Severity level |
Emergency |
|
Example |
There is a fault on the sub card. Please handle it as soon as possible. Sub card position: 2/4 |
|
Explanation |
A submodule was damaged, restarted, or removed during operation. |
|
Recommended action |
· If the submodule is restarting, wait for the restart to complete. · If the submodule has been removed, navigate to the Network > Inventory > Devices page of the SeerEngine-SDWAN controller, click the Modules tab, and then click Ack Removal for the submodule to invalidate the alarm. · If the submodule is damaged, contact H3C Support. |
Submodule replace
|
Message text |
The sub card of the device is replaced. Sub card position: $1 |
|
Variable fields |
$1: Location of the submodule。 |
|
Severity level |
Emergency |
|
Example |
The subcard of the device is replaced. Subcard position: 2/4 |
|
Explanation |
The controller detected that a submodule's serial number changed. |
|
Recommended action |
· If the submodule has been replaced, navigate to the Network > Inventory > Devices page of the SeerEngine-SDWAN controller, click the Modules tab, and then click Ack Replaced for the submodule to invalidate the alarm. · If the submodule is not replaced, contact H3C Support. |
DATABASE
This section contains the database alarm messages.
MongoDB startup failure
|
Message text |
Failed to start MongoDB. Failure reason: $1 |
|
Variable fields |
$1: Reason for the failure. |
|
Severity level |
Critical |
|
Example |
Failed to start MongoDB. Failure reason: failed connection host |
|
Explanation |
The controller failed to start MongoDB. |
|
Recommended action |
Take actions according to the failure reason: · port occupied—Use another port to try again, or shut down the process that is occupying the port. · host format error—Specify the correct IP address of the host. · failed connection host—Examine the network connectivity and make sure the firewall permits the traffic between the controller and the database server. · the database version is below 3.0—Upgrade the software version of MongoDB. · the path of database is invalid—Specify the correct database path. · MMAPv1 data files exist in the database path or there is already a database instance running—Start up MongoDB manually, or stop the running database. · Other reasons. If the failure reason is not one of the previous reasons, try to start up MongoDB manually, or take countermeasures according to the displayed failure reason. |
MongoDB connection failure
|
Message text |
Failed to connect to MongoDB. Failure reason: $1 |
|
Variable fields |
$1: Reason for the failure. |
|
Severity level |
Critical |
|
Example |
Failed to connect to MongoDB. Failure reason: account has not authorization |
|
Explanation |
The controller failed to connect to the MongoDB database. |
|
Recommended action |
Take actions according to the failure reason: · host or port is wrong,or database service is not started—Verify that the host and port number of the MongoDB server are correct and the MongoDB database is started. · account has not authorization—Set a database account that has required privileges. |
Disconnection from MongoDB
|
Message text |
Lost connection to MongoDB. Failure reason: $1 |
|
Variable fields |
$1: Reason for the failure. |
|
Severity level |
Critical |
|
Example |
Lost connection to MongoDB. Failure reason: host or port is wrong |
|
Explanation |
The controller has disconnected from MongoDB. |
|
Recommended action |
Take actions according to the failure reason: · host or port is wrong,or database service is not started—Verify that the host and port number of the MongoDB server are correct and the MongoDB database is started. · account has not authorization—Set a database account that has required privileges. |
Disconnection from MongoDB host
|
Message text |
Lost connection to the host of MongoDB. Failure reason: $1. |
|
Variable fields |
$1: Reason for the failure. |
|
Severity level |
Critical |
|
Example |
Lost connection to the host of MongoDB. Failure reason: host or port is wrong,or database service is not started. |
|
Explanation |
The controller has disconnected from the MongoDB host. |
|
Recommended action |
Take actions according to the failure reason: host or port is wrong,or database service is not started—Verify that the host and port number of the MongoDB server are correct and the MongoDB database is started. |
Datastore not available
|
Message text |
The database is unavailable |
|
Variable fields |
N/A |
|
Severity level |
Critical |
|
Example |
The database is unavailable |
|
Explanation |
If the controller cluster splits, the ODL database read or write is unavailable. When this event occurs, the system generates an alarm message for the event. When the cluster recovers, the system sets the state of the alarm to cleared. |
|
Recommended action |
Navigate to the Overview > Controller State Summary page of the SeerEngine-SDWAN controller, and then identify and repair the controllers with abnormal status. |
CONTROLLER
This section contains the controller alarm messages.
Controller memory usage reaching threshold
|
Message text |
Current controller memory usage $2 exceeded alarm threshold $1 |
|
Variable fields |
$1: Memory usage threshold. $2: Current memory usage percentage. |
|
Severity level |
Warning, Emergency |
|
Example |
Current controller memory usage 90% exceeded alarm threshold 80% |
|
Explanation |
The controller memory usage percentage reached the threshold. The memory usage thresholds are configurable. By default, the Warning threshold is 80% and the Emergency threshold is 90%. |
|
Recommended action |
· Verify that the memory usage thresholds are set properly. · View the controller's processes, and shut down redundant processes to release memory. |
Controller hard disk usage reaching threshold
|
Message text |
Current disk usage $3 of controller disk partition $1 exceeded alarm threshold $2 |
|
Variable fields |
$1: Name of the hard disk partition. $2: Hard disk usage threshold. $3: Current hard disk usage percentage. |
|
Severity level |
Warning, Emergency |
|
Example |
Current disk usage 85% of controller disk partition /opt exceeded alarm threshold 80% |
|
Explanation |
A hard disk partition of the controller reached the threshold. The thresholds are configurable. By default, the Warning threshold is 80% and the Emergency threshold is 90%. |
|
Recommended action |
· Verify that the hard disk usage thresholds are set properly. · Delete redundant files on the disk to release disk space. |
Controller CPU usage reaching threshold
|
Message text |
Current controller CPU usage $2 exceeded alarm threshold $1 |
|
Variable fields |
$1: CPU usage percent threshold. $2: Current CPU usage percentage. |
|
Severity level |
Warning, Emergency |
|
Example |
Current controller CPU usage 85% exceeded alarm threshold 80% |
|
Explanation |
The CPU usage percentage of the controller reached the threshold. The thresholds for controller CPU usage are configurable. By default, the Warning threshold is 80% and the Emergency threshold is 90%. |
|
Recommended action |
· Verify that the CPU usage thresholds are set properly. · View the controller's processes, and shut down redundant processes to release the CPU load. |
Leader change in Akka cluster
|
Message text |
Cluster akka leader changed. New leader: $1 |
|
Variable fields |
$1: IP address of the new leader in the Akka cluster. |
|
Severity level |
Info |
|
Example |
Cluster akka leader changed. New leader: 192.168.26.22 |
|
Explanation |
If the leader of a controller cluster changes, both the old leader and the new leader will generate an alarm for the event. |
|
Recommended action |
No action is required. |
