- Table of Contents
-
- 12-Network Management and Monitoring Configuration Guide
- 00-Preface
- 01-GOLD configuration
- 02-iFIT configuration
- 03-NETCONF configuration
- 04-NQA configuration
- 05-NTP configuration
- 06-Packet capture configuration
- 07-PTP configuration
- 08-SNMP configuration
- 09-TCP connection trace configuration
- 10-Information center configuration
- 11-Network synchronization configuration
- 12-System maintenance and debugging configuration
- 13-Process monitoring and maintenance configuration
- 14-Mirroring configuration
- Related Documents
-
| Title | Size | Download |
|---|---|---|
| 04-NQA configuration | 342.34 KB |
Restrictions and guidelines: NQA configuration
Configuring NQA operations on the NQA client
Configuring path quality analysis operations
Display and maintenance commands for NQA
NQA operation configuration examples
Example: Configuring the path quality analysis operation
TWAMP Light operating mechanism
Restrictions and guidelines: TWAMP Light configuration
Configuring the TWAMP Light server
Configuring the TWAMP Light client
Creating a test session on the TWAMP Light client
Configuring the IP address and port number for the TWAMP Light test session
Configuring other parameters for the TWAMP Light probe packets
Configuring threshold monitoring
Starting the test on the TWAMP Light sender
Stopping the test on the TWAMP Light sender
Display and maintenance commands for TWAMP Light
TWAMP Light configuration examples
Example: Configuring TWAMP Light test on a common Layer 3 network
Example: Configuring TWAMP Light test on an L2VPN network
Example: Configuring TWAMP Light test on an L3VPN network
Configuring NQA
About NQA
Network quality analyzer (NQA) allows you to measure network performance, verify the service levels for IP services and applications, and troubleshoot network problems.
NQA architecture
An NQA operation contains a set of parameters such as the operation type, destination IP address, and port number to define how the operation is performed. Each NQA operation is identified by the combination of the administrator name and the operation tag.
As shown in Figure 1, the NQA architecture contains the following parts:
· NQA client—Sends probe packets to the NQA destination device by simulating IP services and applications to measure network performance. You can configure the NQA client to run the operation at scheduled time periods.
· NQA server—Destination device of the NQA operation. It receives, processes, and responds to the probe packets sent by the NQA client.

NQA operating mechanism
The NQA client and NQA server interact as follows:
1. The NQA client constructs probe packets of the operation type, and sends them to the NQA server.
2. The NQA server processes the probe packets and sends back reply packets.
3. Upon receiving the replies, the NQA client calculates the packet loss ratio and round-trip time to determine the network performance and service quality.
After an NQA operation starts, the NQA client repeats the operation at the specified interval.
An NQA operation can contain multiple probes. You can set the number of probes the NQA client performs in an operation.
Restrictions and guidelines: NQA configuration
To avoid probe failures, follow these restrictions and guidelines when configuring the listening ports on the NQA client and NQA server:
· Do not specify a well-known port.
· Make sure the specified port number is not used by any services on the device.
¡ To obtain the IPv4 addresses and the port numbers in use on this device, see the Local Addr:port field in the output from the display tcp and display udp commands.
¡ To obtain the IPv6 addresses and the port numbers in use on this device, see the LAddr->port field in the output from the display ipv6 tcp and display ipv6 udp commands.
The destination port configured for the operation (with the destination port command) on the NQA client must be the same as the listening port configured on the server.
During the initial startup phase, the device might not have generated route entries or ARP table entries to reach the destination address of the operation, or the probe packet output interface might not be up, which can result in NQA operation failure.
For latency operation results to be accurate, synchronize time between the source and the destination with an accuracy higher than or equal to the operation result calculation accuracy.
NQA tasks at a glance
To configure NQA, perform the following tasks:
3. Configuring NQA operations
¡ Configuring NQA operations on the NQA client
Configuring the NQA server
Restrictions and guidelines
Follow these restrictions and guidelines to determine the configuration on the destination device:
· To perform path quality analysis operations, you must enable the NQA server on the destination device and packet reflection.
Procedure
1. Enter system view.
system-view
2. Configure a reflector on the NQA server.
nqa reflector reflector-id interface interface-type interface-number [ { ip | ipv6 } { destination address | source address ] } * | source-port port-number ] | destination-port port-number | destination-mac mac-address | source-mac mac-address | vlan vlan-id | exchange-port | vpn-instance vpn-instance-name ] *
By default, no reflector is configured on the device.
3. Enable the NQA server.
nqa server enable
By default, the NQA server is disabled.
Enabling the NQA client
1. Enter system view.
system-view
2. Enable the NQA client.
nqa agent enable
By default, the NQA client is enabled.
The NQA client configuration takes effect after you enable the NQA client.
Configuring NQA operations on the NQA client
Configuring path quality analysis operations
About this task
As shown in Figure 2, a path quality analysis operation tests the path quality from source to destination over a network. The path quality indexes that can be tested include frame loss ratio, latency, and throughput.
Figure 2 Path quality analysis operation on an MPLS L2VPN network
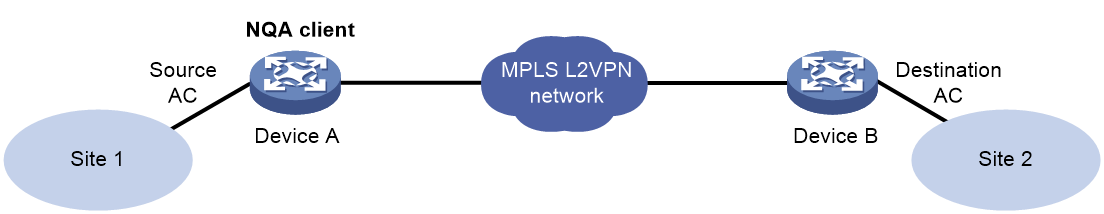
In each path quality analysis probe, the NQA client sends packets of a fixed size at a specific speed to the destination device for the specified probe duration.
For each type of path quality analysis operation, you can specify a list of packet sizes by using the frame-size command. The NQA client uses the listed packet sizes in turn to send packets. Packets per probe are of the same size.
Frame loss operation
1. The NQA client sends probe packets of the first listed packet size to the destination device at the initial sending speed for the first probe.
2. When the destination device receives the probe packets, it sends back response packets.
3. The NQA client calculates and records the frame loss ratio for the first probe by using the following formula:
Frame loss ratio = (sent packets – received packets) × 100 / sent packets
4. After the specified probe interval, the NQA client starts another probe to test the frame loss ratio by sending packets of the second listed packet size.
5. The process continues until all listed packet sizes are tested.
Throughput operation
1. The NQA client sends probe packets of the first listed packet size to the destination device at the initial sending speed for the first probe.
2. When the destination device receives the probe packets, it sends back response packets.
3. The NQA client calculates and records the frame loss ratio for the probe.
4. The NQA client adjusts the packet sending speed (based on the configured granularity) and sends the probe packets of the same size for another probe.
5. The client repeats steps 3 through 4 until it determines the maximum packet sending speed at which it can send the packets with an acceptable frame loss ratio. The acceptable frame loss ratio must not be higher than the specified maximum acceptable frame loss ratio.
The maximum packet sending speed is recorded as the throughput for the specific packet size.
6. The NQA client follows the same procedure to determine the throughput for subsequent packet sizes in the packet size list.
7. The process stops when the last listed packet size is tested.
Latency operation
1. The NQA client sends probe packets of the first listed packet size to the destination device at the initial sending speed for the first probe.
2. When the NQA client receives a response packet from the destination device, the client calculates the round-trip time (latency) for the packet.
3. When the first probe duration expires, the NQA client calculates the average latency for the first packet size by using the following formula:
Average latency = Sum of all latency values / sent packets
4. The NQA client starts another probe to test the latency for packets of the second listed packet size.
5. The process stops when the last listed packet size is tested.
Restrictions and guidelines
The display nqa history command does not display the results or statistics of path quality analysis operations. To view the results or statistics of path quality analysis operations, use the display nqa result or display nqa statistics command.
For path quality analysis operations and Y.1564 operations to start successfully, configure the source and destination IP addresses as follows:
· In a Layer 3 Ethernet and L3VPN network, configure both source and destination IP addresses.
· In other networks, you must configure both of them or none of them. If they are configured, make sure the source and destination IP addresses are of the same IP version.
Configuring the path quality analysis operation parameters
1. Enter system view.
system-view
2. (Optional.) Configure the FTP server to which the NQA client uploads the operation results.
nqa report-ftp url url [ username username ] [ password { cipher | simple } string ]
By default, no FTP server is configured.
Only the path quality analysis operation supports uploading operation results to the FTP server.
3. Create an NQA operation and enter NQA operation view.
nqa entry admin-name operation-tag
4. Specify a path quality analysis operation type and enter its view. Choose the options to configure as needed:
¡ Specify the frame loss operation type.
type frame-loss
¡ Specify the throughput operation type.
type throughput
¡ Specify the latency operation type.
type latency
5. Specify the addresses and port numbers for the path quality analysis operation.
a. Specify the source IP address for the probe packets.
IPv4:
source ip ipv4-address
By default, the source IPv4 address is 198.19.65.1.
IPv6:
source ipv6 ipv6-address
By default, the source IPv4 address is not specified.
b. Specify the destination IP address for the probe packets.
IPv4:
destination ip ipv4-address
By default, the destination IPv4 address is 198.18.65.1.
IPv6:
destination ipv6 ipv6-address
By default, the destination IPv6 address is not specified.
c. Specify the source AC or source interface for the probe packets.
source interface interface-type interface-number
By default, the source AC or source interface is not specified.
The specified source interface must be up.
For more information about the AC interface, see VPLS in MPLS Configuration Guide.
d. Specify the source port number for the probe packets.
source port port-number
By default , the source port number is 49184.
For the operation to succeed, make sure the specified port number is not used by any services on the device. As a best practice, use the default value.
e. Specify the destination port number for the probe packets.
destination port port-number
By default, the destination port number is 7.
f. Specify the source MAC address for the probe packets.
source mac mac-address
By default, the source MAC address for the probe packets is not specified.
This task is required for the operation in a Layer 2 Ethernet and L2VPN network.
g. Specify the destination MAC address for the probe packets.
destination mac mac-address
By default, the destination MAC address is 0023-8900-0001.
This task is required for the operation in a Layer 2 Ethernet and L2VPN network.
6. Specify the basic parameters for the Y.1564 operations.
¡ (Optional.) Specify the description for the Y.1564 operation.
description text
By default, the description is not specified.
¡ Set the size of the probe packets.
frame-size size&<1-7>
By default, the probe packet size is 1518 bytes.
¡ Specify the initial packet sending speed.
speed init init-speed
By default, the initial frame sending speed is 100000 kbps.
The frame loss and latency operations use the specified initial packet sending speed for all probes.
The throughput operation starts the first probe at the specified initial packet sending speed and adjusts the speed according to the configured granularity for each subsequent probe.
¡ Specify the granularity for adjusting the packet sending speed.
speed granularity value
The default setting is 1000 kbps.
This command is available only in throughput operation view.
The throughput operation starts the first probe at the specified initial packet sending speed and adjusts the speed according to the configured granularity for each subsequent probe.
¡ Specify the maximum acceptable frame loss ratio.
allowed-loss-ratio ratio
By default, the maximum acceptable frame loss ratio is 1/10000.
This command is available only in throughput operation view.
¡ Set the ToS value in the IP header of the probe packets.
tos value
By default, the ToS value is 0.
7. (Optional.) Configure the probe parameters for the path quality analysis operation.
¡ Set the interval between consecutive probes.
probe interval interval
The default probe interval is 4 seconds.
¡ Specify the probe duration in seconds.
probe duration time
The default probe duration is 60 seconds.
¡ Set the probe timeout time.
probe timeout timeout
The default setting is 3000 milliseconds.
8. Specify the VPN instance where the operation is performed.
vpn-instance vpn-instance-name
By default, no VPN instance is specified.
This task is required for the operation in an L3VPN network.
9. (Optional.) Specify the 802.1p priority for the probe packets.
priority 8021p value
By default, the 802.1p priority of the probe packets is 0.
10. (Optional.) Enable the port exchange between the source port and destination port.
exchange-port enable
By default, the port exchange is disabled.
Configuring an RFC2544 operation group
You can bind multiple RFC2544 operations to a NQA RFC2544 operation group. By starting the operation group, you can start all the path quality analysis operations in the group.
After an RFC2544 operation group starts, the device performs operations in the group the one by one.
1. Enter system view.
system-view
2. Create an RFC2544 operation group and enter its view.
nqa rfc2544 group group-name
3. Bind an RFC2544 operation to the RFC2544 operation group.
bind nqa-entry admin-name operation-tag
By default, an RFC2544 operation group does not contain any RFC2544 operations.
You can repeat this command to bind multiple operations to the RFC2544 operation group.
Starting the path quality analysis operation
1. Enter system view.
system-view
2. Enter NQA operation view or RFC2544 operation group view.
¡ Enter NQA operation view.
nqa entry admin-name operation-tag
¡ Enter RFC2544 operation group view.
¡ nqa rfc2544 group group-name
3. Start the operation.
start
Stopping the operation
1. Enter system view.
system-view
2. Enter NQA operation view or RFC2544 operation group view.
¡ Enter NQA operation view.
nqa entry admin-name operation-tag
¡ Enter RFC2544 operation group.
nqa rfc2544 group group-name
3. Stop the path quality analysis operation.
stop
Display and maintenance commands for NQA
Execute display commands in any view on the NQA client.
|
Task |
Command |
|
Display the most recent result of the NQA operation. |
display nqa result [ admin-name operation-tag ] |
|
Display NQA path quality analysis operation group information. |
display nqa rfc2544 group [ brief | name group-name | result [ group-name ] ] |
Execute display commands in any view on the NQA server.
|
Task |
Command |
|
Display a reflector of a path quality analysis operation |
display nqa reflector [ reflector-id ] |
|
Display NQA server status. |
display nqa server |
NQA operation configuration examples
Example: Configuring the path quality analysis operation
This example uses the throughput operation. You can configure the frame loss or latency operation in the same way the throughput operation is configured.
Network configuration
As shown in Figure 3, configure a throughput operation to test the throughput of the network path from Device A to Device B over an MPLS L2VPN network.

Procedure
4. Set up and configure the MPLS L2VPN network. (Details not shown.)
5. Configure Device B:
# Configure a reflector on the NQA server for the path quality analysis operations.
[DeviceB] nqa reflector 1 interface ten-gigabitethernet 2/0/1 ip destination 10.2.2.2 source 10.1.1.1 destination-mac 2-2-2 source-mac 1-1-1
# Enable the NQA server.
[DeviceB] nqa server enable
6. Configure Device A:
# Create a throughput operation.
<DeviceA> system-view
[DeviceA] nqa entry admin test1
[DeviceA-nqa-admin-test1] type throughput
# Specify 1-1-1 as the source MAC address for the probe packets.
[DeviceA-nqa-admin-test1-throughput] source mac 1-1-1
# Specify 2-2-2 as the destination MAC address for the probe packets.
[DeviceA-nqa-admin-test1-path-jitter] destination mac 2-2-2
# Specify the AC interface to be used as the source interface for the probe packets. This example uses the AC interface in Ethernet service instance 1 on GigabitEthernet 1/0/1.
[DeviceA-nqa-admin-test1-throughput] source interface ten-gigabitethernet 2/0/0
# Specify a packet size list of 64 bytes, 512 bytes, 1024 bytes, and 1280 bytes.
[DeviceA-nqa-admin-test1-throughput] frame-size 64 512 1024 1280
# Start the path quality analysis operation. The reflector will automatically stop the operation after it is completed.
[DeviceA-nqa-admin-test1-throughput] start
[DeviceA-nqa-admin-test1-throughput] quit
Verifying the configuration
# Display the result of the throughput operation.
[DeviceA] display nqa result
NQA entry (admin admin, tag test1) test results:
Basic results :
Initial speed(Kbps) : 100000
Speed granularity(Kbps): 1000
Probe duration(s) : 60
Probe interval(s) : 4
Allowed-loss-ratio : 1/10000
Throughput results:
Frame size(Byte): 64
Current speed(Kbps): -
Frame-loss(Loss/Tx): -
Status : Failed
Time : 2015-03-17 07:20:40.8
Frame size(Byte): 512
Current speed(Kbps): 4000
Frame-loss(Loss/Tx): 0/10000
Status : Succeeded
Time : 2015-03-17 07:21:40.8
Frame size(Byte): 1024
Current speed(Kbps): 8000
Frame-loss(Loss/Tx): 0/10000
Status : Succeeded
Time : 2015-03-17 07:22:52.8
Frame size(Byte): 1280
Current speed(Kbps): 10000
Frame-loss(Loss/Tx): 0/10000
Status : Succeeded
Time : 2015-03-17 07:23:45.8
Frame size(Byte): 1518
Current speed(Kbps): 10000
Frame-loss(Loss/Tx): 0/10000
Status : Succeeded
Time : 2015-03-17 07:24:45.8
Configuring TWAMP Light
About TWAMP Light
Two-Way Active Measurement Protocol (TWAMP) defines a standard to measure the network performance between network devices on an IP network. It uses UDP packets to measure the two-way Frame Transfer Delay (FTD), Frame Delay Variation (FDV), and Frame Loss Ratio (FLR). The TWAMP Light provides a simple structure of TWAMP. It simplifies the control protocol for establishing performance measurement sessions and improves test performance.
TWAMP Light architecture
TWAMP Light uses the client-server model.
Figure 4 describes the TWAMP Light roles and the typical network diagram.
On the client, the following roles are configured:
· TWAMP Light client—Configures TWAMP Light test sessions.
· TWAMP Light sender—Starts and stops TWAMP Light test sessions, and collect statistics.
On the server, the TWAMP Light responder, also known as the destination device, is configured. The responder reflects the packets back to the TWAMP Light sender. You must enable the NQA server on the destination device, and create the TWAMP Light responder and test sessions.

TWAMP Light operating mechanism
A TWAMP Light test contains a set of parameters for a test session such as the source IP address and destination IP address.
Each TWAMP Light test session is uniquely identified by the test session ID. You can create and run multiple test sessions on one TWAMP Light client.
The TWAMP Light client and TWAMP Light responder interact as follows:
1. The TWAMP Light client constructs TWAMP Light test packets, and sends them to the TWAMP Light responder.
2. The TWAMP Light responder reflects the test packets to the TWAMP Light client.
3. Upon receiving the reflected packets, the TWAMP Light client calculates the packet loss ratio and round-trip time to determine the service quality from source to destination.
After a TWAMP Light test starts, the TWAMP light client runs the tests permanently or repeats the test at the specified interval. Each test sends one test packet. You can set the test duration and number of test packets to be sent.
Threshold monitoring
Threshold monitoring enables the TWAMP Light client to take a predefined action when the TWAMP Light test performance metrics violate the specified thresholds.
The TWAMP Light test monitors the following metrics:
· Two-way frame delay variation.
· Two-way frame transfer delay.
· Two-way frame loss rate.
In a TWAMP test, the device monitors the test result, and starts the monitoring time when either of the following conditions is met:
· The monitoring result goes beyond the threshold upper limit.
· The monitoring result drops below the threshold lower limit from a monitoring result higher than the lower limit.
If either condition is always true during the monitoring time, a threshold violation occurs and a trap or inform message is generated and sent to the NMS. You set the monitoring time by using the corresponding command.
Protocols and standards
· RFC 5357, A Two-Way Active Measurement Protocol (TWAMP)
Restrictions and guidelines: TWAMP Light configuration
When performing a TWAMP test and a TWAMP Light test simultaneously on a device, make sure the combination of the destination address, port number, and VPN instance for one test is not completely the same as the other. This can avoid inaccurate test results caused by invalid service packets.
To avoid probe failures, follow these restrictions and guidelines when configuring the listening port on the TWAMP Light server and TWAMP Light client:
· Do not specify a well-known port.
· Make sure the specified port number is not used by any services on the device.
¡ To obtain the IPv4 addresses and the port numbers in use on this device, see the Local Addr:port field in the output from the display tcp and display udp commands.
¡ To obtain the IPv6 addresses and the port numbers in use on this device, see the LAddr->port field in the output from the display ipv6 tcp and display ipv6 udp commands.
The destination port configured for the operation (with the destination port command) on the TWAMP Light client must be the same as the listening port configured on the server.
TWAMP Light tasks at a glance
To configure TWAMP Light, perform the following tasks:
1. Configuring the TWAMP Light server
2. Configuring the TWAMP Light client
3. (Optional.) Configuring threshold monitoring
4. Starting the test on the TWAMP Light sender
5. (Optional.) Stopping the test on the TWAMP Light sender
Configuring the TWAMP Light server
1. Enter system view.
system-view
2. Enable the NQA server.
nqa server enable
By default, the NQA server is disabled.
3. Enable the TWAMP Light responder on the NQA server and enter its view.
nqa twamp-light responder
4. Create a test session on the TWAMP Light responder.
test-session session-id [ interface interface-type interface-number ] { destination-mac mac-address source-mac mac-address | { ip | ipv6 } destination address source address destination-port port-number source-port port-number [ vpn-instance vpn-instance-name ] } * [ description text | timestamp-format { ntp | ptp } | vlan vlan-id ] *
Configuring the TWAMP Light client
Restrictions and guidelines
In the TWAMP Light test, a test session is identified by the combination of its address and port number. To ensure the test result, you cannot specify the same combination of address and port number for multiple test sessions.
Enabling the NQA client
1. Enter system view.
system-view
2. Enable the NQA client.
nqa agent enable
By default, the NQA client is enabled.
After the NQA client is enabled, the TWAMP Light test session configuration can takes effect.
Creating a test session on the TWAMP Light client
1. Enter system view.
system-view
2. Enter TWAMP Light client view.
nqa twamp-light client
3. Create a test session on the TWAMP Light client and enter the client-session view.
test-session session-id
4. (Optional.) Specify the description for the probe packets.
description text
By default, no description is specified.
Configuring the IP address and port number for the TWAMP Light test session
1. Enter system view.
system-view
2. Enter TWAMP Light client view.
nqa twamp-light client
3. Enter TWAMP Light client test-session view.
test-session session-id
4. Specify the source IP address for the probe packets.
IPv4:
source ip ip-address
By default, no source IPv4 address for the probe packets is specified.
IPv6:
source ipv6 ipv6-address
By default, no source IPv6 address for the probe packets is specified.
5. Specify the destination IP address for the probe packets.
IPv4:
destination ip ipv4-address
By default, no destination IPv4 address for the probe packets is specified.
IPv6:
destination ipv6 ipv6-address
By default, no destination IPv6 address for the probe packets is specified.
6. Specify the source interface for the probe packets.
source interface interface-type interface-number
By default, no source interface for the probe packets is specified.
The specified source interface must be up.
7. Specify the source port number for the probe packets.
source port port-number
By default, no source port number for the probe packets is specified.
For TWAMP Light tests, you must configure this command. For the probe operation to succeed, make sure the specified port number is not used by any services on the device.
8. Specify the destination port number for the probe packets.
destination port port-number
By default, no destination port number for the probe packets is specified.
9. Specify the source MAC address for the probe packets.
source mac mac-address
By default, no source MAC address for the probe packets is specified.
10. Specify the destination MAC address for the probe packets.
destination mac mac-address
By default, no destination MAC address for the probe packets is specified.
11. (Optional.) Specify the VPN instance where the test is performed.
vpn-instance vpn-instance-name
By default, no VPN instance is specified. The test is performed on the public network.
Configuring other parameters for the TWAMP Light probe packets
1. Enter system view.
system-view
2. Enter TWAMP Light client view.
nqa twamp-light client
3. Enter TWAMP Light client test-session view.
test-session session-id
4. Specify the timestamp format for the TWAMP Light test session.
timestamp-format { ntp | ptp }
By default, the timestamp format for the TWAMP Light test is PTP.
5. Specify the payload parameters for the TWAMP Light test.
¡ Set the payload size for each probe packet.
data-size size
The default payload size is 142 bytes.
¡ Specify the payload fill string for each probe packet.
hex-data-fill { 00 | 55 | aa | ff }
If you execute the command multiple times, the most recent configuration takes effect.
The default payload fill string is all-zero.
6. (Optional.) Specify the priority for the probe packets.
¡ Specify the 802.1p priority for the probe packets.
priority 8021p value
By default, the 802.1p priority of the probe packets is 0.
¡ Set the ToS value in the IP header of the probe packets.
tos value
The default setting is 0.
7. (Optional.) Bind an interface as the output interface for a TWAMP Light test session.
test-session session-id bind interface interface-type interface-number
By default, no interface is specified as the output interface for a TWAMP Light test session.
Configuring threshold monitoring
1. Enter system view.
system-view
2. Enable the TWAMP Light client and enter its view.
nqa twamp-light client
3. Create a test session on the TWAMP Light client and enter the client-session view.
test-session session-id
4. Configure a reaction entry. Choose the following tasks as needed:
¡ Configure a reaction entry for monitoring the two-way delay.
reaction item-number checked-element two-way-delay threshold-value upper-threshold lower-threshold [ action-type { none | trap-only } ]
By default, no reaction entry is configured for monitoring the two-way delay.
¡ Configure a reaction entry for monitoring the two-way packet loss.
reaction item-number checked-element two-way-loss threshold-value upper-threshold lower-threshold [ action-type { none | trap-only } ]
By default, no reaction entry is configured for monitoring the two-way packet loss.
¡ Configure a reaction entry for monitoring the two-way jitter.
reaction item-number checked-element two-way-jitter threshold-value upper-threshold lower-threshold [ action-type { none | trap-only } ]
By default, no reaction entry is configured for monitoring the two-way jitter.
Starting the test on the TWAMP Light sender
Restrictions and guidelines
In the TWAMP Light test, a test session is identified by the combination of source IP address, source port number, destination IP address, and destination port number. To ensure the test result, do not specify the same combination for multiple test sessions.
Procedure
5. Enter system view.
system-view
6. Enable the TWAMP Light sender and enter its view.
nqa twamp-light sender
7. Start a TWAMP Light test.
start test-session session-id { permanent | duration duration | packet-count count } [ tx-interval { 10 | 100 | 1000 | 10000 | 30000 } ] [ time-out timeout ] [ [ statistics-interval statistics-interval ] monitor-time time ]
Stopping the test on the TWAMP Light sender
8. Enter system view.
system-view
9. Enter the TWAMP Light sender view.
nqa twamp-light sender
10. Stop the TWAMP Light test.
stop { all | test-session session-id }
Display and maintenance commands for TWAMP Light
Execute display commands in any view and reset commands in user view on the TWAMP Light client.
|
Task |
Command |
|
Display test session statistics on the TWAMP Light client, including two-way delay, two-way jitter, and two-way packet loss. |
display nqa twamp-light client statistics { two-way-delay | two-way-loss } test-session session-id |
|
Display the current monitoring results of reaction entries for the TWAMP Light test sessions. |
display nqa twamp-light client test-session reaction counters [ session-id [ item-number ] ] |
|
Display test session information on the TWAMP Light client. |
display nqa twamp-light client [ test-session session-id | verbose ] |
|
Clear statistics of TWAMP Light test sessions. |
reset nqa twamp-light statistics { all | test-session session-id } |
Execute display commands in any view on the TWAMP Light responder.
|
Task |
Command |
|
Display test sessions on the TWAMP Light responder. |
display nqa twamp-light responder [ test-session session-id ] |
TWAMP Light configuration examples
Example: Configuring TWAMP Light test on a common Layer 3 network
Network configuration
As shown in Figure 5, configure a TWAMP Light test to measure the service quality from Device A to Device B.

Procedure
11. Assign IP addresses to interfaces, as shown in Figure 5. (Details not shown.)
12. Configure static routes or a routing protocol to make sure the devices can reach each other. (Details not shown.)
13. Configure Device B:
# Enable the NQA server.
<DeviceB> system-view
[DeviceB] nqa server enable
# Create test session 1 on the TWAMP Light responder with the destination IP address 10.2.2.2, source IP address 10.1.1.1, destination port 20000, and source port 10000.
[DeviceB] nqa twamp-light responder
[DeviceB-twamp-light-responder] test-session 1 ip destination 10.2.2.2 source 10.1.1.1 destination-port 20000 source-port 10000
[DeviceB-twamp-light-responder] quit
14. Configure Device A:
# Create test session 1 on the TWAMP Light client.
<DeviceA> system-view
[DeviceA] nqa twamp-light client
[DeviceA-nqa-twamp-light-client] test-session 1
# Specify 10.1.1.1 as the source IP address for the probe packets.
[DeviceA-nqa-twamp-light-client-session1] source ip 10.1.1.1
# Specify 10.2.2.2 as the destination IP address for the probe packets.
[DeviceA-nqa-twamp-light-client-session1] destination ip 10.2.2.2
# Specify 10000 as the source port number for the probe packets.
[DeviceA-nqa-twamp-light-client-session1] source port 10000
# Specify 20000 as the destination port number for the probe packets.
[DeviceA-nqa-twamp-light-client-session1] destination port 20000
[DeviceA-nqa-twamp-light-client-session1] quit
[DeviceA-nqa-twamp-light-client] quit
# Create a TWAMP Light sender and enter its view.
[DeviceA] nqa twamp-light sender
# Start the TWAMP Light test with the packet sending interval, statistics collection interval, and monitoring time set to 100, 10000, and 20000 in milliseconds, respectively.
[DeviceA-nqa-twamp-light-sender] start test-session 1 permanent tx-interval 100 statistics-interval 10000 monitor-time 20000
[DeviceA-nqa-twamp-light-sender] quit
Verifying the configuration
# Display information about test session 1.
[DeviceA] display nqa twamp-light client
Brief information about all test sessions:
Total sessions: 1
Active sessions: 1
------------------------------------------------------------------------------------
ID Status Source IP/Port Destination IP/Port
1 Active 10.1.1.1/10000 10.2.2.2/20000
# Display test session statistics about two-way packet loss for test session 1.
[DeviceA] display nqa twamp-light client statistics two-way-loss test-session 1
Latest two-way loss statistics:
Index Loss count Loss ratio Error count Error ratio
11006 5 50.0000% 0 0.0000%
11007 3 30.0000% 0 0.0000%
11008 4 40.0000% 0 0.0000%
11009 8 80.0000% 0 0.0000%
--------------------------------------------------------------------
Average loss count : 5 Average loss ratio : 55.3333%
Maximum loss count : 10 Maximum loss ratio : 100.0000%
Minimum loss count : 1 Minimum loss ratio : 10.0000%
Average error count: 0 Average error ratio: 0.0000%
Maximum error count: 0 Maximum error ratio: 0.0000%
Minimum error count: 0 Minimum error ratio: 0.0000%
Example: Configuring TWAMP Light test on an L2VPN network
Network configuration
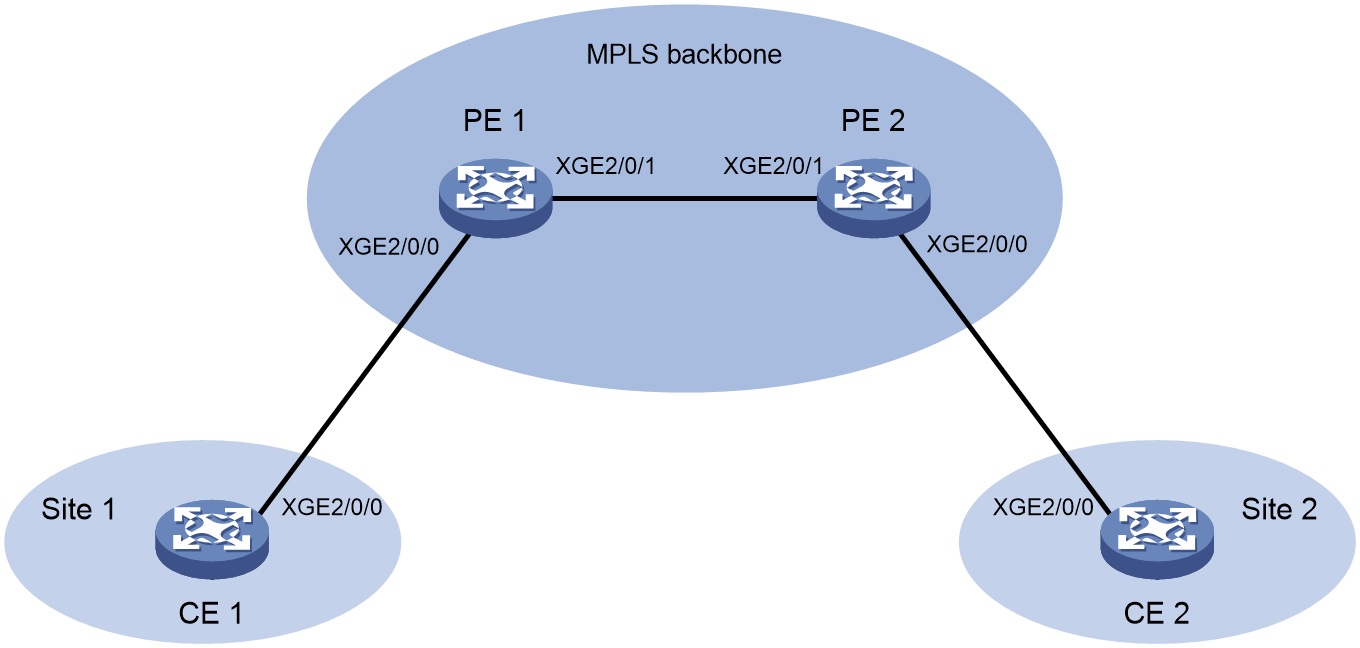
As shown in Figure 5, create an L2VPN between PE 1 and PE 2 over the backbone to allow communication between CE 1 and CE 2. Configure a TWAMP Light test to measure the service quality from PE 1 to PE 2.
Figure 6 Network diagram
Procedure
15. Assign IP addresses to interfaces. (Details not shown.)
16. Configure static routes or a routing protocol and create an L2VPN to make sure the devices can reach each other. For more information about creating an L2VPN, see MPLS L2VPN in MPLS Configuration Guide.
17. Configure PE 2 as the TWAMP Light responder:
<PE2> system-view
# Enable the NQA server.
<DeviceB> system-view
[PE2] nqa server enable
# Create test session 1 on the TWAMP Light responder with the destination IP address 4.4.4.2, source IP address 4.4.4.1, destination port 8888, and source port 7777.
[PE2] nqa twamp-light responder
[PE2-nqa-twamp-light-responder] test-session 1 interface ten-gigabitethernet 2/0/0 ip destination 4.4.4.2 source 4.4.4.1 destination-port 8888 source-port 7777 destination-mac 1-1-2 source-mac 1-1-1
[PE2-nqa-twamp-light-responder] quit
18. Configure PE 1:
# Specify PE 1 as the TWAMP Light client.
<PE1> system-view
[PE1] nqa twamp-light client
# Specify a destination IP address (any valid IP address except the one on the connected interface of PE 2), destination MAC address (any valid MAC address), and destination port number (any valid port number) for the probe packets.
[PE1-nqa-twamp-light-client] test-session 1
[PE1-nqa-twamp-light-client-session1] destination ip 4.4.4.2
[PE1-nqa-twamp-light-client-session1] destination mac 0001-0001-0002
[PE1-nqa-twamp-light-client-session1] destination port 8888
# Specify Ten-GigabitEthernet2/0/0 as the source interface for the probe packets. Specify a source IP address (any valid IP address except the one on the connected interface of PE 1), source MAC address (any valid MAC address), and source port number (any valid port number) for the probe packets.
[PE1-nqa-twamp-light-client-session1] source interface gigabitethernet 1/0/1
[PE1-nqa-twamp-light-client-session1] source ip 4.4.4.1
[PE1-nqa-twamp-light-client-session1] source mac 0001-0001-0001
[PE1-nqa-twamp-light-client-session1] source port 7777
[PE1-nqa-twamp-light-client-session1] quit
[PE1-nqa-twamp-light-client] quit
19. Start the TWAMP Light test.
[PE1] nqa twamp-light sender
[PE1-nqa-twamp-light-sender] start test-session 1 permanent
[PE1-nqa-twamp-light-sender] quit
Verifying the configuration
# Display information about test session 1.
[PE1] display nqa twamp-light client
Brief information about all test sessions:
Total sessions: 1
Active sessions: 1
-------------------------------------------------------------------
ID Status Source IP/Port Destination IP/Port
1 Active 4.4.4.1/7777 4.4.4.2/8888
# Display test session statistics about two-way packet loss for test session 1.
[PE1] display nqa twamp-light client statistics two-way-loss test-session 1
Latest two-way loss statistics:
Index Loss count Loss ratio Error count Error ratio
1 0 0.0000% 0 0.0000%
2 0 0.0000% 0 0.0000%
3 0 0.0000% 0 0.0000%
4 0 0.0000% 0 0.0000%
--------------------------------------------------------------------
Average loss count : 0 Average loss ratio : 0.0000%
Maximum loss count : 0 Maximum loss ratio : 0.0000%
Minimum loss count : 0 Minimum loss ratio : 0.0000%
Average error count: 0 Average error ratio: 0.0000%
Maximum error count: 0 Maximum error ratio: 0.0000%
Minimum error count: 0 Minimum error ratio: 0.0000%
# Display test session statistics about two-way delay for test session 1.
[PE1] display nqa twamp-light client statistics two-way-delay test-session 1
Latest two-way delay statistics(us):
Index Delay(Avg) Jitter(Avg) SD-jitter(Avg) DS-jitter(Avg)
1 46 1 2 1
2 46 1 2 1
3 46 0 1 1
4 46 0 1 1
--------------------------------------------------------------------
Average delay : 46 Average jitter : 1
Maximum delay : 46 Maximum jitter : 1
Minimum delay : 46 Minimum jitter : 0
Average SD jitter: 1 Average DS jitter: 1
Maximum SD jitter: 1 Maximum DS jitter: 1
Minimum SD jitter: 0 Minimum DS jitter: 0
Example: Configuring TWAMP Light test on an L3VPN network
Network configuration
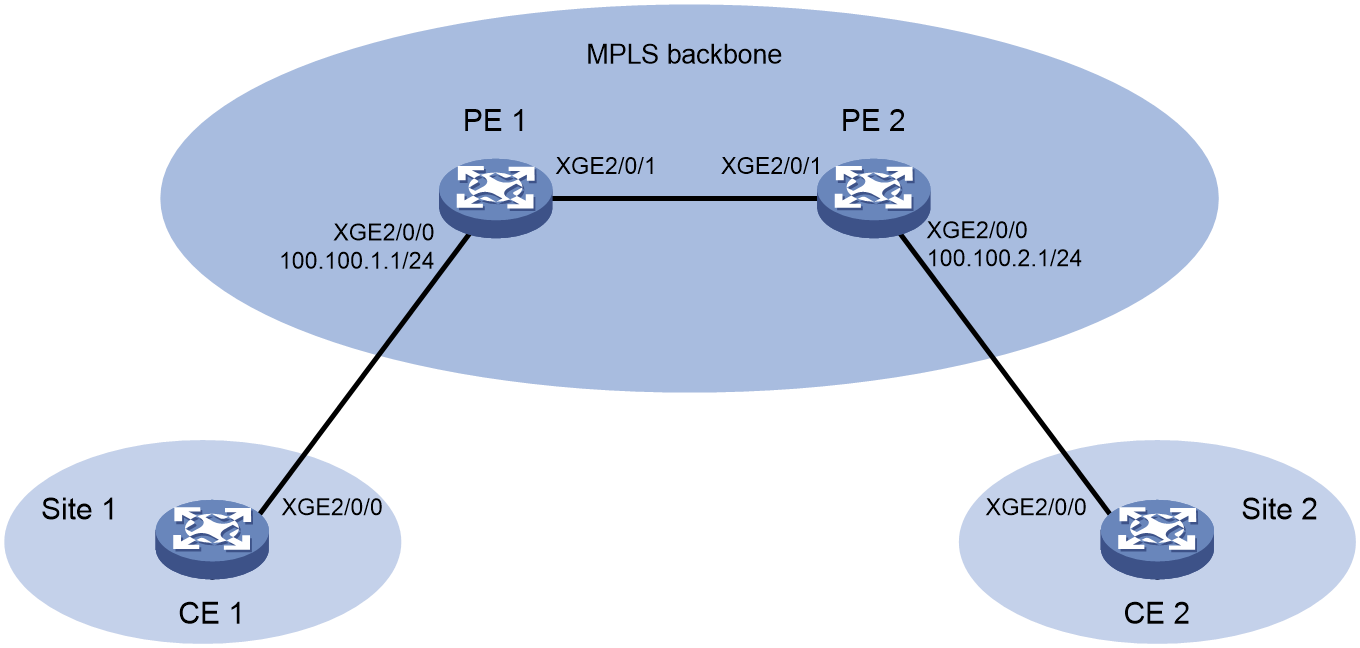
As shown in Figure 5, create an L3VPN between PE 1 and PE 2 over the backbone to allow communication between CE 1 and CE 2. Configure a TWAMP Light test to measure the service quality from PE 1 to PE 2.
Figure 7 Network diagram
Procedure
20. Assign IP addresses to interfaces. (Details not shown.)
21. Configure static routes or a routing protocol and create an L3VPN to make sure the devices can reach each other. For more information about creating an L3VPN, see MPLS L3VPN in MPLS Configuration Guide.
22. Configure PE 2 as the TWAMP Light responder:
# Enable the NQA server.
<DeviceB> system-view
[PE2] nqa server enable
# Create test session 1 on the TWAMP Light responder with the destination IP address 100.100.2.1, source IP address 100.100.1.1, destination port 10000, and source port 20000.
[PE2] nqa twamp-light responder
[PE2-nqa-twamp-light-responder] test-session 1 ip destination 100.100.2.1 source 100.100.1.1 destination-port 10000 source-port 20000 vpn-instance 1
[PE2-nqa-twamp-light-responder] quit
23. Configure PE 1:
# Specify PE 1 as the TWAMP Light client.
<PE1> system-view
[PE1] nqa twamp-light client
# Specify 100.100.2.1 as the destination IP address and 10000 as the destination port number (use any valid port number) for the probe packets.
[PE1-nqa-twamp-light-client] test-session 1
[PE1-nqa-twamp-light-client-session1] destination ip 100.100.2.1
[PE1-nqa-twamp-light-client-session1] destination port 10000
# Specify 100.100.1.1 as the source IP address and 20000 as the source port number for the probe packets. Specify VPN instance 1 as the VPN instance where the test is performed
[PE1-nqa-twamp-light-client-session1] source ip 100.100.1.1
[PE1-nqa-twamp-light-client-session1] source port 20000
[PE1-nqa-twamp-light-client-session1] vpn-instance 1
[PE1-nqa-twamp-light-client-session1] quit
[PE1-nqa-twamp-light-client] quit
24. Start the TWAMP Light test on PE 1.
[PE1] nqa twamp-light sender
[PE1-nqa-twamp-light-sender] start test-session 1 permanent
[PE1-nqa-twamp-light-sender] quit
Verifying the configuration
# Display information about test session 1.
[PE1] display nqa twamp-light client
Brief information about all test sessions:
Total sessions: 1
Active sessions: 1
----------------------------------------------------------------------
ID Status Source IP/Port Destination IP/Port
1 Active 100.100.1.1/20000 100.100.2.1/10000
# Display test session statistics about two-way packet loss for test session 1.
[PE1] display nqa twamp-light client statistics two-way-loss test-session 1
Latest two-way loss statistics:
Index Loss count Loss ratio Error count Error ratio
1 0 0.0000% 0 0.0000%
2 0 0.0000% 0 0.0000%
3 0 0.0000% 0 0.0000%
4 0 0.0000% 0 0.0000%
--------------------------------------------------------------------
Average loss count : 0 Average loss ratio : 0.0000%
Maximum loss count : 0 Maximum loss ratio : 0.0000%
Minimum loss count : 0 Minimum loss ratio : 0.0000%
Average error count: 0 Average error ratio: 0.0000%
Maximum error count: 0 Maximum error ratio: 0.0000%
Minimum error count: 0 Minimum error ratio: 0.0000%
# Display test session statistics about two-way delay for test session 1.
[PE1] display nqa twamp-light client statistics two-way-delay test-session 1
Latest two-way delay statistics(us):
Index Delay(Avg) Jitter(Avg) SD-jitter(Avg) DS-jitter(Avg)
1 46 1 2 1
2 46 1 2 1
3 46 0 1 1
4 46 0 1 1
--------------------------------------------------------------------
Average delay : 46 Average jitter : 1
Maximum delay : 46 Maximum jitter : 1
Minimum delay : 46 Minimum jitter : 0
Average SD jitter: 1 Average DS jitter: 1
Maximum SD jitter: 1 Maximum DS jitter: 1
Minimum SD jitter: 0 Minimum DS jitter: 0
