- Table of Contents
-
- 12-Network Management and Monitoring Configuration Guide
- 00-Preface
- 01-GOLD configuration
- 02-iFIT configuration
- 03-NETCONF configuration
- 04-NQA configuration
- 05-NTP configuration
- 06-Packet capture configuration
- 07-PTP configuration
- 08-SNMP configuration
- 09-TCP connection trace configuration
- 10-Information center configuration
- 11-Network synchronization configuration
- 12-System maintenance and debugging configuration
- 13-Process monitoring and maintenance configuration
- 14-Mirroring configuration
- Related Documents
-
| Title | Size | Download |
|---|---|---|
| 02-iFIT configuration | 322.63 KB |
Application-level quality measurement
Configuring iFIT for application-level quality measurement
Configuring a measurement mode
Configuring a measurement period
Configuring a transit node and the egress node
Display and maintenance commands for iFIT for iFIT application-level quality measurement
Example: Configuring iFIT on an IPv4 L3VPN over SRv6 network
Example: Configuring iFIT on an IPv6 EVPN L3VPN over SRv6 network
Configuring iFIT
About iFIT
In-situ Flow Information Telemetry (iFIT) determines network performance by measuring the packet loss and packet delay of service packets transmitted on SRv6, G-SRv6 transit network. iFIT is easy to deploy and provides an accurate assessment of network performance.
iFIT technical standards
The implementation of iFIT adheres to the technical standards of China Telecom and China Unicom, which have some slight differences, for example, in encapsulation requirements for iFIT headers in IPv6 packets. Choose one set of standards as needed.
Devices included in iFIT measurement on the same SRv6 link must be configured with the same technical standards. If you fail to do so, iFIT packet parsing might fail, leading to inaccurate iFIT measurement results.
Application-level quality measurement
Application scenarios
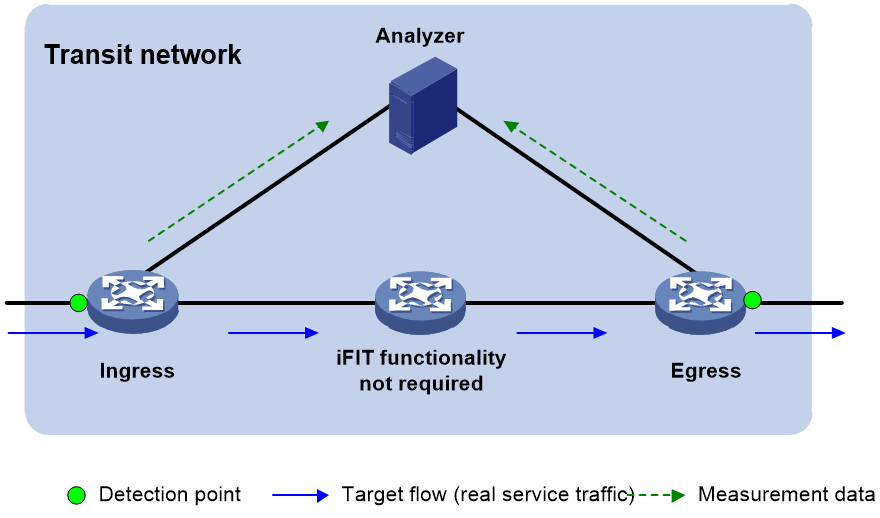
End-to-end measurement
To measure the packet loss and packet delay on the entire network, use end-to-end measurement. As shown in Figure 1, iFIT measures whether packet loss or packet delay occurs between the ingress node (where the target flow enters the IP network) and the egress node (where the flow leaves the network).
Figure 1 End-to-end measurement
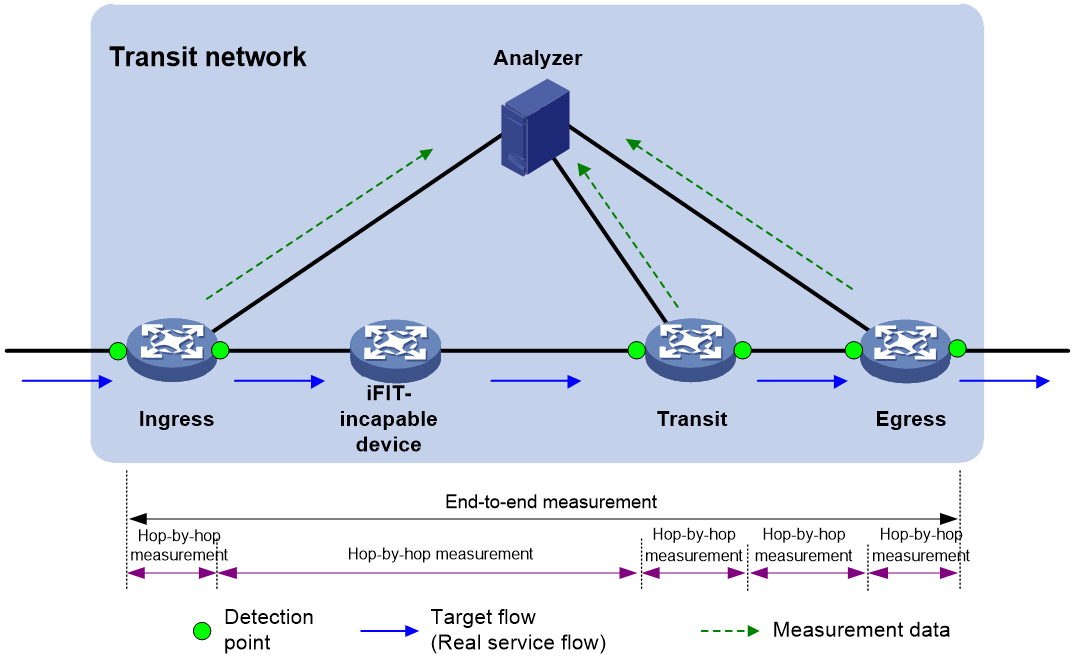
Hop-by-hop measurement
To accurately locate the packet loss and packet delay of each network node, use hop-by-hop measurement. To locate the faulty node, you can divide an end-to-end network into smaller measurement spans. As shown in Figure 2, iFIT measures whether the packet loss and packet delay occurs between the ingress node and egress node, ingress node and transit node, transit node and egress node.
Figure 2 Hop-by-hop measurement
|
|
NOTE: When the egress device does not support iFIT, end-to-end measurement cannot be performed. In this case, you can configure iFIT on the ingress device and other devices that support iFIT to perform hop-by-hop measurement. This can measure performance of a specific link. |
iFIT architecture
Figure 1 and Figure 2 show the important iFIT concepts including transit network, target flow, detection point, and measurement system.
Transit network
A transit network is a network that transmits target flows. A service flow are neither generated nor terminated within the transit network. In the current software version, iFIT supports measuring only service flows on Layer 3 transit networks.
To measure the transmission quality of a target flow in a transit network, iFIT adds an iFIT header to the target flow. A tunnel network corresponds to the SRv6 and G-SRv6 transit network types. On a Tunnel network, the ingress node itself must encapsulate service packets with SRv6. To implement iFIT measurement, the ingress node adds extension fields to carry iFIT measurement data during the encapsulation of service packets with SRv6. This is used for subsequent recognition and processing on forwarding nodes.
Target flow
iFIT provides statistics on a per-flow basis. The target flows can be divided into the following types:
· Static flow—A static flow is used to map and manage dynamic flows. A service flow acts as a configuration template. The ingress node generates a static flow after you enable iFIT measurement and execute the flow command to configure the flow match criteria on the ingress node. The ingress node uses a device ID and a flow ID to uniquely identify the static flow. The device ID is configured by the device-id command and the flow ID is a number randomly generated on the ingress node in the range of 1 to 1048575.
To view the device ID, flow ID, transit network type, and other settings of a static flow on the ingress node, execute the display ifit flow static command.
· Dynamic flow—A dynamic flow is a service flow dynamically learnt by the device. Dynamic flows are generated as follows:
¡ For the ingress node, if the device receives a service flow that matches the flow match criteria of a static flow, a dynamic flow with the same device ID and flow ID as the static flow is generated. The ingress node also encapsulates the device ID and the flow ID in the iFIT headers of service packets before sending the service packets to a transit node and the egress node.
¡ For a transit node and the egress node, they parse the received service packets and generate dynamic flows by dynamically learning from the iFIT headers of the service packets.
The device uses the device ID and flow ID in the iFIT header to identify the flow. If the device does not receive the packets using the same device ID and the same flow ID for a period of time, the device will delete the dynamic flow entry.
Detection point
A detection point is an interface where iFIT measurement is performed. You can specify detection points as required.
Measurement system
The measurement system includes the following device role:
· The ingress node refers to the point that the flow enters the transit network. It filters the target flow, adds iFIT headers to the packets of the flow, collects packet statistics and reports packet statistics to the analyzer.
· A transit node resides between the egress node and the ingress node. This type of point identifies the target flow by the iFIT header and reports the measurement statistics to the analyzer according to the measurement mode in the iFIT header.
On an SRv6 network, the source and endpoint nodes of an SRv6 tunnel act as the ingress and egress nodes, respectively, with the nodes in between named as transit nodes. Transmit nodes are divided into two types: Those in the SID list and those not in the SID list. By default, only transit nodes in the SID list can perform iFIT measurement. Those not in the SID list are not included in SRv6 processing and can only perform regular IPv6 packet forwarding, which even with iFIT measurement enabled, do not parse iFIT headers for iFIT measurement. For transit nodes to parse the iFIT header and perform iFIT measurement, execute the ifit enable and trace-measure per-hop commands on these transit nodes.
· The egress node identifies the target flow by the iFIT header, reports the measurement statistics to the analyzer, and removes the iFIT header from the packet.
· The analyzer collects the statistics reported by the ingress node, transit nodes, and egress node for data summarization and calculation.
Operating mechanism
iFIT header
An iFIT header is encapsulated in service packets and contains key parameters such as device ID, flow ID, measurement period, measurement mode, whether to measure delay, and whether to measure packet loss.
· Device ID: On an iFIT private network, a device ID uniquely identifies a device included in iFIT measurement and a device ID and a flow ID uniquely identify an iFIT flow.
· Flow ID: A flow ID is automatically generated on the ingress node. It will be encapsulated in the iFIT headers and sent to a transit node and the egress node to uniquely identify a target flow along with the device ID or device IP on an iFIT network.
· Measurement period: The device performs iFIT measurement periodically. A measurement period refers to the time interval from the start of a measurement to the collection and reporting of the measurement data is called.
· Measurement mode: Indicates end-to-end measurement or hop-by-hop measurement.
Time synchronization mechanism
Before starting the iFIT measurement, make sure all devices are time synchronized. Therefore, all iFIT-enabled devices can use the same measurement period to report the packet statistics to the analyzer. As a best practice, the analyzer and all iFIT-enabled devices are time synchronized to facilitate management and maintenance.
Both PTP and NTP can be used to synchronize time between devices. Time synchronization is accurate to sub-microseconds through PTP and to milliseconds through NTP.
· As a best practice, use PTP for time synchronization in an iFIT measurement network to ensure higher accuracy.
· If the devices do not support PTP, but support high-precision NTP, enable high-precision NTP on the local and remote devices.
· If the device does not support PTP or high-precision NTP for time synchronization, use the standard NTP. When the standard NTP is deployed, the device supports iFIT packet loss measurement but cannot perform delay measurement accurately. The delay is related with the physical link distance and network status. The transmission delay on some links might be less than one millisecond. Using NTP for time synchronization can affect the accuracy of iFIT delay measurement.
For more information about PTP and NTP, see "Configuring PTP” and "Configuring NTP", respectively.
Packet loss measurement mechanism
The number of incoming packets and that of outgoing packets on a network should be equal within a measurement period. If they are not equal, packet loss occurs in the transit network.
Packet delay measurement mechanism
When a packet pass through multiple detection points, each point will record the timestamp when the packet passes through the point and report the recorded timestamp to the analyzer. Then the analyzer can use the timestamp values reported by different detection points to calculate the packet delay.
Measurement data reporting mechanism
iFIT-enabled devices push the measurement data to the analyzer by using the gRPC protocol.
Currently, only gRPC dial-out mode is supported. In this mode, iFIT-enabled devices act as gRPC clients and the analyzer acts as a gRPC server (also called a gRPC collector in the gRPC protocol).
An iFIT-enabled device can send the iFIT data to the analyzer at either of the following intervals:
· gRPC subscription interval—If you set a gRPC subscription interval when configuring gRPC subscription, the device sends the iFIT data to the analyzer at the gRPC subscription interval after establishing a gRPC connection to the analyzer, regardless of whether the sampling path is a periodic sampling path or an event-trigger sampling path.
· iFIT measurement interval—If you do not set a gRPC subscription interval when configuring gRPC subscription and the sampling path is a periodic sampling path, the device cannot send the iFIT data to the analyzer. If you do not set a gRPC subscription interval when configuring gRPC subscription and the sampling path is an event-trigger sampling path, the device sends the iFIT data to the analyzer at the iFIT measurement interval after establishing a gRPC connection to the analyzer.
|
|
NOTE: · The iFIT periodic sampling path is ifit/flowstatistics/flowstatistic. · The iFIT event-trigger sampling paths are insuitoam/measurereport (containing iFIT measurement result) and insuitoam/flowinfo (containing iFIT flow information). |
For more information about gRPC, see gRPC configuration in Telemetry Configuration Guide. For more information about iFIT sampling paths, see the NETCONF API documentation of iFIT.
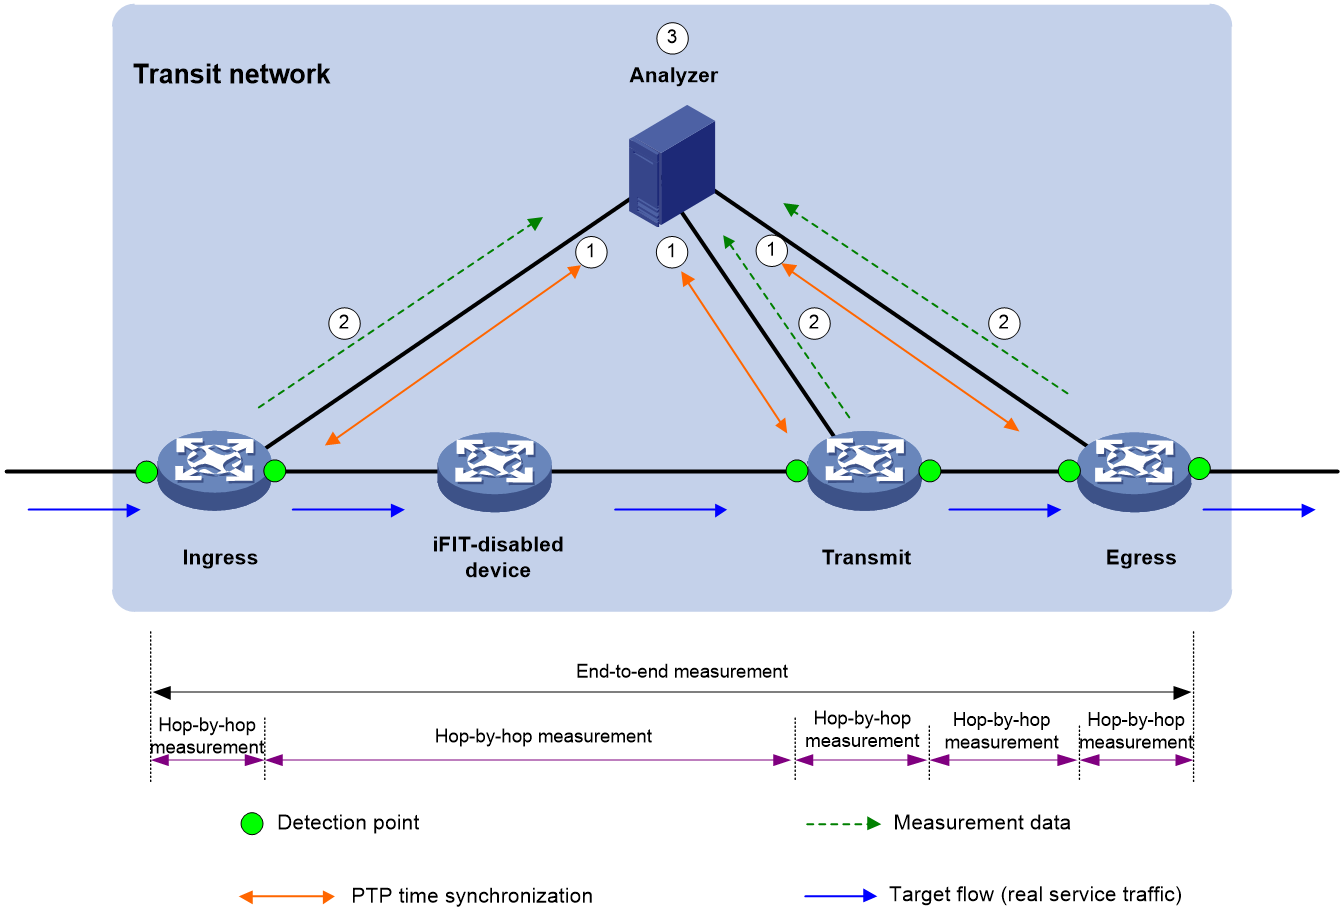
Working mechanism
The following illustrates the working mechanism of hop-by-hop measurement. No transit nodes exist in end-to-end measurement but end-to-end measurement works similarly as hop-by-hop measurement.
As shown in Figure 3, the flow passes through four devices. Three devices are enabled with iFIT. The iFIT measurement works as follows:
1. The analyzer synchronizes the time with all iFIT-enabled devices through the PTP protocol.
2. The iFIT-enabled devices takes the following actions:
a. The ingress interface of the transit network (interface bound to the target flow on the ingress node) parses the packets to identify the target flow. It encapsulates iFIT headers to the packets, counts the number of packets, and reports the packet quantity and timestamp to the analyzer through gRPC periodically.
The ingress node is the interface bound to the target flow.
b. Each transit interface counts the number of packets containing iFIT headers and reports the packet quantity and timestamp to the analyzer through gRPC periodically.
When the target flow passes through an iFIT-enabled device, the interfaces where the target flow enters the iFIT-enabled device and leaves the iFIT-enabled device are transit interfaces.
c. The egress interface of the transit network (where the target flow leaves the transit network) parses the packets to identify the target flow. It counts the number of packets containing iFIT headers, reports the packet quantity and timestamp to the analyzer through gRPC periodically, removes iFIT headers from the packets and forwards the packets.
When the target flow leaves the transit network, the interface where the target flow enters the egress node or leaves the egress node is the egress interface of the transit network. The interface used as the egress interface of the transit network varies by device model.
3. The analyzer calculates the packet delay for the target flow of the same period and same instance.
Configuring iFIT for application-level quality measurement
iFIT application-level quality measurement measures the metrics such as the packet loss rate and delay when service traffic passes through the transmission network. The measurement result can be used to assess the network transmission quality for the service traffic.
Restrictions and guidelines
An iFIT instance monitors only one flow. If you configure flows multiple times for an iFIT instance, the most recent configuration takes effect.
For the flows to be monitored by different instances, the flow attributes must not be identical and cannot conflict to avoid inaccurate measurement result.
As a best practice, configure iFIT first on the transit nodes and the egress node and then the ingress node. Thus, the measurement results of the previous measurement periods will not affected if iFIT measurement starts on the ingress node but not on the transit nodes and the egress node.
Modifying the iFIT instance or restarting the ingress node will cause flow ID change, which might cause inaccurate measurement data or no data in several measurement periods.
SRv6/G-SRv6 includes SRv6/G-SRv6 TE and SRv6/G-SRv6 BE networks. The iFIT configuration varies by network type as follows:
· On an SRv6/G-SRv6 TE network, after iFIT on a device in a SID list is enabled, the device can perform iFIT measurement. For a transit node not in a SID list, even with iFIT measurement enabled, this transit node does not parse iFIT headers for iFIT measurement. Such transit nodes can parse iFIT headers for iFIT measurement only when the ifit enable and trace-measure per-hop commands are executed on these transit nodes.
· On an SRv6/G-SRv6 BE network, if you specify hop-by-hop measurement as the measurement mode, iFIT generates iFIT data only on the ingress and egress nodes during SRv6/G-SRv6 forwarding. By default, the transit nodes only forward IPv6 packets and do not participate in SRv6/G-SRv6 processing, so no iFIT data is generated on the transit nodes. For transit nodes to perform iFIT measurement, execute the ifit enable and trace-measure per-hop commands on the transit nodes.
Prerequisites
Before configuring iFIT, configure PTP or NTP settings to synchronize time for the analyzer and all iFIT-enabled devices. Both PTP and NTP can be used to synchronize time between devices. time synchronization is accurate to sub-microseconds through PTP and to milliseconds through NTP.
· As a best practice, use PTP for time synchronization in an iFIT measurement network.
· If the devices do not support PTP but support high-precision NTP, enable high-precision NTP on the local and remote devices.
· If the devices do not support PTP or high-precision NTP, use standard NTP. When NTP is used, the device can measure packet loss rates, but the delay measurement is not accurate.
For more information about PTP and NTP, see "Configuring PTP” and "Configuring NTP", respectively.
To enable the iFIT-enabled devices to report the measurement results to the analyzer, configure gRPC on the analyzer and iFIT-enabled devices. For more information about gRPC, see gRPC configuration in Telemetry Configuration Guide.
Configuring the ingress node
Tasks at a glance
To configure the ingress node, perform the following tasks:
· Configuring a detection point
· Configuring a measurement mode
· Configuring a measurement period
Enabling iFIT
1. Enter system view.
system-view
2. Enable the iFIT functionality globally and enter its view, or enter the existing iFIT view.
ifit enable
By default, the iFIT functionality is disabled.
3. Specify the standards used by iFIT.
technical-standard { telecom | unicom }
By default, iFIT uses the Telecom technical standards
This command is not required for end-to-end measurement and will not impact the measurement results of end-to-end measurement.
To ensure correct measurement results of hop-by-hop measurement, you must execute this command and make sure the devices included in iFIT measurement are configured with the same technical standards.
Configuring a device ID
About this task
When the transit network type for a service flow is MPLS, SR-MPLS, SRv6, or G-SRv6, and iFIT measurement is required for the service flow, you must specify the device ID of a device. A device ID must be unique within an iFIT network. This is because in these types of transit networks, iFIT uses the device ID to uniquely identify a device and uses a device ID and a flow ID to uniquely identify a static flow and the corresponding dynamic flows.
Procedure
1. Enter system view.
system-view
2. Enter iFIT view.
ifit enable
3. Specify an iFIT device ID.
device-id device-id
By default, no device identifier is specified.
A device identifier is required to uniquely identify an iFIT device on an iFIT network.
Creating an iFIT instance
1. Enter system view.
system-view
2. Enter iFIT view.
ifit enable
3. Create an iFIT instance and enter its view.
instance instance-name
Configuring a static flow
About this task
Static flows are key elements for iFIT measurement. Before starting an iFIT measurement, you must configure a static flow to be measured on the ingress node. You do not need to configure a static flow on the transit nodes and egress node because the device can automatically learn the static flow through the iFIT header of the packets.
The device can perform iFIT measurement based on the following granularities in different scenarios:
· 5-tuple granularity—Used for measuring communication quality of service flows. You can use 5-tuple elements to match service flows and perform iFIT measurement on any service traffic on a network. This granularity is available for all networks supported by iFIT.
Procedure
1. Enter system view.
system-view
2. Enter iFIT view.
ifit enable
3. Create an iFIT instance and enter its view.
instance instance-name
4. On an L3VPN/EVPN L3VPN over SRv6/G-SRv6 network, configure a static flow to be monitored by the instance.
¡ iFIT measurement based on 5-tuple granularity:
- IPv4:
flow unidirection source-ip { src-ip-address [ src-mask-length ] | any } destination-ip { dest-ip-address [ dest-mask-length ] | any } [ protocol { { sctp | tcp | udp } [ source-port src-port-number ] [ destination-port dest-port-number ] | protocol-number } ] [ dscp dscp-value ] vpn-instance vpn-instance-name
- IPv6:
flow unidirection source-ipv6 { src-ipv6-address [ src-prefix-length ] | any } destination-ipv6 { dest-ipv6-address [ dest-prefix-length ] | any } [ protocol { { sctp | tcp | udp } [ source-port src-port-number ] [ destination-port dest-port-number ] | protocol-number } ] [ dscp dscp-value ] vpn-instance vpn-instance-name
By default, no static flow is configured for an iFIT instance.
5. On an EVPN VPLS over SRv6/G-SRv6 network, configure a static flow to be monitored by the instance.
¡ iFIT measurement based on 5-tuple granularity:
- IPv4:
flow unidirection source-ip { src-ip-address [ src-mask-length ] | any } destination-ip { dest-ip-address [ dest-mask-length ] | any } [ protocol { { sctp | tcp | udp } [ source-port src-port-number ] [ destination-port dest-port-number ] | protocol-number } ] [ dscp dscp-value ] vsi vsi-name
- IPv6:
flow unidirection source-ipv6 { src-ipv6-address [ src-prefix-length ] | any } destination-ipv6 { dest-ipv6-address [ dest-prefix-length ] | any } [ protocol { { sctp | tcp | udp } [ source-port src-port-number ] [ destination-port dest-port-number ] | protocol-number } ] [ dscp dscp-value ] vsi vsi-name
By default, no static flow is configured for an iFIT instance.
6. On an EVPN VPWS over SRv6/G-SRv6 network, configure a static flow to be monitored by the instance.
¡ iFIT measurement based on 5-tuple granularity:
- IPv4:
flow unidirection source-ip { src-ip-address [ src-mask-length ] | any } destination-ip { dest-ip-address [ dest-mask-length ] | any } [ protocol { { sctp | tcp | udp } [ source-port src-port-number ] [ destination-port dest-port-number ] | protocol-number } ] [ dscp dscp-value ] xconnect-group group-name connection connection-name
- IPv6:
flow unidirection source-ipv6 { src-ipv6-address [ src-prefix-length ] | any } destination-ipv6 { dest-ipv6-address [ dest-prefix-length ] | any } [ protocol { { sctp | tcp | udp } [ source-port src-port-number ] [ destination-port dest-port-number ] | protocol-number } ] [ dscp dscp-value ] xconnect-group group-name connection connection-name
By default, no static flow is configured for an iFIT instance.
Configuring a detection point
About this task
Before enabling iFIT measurement on the ingress node of an instance, you must bind an interface to the instance. After you bind an interface to an instance, iFIT parses the packets passing through the interface to identify the target packets and add an iFIT header to each target packets. Meanwhile, iFIT will count the number of target packets, and send the packet count and timestamp to the analyzer at intervals through gRPC.
You can configure only one set of flow match criteria for an instance. An instance can be bound to multiple interfaces. Each bound interface matches target flows based on the same set of criteria and assigns different flow IDs to target flows. iFIT measures the delay and packet loss of target flows on a per-interface basis.
Restrictions and guidelines
You can bind an iFIT instance to only a Layer 3 physical interface or Layer 3 aggregate interface.
Procedure
1. Enter system view.
system-view
2. Enter iFIT view.
ifit enable
3. Create an iFIT instance and enter its view.
instance instance-name
4. Bind an interface to the instance.
bind interface interface-type interface-number
By default, an instance is not bound to any interface.
Configuring a measurement mode
1. Enter system view.
system-view
2. Enter iFIT view.
ifit enable
3. Create an iFIT instance and enter its view.
instance instance-name
4. Specify an iFIT measurement mode.
measure mode { e2e | trace }
By default, end-to-end measurement is used.
Configuring a measurement period
About this task
iFIT collects performance statistics based on the measurement period.
· The sender records the sending time of the first iFIT packet in each sending interval, and counts the number of the iFIT packets sent from an interface in each sending interval. Sending interval = iFIT measurement period.
· The receiver records the receiving time of the first iFIT packet in each receiving interval, and counts the number of the iFIT packets received by an interface in each receiving interval. To reduce the impact of network delay and disorder on statistics, the receiving interval equals to (1+1/3) measurement period.
If network delay between the ingress and egress nodes is greater than 1/3 measurement period, the accuracy of iFIT packet loss statistics might be affected. This is because iFIT considers packets received beyond the receiving interval as packet loss. For example, the measurement period is 1 second and the network delay greater than 1/3 seconds (333 milliseconds), the accuracy of iFIT packet loss statistics might be affected. In this case, set the measurement period to a greater value.
Procedure
1. Enter system view.
system-view
2. Enter iFIT view.
ifit enable
3. Create an iFIT instance and enter its view.
instance instance-name
4. Specify the measurement period for the iFIT instance.
period period
By default, the measurement period for an iFIT instance is 30 seconds.
Enabling iFIT measurement
About this task
You can configure packet loss measurement and packet delay measurement as required.
Procedure
1. Enter system view.
system-view
2. Enter iFIT view.
ifit enable
3. Create an iFIT instance and enter its view.
instance instance-name
4. Enable iFIT measurement for the iFIT instance.
measure enable
By default, iFIT measurement for an iFIT instance is disabled.
Configuring a transit node and the egress node
Tasks at a glance
Transit nodes are required only for hop-by-hop measurement. For end-to-end measurement, do not configure transit nodes.
To configure a transit node or the ingress node, perform the following tasks:
· (Optional.) Managing a dynamic flow
Enabling iFIT
1. Enter system view.
system-view
2. Enable the iFIT functionality globally and enter its view.
ifit enable
By default, the iFIT functionality is disabled.
3. Specify the standards used by iFIT.
technical-standard { telecom | unicom }
By default, iFIT uses the Telecom technical standards.
This command is not required for end-to-end measurement and will not impact the measurement results of end-to-end measurement.
To ensure correct measurement results of hop-by-hop measurement, you must execute this command and make sure the devices included in iFIT measurement are configured with the same technical standards.
4. (Optional.) Enable iFIT measurement on transit nodes in an SRv6 tunnel.
trace-measure per-hop [ be | te ]
By default, iFIT measurement is disabled on transit nodes in an SRv6 tunnel.
On an SRv6 TE policy network, the subsequent transit nodes might not have the SRH due to special settings such as PSP. In this case, for the subsequent transit nodes to forcedly parse iFIT headers for iFIT measurement, execute trace-measure per-hop be on these transit nodes instead of trace-measure per-hop te.
Managing a dynamic flow
1. Enter system view.
system-view
2. Enable the iFIT functionality globally and enter its view.
ifit enable
3. Specify the aging parameters for dynamic flows.
dynamic-flow aging-time multi-value [ threshold-percent threshold-percent ]
By default, the aging time for dynamic flows is 10 times the measurement period and it cannot be less than 5 minutes.
4. Delete iFIT dynamic flows.
delete dynamic-flow { all | device-id device-id flow-id flow-id }
Display and maintenance commands for iFIT for iFIT application-level quality measurement
Execute display commands in any view.
|
Task |
Command |
|
Display dynamic flow information. |
display ifit flow dynamic [ device-id device-id flow-id flow-id ] |
|
Display static flow information. |
display ifit flow static [ device-id device-id flow-id flow-id ] |
|
Display global information about iFIT target flows. |
display ifit global-information |
|
Display iFIT instance information. |
display ifit instance [ instance-name ] |
|
Display statistics about an iFIT dynamic flow for the most recent 10 measurement periods. |
display ifit statistic { device-id device-id flow-id flow-id } [ verbose ] |
|
Clear iFIT statistics of dynamic flows for the most recent 10 measurement periods. |
reset ifit statistic [ device-id device-id flow-id flow-id | instance instance-name] |
iFIT configuration examples
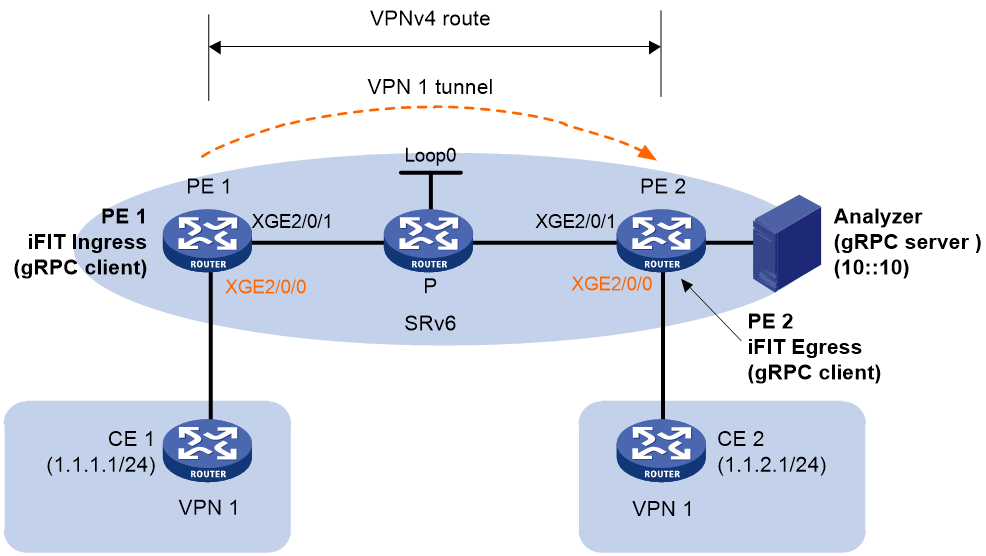
Example: Configuring iFIT on an IPv4 L3VPN over SRv6 network
Network configuration
As shown in Figure 4, the backbone network is an IPv6 network, and VPN 1 is an IPv4 network. Deploy MPLS L3VPN over SRv6 between PE 1 and PE 2 and use an SRv6 tunnel to transmit VPNv4 traffic between the PEs.
· Configure EBGP to exchange VPN routing information between the CEs and PEs.
· Configure IPv6 IS-IS on the PEs in the same AS to realize IPv6 network connectivity.
· Configure MP-IBGP to exchange VPNv4 routing information between the PEs.
· Configure iFIT to monitor the occurrence of packet loss and packet delay value when the flow passes through the VPN 1 tunnel.
Prerequisites
1. Configure IPv4 L3VPN over SRv6. (Details not shown.)
For information about configuring MPLS L3VPN over SRv6, see IP L3VPN over SRv6 configuration in Segment Routing Configuration Guide.
2. Configure PTP or NTP on PE 1 and PE 2 for clock synchronization. (Details not shown.)
Both PTP and NTP can be used to synchronize time between devices. time synchronization is accurate to sub-microseconds through PTP and to milliseconds through NTP.
¡ As a best practice, use PTP for time synchronization in an iFIT measurement network.
¡ If the devices do not support PTP but support high-precision NTP, enable high-precision NTP on the local and remote devices.
¡ If the devices do not support PTP or high-precision NTP, use standard NTP. When NTP is used, the device can measure packet loss rates, but the delay measurement is not accurate.
3. For more information about PTP and NTP, see "Configuring PTP” and "Configuring NTP", respectively.
Procedure
1. Configure gRPC:
# Enable the gRPC service.
<PE1> system-view
[PE1] grpc enable
# Create a sensor group named test, and add sensor path ifit/flowstatistics/flowstatistic.
[PE1] telemetry
[PE1-telemetry] sensor-group test
[PE1-telemetry-sensor-group-test] sensor path ifit/flowstatistics/flowstatistic depth 2
[PE1-telemetry-sensor-group-test] quit
# Create a destination group named collector1. Specify a collector that uses IPv6 address 10::10 and port number 50050.
[PE1-telemetry] destination-group collector1
[PE1-telemetry-destination-group-collector1] ipv6-address 10::10 port 50050
[PE1-telemetry-destination-group-collector1] quit
# Configure a subscription named A to bind sensor group test with destination group collector1. Set the sampling interval to 5 seconds.
[PE1-telemetry] subscription A
[PE1-telemetry-subscription-A] sensor-group test sample-interval 5
[PE1-telemetry-subscription-A] destination-group collector1
[PE1-telemetry-subscription-A] quit
[PE1-telemetry] quit
2. Configure iFIT:
# Enable the iFIT functionality.
[PE1] ifit enable
[PE1-ifit] device-id 1
# Configure instance a to monitor the performance parameters of the service flow transmitting in VPN instance vpn1 from source end 1.1.1.1/24 to destination end 1.1.2.1/24.
[PE1-ifit] encapsulation nexthop-ipv6 3::3
[PE1-ifit] instance a
[PE1-ifit-instance-a] flow unidirection source-ip 1.1.1.1 24 destination-ip 1.1.2.1 24 vpn-instance vpn1
# Bind interface Ten-GigabitEthernet 2/0/0 to instance a.
[PE1-ifit-instance-a] bind interface ten-gigabitethernet 2/0/0
# Specify 10 seconds as the measurement period.
[PE1-ifit-instance-a] period 10
# Enable iFIT measurement.
[PE1-ifit-instance-a] measure enable
[PE1-ifit-instance-a] quit
[PE1-ifit] quit
3. Configure PE 2:
# Configure gRPC.
Use the same procedure to configure gRPC on PE 2 as you configure gRPC on PE 1.
# Enable the iFIT functionality.
<PE2> system-view
[PE2] ifit enable
Verifying the configuration
1. View iFIT statistics on PE 1.
[PE1-ifit-instance-a] display ifit statistic device-id 1 flow-id 2
Period ID Direction PktCount Timestamp(sec, nsec) Interface
163059918 Ingress 4124 1630599180, 1889782 XGE2/0/0
163059919 Ingress 4124 1630599190, 1901494 XGE2/0/0
163059920 Ingress 4124 1630599200, 1912118 XGE2/0/0
2. View iFIT statistics on PE 2.
[PE2] display ifit statistic device-id 1 flow-id 2
Period ID Direction PktCount Timestamp(sec, nsec) Interface
163059918 Egress 4124 1630599180, 1948185 XGE2/0/0
163059919 Egress 4124 1630599190, 1959405 XGE2/0/0
163059920 Egress 4120 1630599200, 1968503 XGE2/0/0
3. Packet loss occurs in period 163059920 by viewing iFIT statistics on the analyzer.
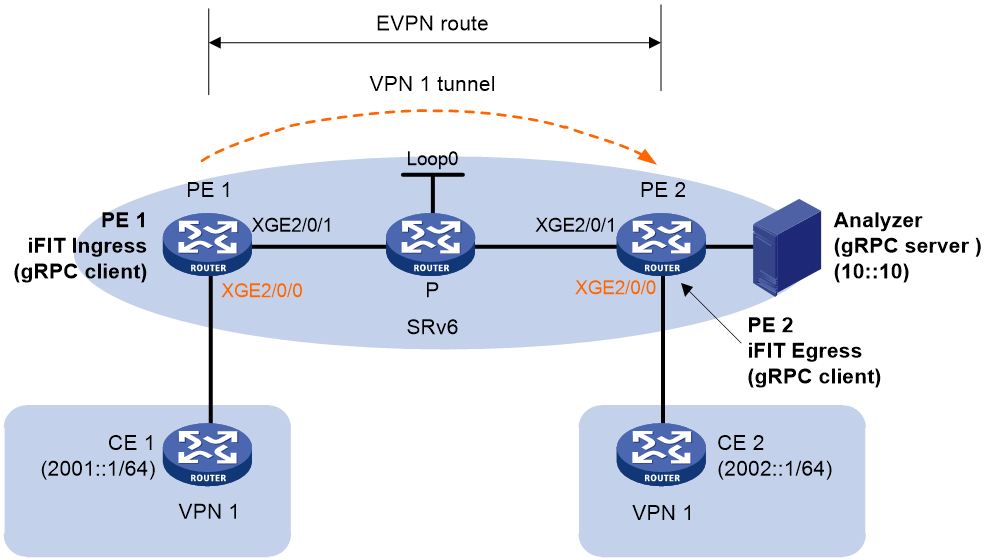
Example: Configuring iFIT on an IPv6 EVPN L3VPN over SRv6 network
Network configuration
As shown in Figure 5, the backbone network is an IPv6 network. Deploy EVPN L3VPN over SRv6 in SRv6-BE mode between PE 1 and PE 2 and use an SRv6 tunnel to transmit EVPN traffic between the PEs.
· Configure EBGP to exchange VPN routing information between the CEs and PEs.
· Configure IPv6 IS-IS on the PEs in the same AS to realize IPv6 network connectivity.
· Configure MP-IBGP to exchange EVPN routing information between the PEs.
· Configure iFIT to monitor the occurrence of packet loss and packet delay value when the flow passes through the VPN 1 tunnel.
Prerequisites
1. Configure IPv6 EVPN L3VPN over SRv6. (Details not shown.)
For information about configuring IPv6 EVPN L3VPN over SRv6, see EVPN L3VPN over SRv6 configuration in Segment Routing Configuration Guide.
2. Configure PTP or NTP on PE 1 and PE 2 for clock synchronization. (Details not shown.)
Both PTP and NTP can be used to synchronize time between devices. time synchronization is accurate to sub-microseconds through PTP and to milliseconds through NTP.
¡ As a best practice, use PTP for time synchronization in an iFIT measurement network.
¡ If the devices do not support PTP but support high-precision NTP, enable high-precision NTP on the local and remote devices.
¡ If the devices do not support PTP or high-precision NTP, use standard NTP. When NTP is used, the device can measure packet loss rates, but the delay measurement is not accurate.
3. For more information about PTP and NTP, see "Configuring PTP” and "Configuring NTP", respectively.
Procedure
1. Configure gRPC:
# Enable the gRPC service.
<PE1> system-view
[PE1] grpc enable
# Create a sensor group named test, and add sensor path ifit/flowstatistics/flowstatistic.
[PE1] telemetry
[PE1-telemetry] sensor-group test
[PE1-telemetry-sensor-group-test] sensor path ifit/flowstatistics/flowstatistic depth 2
[PE1-telemetry-sensor-group-test] quit
# Create a destination group named collector1. Specify a collector that uses IPv6 address 10::10 and port number 50050.
[PE1-telemetry] destination-group collector1
[PE1-telemetry-destination-group-collector1] ipv6-address 10::10 port 50050
[PE1-telemetry-destination-group-collector1] quit
# Configure a subscription named A to bind sensor group test with destination group collector1. Set the sampling interval to 5 seconds.
[PE1-telemetry] subscription A
[PE1-telemetry-subscription-A] sensor-group test sample-interval 5
[PE1-telemetry-subscription-A] destination-group collector1
[PE1-telemetry-subscription-A] quit
[PE1-telemetry] quit
2. Configure iFIT:
# Enable the iFIT functionality.
[PE1] ifit enable
[PE1-ifit] device-id 1
# Configure instance a to monitor the performance parameters of the service flow transmitting in VPN instance vpn1 from source end 2001::1 to destination end 2002::1.
[PE1-ifit] encapsulation nexthop-ipv6 3::3
[PE1-ifit] instance a
[PE1-ifit-instance-a] flow unidirection source-ipv6 2001::1 destination-ipv6 2002::1 vpn-instance vpn1
# Bind interface Ten-GigabitEthernet2/0/0 to instance a.
[PE1-ifit-instance-a] bind interface ten-gigabitethernet 2/0/0
# Specify 10 seconds as the measurement period.
[PE1-ifit-instance-a] period 10
# Enable iFIT measurement.
[PE1-ifit-instance-a] measure enable
[PE1-ifit-instance-a] quit
[PE1-ifit] quit
3. Configure PE 2:
# Configure gRPC.
Use the same procedure to configure gRPC on PE 2 as you configure gRPC on PE 1.
# Enable the iFIT functionality.
<PE2> system-view
[PE2] ifit enable
Verifying the configuration
1. View iFIT statistics on PE 1.
[PE1-ifit-instance-a] display ifit statistic device-id 1 flow-id 2
Period ID Direction PktCount Timestamp(sec, nsec) Interface
163059918 Ingress 4124 1630599180, 1889782 XGE2/0/0
163059919 Ingress 4124 1630599190, 1901494 XGE2/0/0
163059920 Ingress 4124 1630599200, 1912118 XGE2/0/0
2. View iFIT statistics on PE 2.
[PE2] display ifit statistic device-id 1 flow-id 2
Period ID Direction PktCount Timestamp(sec, nsec) Interface
163059918 Egress 4124 1630599180, 1948185 XGE2/0/0
163059919 Egress 4124 1630599190, 1959405 XGE2/0/0
163059920 Egress 4120 1630599200, 1968503 XGE2/0/0
3. Packet loss occurs in period 163059920 by viewing iFIT statistics on the analyzer.
