- Table of Contents
- Related Documents
-
| Title | Size | Download |
|---|---|---|
| 03-ND Troubleshooting Guide | 121.92 KB |
Troubleshooting Layer 3—IP services
ND issues
ND learning failure
Symptom
The device cannot learn ND entries, causing traffic forwarding failure.
Common causes
The following are the common causes of this type of issue:
· The memory is insufficient.
· The physical layer state of the interface is not up.
· The IPv6 addresses of the local interface and the peer interface do not reside on the same network segment.
· ND packets fail to be sent to the CPU.
· A card is faulty.
· ND packets are dropped due to a busy CPU.
Troubleshooting flow
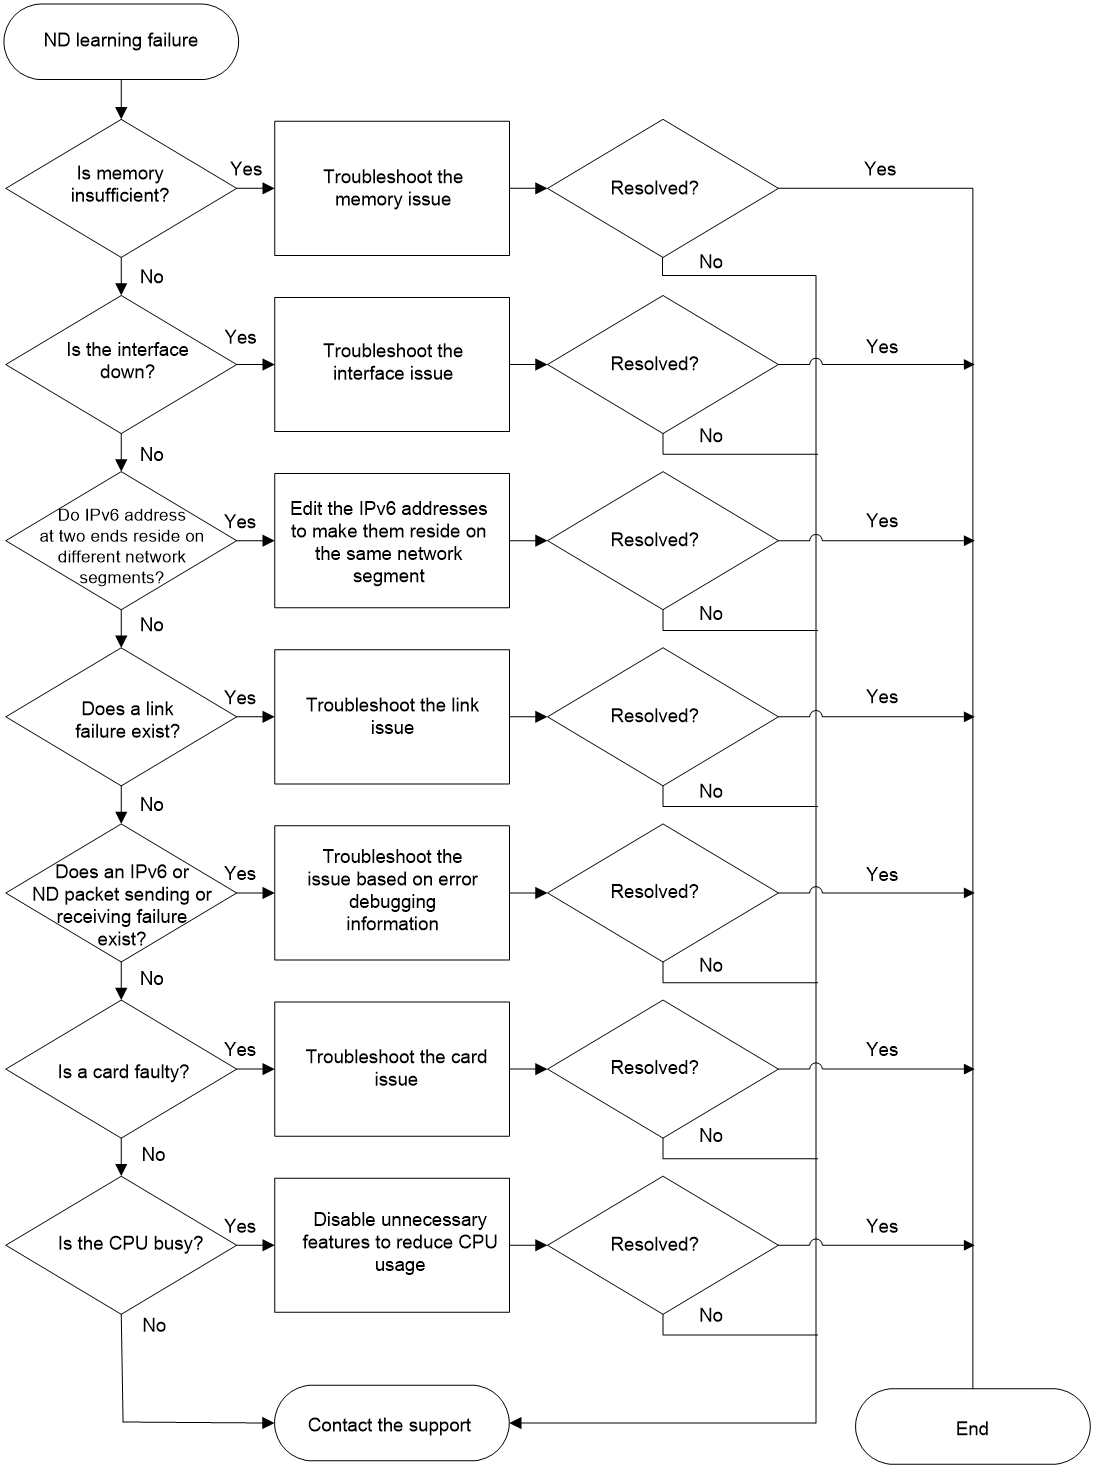
Figure 1 shows the troubleshooting flowchart.
Figure 1 Flowchart for troubleshooting ND learning failure
Solution
1. Use the display memory-threshold command to identify whether the memory is insufficient.
<Sysname> display memory-threshold
Memory usage threshold: 100%
Free-memory thresholds:
Minor: 96M
Severe: 64M
Critical: 48M
Normal: 128M
Early-warning: 256M
Secure: 304M
Current free-memory state: Normal (secure)
¡ If the Current free-memory state field displays Normal or Normal (secure), go to step 2.
¡ If the Current free-memory state field displays Minor, Severe, Critical, or Normal (early-warning), check the device memory usage and troubleshoot the insufficient memory issue.
2. Check the network configuration and interface state.
a. Use the display interface command to identify whether the interface is up. If the interface is not up, troubleshoot the issue.
b. Use the display ipv6 fib ipv6-address command to view IPv6 FIB entry information. ipv6-address specifies the IPv6 address in an ND entry. If the corresponding IPv6 FIB entry does not exist, the routing module might be faulty. For more information about troubleshooting routing module issues, see "Troubleshooting Layer 3—IP Routing." If the corresponding IPv6 FIB entry exists but the next hop address is not the address of the direct next hop, check the connection between the device and its next hop.
c. Use the display ipv6 interface command to view the IPv6 address of the interface.
- Identify whether the IPv6 address of the local interface resides on the same network segment as the peer interface. If the IPv6 addresses reside on different network segments, execute the ipv6 address command in interface view to edit the IPv6 addresses.
- Identify whether the local interface IPv6 address conflicts with the peer interface IPv6 address. If a conflict has occurred, execute the ipv6 address command in interface view to edit the IPv6 addresses.
- Identify whether the peer interface is the one where the next hop resides.
d. Use the ping ipv6 command to identify whether a link failure exists.
3. Identify whether IPv6 packets are sent and received correctly.
a. Use the debugging ipv6 packet command to enable IPv6 packet debugging. Then, execute the ping ipv6 command to identify whether the device sends and receives IPv6 packets correctly.
<Sysname> debugging ipv6 packet
<Sysname> ping ipv6 -c 1 1::2
Ping6(56 data bytes) 1::1 --> 1::2, press CTRL+C to break
*Apr 26 11:37:33:402 2022 Sysname IP6FW/7/IP6FW_PACKET: -MDC=1;
LocalSending, version = 6, traffic class = 0,
flow label = 0, payload length = 64, protocol = 58, hop limit = 64,
Src = 1::1, Dst = 1::2,
prompt: Output an IPv6 Packet.
*Apr 26 11:37:33:402 2022 Sysname IP6FW/7/IP6FW_PACKET: -MDC=1;
Sending, interface = Ten-GigabitEthernet0/0/6, version = 6, traffic class = 0,
flow label = 0, payload length = 64, protocol = 58, hop limit = 64,
Src = 1::1, Dst = 1::2,
prompt: Sending the packet from local interface Ten-GigabitEthernet0/0/6.
The command output indicates that the device has successfully sent an IPv6 packet on interface Ten-GigabitEthernet 0/0/6.
*Apr 26 11:37:33:402 2022 Sysname IP6FW/7/IP6FW_PACKET: -MDC=1;
LocalSending, version = 6, traffic class = 224,
flow label = 0, payload length = 32, protocol = 58, hop limit = 255,
Src = 1::1, Dst = ff02::1:ff00:2,
prompt: Output an IPv6 Packet.
*Apr 26 11:37:33:402 2022 Sysname IP6FW/7/IP6FW_PACKET: -MDC=1;
Sending, interface = Ten-GigabitEthernet0/0/6, version = 6, traffic class = 224,
flow label = 0, payload length = 32, protocol = 58, hop limit = 255,
Src = 1::1, Dst = ff02::1:ff00:2,
prompt: Sending the packet from local interface Ten-GigabitEthernet0/0/6.
56 bytes from 1::2, icmp_seq=0 hlim=64 time=19.336 ms
--- Ping6 statistics for 1::2 ---
1 packet(s) transmitted, 1 packet(s) received, 0.0% packet loss
round-trip min/avg/max/std-dev = 19.336/19.336/19.336/0.000 ms
<Sysname>*Apr 26 11:37:33:421 2022 Sysname IP6FW/7/IP6FW_PACKET: -MDC=1;
Receiving, interface = Ten-GigabitEthernet0/0/6, version = 6, traffic class = 0,
flow label = 0, payload length = 64, protocol = 58, hop limit = 64,
Src = 1::2, Dst = 1::1,
prompt: Received an IPv6 packet.
The command output indicates that the device has received an IPv6 packet.
*Apr 26 11:37:33:421 2022 Sysname IP6FW/7/IP6FW_PACKET: -MDC=1;
Delivering, interface = Ten-GigabitEthernet0/0/6, version = 6, traffic class = 0,
flow label = 0, payload length = 64, protocol = 58, hop limit = 64,
Src = 1::2, Dst = 1::1,
prompt: Delivering the IPv6 packet to the upper layer.
The command output indicates that the device sent the received IPv6 packet to the CPU.
%Apr 26 11:37:33:422 2022 Sysname PING/6/PING_STATISTICS: -MDC=1; Ping6 statistics for 1::2: 1 packet(s) transmitted, 1 packet(s) received, 0.0% packet loss, round-trip min/avg/max/std-dev = 19.336/19.336/19.336/0.000 ms.
- If the device has sent and received IPv6 packets successfully, go to step 4.
- If the device failed to send or receive an IPv6 packet, go to step b.
b. Use the debugging ipv6 error command to enable IPv6 packet error debugging. Identify the IPv6 packet sending or receiving failure cause according to Table 1.
|
Field |
Description |
|
Number of IPv6 fragments exceeded the threshold. |
Number of IPv6 fragments exceeded the threshold. |
|
Number of IPv6 reassembly queues exceeded the threshold. |
Number of IPv6 reassembly queues exceeded the threshold. |
|
Invalid IPv6 packet. |
The IPv6 packet was invalid. |
|
Failed to process the hop-by-hop extension header. |
The system failed to process the hop-by-hop extension header. |
|
Failed to process the hop-by-hop option. |
The system failed to process the hop-by-hop option in the packet. |
|
The packet was discarded by services. |
The packet was discarded by the service. |
|
The packet was administratively discarded. |
The IPv6 packet was administratively discarded. |
4. Identify whether a card is faulty. The following uses the card in slot 1 as an example. Use the display system internal nd statistics command to view ND statistics of the card.
<Sysname> system-view
[Sysname] probe
[Sysname-probe] display system internal nd statistics slot 1
Entry statistics:
Valid : 1 Dummy : 0
Packet : 1 OpenFlow : 0
Long static : 0 Short static : 0
Temp node : 0 Rule : 0
Static statistics:
Short : 0 Long interface : 0
Long port : 0
Process statistics:
Input : 7 Resolving : 11
Error statistics:
Memory : 0 Sync : 0
Packet : 0 Parameter : 0
Anchor : 0 Get address : 0
Refresh FIB : 0 Delete FIB : 0
Realtime Sync : 0 Temp node : 0
Exceed limit : 0 Refresh rule : 0
Delete rule : 0 Smooth rule start : 0
Smooth rule end : 0 RA : 0
Origin : 0 Final RA : 0
a. If the value for the input field is not 0, go to step 5. If the value for the input field is 0, troubleshoot the card issue.
b. Collect the content of the Error statistics field and send it to H3C technical support staff.
5. Identify whether ND packets are dropped due to a busy CPU. Use the view command to view information about ND in the /proc/kque system directory and identify the situation and reason of ND packet dropping.
[Sysname-probe] view /proc/kque | in ND
0: dd0e0a00 ARP_SEND 1024/0/0/0 (0x4b515545)
0: dd0e6d00 ND_TIMER 1024/0/5/0 (0x4b515545)
0: dd0e6e00 ND_SINGLEEVENT 1/0/0/0 (0x4b515545)
0: dd0e6f00 ND_MACNOTIFYEVENT 1/0/0/0 (0x4b515545)
0: dcec4000 ND_RULE 4096/0/0/0 (0x4b515545)
0: dcec4200 ND_MICROSEGMENT 2048/0/0/0 (0x4b515545)
0: dcec4300 ND_MACNOTIFY 2048/0/0/0 (0x4b515545)
0: dcec4400 ND_MAC_EVENT 1/0/0/0 (0x4b515545)
0: d2da7800 OVERLAY_VNDEL 1/0/0/0 (0x4b515545)
0: ca5f3800 FIB6NDHRQ 1/0/0/0 (0x4b515545)
0: ca3f7600 ND_VSISUP_PKT 4096/0/0/0 (0x4b515545)
0: ca3f7400 NDSNP_PKT 4096/0/0/0 (0x4b515545)
0: ca3f7700 NDRAPG_PKT 4096/0/0/0 (0x4b515545)
0: ca3f7800 ND_EVENT 8192/0/1/0 (0x4b515545)
0: ca3f7900 ND_PKT 4096/0/1/0 (0x4b515545)
View the value for the ND_PKT field in the command output, which is displayed in the W/X/Y/Z format.
¡ W represents the queue capacity, which is a fixed value.
¡ X represents the current queue size.
¡ Y represents the history maximum length of the queue.
¡ Z represents the number of dropped ND packets in the queue.
If Z is not 0 and Y equals W, ND packets are dropped due to a busy CPU. If Z is 0, go to step 6.
6. Collect detailed information about the ND process. Execute the display mdc command to obtain the MDC number. Use the display process command to view the number of the ND process corresponding to the MDC number. Based on the process number, use the view command to obtain detailed information about the ND process and send it to H3C technical support staff.
[Sysname-probe] display process name knd/1
Job ID: 55763
PID: 55763
Parent JID: 2
Parent PID: 2
Executable path: -
Instance: 0
Respawn: OFF
Respawn count: 1
Max. spawns per minute: 0
Last started: Tue Apr 26 11:32:31 2022
Process state: sleeping
Max. core: 0
ARGS: -
TID LAST_CPU Stack PRI State HH:MM:SS:MSEC Name
55763 0 0K 115 S 0:0:13:490 [kND/1]
1 in the knd/1 argument represents the MDC number. PID in the command output represents the number of the ND process. Execute the view command to display detailed information about the ND process numbered 55763.
[Sysname-probe] view /proc/55763/stack
[<c04c9cd4>] kepoll_wait+0x274/0x3c0
[<e2021612>] nd_Thread+0x62/0x100 [system]
[<c043f1b4>] kthread+0xd4/0xe0
[<c0401daf>] kernel_thread_helper+0x7/0x10
[<ffffffff>] 0xffffffff
7. Collect the following information and contact H3C Technical Support:
¡ Results of each step.
¡ The configuration file, log messages, and alarm messages.
Related alarm and log messages
Alarm messages
N/A
Log messages
N/A
NS packet response failure
Symptom
The device does not reply to the NS packet sent from the peer device.
Common Causes
The following are the common causes of this type of issue:
· The destination IPv6 address in the NS packet received by the interface is not the IPv6 address of the local device.
· The peer device triggers source MAC-based ND attack detection on the local device.
· The peer device triggers ND attack detection on the local device.
Troubleshooting flow
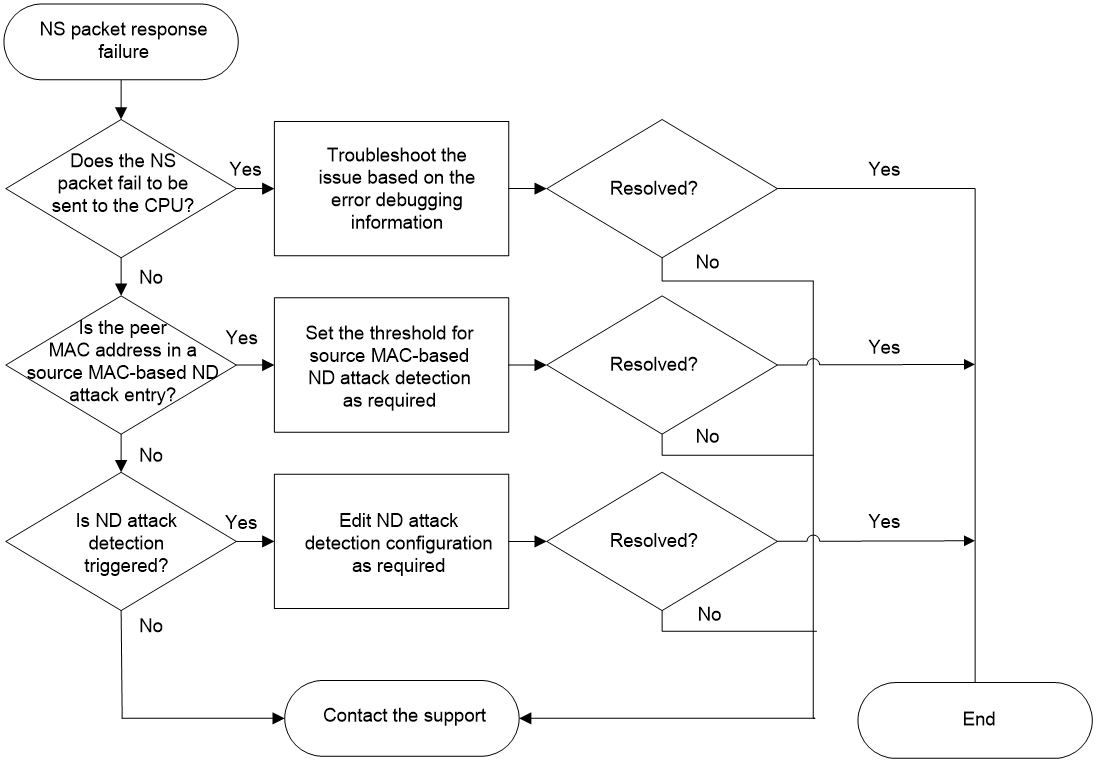
Figure 2 shows the troubleshooting flowchart.
Figure 2 Flowchart for troubleshooting NS packet response failure
Solution
1. View information about the ND packet sent from the peer device to identify whether it is sent to the CPU.
a. Use the debugging ipv6 packet command to enable IPv6 packet debugging. Then, configure the peer device to send an NS packet to the local device.
<Sysname> debugging ipv6 packet
*Apr 26 13:33:34:897 2022 Sysname IP6FW/7/IP6FW_PACKET: -MDC=1;
Receiving, interface = Ten-GigabitEthernet0/0/6, version = 6, traffic class = 0,
flow label = 0, payload length = 64, protocol = 58, hop limit = 64,
Src = 1::2, Dst = 1::1,
prompt: Received an IPv6 packet.
- If the destination IPv6 address is not the local device IPv6 address, check the routing table and FIB of the peer device.
- If the destination IPv6 address is the local device IP address, go to step b.
b. Use the debugging ipv6 error command to enable IPv6 packet error debugging. Identify the NS packet response failure cause according to Table 2.
Table 2 Output from the debugging ipv6 error command
|
Field |
Description |
|
Number of IPv6 fragments exceeded the threshold. |
Number of IPv6 fragments exceeded the threshold. |
|
Number of IPv6 reassembly queues exceeded the threshold. |
Number of IPv6 reassembly queues exceeded the threshold. |
|
Invalid IPv6 packet. |
The IPv6 packet was invalid. |
|
Failed to process the hop-by-hop extension header. |
The system failed to process the hop-by-hop extension header. |
|
Failed to process the hop-by-hop option. |
The system failed to process the hop-by-hop option in the packet. |
|
The packet was discarded by services. |
The packet was discarded by the service. |
|
The packet was administratively discarded. |
The IPv6 packet was administratively discarded. |
2. The following uses local interface Ten-GigabitEthernet 0/0/6 as an example. Execute the display ipv6 nd source-mac command to display source MAC-based ND attack detection entries. Identify whether the peer device MAC address is in a source MAC-based ND attack entry.
<Sysname> display ipv6 nd source-mac interface ten-gigabitethernet 0/0/6
Source MAC VLAN ID Interface Aging time (sec) Packets dropped
23f3-1122-3344 4094 XGE0/0/6 10 84467
¡ If a source MAC-based ND attack entry exists and the MAC address is the MAC address of the peer device, set the threshold for source MAC-based ND attack detection as required. To set the threshold for source MAC-based ND attack detection, use the ipv6 nd source-mac threshold command.
¡ If the peer device MAC address is not in any source MAC-based ND attack entry, go to step 3.
3. Use the display ipv6 nd detection statistics command to display statistics for ND packets dropped by ND attack detection. Identify whether the peer device triggers NA attack detection.
<Sysname> display ipv6 nd detection statistics
ND packets dropped by ND detection:
Interface Packets dropped
XGE0/0/6 78
¡ If the number of ND packets dropped by ND attack detection on the interface connected to the peer device is not 0, check configuration related to ND attack detection.
¡ If the number of ND packets dropped by ND attack detection on the interface connected to the peer device is 0, go to step 4.
4. Use the display system internal nd statistics command to display ND statistics on each card. Collect the content of the Error statistics field and send it to H3C technical support staff.
The following uses the card in slot 1 as an example. Use the display system internal nd statistics command to display ND statistics on each card. Identify whether a card is faulty.
[Sysname-probe] display system internal nd statistics slot 1
Entry statistics:
Valid : 1 Dummy : 0
Packet : 1 OpenFlow : 0
Long static : 0 Short static : 0
Temp node : 0 Rule : 0
Static statistics:
Short : 0 Long interface : 0
Long port : 0
Process statistics:
Input : 7 Resolving : 11
Error statistics:
Memory : 0 Sync : 0
Packet : 0 Parameter : 0
Anchor : 0 Get address : 0
Refresh FIB : 0 Delete FIB : 0
Realtime Sync : 0 Temp node : 0
Exceed limit : 0 Refresh rule : 0
Delete rule : 0 Smooth rule start : 0
Smooth rule end : 0 RA : 0
Origin : 0 Final RA : 0
¡ Check the Input field to identify whether the card receives ND packets correctly.
¡ Collect the content of the Error statistics field and send it to H3C technical support staff.
5. Collect the following information and contact H3C Technical Support:
¡ Results of each step.
¡ The configuration file, log messages, and alarm messages.
Related alarm and log messages
Alarm messages
N/A
Log messages
N/A
Traffic forwarding failure based on the existing ND entry
Symptom
The device has learned an ND entry but cannot forward traffic correctly.
Common causes
The following are the common causes of this type of issue:
· An abnormal parameter exists in the learned ND entry.
· The learned ND entry failed to be deployed to the driver.
Troubleshooting flow
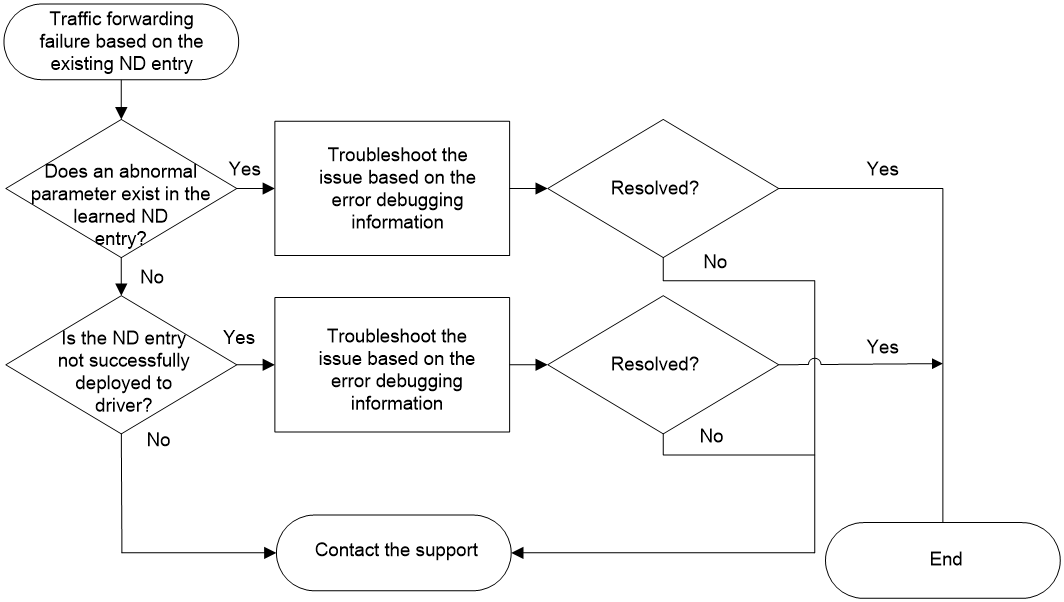
Figure 3 shows the troubleshooting flowchart.
Figure 3 Flowchart for troubleshooting traffic forwarding failure based on the existing ND entry
Solution
1. Use the display system internal adj6 entry command to identify whether an abnormal parameter exists in the learned ND entry. The following uses interface Ten-GigabitEthernet 0/0/6 and peer IPv6 address 1::2 as an example.
[Sysname-probe]display system internal adj6 entry 1::2 interface ten-gigabitethernet 0/0/6
ADJ6 entry:
Entry attribute : 0x0
Service type : Ethernet
Link media type : Broadcast
Action type : Forwarding
Entry flag : 0x4
Forward type : 0x0
Slot : 0
MTU : 1500
Driver flag : 2
Sequence No : 17
Physical interface : XGE0/0/6
Logical interface : N/A
Virtual circuit information : 65535
ADJ index : 0xdc780c38
Peer address : ::
Reference count : 0
Reference Sequence : 3
MicroSegmentID : 0
Nexthop driver[0] : 0xffffffff
Nexthop driver[1] : 0xffffffff
Driver context[0] : 0xffffffff
Driver context[1] : 0xffffffff
Driver context[2] : 0xffffffff
Driver context[3] : 0xffffffff
Driver context[4] : 0xffffffff
Driver context[5] : 0xffffffff
Link head information(IPv6) : 68cb9c3f020668cb978f010686dd
Link head information(MPLS) : 68cb9c3f020668cb978f01068847
¡ If the Action type field displays Forwarding, the device forwards traffic from 1::2 correctly and the device is not faulty.
¡ If the Action type field displays Drop, the device fails to forward traffic from 1::2. An abnormal parameter exists in the learned ND entry.
- If the Driver flag field displays 4, driver resources are insufficient. Check the driver usage.
- If the Driver flag field does not display 4, go to step 2.
2. Use the debugging system internal adj6 command and specify the hardware keyword to enable IPv6 adjacency entry debugging. Use the ping ipv6 command to trigger ND learning. Identify whether the ND entry is successfully deployed to the driver.
[Sysname-probe] debugging system internal adj6 hardware
[Sysname-probe] ping ipv6 -c 1 1::2
Ping6(56 data bytes) 1::1 --> 1::2, press CTRL+C to break
56 bytes from 1::2, icmp_seq=0 hlim=64 time=2.868 ms
--- Ping6 statistics for 1::2 ---
1 packet(s) transmitted, 1 packet(s) received, 0.0% packet loss
round-trip min/avg/max/std-dev = 2.868/2.868/2.868/0.000 ms
<Sysname>*Apr 26 16:06:42:412 2022 Sysname IP6PMTU/7/IP6PMTU_DBG: -MDC=1; Binding socket to PMTU succeeded
*Apr 26 16:06:42:412 2022 Sysname IP6FW/7/IP6FW_PACKET: -MDC=1;
LocalSending, version = 6, traffic class = 0,
flow label = 0, payload length = 64, protocol = 58, hop limit = 64,
Src = 1::1, Dst = 1::2,
prompt: Output an IPv6 Packet.
*Apr 26 16:06:42:412 2022 Sysname IP6FW/7/IP6FW_PACKET: -MDC=1;
Sending, interface = Ten-GigabitEthernet0/0/6, version = 6, traffic class = 0,
flow label = 0, payload length = 64, protocol = 58, hop limit = 64,
Src = 1::1, Dst = 1::2,
prompt: Sending the packet from local interface Ten-GigabitEthernet0/0/6.
*Apr 26 16:06:42:413 2022 Sysname IP6FW/7/IP6FW_PACKET: -MDC=1;
LocalSending, version = 6, traffic class = 224,
flow label = 0, payload length = 32, protocol = 58, hop limit = 255,
Src = 1::1, Dst = ff02::1:ff00:2,
prompt: Output an IPv6 Packet.
*Apr 26 16:06:42:413 2022 Sysname IP6FW/7/IP6FW_PACKET: -MDC=1;
Sending, interface = Ten-GigabitEthernet0/0/6, version = 6, traffic class = 224,
flow label = 0, payload length = 32, protocol = 58, hop limit = 255,
Src = 1::1, Dst = ff02::1:ff00:2,
prompt: Sending the packet from local interface Ten-GigabitEthernet0/0/6.
*Apr 26 16:06:42:414 2022 Sysname IP6FW/7/IP6FW_PACKET: -MDC=1;
Receiving, interface = Ten-GigabitEthernet0/0/6, version = 6, traffic class = 224,
flow label = 0, payload length = 32, protocol = 58, hop limit = 255,
Src = 1::2, Dst = 1::1,
prompt: Received an IPv6 packet.
*Apr 26 16:06:42:414 2022 Sysname ADJ6/7/ADJ6_HARDWARE: -MDC=1;
====Start ADJLINK Add====
*Apr 26 16:06:42:414 2022 Sysname ADJ6/7/ADJ6_HARDWARE: -MDC=1;
--------------New Entry-------------
Service type : Ethernet
Link media type : Broadcast
Action type : Forwarding
IPv6 address : 1::2
Route interface : XGE0/0/6
Port interface : N/A
Slot : 0
MTU : 1500
VLAN id : 65535
Second VLAN id : 65535
Physical interface : XGE0/0/6
Logical interface : N/A
Vrf index : 0
VSI index : -1
VSI link ID : 65535
Usr ID : -1
MAC address : 68cb-9c3f-0206
Link head length(IPv6) : 14
Link head length(MPLS) : 14
Link head information(IPv6) : 68cb9c3f020668cb978f010686dd
Link head information(MPLS) : 68cb9c3f020668cb978f01068847
Nexthop driver
[0]: 0xffffffff [1]: 0xffffffff
Driver context
[0]: 0xff
*Apr 26 16:06:42:414 2022 Sysname ADJ6/7/ADJ6_HARDWARE: -MDC=1;
====End ADJLINK Operate====
Result : 0x0, Reference flag : 0x0, Syn flag : 0x0
*Apr 26 16:06:42:415 2022 Sysname IP6FW/7/IP6FW_PACKET: -MDC=1;
Receiving, interface = Ten-GigabitEthernet0/0/6, version = 6, traffic class = 0,
flow label = 0, payload length = 64, protocol = 58, hop limit = 64,
Src = 1::2, Dst = 1::1,
prompt: Received an IPv6 packet.
*Apr 26 16:06:42:415 2022 Sysname IP6FW/7/IP6FW_PACKET: -MDC=1;
Delivering, interface = Ten-GigabitEthernet0/0/6, version = 6, traffic class = 0,
flow label = 0, payload length = 64, protocol = 58, hop limit = 64,
Src = 1::2, Dst = 1::1,
prompt: Delivering the IPv6 packet to the upper layer.
%Apr 26 16:06:42:416 2022 Sysname PING/6/PING_STATISTICS: -MDC=1; Ping6 statistics for 1::2: 1 packet(s) transmitted, 1 packet(s) received, 0.0% packet loss, round-trip min/avg/max/std-dev = 2.868/2.868/2.868/0.000 ms.
*Apr 26 16:06:42:417 2022 Sysname IP6PMTU/7/IP6PMTU_DBG: -MDC=1; Unbinding PMTU from socket succeeded
¡ If the Result field displays 0x0, the ND entry has been successfully deployed to the driver. Go to step 3.
¡ If the Result field does not display 0x0, the ND entry failed to be deployed to the driver. Check the hardware resource usage.
3. Execute the following commands, collect the command outputs, and send them to H3C technical support staff.
¡ debugging system internal adj6 (with the notify keyword specified)
¡ debugging system internal ipv6 fib prefix
4. Collect the following information and contact H3C Technical Support:
¡ Results of each step.
¡ The configuration file, log messages, and alarm messages.