- Table of Contents
- Related Documents
-
| Title | Size | Download |
|---|---|---|
| 01-ARP Troubleshooting Guide | 139.45 KB |
Troubleshooting Layer 3—IP services
ARP issues
ARP learning failure
Symptom
The device cannot learn ARP entries, causing traffic forwarding failure.
Common causes
The following are the common causes of this type of issue:
· The memory is insufficient.
· The physical layer state of the interface is not up.
· The IP addresses of the local interface and the peer interface do not reside on the same network segment.
· ARP packets fail to be sent to the CPU.
· A card is faulty.
· ARP packets are dropped due to a busy CPU.
Troubleshooting flow
Figure 1 shows the troubleshooting flowchart.
Figure 1 Flowchart for troubleshooting ARP learning failure
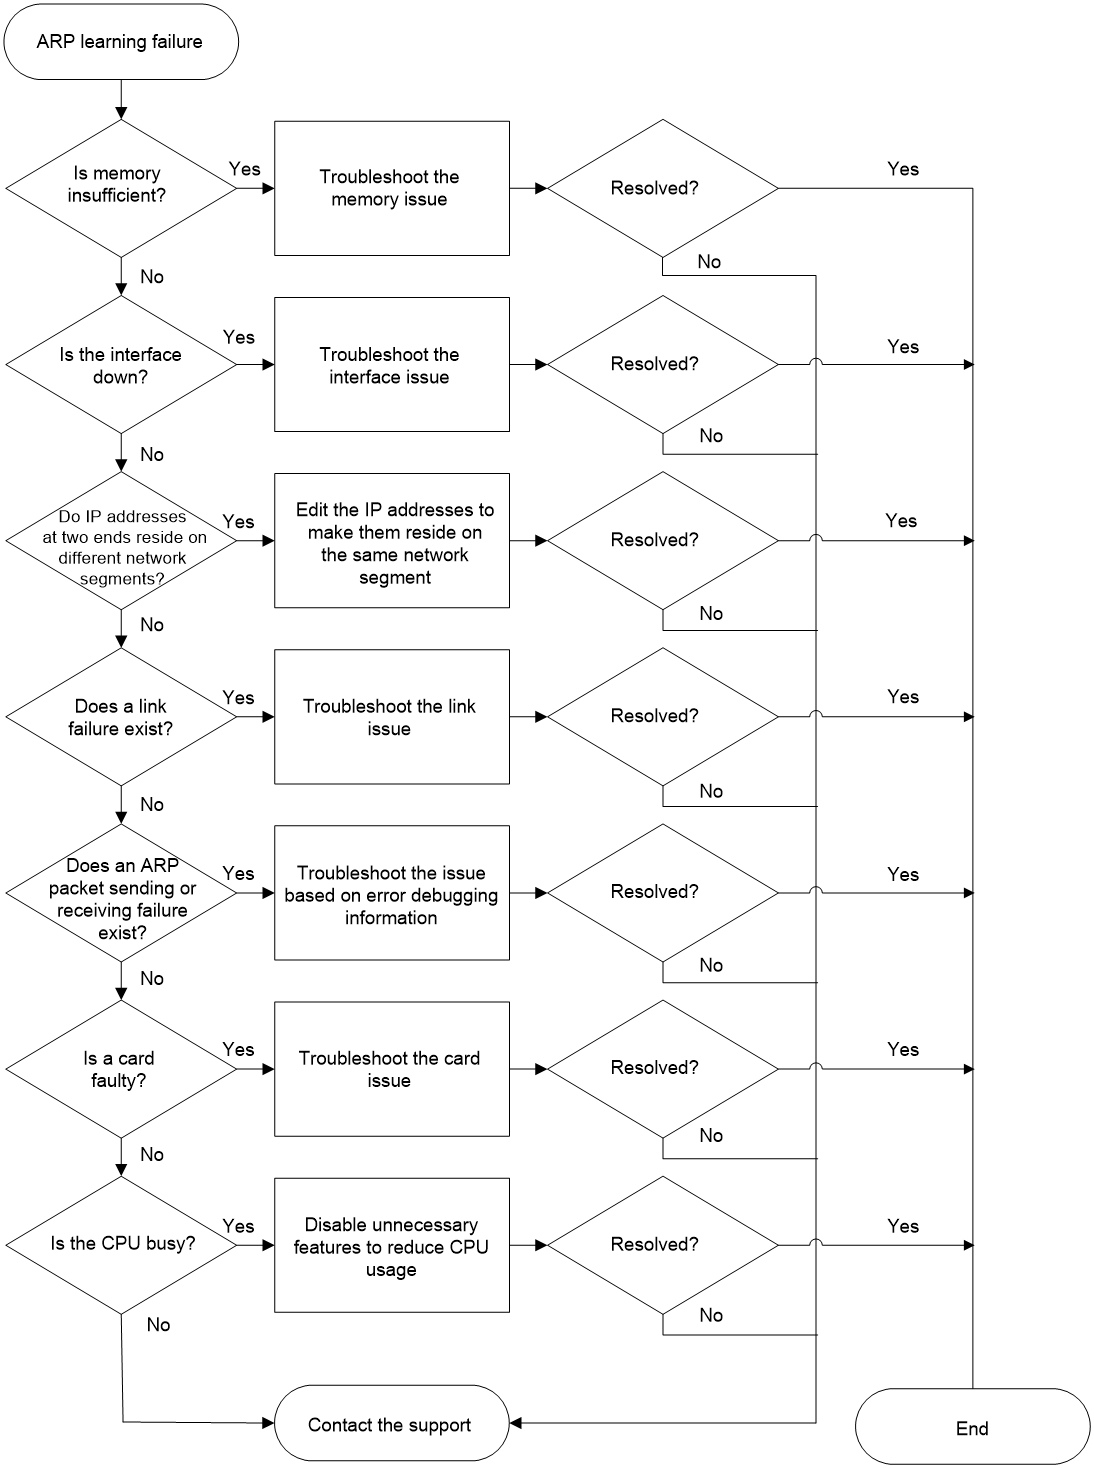
Solution
1. Use the display memory-threshold command to identify whether the memory is insufficient.
<Sysname> display memory-threshold
Memory usage threshold: 100%
Free-memory thresholds:
Minor: 96M
Severe: 64M
Critical: 48M
Normal: 128M
Early-warning: 256M
Secure: 304M
Current free-memory state: Normal (secure)
¡ If the Current free-memory state field displays Normal or Normal (secure), go to step 2.
¡ If the Current free-memory state field displays Minor, Severe, Critical, or Normal (early-warning), check the device memory usage and troubleshoot the insufficient memory issue.
2. Check the network configuration and interface state.
a. Use the display interface command to identify whether the interface is up. If the interface is not up, troubleshoot the issue.
b. Use the display fib ip-address command to view FIB entries. ip-address represents the IP address in an ARP entry. If the corresponding FIB entry does not exist, the routing module might be faulty. For more information about troubleshooting routing module issues, see "Troubleshooting Layer 3—IP Routing." If the corresponding FIB entry exists but the next hop address is not the address of the direct next hop, check the connection between the device and its next hop.
c. Use the display ip interface command to view the IP address of the interface.
- Identify whether the IP address of the local interface resides on the same network segment as the peer interface. If the IP addresses reside on different network segments, execute the ip address command in interface view to edit the IP addresses.
- Identify whether the local interface IP address conflicts with the peer interface IP address. If a conflict has occurred, execute the ip address command in interface view to edit the IP addresses.
- Identify whether the peer interface is the one where the next hop resides.
d. Use the ping command to identify whether a link failure exists.
3. Identify whether ARP packets are sent and received correctly.
a. Use the debugging arp packet command to enable ARP packet debugging. Then, execute the ping command to identify whether the device sends and receives ARP packets correctly.
<Sysname> debugging arp packet
<Sysname> ping –c 1 1.1.1.2
Ping 1.1.1.2 (1.1.1.2): 56 data bytes, press CTRL+C to break
56 bytes from 1.1.1.2: icmp_seq=0 ttl=255 time=2.511 ms
--- Ping statistics for 1.1.1.2 ---
1 packet(s) transmitted, 1 packet(s) received, 0.0% packet loss
round-trip min/avg/max/std-dev = 2.511/2.511/2.511/nan ms
<Sysname>*Apr 18 17:28:22:879 2022 Sysname ARP/7/ARP_SEND: -MDC=1; Sent an ARP message, operation: 1, sender MAC: 68cb-978f-0106, sender IP: 1.1.1.1, target MAC: 0000-0000-0000, target IP: 1.1.1.2
The command output indicates that the device has successfully sent an ARP request in which the destination IP address is 1.1.1.2 and the source IP address is 1.1.1.1.
*Apr 18 17:28:22:881 2022 Sysname ARP/7/ARP_RCV: -MDC=1; Received an ARP message, operation: 2, sender MAC: 68cb-9c3f-0206, sender IP: 1.1.1.2, target MAC: 68cb-978f-0106, target IP: 1.1.1.1
The command output indicates that the device has successfully received an ARP reply in which the destination IP address is 1.1.1.1 and the source IP address is 1.1.1.2.
- If the device has sent and received ARP packets successfully, go to step 4.
- If the device failed to send or receive an ARP packet, go to step b.
b. Use the debugging arp error command to enable ARP error debugging. Identify the ARP sending or receiving failure cause according to Table 1.
|
Field |
Description |
|
Packet discarded for the network state of receiving interface is down. |
An ARP packet was discarded because the network layer state of the receiving interface was down. |
|
Packet discarded for the ARP packet is too short. |
An ARP packet was discarded because the packet was too short. |
|
Packet discarded for the ARP packet is error. |
An ARP packet was discarded because the packet was an error packet. |
|
Packet discarded for the link state of the port is down. |
An ARP packet was discarded because the link layer state of the receiving port went down. |
|
Packet discarded for the sender IP is invalid. |
An ARP packet was discarded because the sender IP address in the packet was invalid. |
|
Packet discarded for the sender IP is a broadcast IP. |
An ARP packet was discarded because the sender IP address in the packet was a broadcast IP address. |
|
Packet discarded for the target IP is invaild. |
An ARP packet was discarded because the target IP address in the packet was invalid. |
|
Packet discarded for the target IP is a broadcast IP. |
An ARP packet was discarded because the target IP address in the packet was a broadcast IP address. |
|
Failed to get the source MAC of the ARP reply. |
ARP failed to obtain the source MAC address of an ARP reply. |
|
Packet discarded for the source MAC is a multicast address. |
An ARP packet was discarded because the source MAC address in the packet was a multicast MAC address. |
|
Packet discarded for the source MAC is a broadcast address. |
An ARP packet was discarded because the source MAC address in the packet was a broadcast MAC address. |
|
Packet discarded for the sender MAC address is the same as the receiving interface. |
An ARP packet was discarded because the sender MAC address in the packet is the same as the MAC address of the receiving interface. |
|
Packet discarded for the number of ARP entries reaches the limit. |
An ARP packet was discarded because the maximum number of ARP entries was reached. |
|
Packet discarded for the type of receiving interface is L2VE. |
An ARP packet was discarded because the receiving interface of the packet was an L2VE interface. |
|
Packet discarded for conflict with static entry. |
An ARP packet was discarded because the ARP information in the packet conflicted with a static ARP entry. |
|
Packet discarded for memory alarm notification. |
An ARP packet was discarded because a memory alarm notification was received. |
|
Packet discarded for insufficient resources. |
An ARP packet was discarded because of insufficient resources. |
4. Identify whether a card is faulty. The following uses the card in slot 1 as an example. Use the display system internal arp statistics command to view ARP statistics of the card.
<Sysname> system-view
[Sysname] probe
[Sysname-probe] display system internal arp statistics slot 1
Entry statistics:
Valid = 1 Dummy = 0
Long static = 0 Short resolved = 0
Multiport = 0 L3 short = 0
Packet = 1 OpenFlow = 0
Rule = 0 ARP input = 175
Resolved = 10
Static statistics:
Short static = 0 Long static = 0
Multiport = 0 Disabled = 0
Error statistics:
Memory = 0 Sync memory = 0
Packet = 10 Parameter = 0
IF = 0 Walk = 0
Add host route = 0 Del host route = 0
Local address = 0 Real time message = 0
Refresh rule = 0 Delete rule = 0
Smooth rule start = 0 Smooth rule end = 0
Running information:
Max ARP = 2048 Max multiport = 64
Default blackhole = 1 Max blackhole = 200
Timer queue = 0 Event queue = 0
Packet queue = 0 LIPC send queue = 0/0/0
a. If the value for the ARP input field is not 0, go to step 5. If the value for the ARP input field is 0, troubleshoot the card issue.
b. Collect the content of the Error statistics field and send it to H3C technical support staff.
5. Identify whether ARP packets are dropped due to a busy CPU. Use the view command to view information about ARP in the /proc/kque system directory and identify the situation and reason of ARP packet dropping.
[Sysname-probe] view /proc/kque | in ARP
0: dd0e0800 ARP_TIMER 128/0/13/0 (0x4b515545)
0: dd0e0900 ARP_SINGLEEVENT 1/0/0/0 (0x4b515545)
0: dd0e0a00 ARP_SEND 1024/0/0/0 (0x4b515545)
0: dd0e0b00 ARP_RULE 4096/0/0/0 (0x4b515545)
0: dd0e0c00 ARP_RULE_ENTRY 4096/0/0/0 (0x4b515545)
0: dd0e0d00 ARP_RBHASHNOTIFY 1/0/0/0 (0x4b515545)
0: dd0e0f00 ARP_DTC 2048/0/0/0 (0x4b515545)
0: dd0e6200 ARP_MICROSEGMENT 2048/0/0/0 (0x4b515545)
0: dd0e6300 ARP_MACNOTIFY 4096/0/0/0 (0x4b515545)
0: dd0e6400 ARP_UNKNOWNSMAC_EVENT 1/0/0/0 (0x4b515545)
0: d06e5900 ARPSNP_PKT 4096/0/0/0 (0x4b515545)
0: d06e5a00 ARP_VSISUP_PKT 4096/0/0/0 (0x4b515545)
0: d06e5b00 ARP_EVENT 8192/0/2/0 (0x4b515545)
0: d06e5c00 ARP_FREQEVENT 8192/0/1/0 (0x4b515545)
0: d06e5d00 ARP_MACNOTIFYEVENT 1/0/0/0 (0x4b515545)
0: d06e5e00 ARP_PKT 4096/0/2/0 (0x4b515545)
0: ca5f3400 FIBARPHRQ 1/0/0/0 (0x4b515545)
View the value for the ARP_PKT field in the command output, which is displayed in the W/X/Y/Z format.
¡ W represents the queue capacity, which is a fixed value.
¡ X represents the current queue length.
¡ Y represents the history maximum length of the queue.
¡ Z represents the number of dropped ARP packets in the queue.
If Z is not 0 and Y equals W, ARP packets are dropped due to a busy CPU. If Z is 0, go to step 6.
6. Collect detailed information about the ARP process. Execute the display mdc command to obtain the MDC number. Use the display process command to view the number of the ARP process corresponding to the MDC number. Based on the process number, use the view command to obtain detailed information about the ARP process and send it to H3C technical support staff.
[Sysname-probe] display process name karp/1
Job ID: 224
PID: 224
Parent JID: 2
Parent PID: 2
Executable path: -
Instance: 0
Respawn: OFF
Respawn count: 1
Max. spawns per minute: 0
Last started: Mon Apr 18 15:09:58 2022
Process state: sleeping
Max. core: 0
ARGS: -
TID LAST_CPU Stack PRI State HH:MM:SS:MSEC Name
224 0 0K 115 S 0:5:25:380 [karp/1]
1 in the karp/1 argument represents the MDC number. PID in the command output represents the number of the ARP process. Execute the view command to display detailed information about the ARP process numbered 224.
[Sysname-probe]view /proc/224/stack
[<c04c9cd4>] kepoll_wait+0x274/0x3c0
[<e1fb1372>] arp_Thread+0x42/0xd0 [system]
[<c043f1b4>] kthread+0xd4/0xe0
[<c0401daf>] kernel_thread_helper+0x7/0x10
[<ffffffff>] 0xffffffff
7. Collect the following information and contact H3C Technical Support:
¡ Results of each step.
¡ The configuration file, log messages, and alarm messages.
Related alarm and log messages
Alarm messages
N/A
Log messages
N/A
ARP response failure
Symptom
The device does not reply to the ARP request sent from the peer device.
Common causes
The following are the common causes of this type of issue:
· The target IP address in the ARP request received by the interface is not the IP address of the local device.
· The ARP request sent by the peer device triggers source MAC-based ARP attack detection on the local device.
· The ARP request sent by the peer device triggers ARP attack detection on the local device.
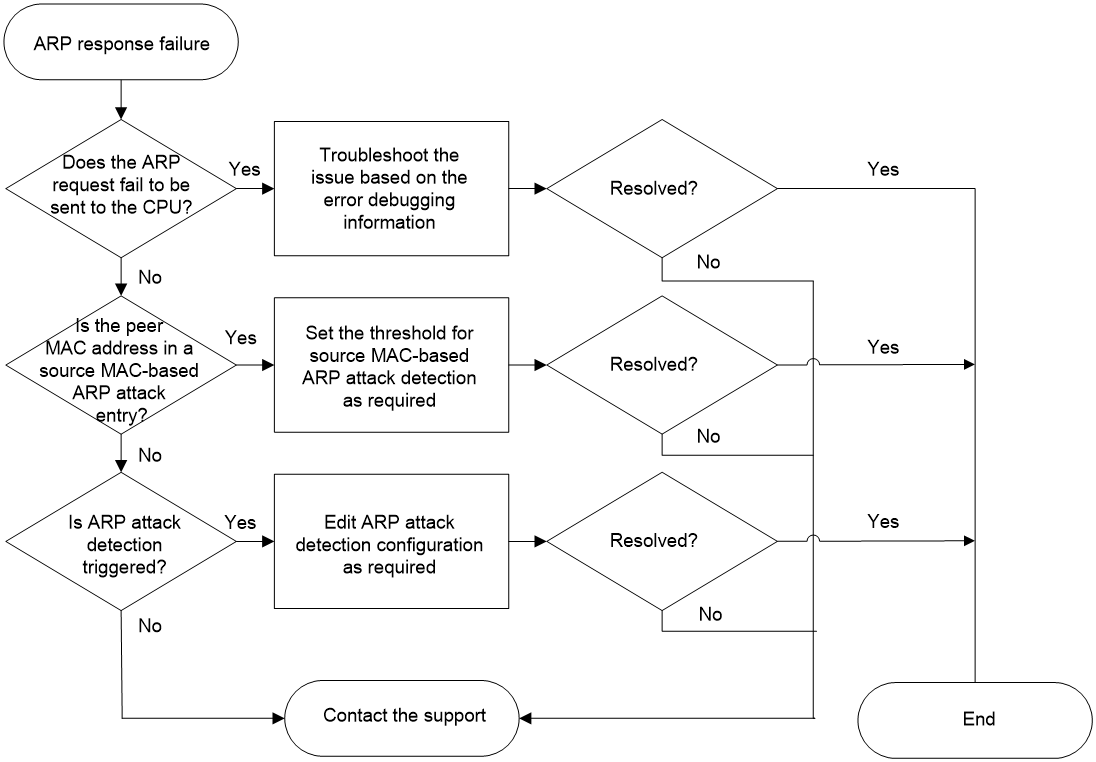
Troubleshooting flow
Figure 2 shows the troubleshooting flowchart.
Figure 2 Flowchart for troubleshooting ARP response failure
Solution
1. View information about the ARP request sent from the peer device to identify whether it is sent to the CPU.
a. Use the debugging arp packet command to enable ARP packet debugging. Then, configure the peer device to send an ARP request to the local device.
<Sysname> debugging arp packet
<Sysname> *Apr 21 17:38:05:489 2022 Sysname ARP/7/ARP_RCV: -MDC=1; Received an ARP message, operation: 1, sender MAC: 68cb-9c3f-0206, sender IP: 1.1.1.2, target MAC: 0000-0000-0000, target IP: 1.1.1.1
- If the target IP address is not the local device IP address, check the routing table and FIB of the peer device.
- If the target IP address is the local device IP address, go to step b.
b. Use the debugging arp error command to enable ARP error debugging. Identify the ARP response failure cause according to Table 2.
|
Field |
Description |
|
Packet discarded for the network state of receiving interface is down. |
An ARP packet was discarded because the network layer state of the receiving interface was down. |
|
Packet discarded for the ARP packet is too short. |
An ARP packet was discarded because the packet was too short. |
|
Packet discarded for the ARP packet is error. |
An ARP packet was discarded because the packet was an error packet. |
|
Packet discarded for the link state of the port is down. |
An ARP packet was discarded because the link layer state of the receiving port went down. |
|
Packet discarded for the sender IP is invalid. |
An ARP packet was discarded because the sender IP address in the packet was invalid. |
|
Packet discarded for the sender IP is a broadcast IP. |
An ARP packet was discarded because the sender IP address in the packet was a broadcast IP address. |
|
Packet discarded for the target IP is invaild. |
An ARP packet was discarded because the target IP address in the packet was invalid. |
|
Packet discarded for the target IP is a broadcast IP. |
An ARP packet was discarded because the target IP address in the packet was a broadcast IP address. |
|
Failed to get the source MAC of the ARP reply. |
ARP failed to obtain the source MAC address of an ARP reply. |
|
Packet discarded for the source MAC is a multicast address. |
An ARP packet was discarded because the source MAC address in the packet was a multicast MAC address. |
|
Packet discarded for the source MAC is a broadcast address. |
An ARP packet was discarded because the source MAC address in the packet was a broadcast MAC address. |
|
Packet discarded for the sender MAC address is the same as the receiving interface. |
An ARP packet was discarded because the sender MAC address in the packet is the same as the MAC address of the receiving interface. |
|
Packet discarded for the number of ARP entries reaches the limit. |
An ARP packet was discarded because the maximum number of ARP entries was reached. |
|
Packet discarded for the type of receiving interface is L2VE. |
An ARP packet was discarded because the receiving interface of the packet was an L2VE interface. |
|
Packet discarded for conflict with static entry. |
An ARP packet was discarded because the ARP information in the packet conflicted with a static ARP entry. |
|
Packet discarded for memory alarm notification. |
An ARP packet was discarded because a memory alarm notification was received. |
|
Packet discarded for insufficient resources. |
An ARP packet was discarded because of insufficient resources. |
2. Identify whether the peer device MAC address is in a source MAC-based ARP attack entry. The following uses local interface Ten-GigabitEthernet 0/0/6 as an example. Execute the display arp source-mac command to display ARP attack entries detected by source MAC-based ARP attack detection.
<Sysname> display arp source-mac interface ten-gigabitethernet 0/0/6
Source-MAC VLAN/VSI name Interface Aging-time (sec)
23f3-1122-3344 4094 XGE0/0/6 10
¡ If a source MAC-based ARP attack entry exists and the MAC address is the peer device MAC address, set the threshold for source MAC-based ARP attack detection as required. To set the threshold for source MAC-based ARP attack detection, use the arp source-mac threshold command.
¡ If the peer device MAC address is not in any source MAC-based ARP attack entry, go to step 3.
3. Identify whether the peer device triggers ARP attack detection. The following uses slot 1 as an example. Execute the display arp detection statistics attack-source command to display statistics for ARP attack sources.
<Sysname> display arp detection statistics attack-source slot 1
Interface VLAN MAC address IP address Number Time
XGE0/0/6 1 0005-0001-0001 10.1.1.14 24 17:09:56
03-27-2017
¡ If an entry has the peer device MAC address, check the ARP attack detection configuration to identify whether inappropriate configuration causes the peer device to trigger ARP attack detection. If the configuration is inappropriate, edit it.
¡ If no entry has the peer device MAC address, go to step 4.
4. Use the display arp detection statistics packet-drop command to display statistics for packets dropped by ARP attack detection. Identify the reason why ARP attack detection is triggered according to the statistics.
<Sysname> display arp detection statistics packet-drop
State: U-Untrusted T-Trusted
ARP packets dropped by ARP inspect checking:
Interface/AC(State) IP Src-MAC Dst-MAC Inspect
XGE0/0/6(U) 40 0 0 78
XGE0/0/6(U) 0 0 0 0
XGE0/0/6(T) 0 0 0 0
XGE0/0/6(U) 0 0 30 0
XGE0/0/10-srv1(U) 0 10 20 0
XGE0/0/10-srv2(T) 10 0 20 22
Table 3 Command output
|
Field |
Description |
|
State |
State of an interface: · U—ARP untrusted interface or AC. · T—ARP trusted interface or AC. |
|
Interface/AC(State) |
Inbound interface or AC of ARP packets. State specifies the port or AC state, which is trusted or untrusted. |
|
IP |
Number of ARP packets discarded due to invalid sender and target IP addresses. |
|
Src-MAC |
Number of ARP packets discarded due to invalid source MAC address. |
|
Dst-MAC |
Number of ARP packets discarded due to invalid destination MAC address. |
|
Inspect |
Number of ARP packets that failed to pass user validity check. |
5. Use the display system internal arp statistics command to display ARP statistics on each card. Collect the content of the Error statistics field and send it to H3C technical support staff.
[Sysname-probe] display system internal arp statistics slot 1
Entry statistics:
Valid = 1 Dummy = 0
Long static = 0 Short resolved = 0
Multiport = 0 L3 short = 0
Packet = 1 OpenFlow = 0
Rule = 0 ARP input = 175
Resolved = 10
Static statistics:
Short static = 0 Long static = 0
Multiport = 0 Disabled = 0
Error statistics:
Memory = 0 Sync memory = 0
Packet = 10 Parameter = 0
IF = 0 Walk = 0
Add host route = 0 Del host route = 0
Local address = 0 Real time message = 0
Refresh rule = 0 Delete rule = 0
Smooth rule start = 0 Smooth rule end = 0
Running information:
Max ARP = 2048 Max multiport = 64
Default blackhole = 1 Max blackhole = 200
Timer queue = 0 Event queue = 0
Packet queue = 0 LIPC send queue = 0/0/0
6. Use the debugging arp entry command to enable ARP entry debugging. View the ARP entry status, collect related logs, and send them to H3C technical support staff.
<Sysname> debugging arp entry
<Sysname> ping -c 1 192.168.111.188
PING 192.168.111.188 (192.168.111.188): 56 data bytes, press CTRL_C to break
56 bytes from 192.168.111.188: icmp_seq=0 ttl=128 time=1.000 ms
--- 192.168.111.188 ping statistics ---
1 packet(s) transmitted, 1 packet(s) received, 0.0% packet loss
round-trip min/avg/max/std-dev = 1.000/1.000/1.000/0.000 ms
*Dec 17 14:28:34:762 2012 Sysname ARP/7/ARP_ENTRY: -MDC=1; ARP entry status ch
anged: MAC address: 000a-eb83-691e, IP address: 192.168.111.188, INITIALIZE -> N
O_AGE
Table 4 Command output
|
Field |
Description |
|
ARP entry status changed |
The status of an ARP entry changed. |
|
MAC address |
MAC address in the ARP entry. |
|
IP address |
IP address in the ARP entry. |
|
state1->state2 |
The status of the ARP entry changed from state1 to state2. An ARP entry has the following status: · INITIALIZE—The ARP entry is not resolved. · NO_AGE—The ARP entry does not age out. · AGING—Aging probe for the ARP entry has started. · AGED—The ARP entry ages out and is to be deleted. |
7. Collect the following information and contact H3C Technical Support:
¡ Results of each step.
¡ The configuration file, log messages, and alarm messages.
Related alarm and log messages
Alarm messages
N/A
Log messages
N/A
Traffic forwarding failure based on the existing ARP entry
Symptom
The device has learned an ARP entry but cannot forward traffic correctly.
Common causes
The following are the common causes of this type of issue:
· An abnormal parameter exists in the learned ARP entry.
· The learned ARP entry failed to be deployed to the driver.
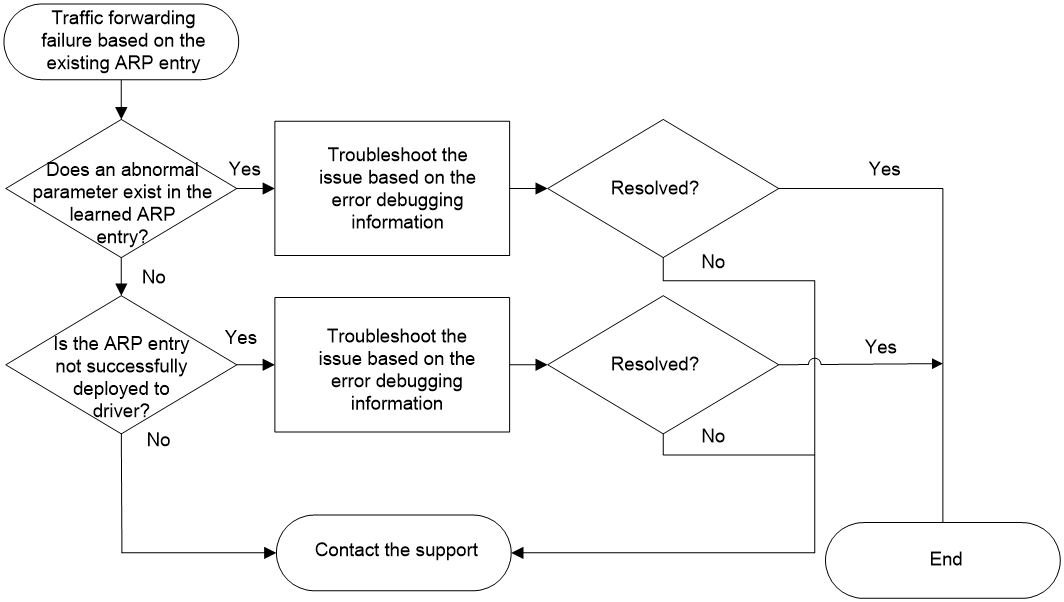
Troubleshooting flow
Figure 3 shows the troubleshooting flowchart.
Figure 3 Flowchart for troubleshooting traffic forwarding failure based on the existing ARP entry
Solution
1. Identify whether an abnormal parameter exists in the learned ARP entry. Use the display system internal adj4 entry command to view ARP entry information. The following uses interface Ten-GigabitEthernet 0/0/6 and peer IP address 1.1.1.2 as an example.
<Sysname> system-view
[Sysname] probe
[Sysname-probe] display system internal adj4 entry 1.1.1.2 interface ten-gigabitethernet 0/0/6
ADJ4 entry:
Entry attribute : 0x0
Service type : Ethernet
Link media type : Broadcast
Action type : Forwarding
Entry flag : 0x0
Forward type : 0x0
Slot : 0
MTU : 1500
Driver flag : 2
Sequence No : 17
Physical interface : XGE0/0/6
Logical interface : N/A
Virtual circuit information : 65535
ADJ index : 0xdc731e70
Peer address : 0.0.0.0
Reference count : 0
Reference Sequence : 9
MicroSegmentID : 0
Nexthop driver[0] : 0xffffffff
Nexthop driver[1] : 0xffffffff
Driver context[0] : 0xffffffff
Driver context[1] : 0xffffffff
Driver context[2] : 0xffffffff
Driver context[3] : 0xffffffff
Driver context[4] : 0xffffffff
Driver context[5] : 0xffffffff
Link head information(IP) : 68cb9c3f020668cb978f01060800
Link head information(MPLS) : 68cb9c3f020668cb978f01068847
¡ If the Action type field displays Forwarding, the device forwards traffic from 1.1.1.2 correctly and the device is not faulty.
¡ If the Action type field displays Drop, the device fails to forward traffic from 1.1.1.2. An abnormal parameter exists in the learned ARP entry.
- If the Driver flag field displays 4, driver resources are insufficient. Check the driver usage.
- If the Driver flag field does not display 4, go to step 2.
2. Identify whether the ARP entry is successfully deployed to the driver. Use the debugging system internal adj4 command and specify the hardware keyword to enable IPv4 adjacency entry debugging. Use the reset arp command to clear ARP entries from the ARP table. Then, use the ping command to send a packet to the peer device to trigger ARP learning. View the state of ARP deployment to the driver.
<Sysname> system-view
[Sysname] probe
[Sysname-probe] debugging system internal adj4 hardware
[Sysname-probe] ping 1.1.1.2
Ping 1.1.1.2 (1.1.1.2): 56 data bytes, press CTRL+C to break
56 bytes from 1.1.1.2: icmp_seq=0 ttl=255 time=2.015 ms
*Apr 22 15:57:56:173 2022 Sysname ARP/7/ARP_SEND: -MDC=1; Sent an ARP message, operation: 1, sender MAC: 68cb-978f-0106, sender IP: 1.1.1.1, target MAC: 0000-0000-0000, target IP: 1.1.1.2
*Apr 22 15:57:56:173 2022 Sysname ARP/7/ARP_RCV: -MDC=1; Received an ARP message, operation: 2, sender MAC: 68cb-9c3f-0206, sender IP: 1.1.1.2, target MAC: 68cb-978f-0106, target IP: 1.1.1.1
*Apr 22 15:57:56:174 2022 Sysname ADJ4/7/ADJ4_ENTRY: -MDC=1;
-------------ADJ4 Entry------------
IP address : 1.1.1.2
Route interface : XGE0/0/6
Service type : Ethernet
Action type : Forwarding
Link media type : Broadcast
Physical interface : XGE0/0/6
Logical interface : N/A
VSI Index : 4294967295
VPN Index : 0
MicroSegmentID : 0
MicSegOrigin : 5
Virtual Circuit information : 0xffff
Sequence : 1
Sequence for aging : 1
Slot : 0
MTU : 1500
*Apr 22 15:57:56:174 2022 Sysname ADJ4/7/ADJ4_ENTRY: -MDC=1;
Add ADJ entry finished, Result : 0
*Apr 22 15:57:56:174 2022 Sysname ADJ4/7/ADJ4_HARDWARE: -MDC=1;
====Start ADJLINK Add====
*Apr 22 15:57:56:174 2022 Sysname ADJ4/7/ADJ4_HARDWARE: -MDC=1;
--------------- New Entry -------------
Service type : Ethernet
Link media type : Broadcast
Action type : Forwarding
EntryAttr : 0
IP address : 1.1.1.2
Route interface : XGE0/0/6
Port interface : N/A
Slot : 0
MTU : 1500
VLAN ID : 65535
Second VLAN ID : 65535
Physical interface : XGE0/0/6
Logical interface : N/A
VRF index : 0
VSI index : -1
VSI link ID : 65535
Usr ID : -1
MAC address : 68cb-9c3f-0206
Link head length(IP) : 14
Link head length(MPLS) : 14
Link head information(IP) : 68cb9c3f020668cb978f01060800
Link head information(MPLS) : 68cb9c3f020668cb978f01068847
*Apr 22 15:57:56:174 2022 Sysname ADJ4/7/ADJ4_HARDWARE: -MDC=1;
----------- New Entry DrvContext ---------
Nexthop driver
[0]: 0xffffffff [1]: 0xffffffff
Driver context
[0]: 0xffffffff [1]: 0xffffffff [2]: 0xffffffff [3]: 0xffffffff [4]: 0xffffffff [5]: 0xffffffff
TRILL VN driver context
[0]: 0xffffffffffffffff [1]: 0xffffffffffffffff
*Apr 22 15:57:56:174 2022 Sysname ADJ4/7/ADJ4_HARDWARE: -MDC=1;
====End ADJLINK Operate====
Result : 0x0, Reference flag : 0x0, Syn flag : 0x0
56 bytes from 1.1.1.2: icmp_seq=1 ttl=255 time=1.061 ms
56 bytes from 1.1.1.2: icmp_seq=2 ttl=255 time=0.908 ms
56 bytes from 1.1.1.2: icmp_seq=3 ttl=255 time=0.625 ms
56 bytes from 1.1.1.2: icmp_seq=4 ttl=255 time=0.580 ms
--- Ping statistics for 1.1.1.2 ---
5 packet(s) transmitted, 5 packet(s) received, 0.0% packet loss
round-trip min/avg/max/std-dev = 0.580/1.038/2.015/0.520 ms
[Sysname-probe]%Apr 22 15:57:56:986 2022 Sysname PING/6/PING_STATISTICS: -MDC=1; Ping statistics for 1.1.1.2: 5 packet(s) transmitted, 5 packet(s) received, 0.0% packet loss, round-trip min/avg/max/std-dev = 0.580/1.038/2.015/0.520 ms.
¡ If the Result field displays 0x0, the ARP entry has been successfully deployed to the driver. Go to step 3.
¡ If the Result field does not display 0x0, the ARP entry failed to be deployed to the driver. Check the hardware resource usage under the guidance of H3C technical support staff.
3. Execute the following commands, collect the command outputs, and send them to H3C technical support staff:
¡ debugging system internal adj4 (with the notify keyword specified)
¡ debugging system internal fib prefix
4. Collect the following information and contact H3C Technical Support:
¡ Results of each step.
¡ The configuration file, log messages, and alarm messages.