- Table of Contents
- Related Documents
-
| Title | Size | Download |
|---|---|---|
| 02-NSM Automated Device Monitoring Configuration Examples | 5.07 MB |
Automated Device Monitoring Configuration Examples
Document version: 5W100-20240827
Copyright © 2025 New H3C Technologies Co., Ltd. All rights reserved.
No part of this manual may be reproduced or transmitted in any form or by any means without prior written consent of New H3C Technologies Co., Ltd.
Except for the trademarks of New H3C Technologies Co., Ltd., any trademarks that may be mentioned in this document are the property of their respective owners.
The information in this document is subject to change without notice.
Contents
Example: Configuring automated device monitoring
Configuring monitoring templates
Quickly adding a monitoring template by copying an existing one
Deploying monitoring templates (enabling device monitoring)
Editing the monitoring settings
Suspending or disabling device monitoring
Introduction
To monitor the health and performance of a network device, add that device to the list of monitored devices. The collected statistics can help you make data-driven optimization and scaling decisions to improve network performance.
Feature usage guide
Applicable scenarios
Monitor devices added to the system and obtain performance-related data from the devices.
Prerequisites
The devices to be monitored have been managed by NSM.
Example: Configuring automated device monitoring
To implement automated monitoring of devices in the system, the general approach is as follows:
1. Configure monitoring templates.
Configure monitoring indexes, thresholds, and other data in a monitoring template. Monitoring templates help you concretize abstract monitoring strategies and offer the advantage of reusability. You can deploy the same monitoring template to multiple devices or modifying an existing monitoring template to quickly create a new one.
2. Deploy the monitoring templates.
Bind the appropriate monitoring templates to the devices that need to be monitored.
3. Enable automated device monitoring.
4. View the monitoring data.
Configuring monitoring templates
Adding a monitoring template
1. Log in to Unified Platform as an administrator.
2. From the left navigation pane, select Monitor > Monitor Options > Monitor Templates to access the monitoring template page, as shown in Figure 1. The page lists all monitoring templates in the system.
Figure 1 Monitoring templates page
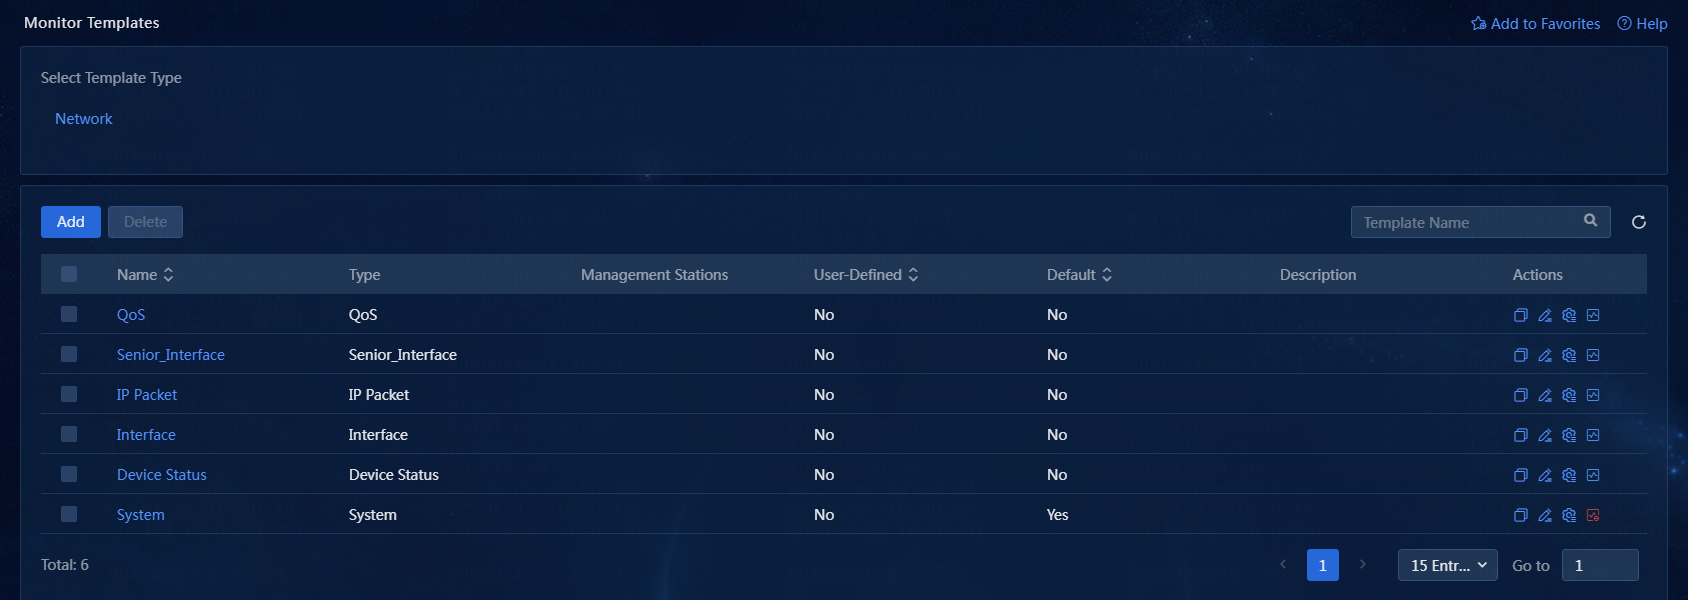
3. Select the template type as needed. Different monitoring template types correspond to different performance data. This example uses the System template type: click Network > System on the monitoring template page.
4. Click Add to add a monitoring template.
Figure 2 Adding a monitoring template
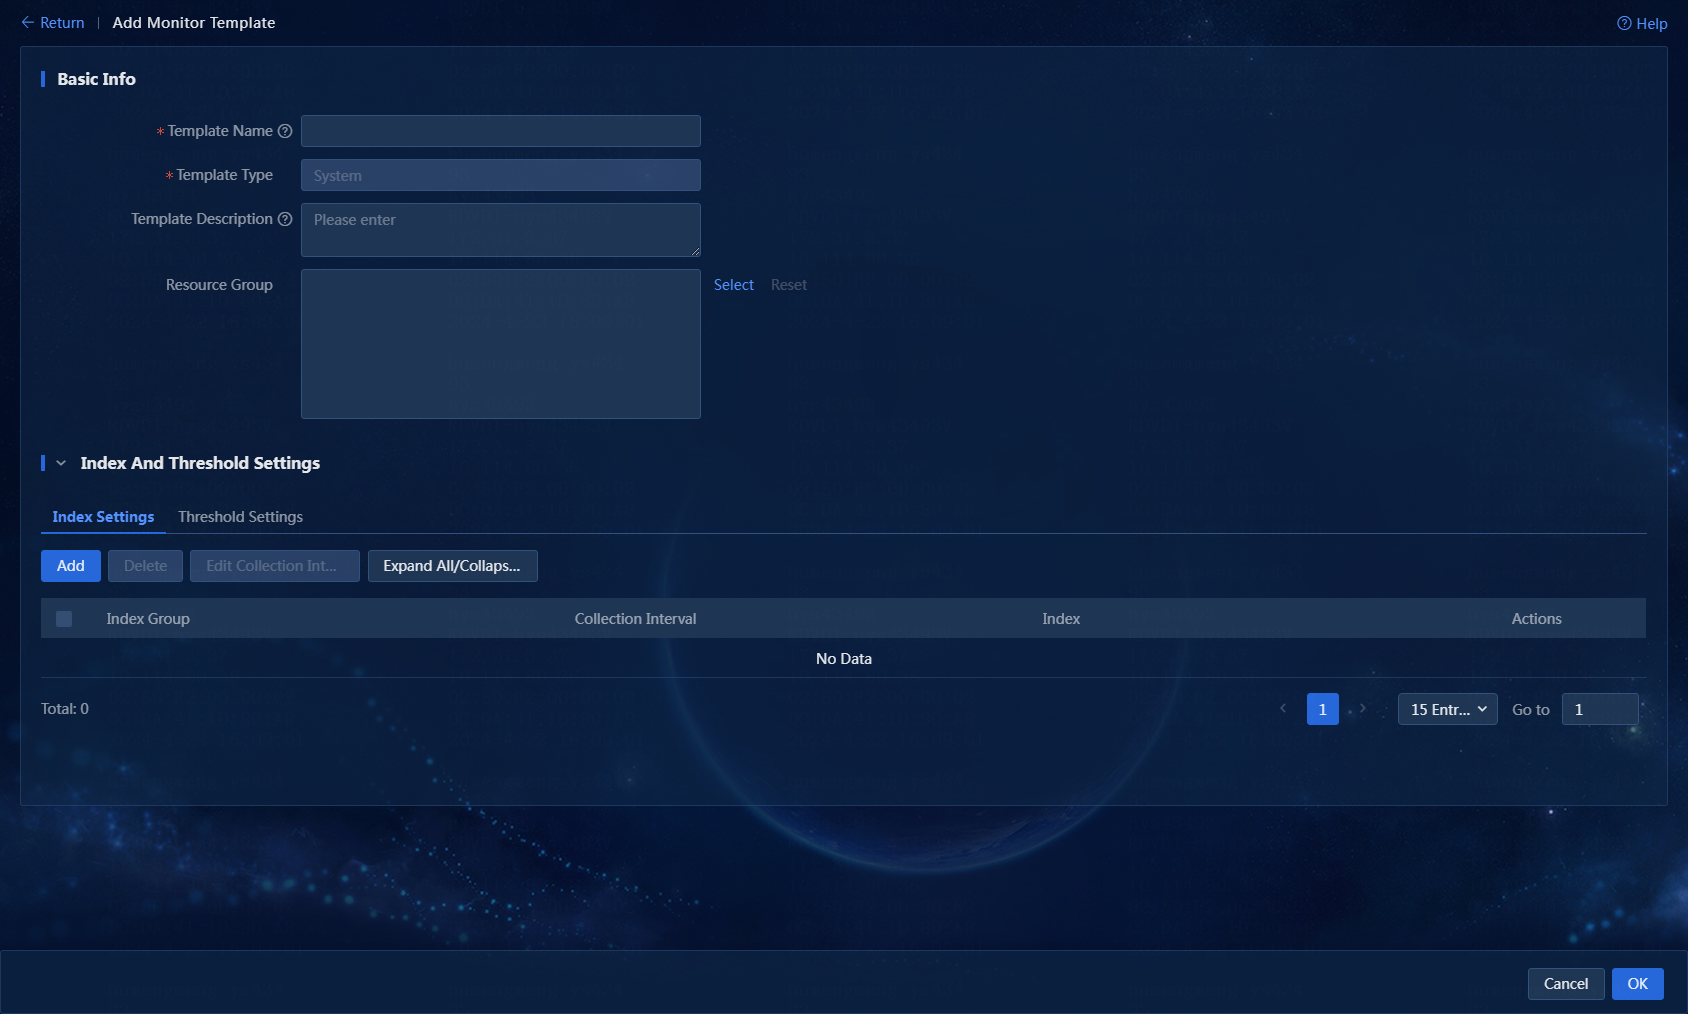
5. Configure basic information: This includes the template name, template type, template description, and the resource group the current template belongs to.
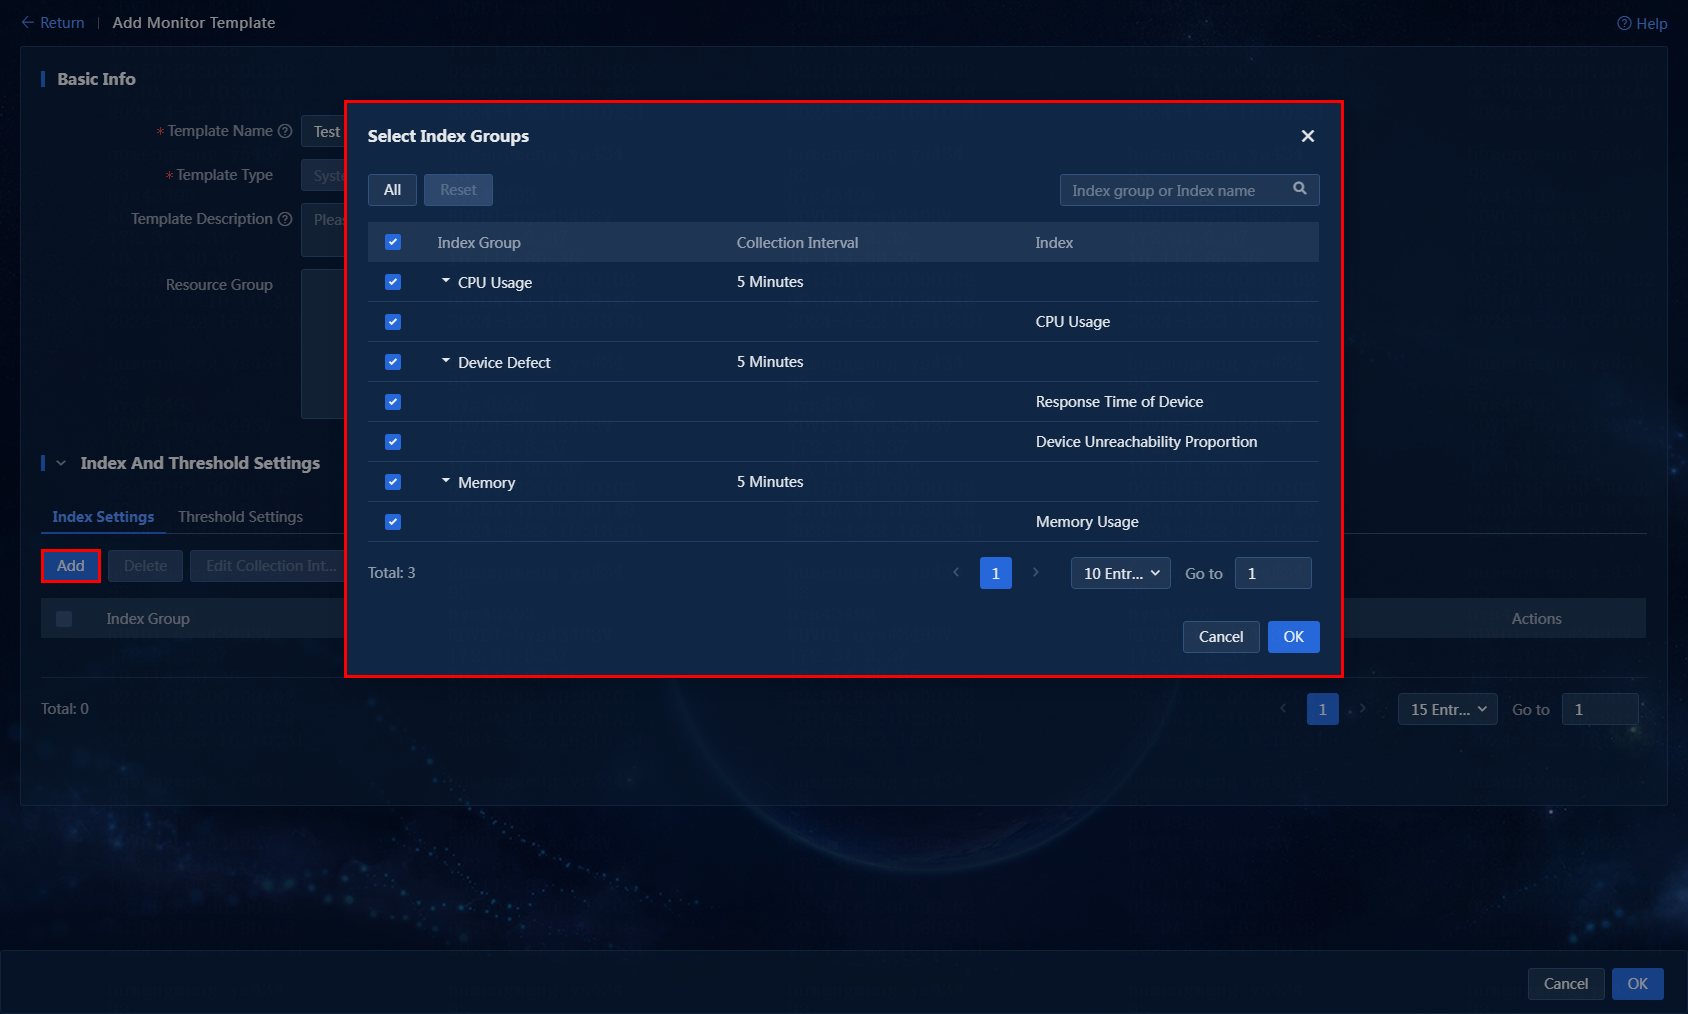
6. Configure the monitoring indexes for the template: Click the Index Settings tab, and then click Add. In the window that opens, select the index groups you want to monitor, as shown in Figure 3. After selecting the monitoring indexes, click OK.
Figure 3 Selecting monitoring indexes
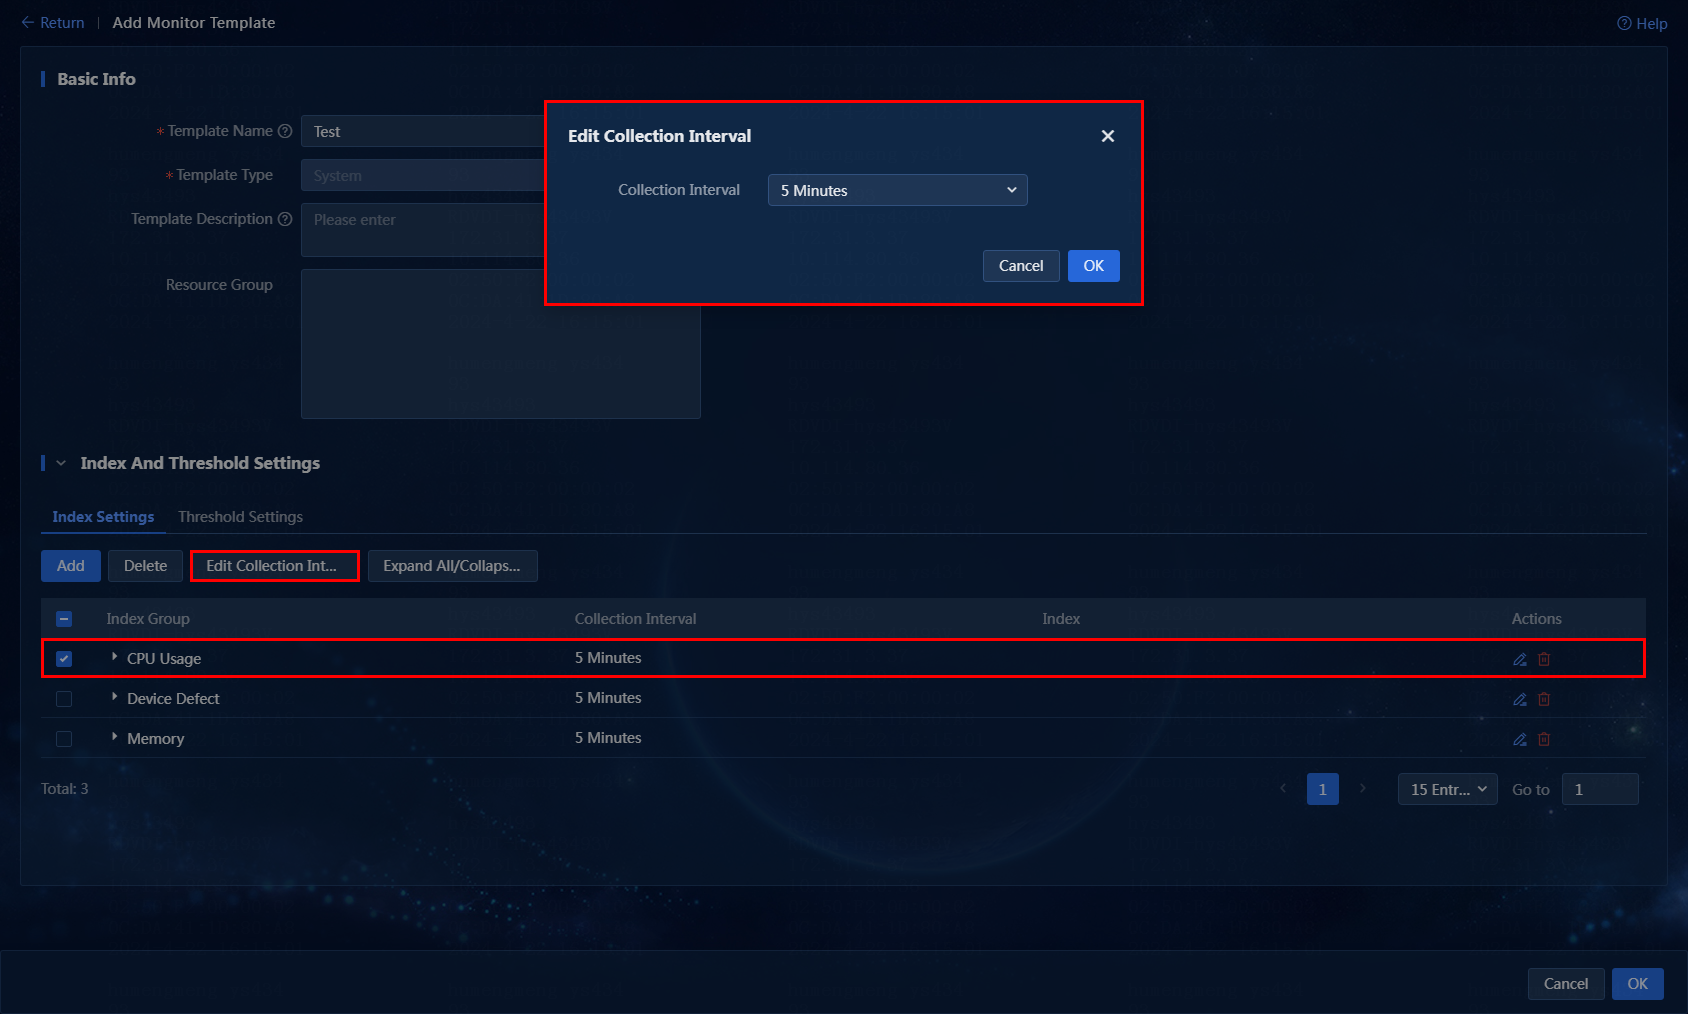
7. The default collection interval for the monitoring indexes is 5 minutes. To change the collection interval, you can use either of the following two methods:
¡ Method 1: Select the indexes for which you want to change the collection interval, click Edit Collection Interval. In the window that opens, select an interval from the Collection Interval list, as shown in Figure 4.
Figure 4 Editing the collection interval - Method 1
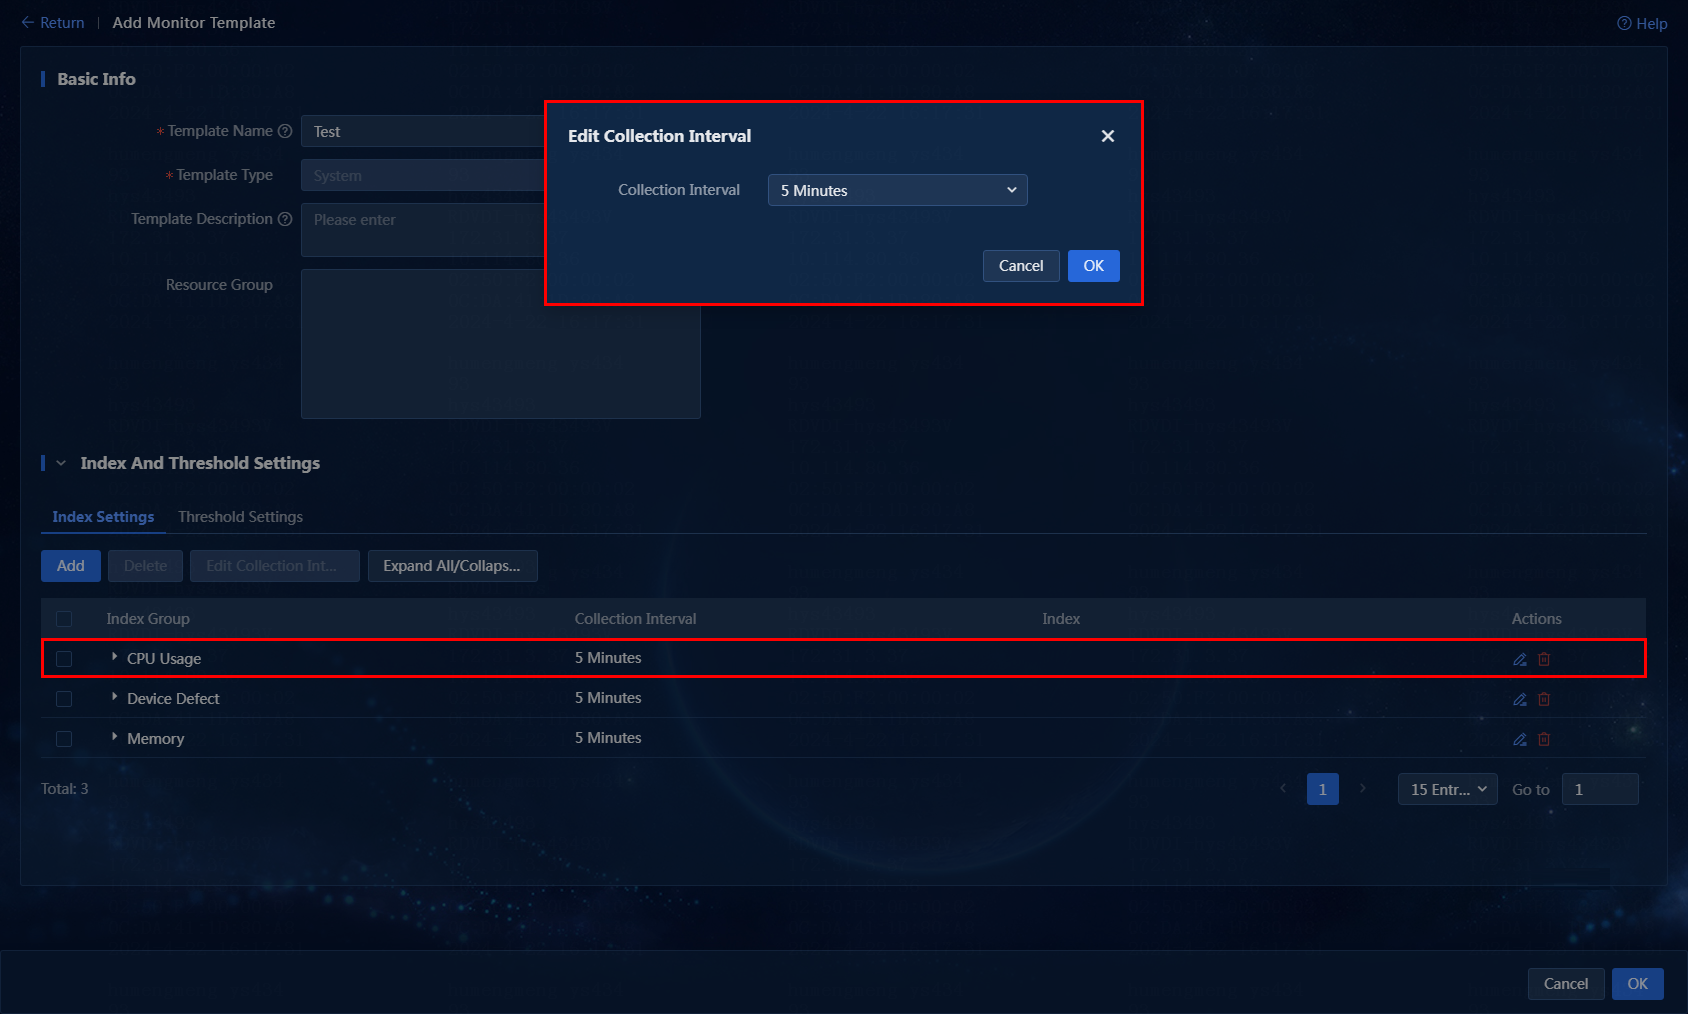
¡ Method
2: Click the ![]() icon in the Actions column of an index
group. In the window that opens, select a collection interval, as shown in Figure 5.
icon in the Actions column of an index
group. In the window that opens, select a collection interval, as shown in Figure 5.
Figure 5 Editing the collection interval - Method 2
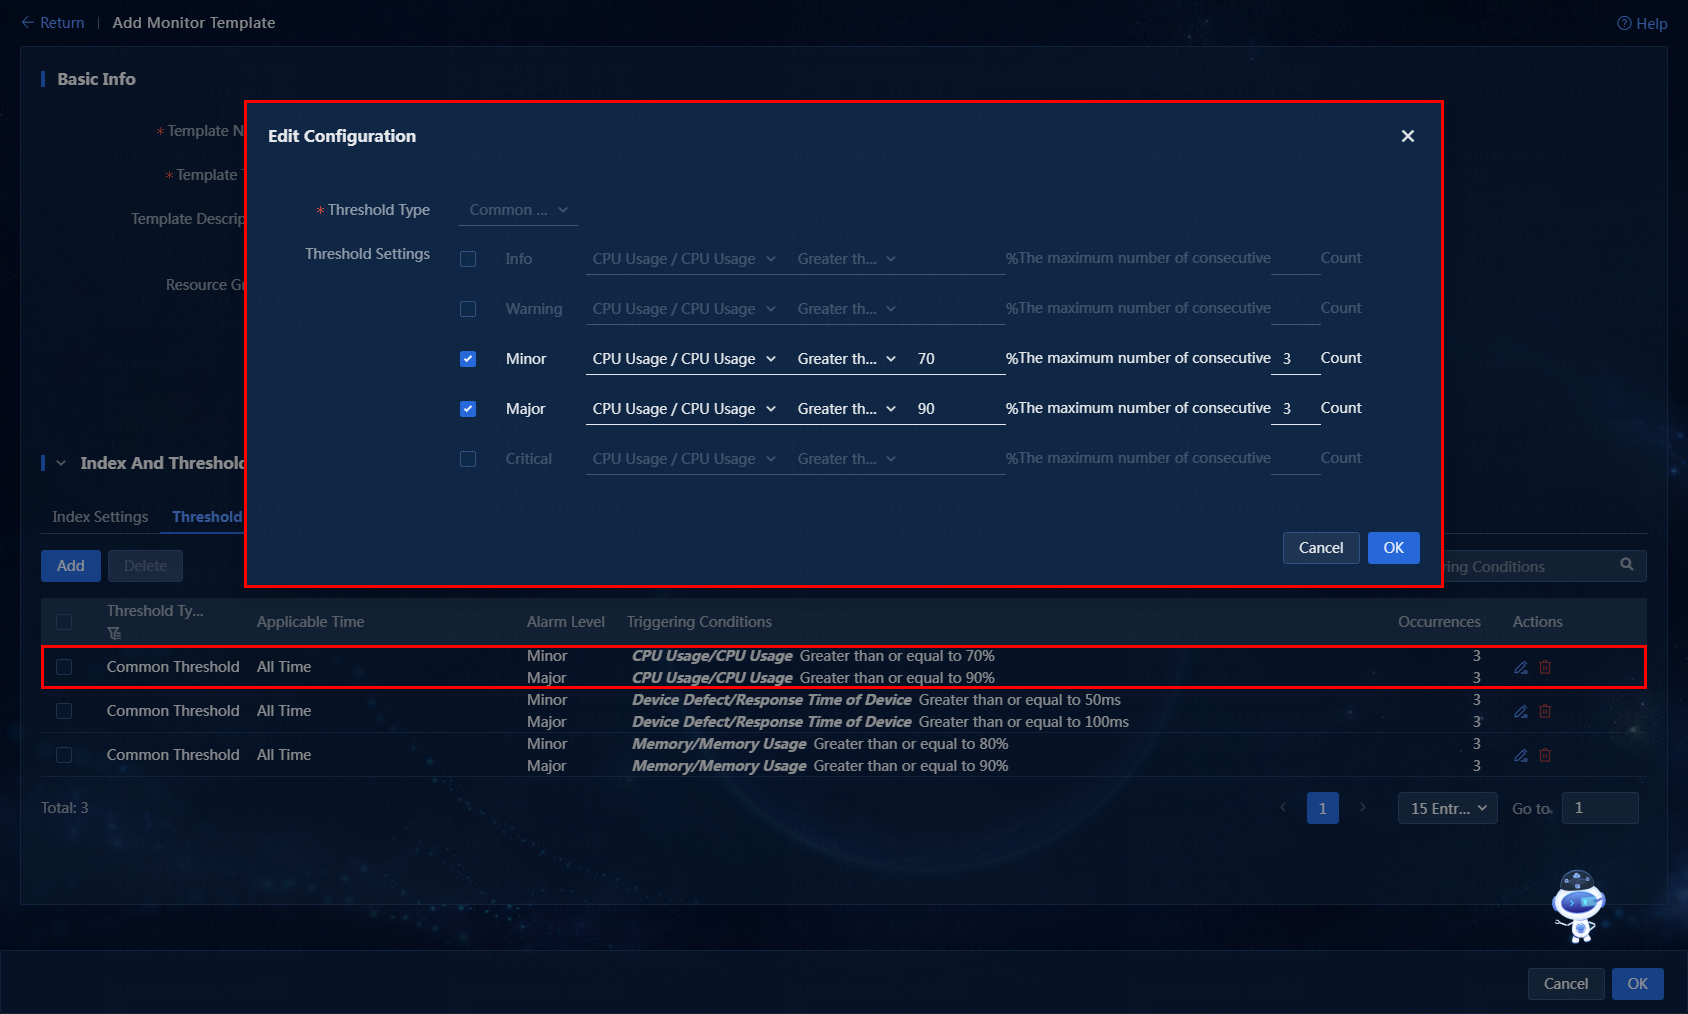
8. Set thresholds for monitoring indexes: After
selecting the monitoring indexes, the system provides default threshold
settings. To edit the threshold settings, click Threshold
Settings tab, and then click the ![]() icon in the Actions column for a
threshold entry. In the dialog box that opens, edit the settings and then click
OK, as shown in Figure 6.
icon in the Actions column for a
threshold entry. In the dialog box that opens, edit the settings and then click
OK, as shown in Figure 6.
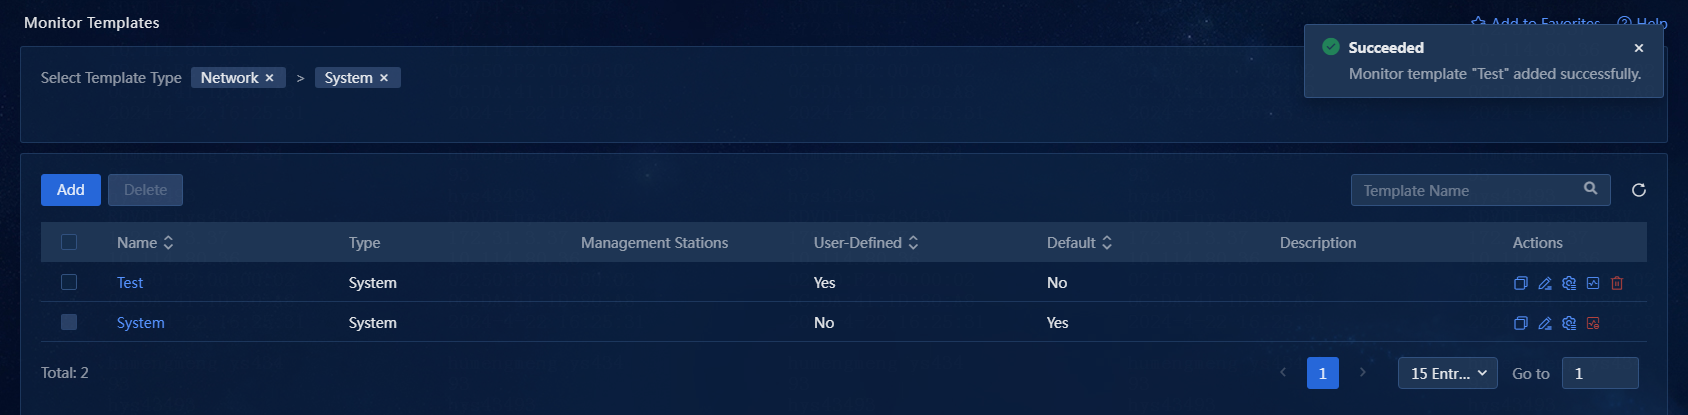
9. Click OK. The monitoring template is successfully added, as shown in Figure 7.
Figure 7 Monitoring template added successfully
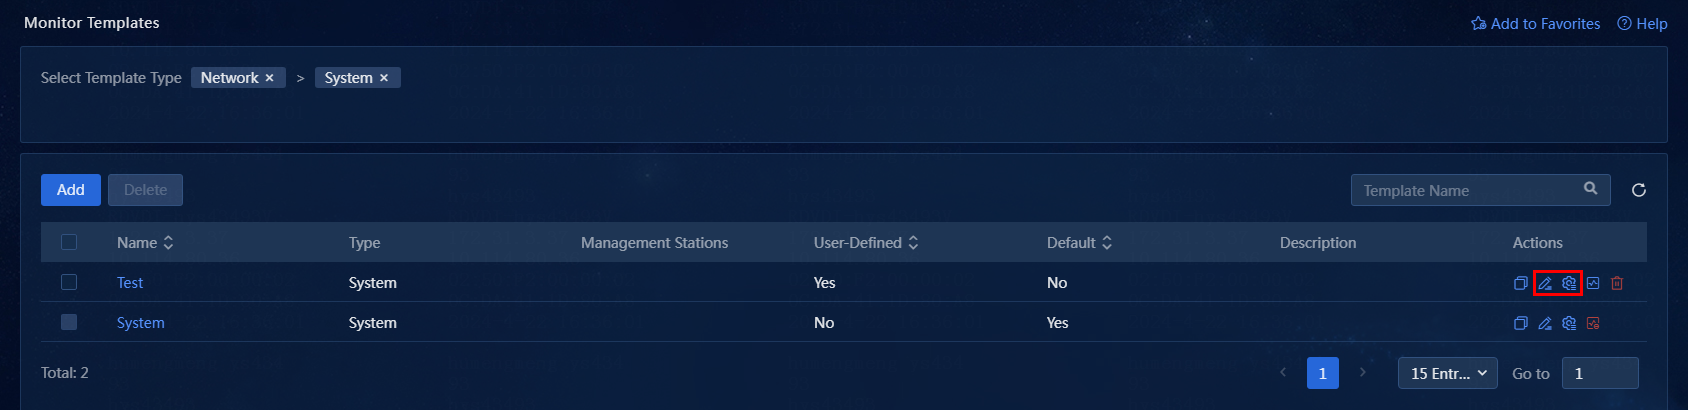
Editing a monitoring template
1. On the monitoring template page, click the ![]() or
or ![]() icon in the Action column for a
monitoring template. The page for editing a monitoring template opens:
icon in the Action column for a
monitoring template. The page for editing a monitoring template opens:
Figure 8 Editing a monitoring template
2. See “Adding a monitoring template.”
3. Click OK. The monitoring template is successfully edited, as shown in Figure 9.
Figure 9 Monitoring template edited successfully

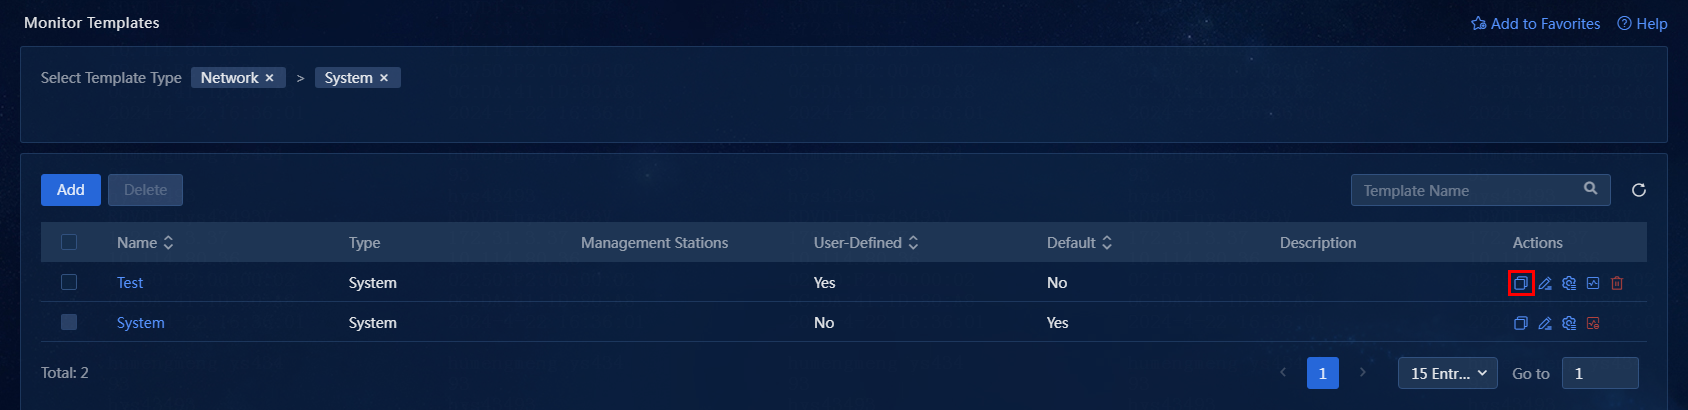
Quickly adding a monitoring template by copying an existing one
Use the copy feature when the monitoring template to be created is mostly similar to an existing one and only requires minor modifications. You can copy an existing monitoring template, modify it as needed, and then save it as a new monitoring template.
1. On the monitoring template page, click ![]() icon in the Action column for a
monitoring template. The page for replicating the monitoring template opens.
icon in the Action column for a
monitoring template. The page for replicating the monitoring template opens.
Figure 10 Copying a monitoring template
2. Edit the monitoring template settings (see “Adding a monitoring template.”)
3. Click OK. The monitoring template is successfully added, as shown in Figure 11.

Configuring device monitoring
Deploying monitoring templates (enabling device monitoring)
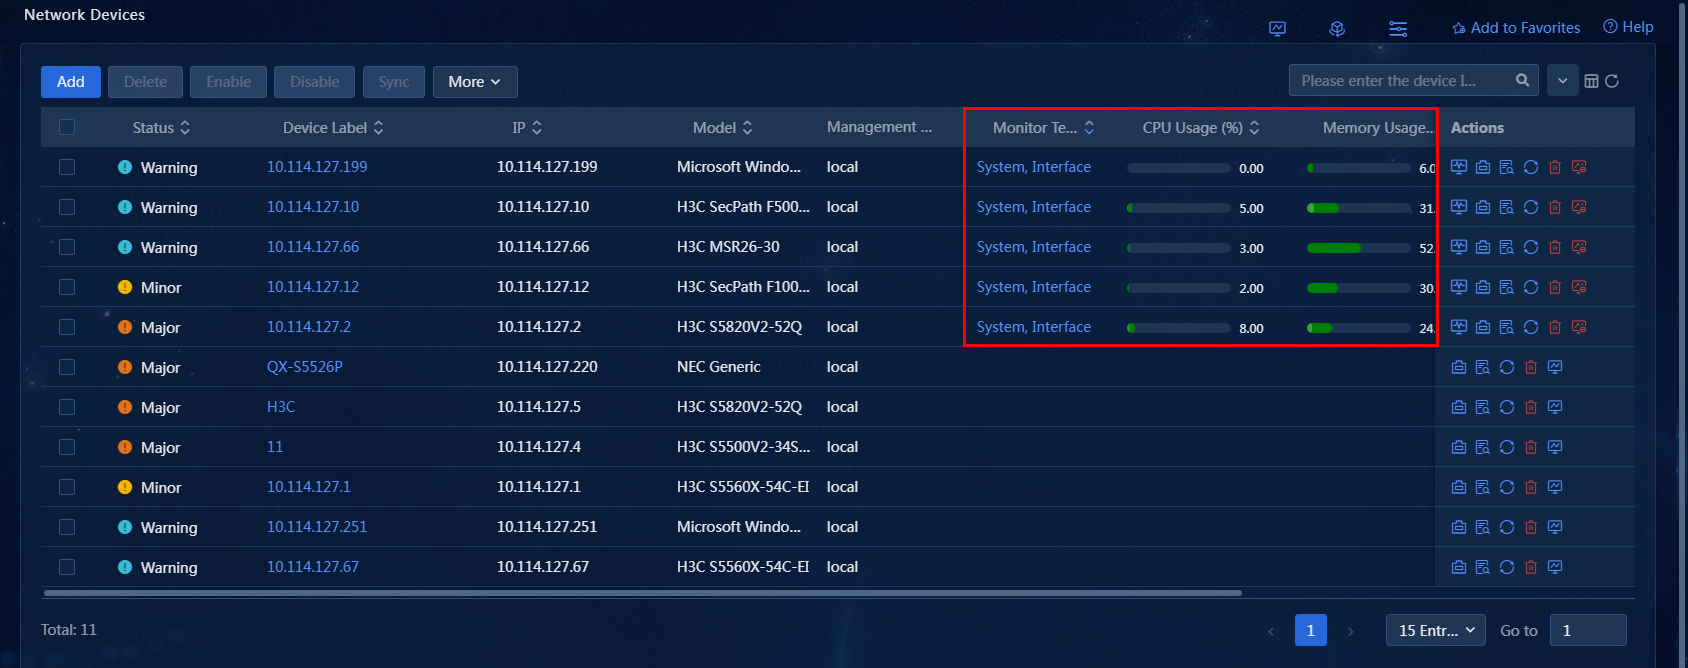
1. Log in to Unified Platform as an administrator.
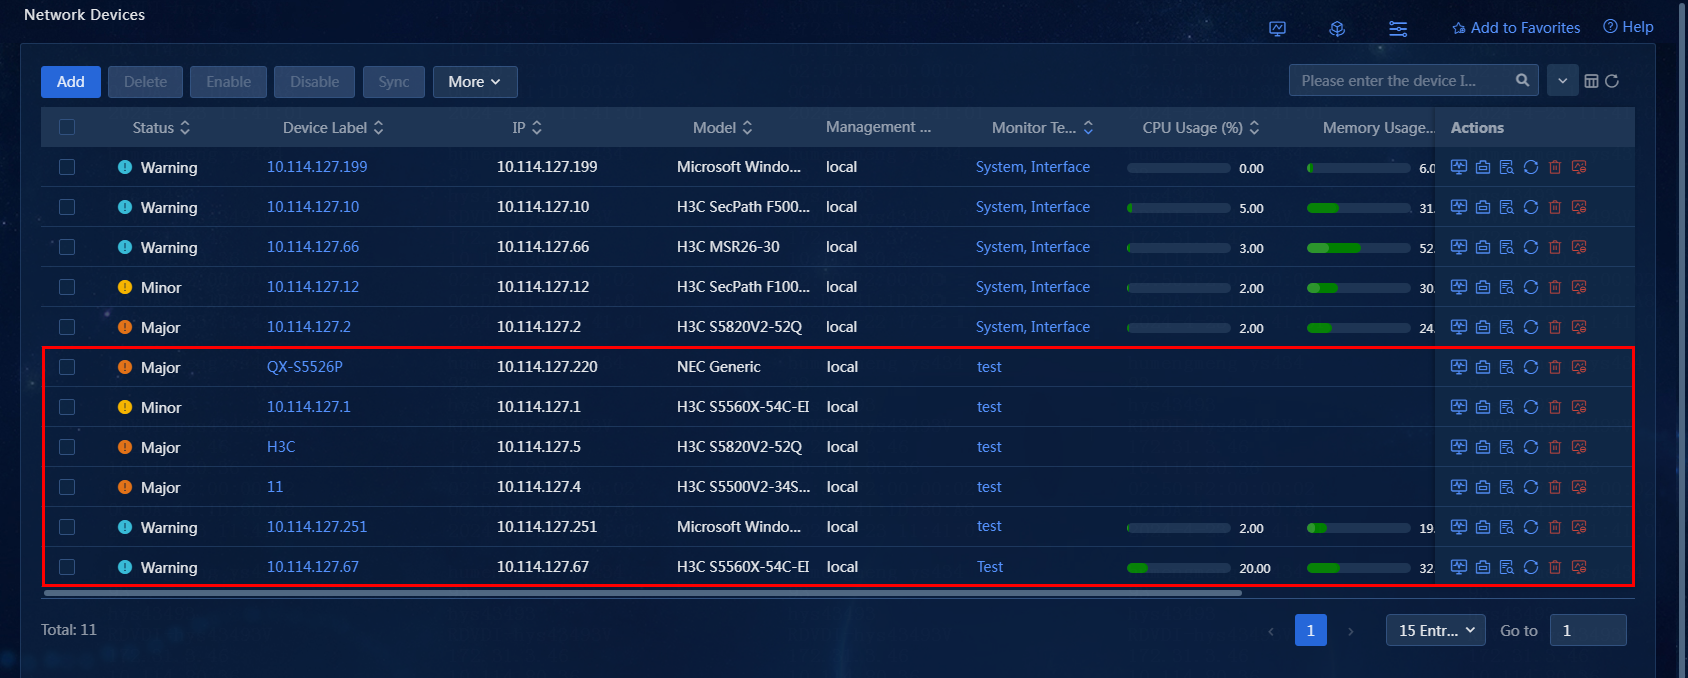
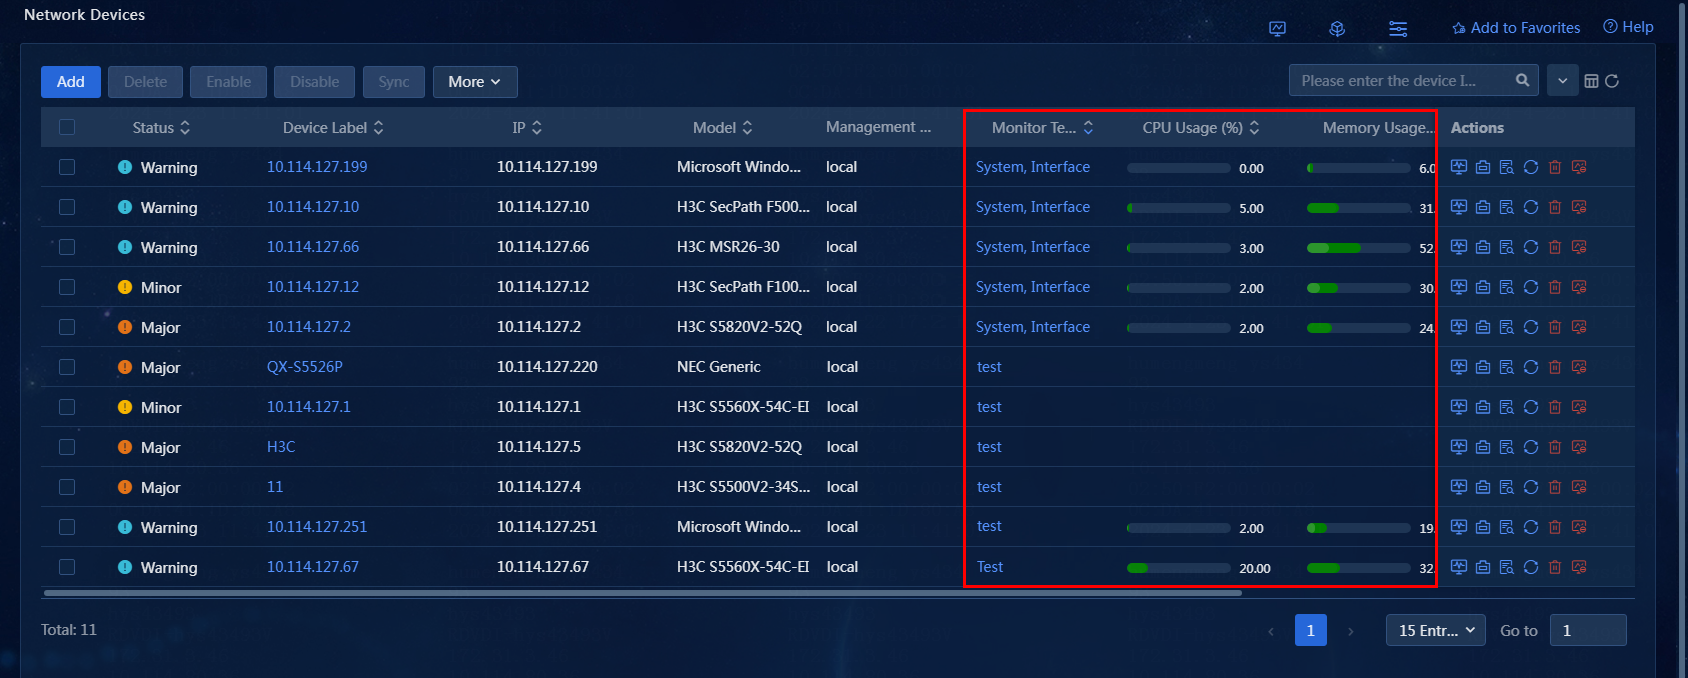
2. Navigate to the Monitor > Monitor List > Network Devices page, as shown in Figure 12. The device list page displays all devices managed in the current system. The red box indicates the monitoring data for the managed devices enabled with monitoring in the system.
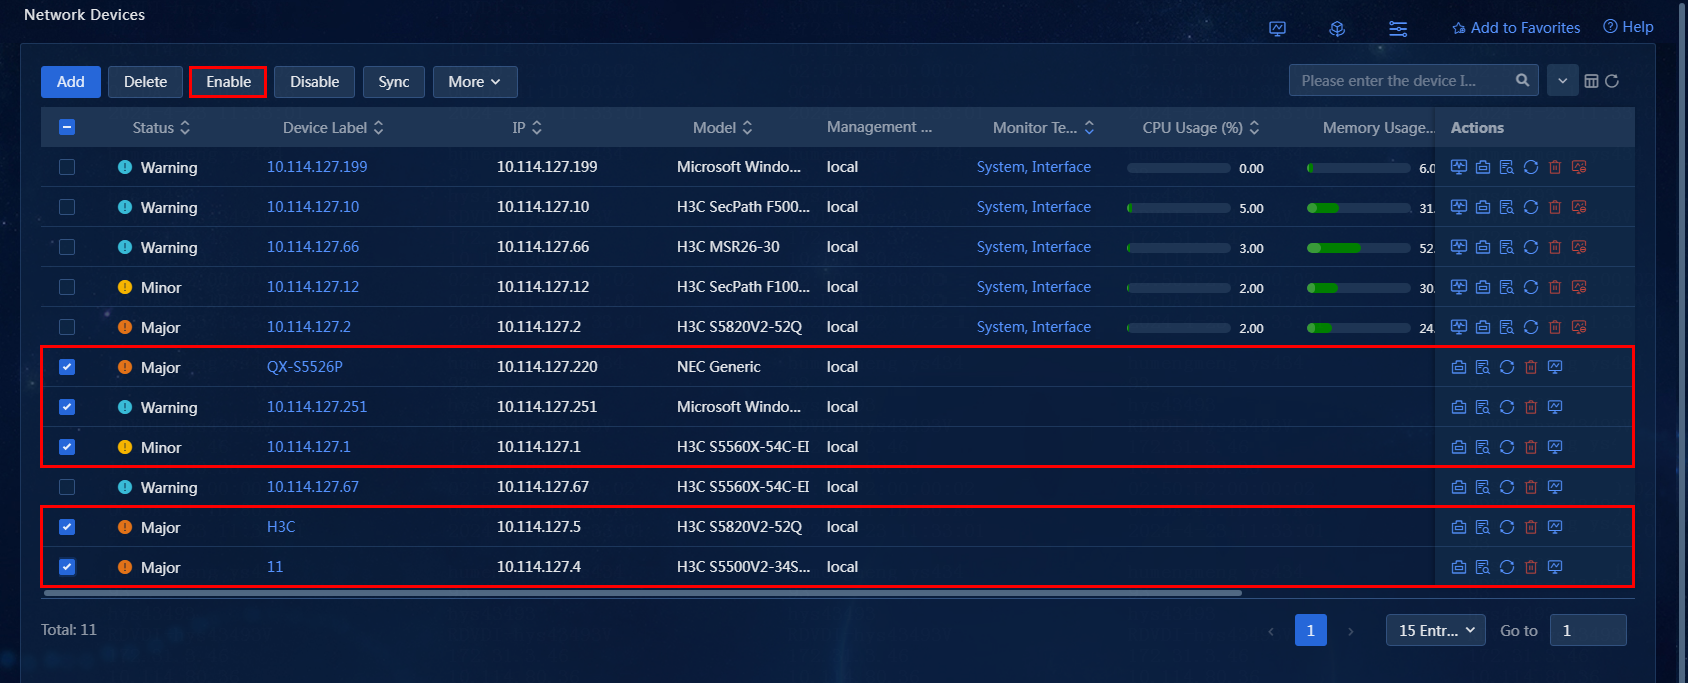
3. To enable monitoring for devices, access the page for enabling device monitoring. You can use the following methods to access the page for enabling device monitoring:
¡ Method 1: As shown in Figure 13, select one or more devices and then click Enable above the device list.
Figure 13 Access the page for enabling device monitoring - Method 1
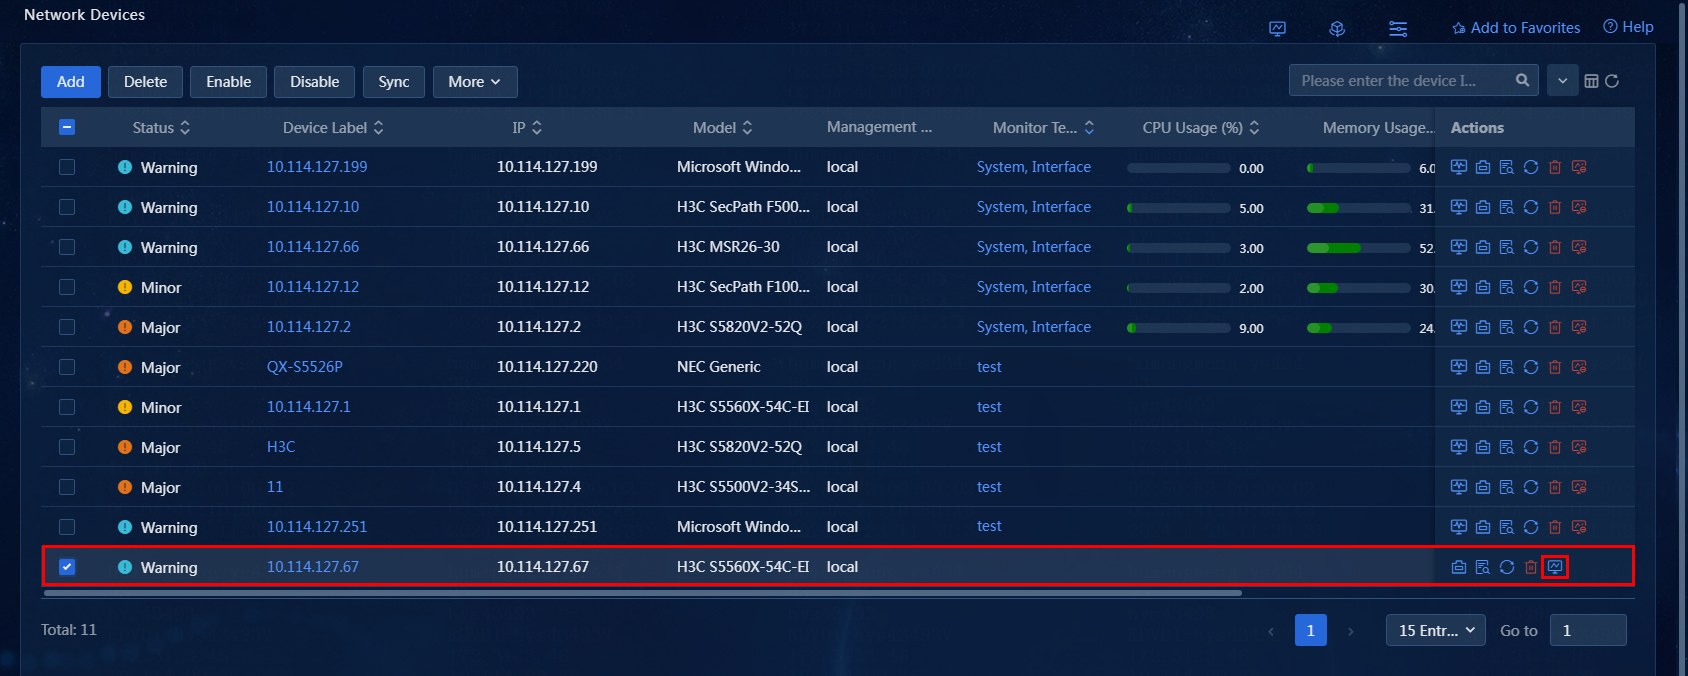
¡ Method
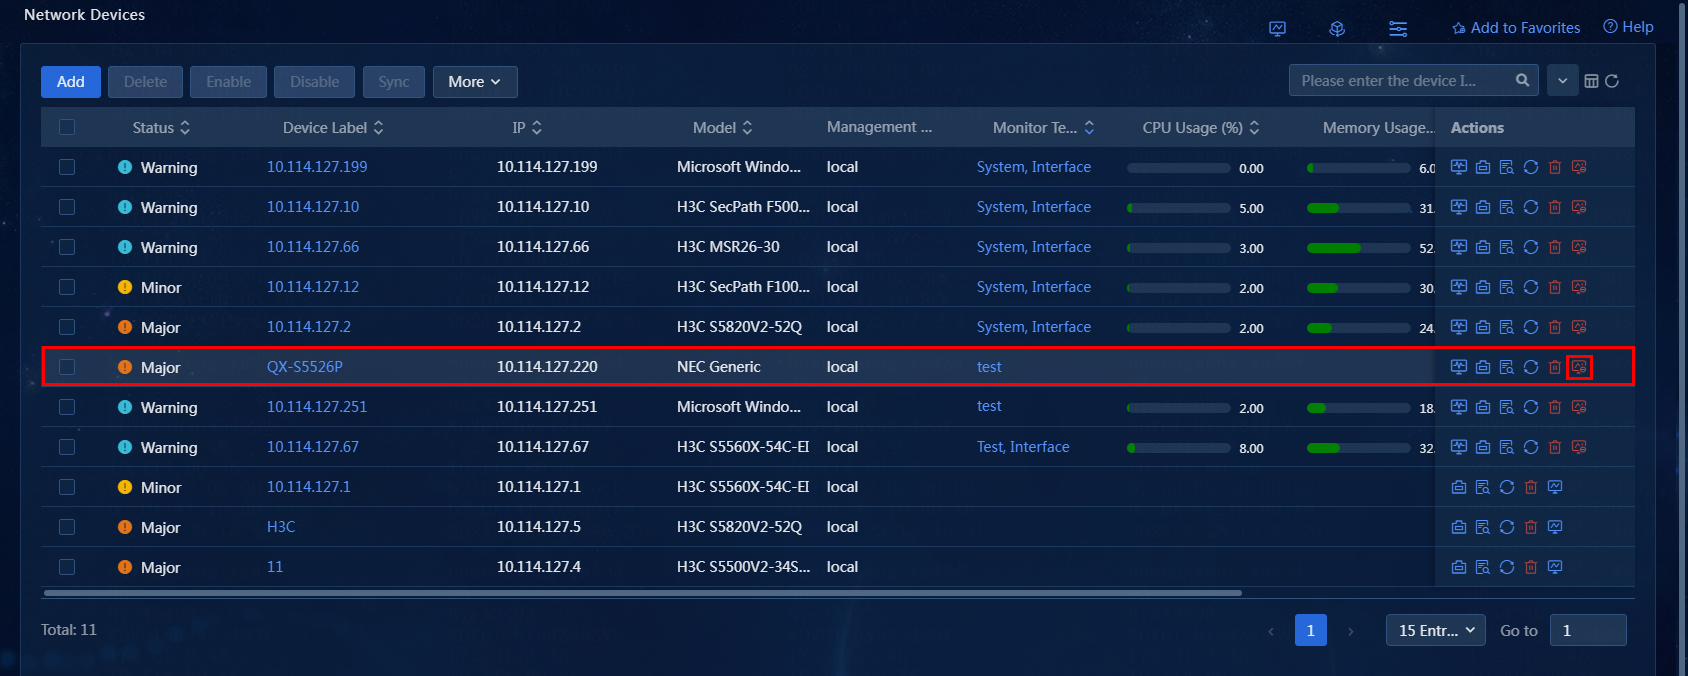
2: As shown in Figure 14,
click the ![]() icon in the Actions column for a
device.
icon in the Actions column for a
device.
Figure 14 Access the page for enabling device monitoring - Method 2
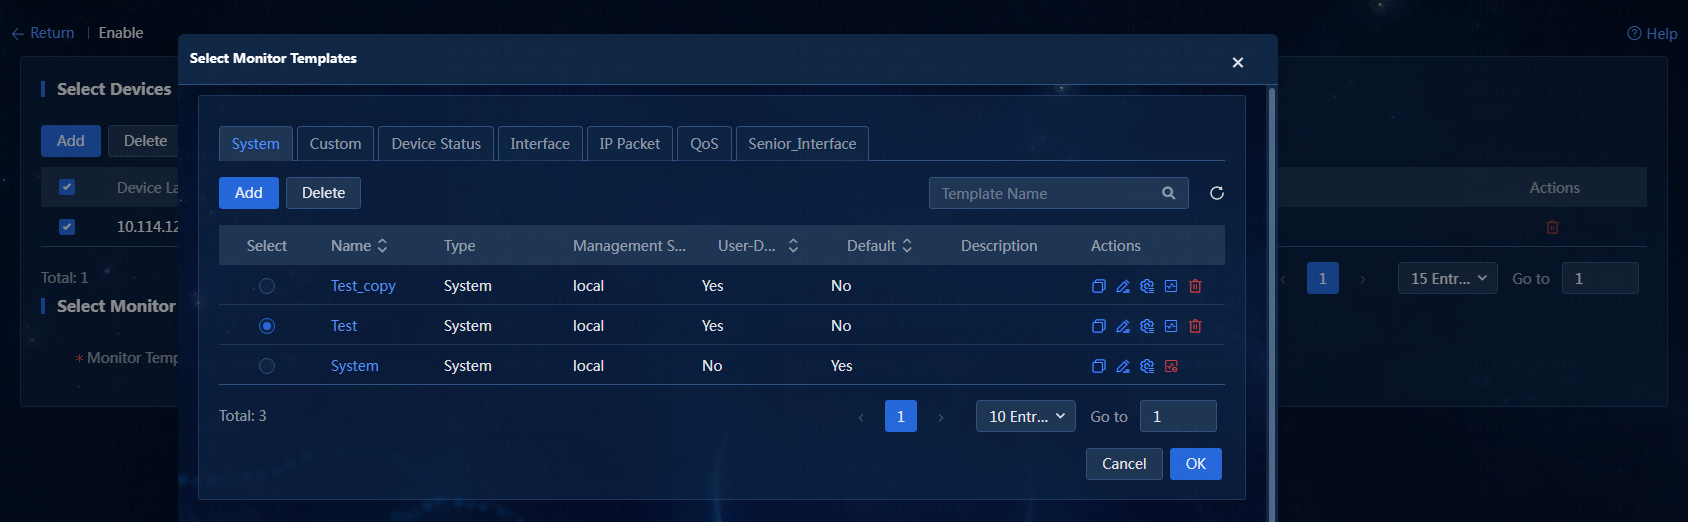
4. On the page for enabling device monitoring, click Select in the Monitor Templates field to open the Select Monitoring Templates page. You can select monitoring templates for the current devices you want to monitor, as shown in Figure 15. You can also click Add on this page to add new monitoring templates. For detailed configuration procedure, see "Adding a monitoring template."
Figure 15 Selecting a monitoring template
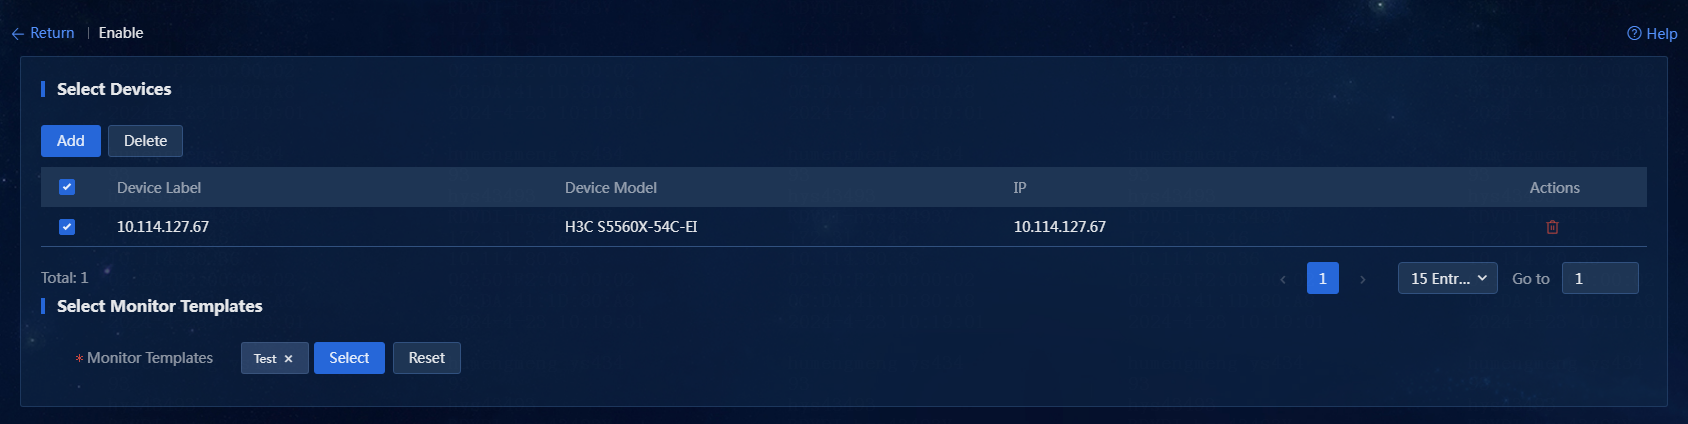
5. After you select a monitoring template, click OK to bind the devices with the monitoring template. If the binding is successful, the monitoring template will be displayed in the Monitor Templates field, as shown in Figure 16. Devices support binding multiple monitoring templates.
Figure 16 Monitoring templates bound to devices

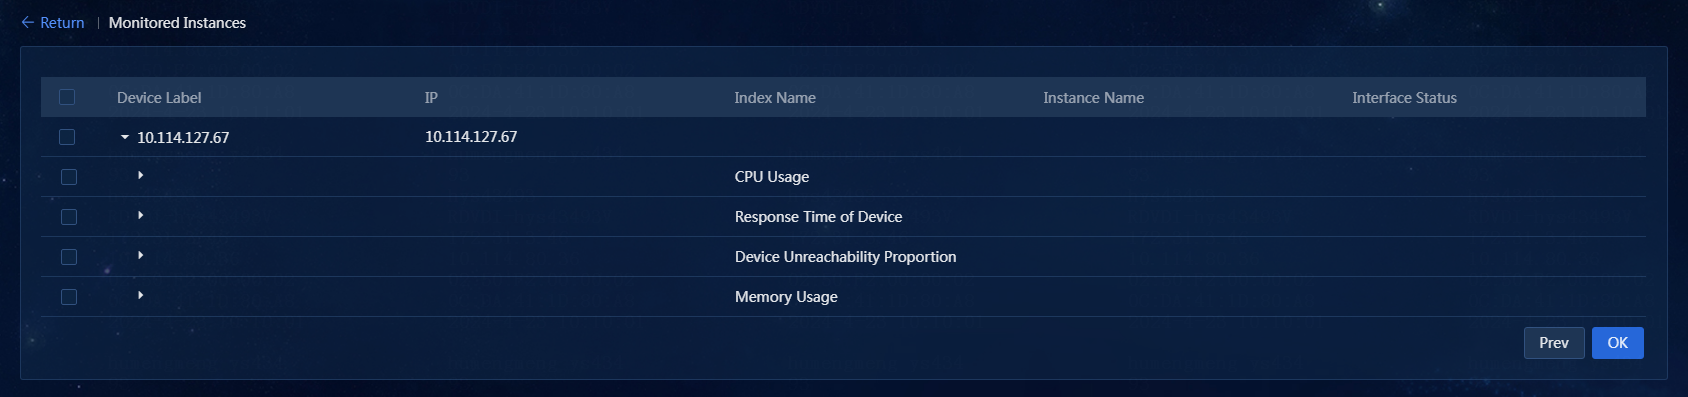
6. After a monitoring template is bound to the devices, click OK to deploy the template and enable monitoring for the devices. To add monitoring instances for a device, select the device and click Next to access the Monitored Instances page, as shown in Figure 17.
7. To add monitoring instances for the current device, select the instances, and then click OK button. The system will deploy the monitoring template to the device and enable monitoring. To change the monitoring template or device, click Prev to return to the page for enabling device monitoring.
Figure 17 Monitor instances page
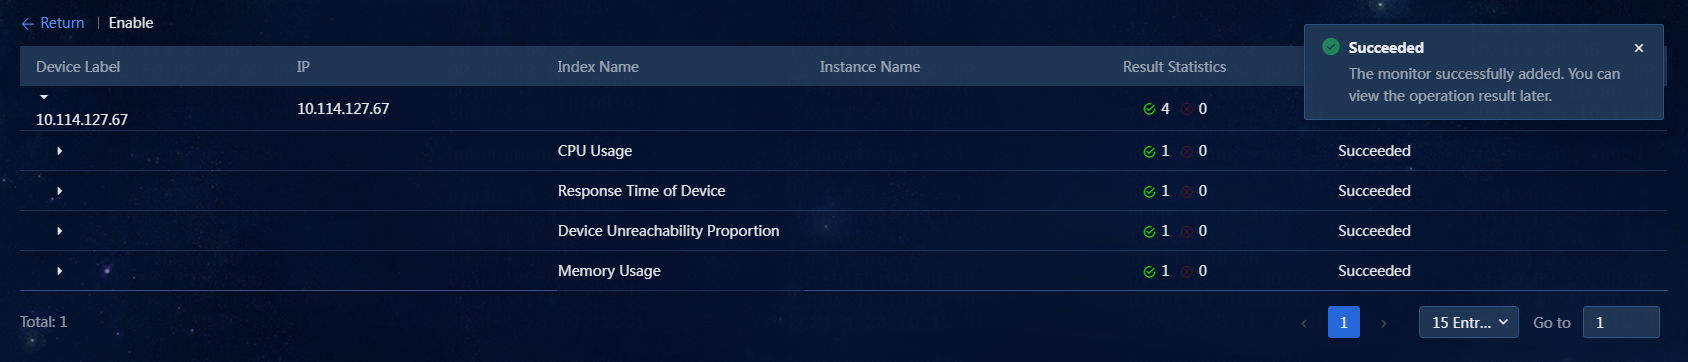
8. If monitoring for the device is successfully enabled, a success message will pop up, and the enabling result will be displayed shortly after, as shown in Figure 18.
Figure 18 Monitoring enabled successfully
9. Click Return to return to the network device list page, where you can see the corresponding device has monitoring enabled with the Test template, as shown in Figure 19.
Figure 19 View monitoring data
Editing the monitoring settings
1. Navigate to the Monitor > Monitor List > Network Devices page, as shown in Figure 20. The network device list displays all devices managed in the current environment. The red box indicates the monitoring data for the managed devices enabled with monitoring in the system.
2. Select the network devices as needed, and then click Enable to access the page for enabling device monitoring.
3. In the Select Monitor Templates area, click Select to select monitor templates for the device. Follow the same steps to edit monitoring template settings as adding a new template. For more information, see “Deploying monitoring templates (enabling device monitoring).” This example adds an interface indexes monitoring template to the existing one, as shown in Figure 22.
Figure 22 Add interface indexes monitoring template
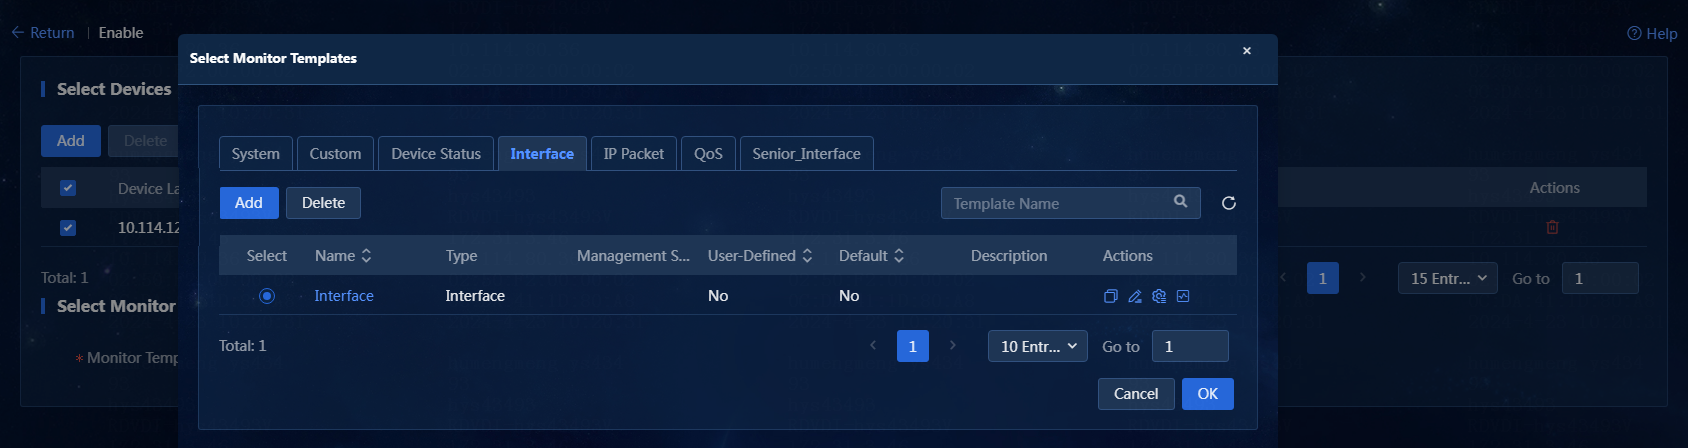
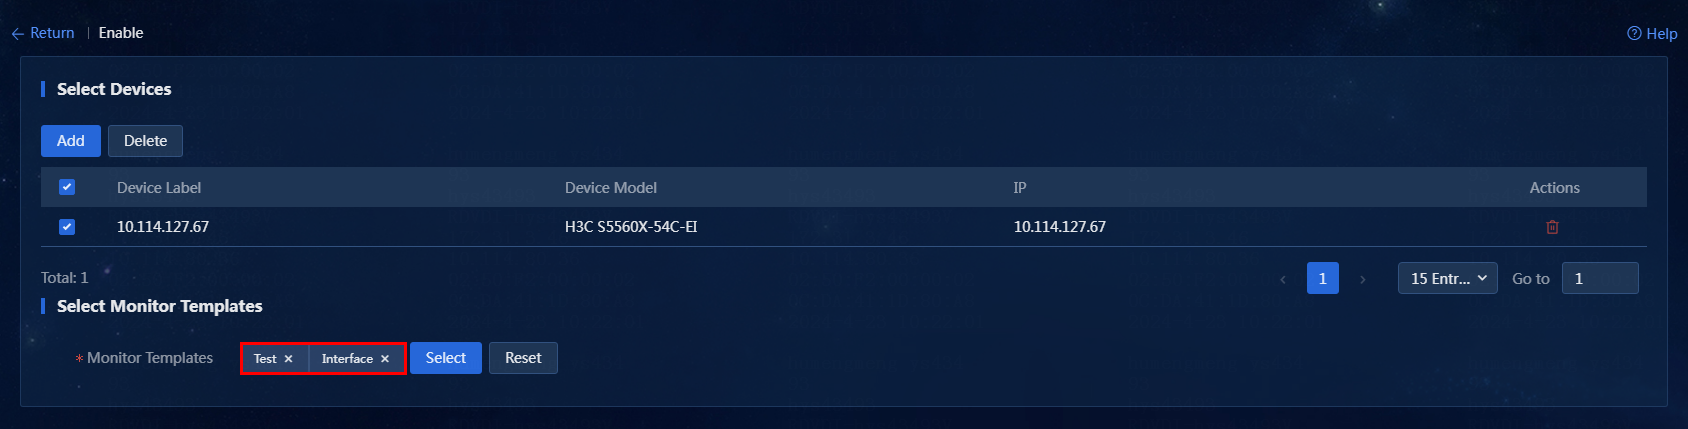
4. As shown in Figure 23, select Interface and click OK to add the interface indexes monitoring template.
Figure 23 Adding an interface indexes monitoring template
5. For subsequent steps, see steps 5 to 9 in “Deploying monitoring templates (enabling device monitoring)."
Suspending or disabling device monitoring
Suspending monitoring for a device
When a device malfunctions and needs repair, or when other situations cause monitoring errors, you can suspend monitoring the device while still collecting its data.
|
|
NOTE: Suspending device monitoring will not generate alarms. |
1. Navigate to the Monitor > Monitor List > Network Devices page. The network device list displays all devices managed in the current environment.
2. Select the devices to for which you want to suspend monitoring.
3. Select More > Add Maintenance Tag above the device list.
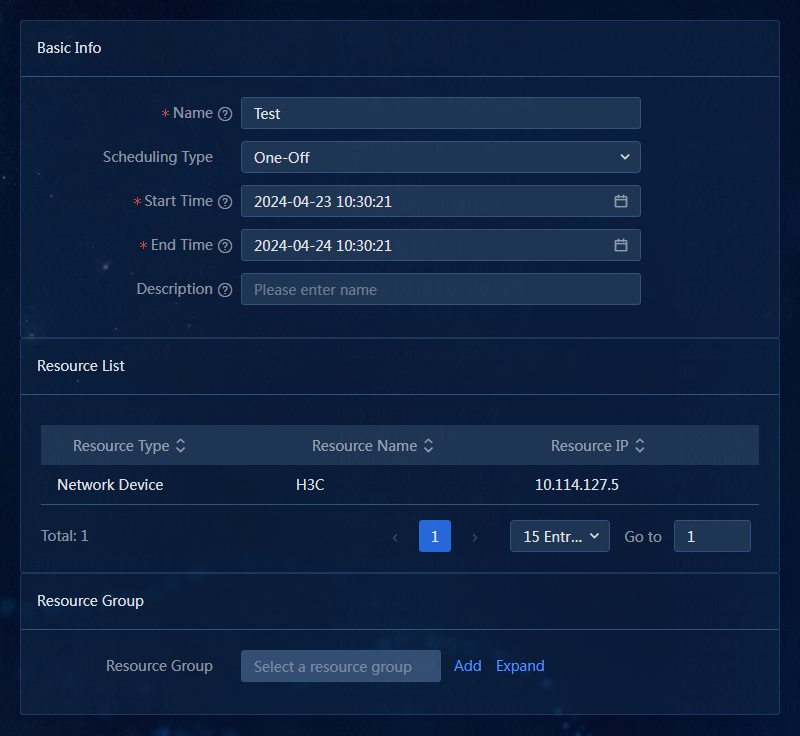
4. On the page that opens, configure the suspension task settings, as shown in Figure 24.
Figure 24 Suspension task settings
5. After completing the settings, click OK to issue the suspension task. After the task is issued successfully, you can view the task on the suspension tasks page, as shown in Figure 25.

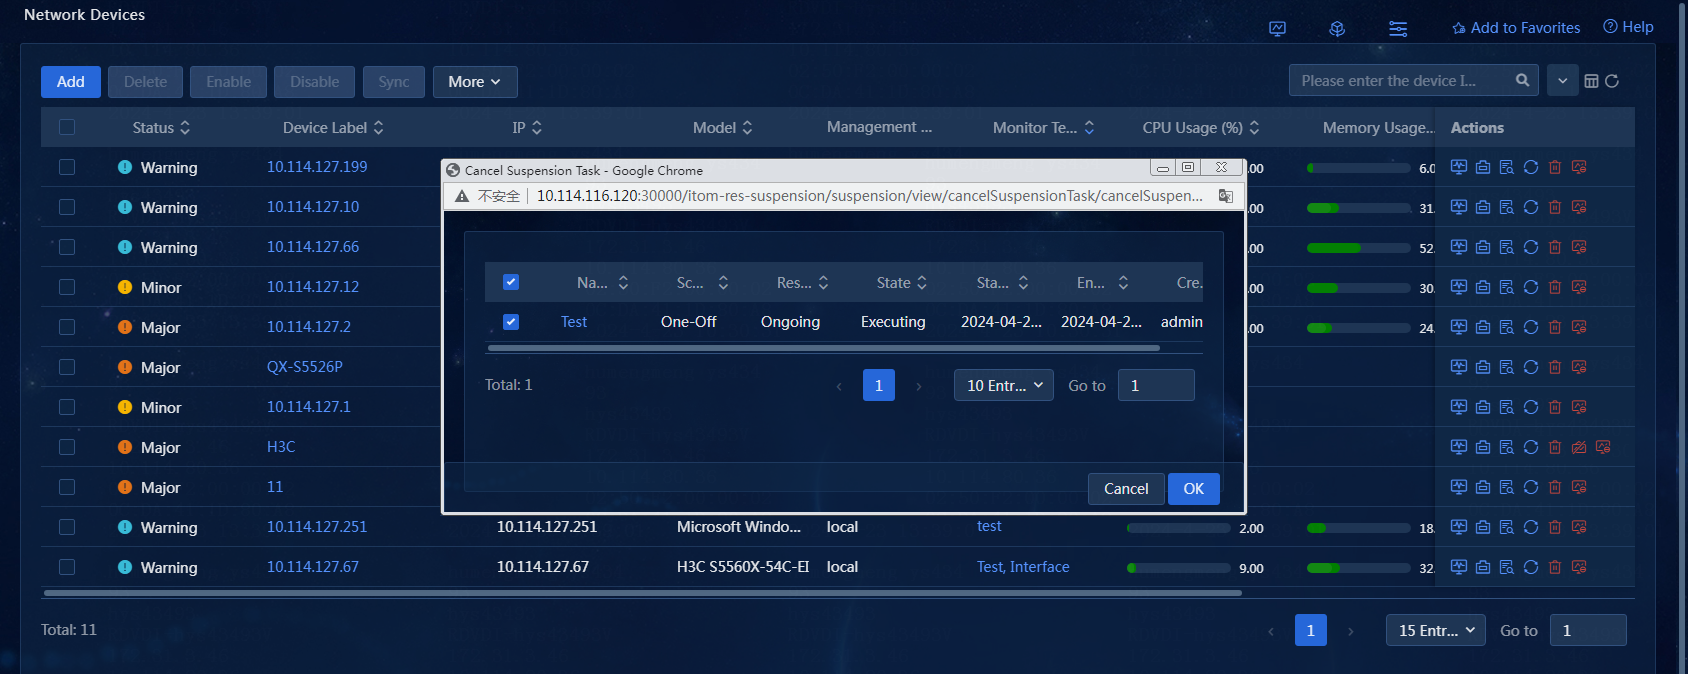
6. To resume monitoring for a device, click the
![]() icon in the Actions column for that
device. In the window that opens, select the suspension tasks you want to
cancel, as shown in Figure 26. Click OK. In
the dialog box that opens, click OK.
icon in the Actions column for that
device. In the window that opens, select the suspension tasks you want to
cancel, as shown in Figure 26. Click OK. In
the dialog box that opens, click OK.
Figure 26 Canceling suspension tasks
Disabling device monitoring
1. Navigate to the Monitor > Monitor List > Network Devices page, as shown in Figure 27. The device list page displays all devices managed in the current system. The red box indicates the monitoring data for the managed devices enabled with monitoring in the system.

2. To disable device monitoring, perform related operations on the current page. Use either of the following methods:
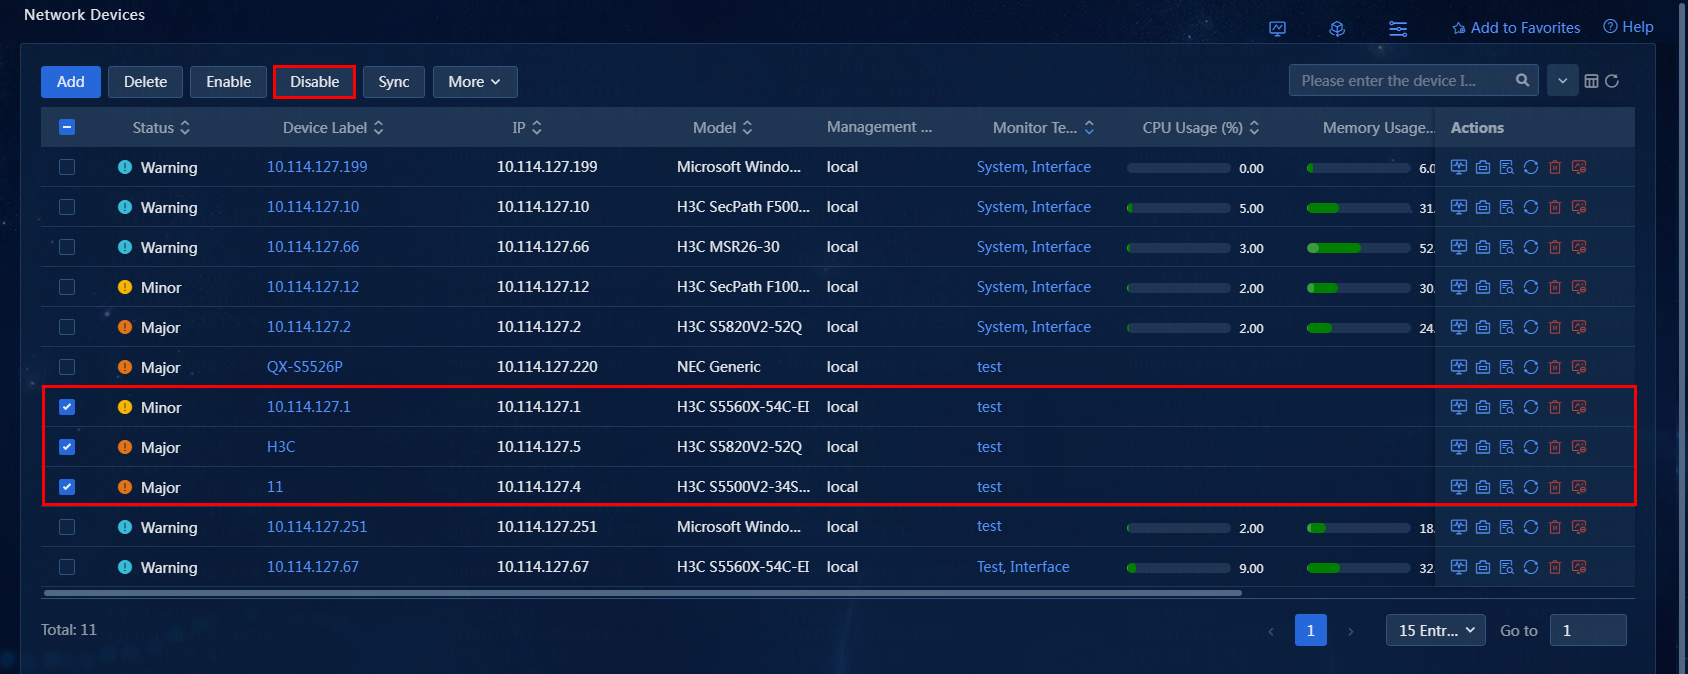
Method 1: As shown in Figure 28, select one or more devices and click the Disable above the device list. In the dialog box, click OK to stop monitoring the selected devices.
Figure 28 Disabling device monitoring - Method 1
Method 2: As shown in Figure 29, to
disable monitoring a single device, click the ![]() icon in the Actions column for that device. Then, in the dialog box that opens, click OK.
icon in the Actions column for that device. Then, in the dialog box that opens, click OK.
Figure 29 Disabling device monitoring - Method 2
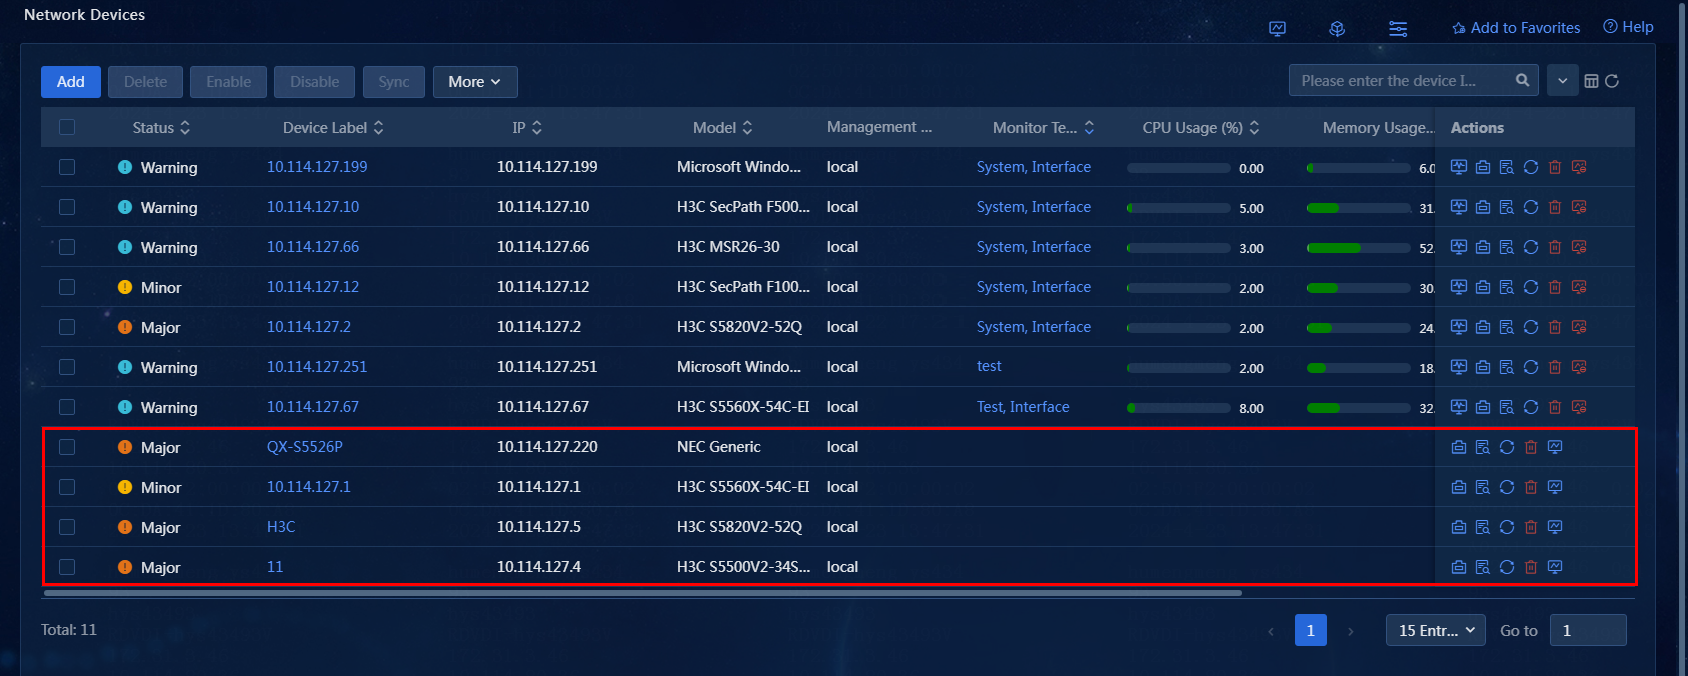
3. The page indicates that monitoring has been successfully disabled, and the related device monitoring data has been cleared, as shown in Figure 30.
Figure 30 Disabling device monitoring
Viewing monitoring data
1. Navigate to the Monitor > Monitor List > Network Devices page. The device list page displays all devices managed in the current system.
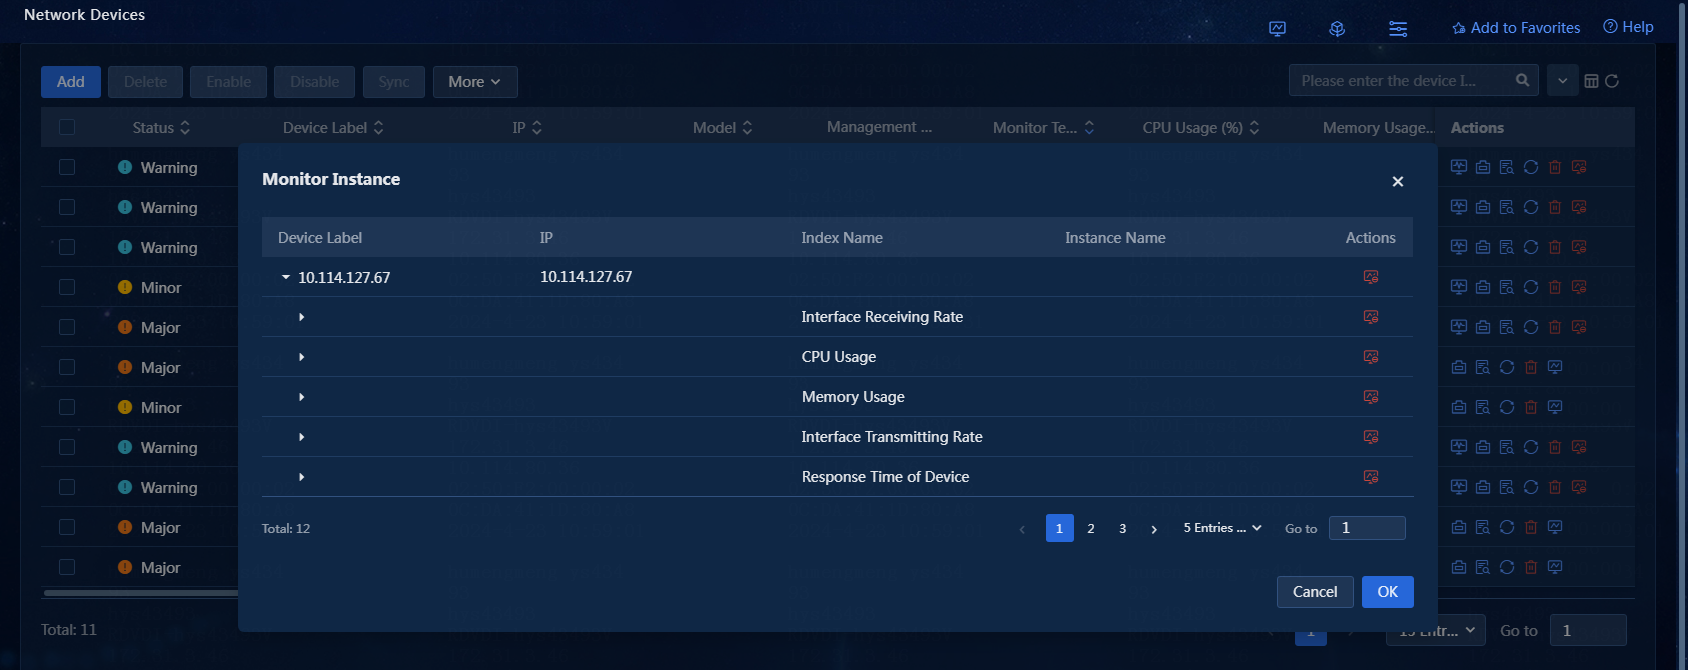
2. Click the ![]() icon in the Actions column for a
device. In the window that opens, view the monitoring instances, as shown in Figure 31.
icon in the Actions column for a
device. In the window that opens, view the monitoring instances, as shown in Figure 31.
|
|
NOTE: To stop monitoring an instance, click the
|
3. Click the ![]() icon in the Actions column for a
device. In the window that opens, view the interface-related data, as shown in Figure 32.
icon in the Actions column for a
device. In the window that opens, view the interface-related data, as shown in Figure 32.

|
|
NOTE: You can view interface-related data only when the device has enabled the monitoring template for interface indexes. |
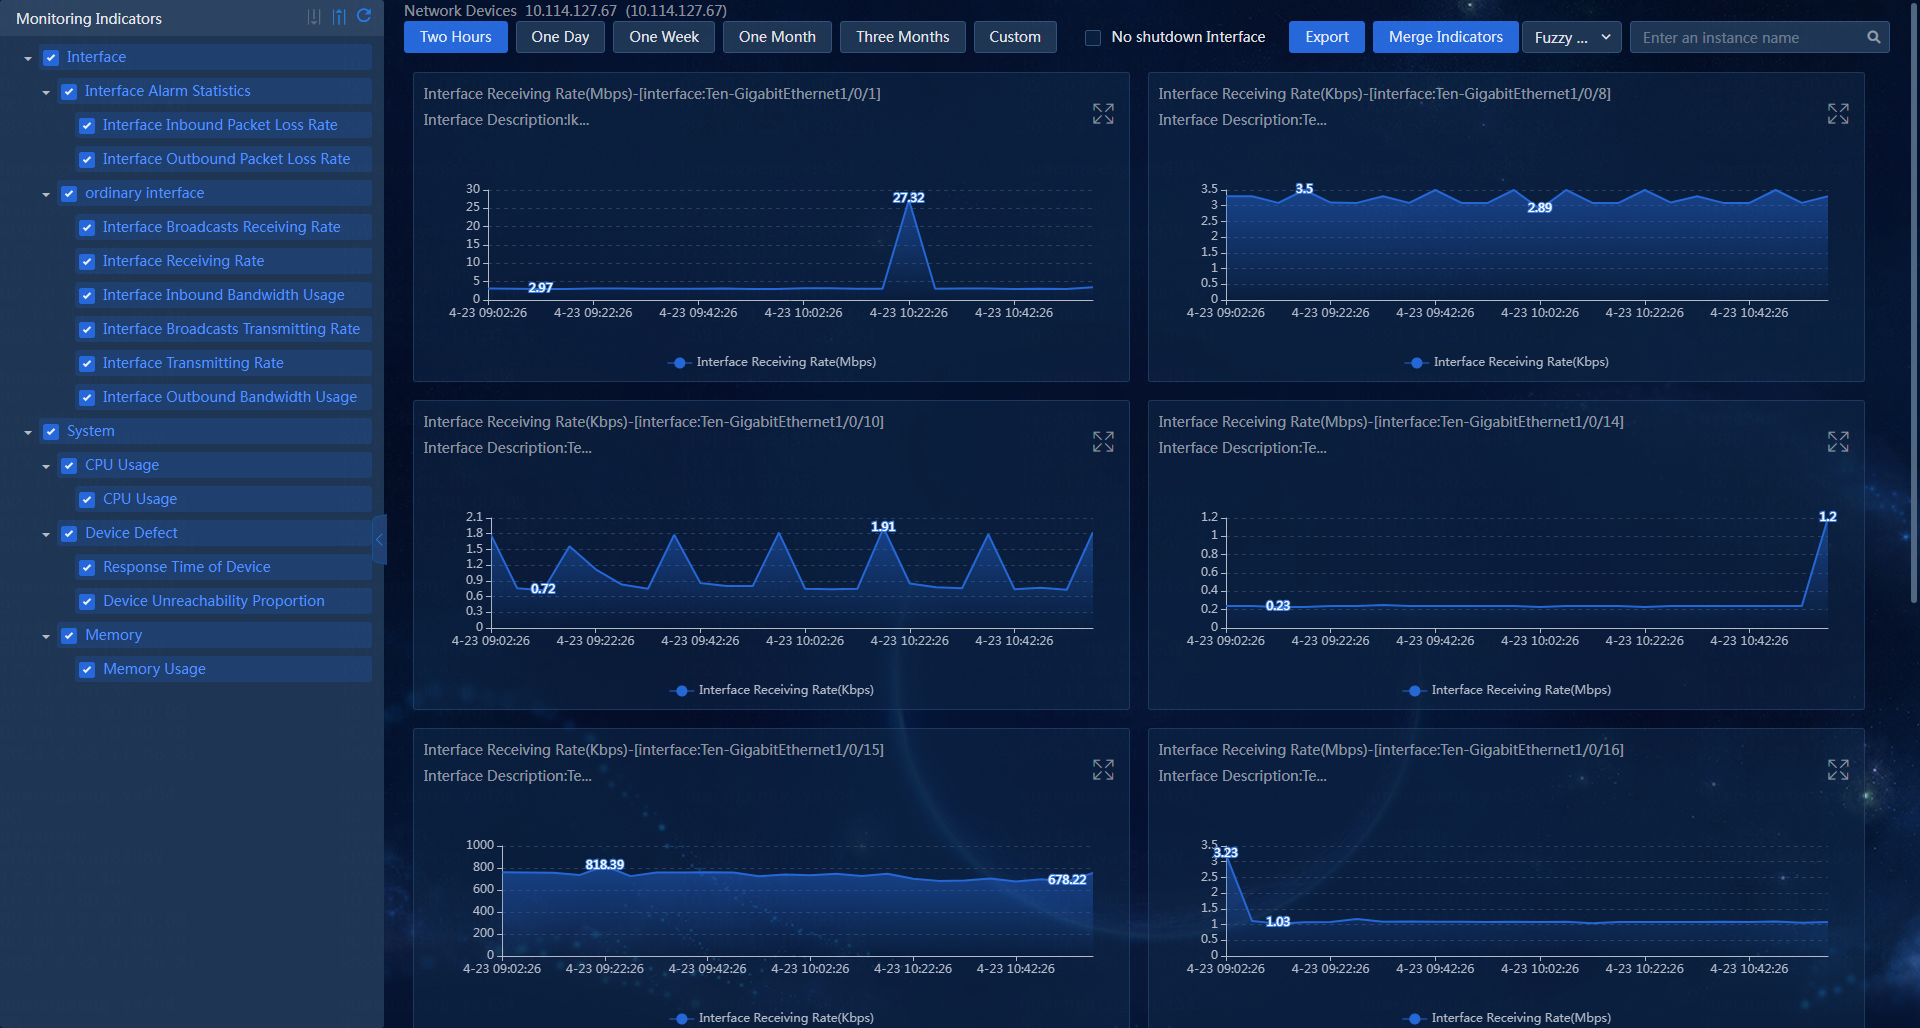
4. Click the ![]() icon in the Actions column for a
device. In the window that opens, view the detailed performance data about the
device, as shown in Figure 33.
icon in the Actions column for a
device. In the window that opens, view the detailed performance data about the
device, as shown in Figure 33.