- Table of Contents
-
- 03-System Management Configuration Guide
- 00-Preface
- 01-Flow log configuration
- 02-Information center configuration
- 03-Fast log output configuration
- 04-Hardware resource management configuration
- 05-Basic device management configuration
- 06-Device hardening configuration
- 07-Process monitoring and maintenance configuration
- Related Documents
-
| Title | Size | Download |
|---|---|---|
| 04-Hardware resource management configuration | 167.80 KB |
Hardware resource management tasks at a glance
Configuring CPU usage tracking
Configuring CPU diagnostic troubleshooting
Displaying CPU usage monitoring information
Setting memory alarm thresholds
Configuring memory diagnostic troubleshooting
Displaying memory usage monitoring information
Configuring resource monitoring
Displaying resource monitoring information
Setting the port status detection timer
Setting the operating mode for an interface module
Setting the operating mode for a non-MPU card
Verifying and diagnosing transceiver modules
Diagnosing transceiver modules
Specifying an ITU channel number for a transceiver module
Enabling loopback testing on a transceiver module lane
Specifying the signal mode and PRBS pattern for a transceiver module lane
Displaying device hardware information
Displaying device hardware electronic label information
Managing hardware resources
This chapter describes routine device hardware resource management tasks, including monitoring CPU and memory usage, displaying power supply and fan operating status, and configuring basic device operating parameters.
Hardware resource management tasks at a glance
All hardware resource management tasks are optional. You can perform any of the tasks in any order.
¡ Configuring CPU usage tracking
¡ Configuring CPU diagnostic troubleshooting
¡ Displaying CPU usage monitoring information
¡ Setting memory alarm thresholds
¡ Configuring memory diagnostic troubleshooting
¡ Displaying memory usage monitoring information
¡ Configuring resource monitoring
¡ Displaying resource monitoring information
· Verifying and diagnosing transceiver modules
¡ Verifying transceiver modules
¡ Diagnosing transceiver modules
· Specifying an ITU channel number for a transceiver module
· Enabling loopback testing on a transceiver module lane
· Specifying the signal mode and PRBS pattern for a transceiver module lane
· Displaying device hardware information
· Displaying device hardware electronic label information
· Displaying backplane electronic label information
· Displaying device hardware alarm information
Monitoring CPU usage
Configuring CPU usage alarm
About this task
The device samples CPU usage at 1-minute intervals, and compares the samples with CPU usage thresholds to identify the CPU usage status and send alarms or notifications accordingly.
The device supports the following CPU usage thresholds:
· Minor threshold—If the CPU usage increases to or above the minor threshold but is less than the severe threshold, the CPU usage enters minor alarm state. The device sends minor alarms periodically until the CPU usage increases above the severe threshold or the minor alarm is removed.
· Severe threshold—If the CPU usage increases above the severe threshold, the CPU usage enters severe alarm state. The device sends severe alarms periodically until the severe alarm is removed.
· Recovery threshold—If the CPU usage decreases below the recovery threshold, the CPU usage enters recovered state. The device sends a recovery notification.
CPU usage alarms and notifications can be sent to NETCONF, SNMP, and the information center to be encapsulated as NETCONF events, SNMP traps and informs, and log messages. For more information about NETCONF and SNMP, see Network Management and Monitoring Configuration Guide. For more information about information center, see "Configuring the information center."
Figure 1 CPU alarms and alarm-removed notifications
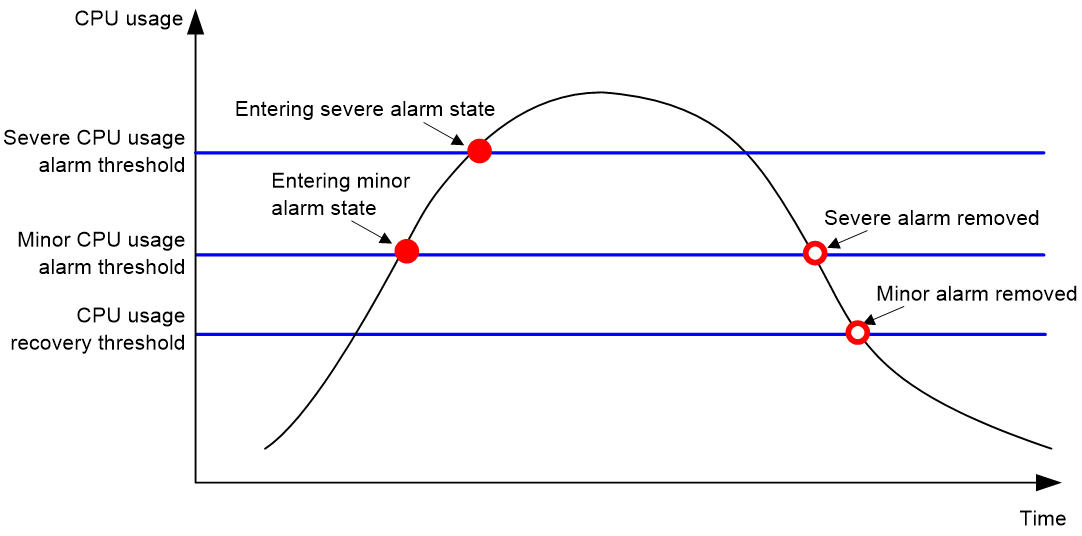
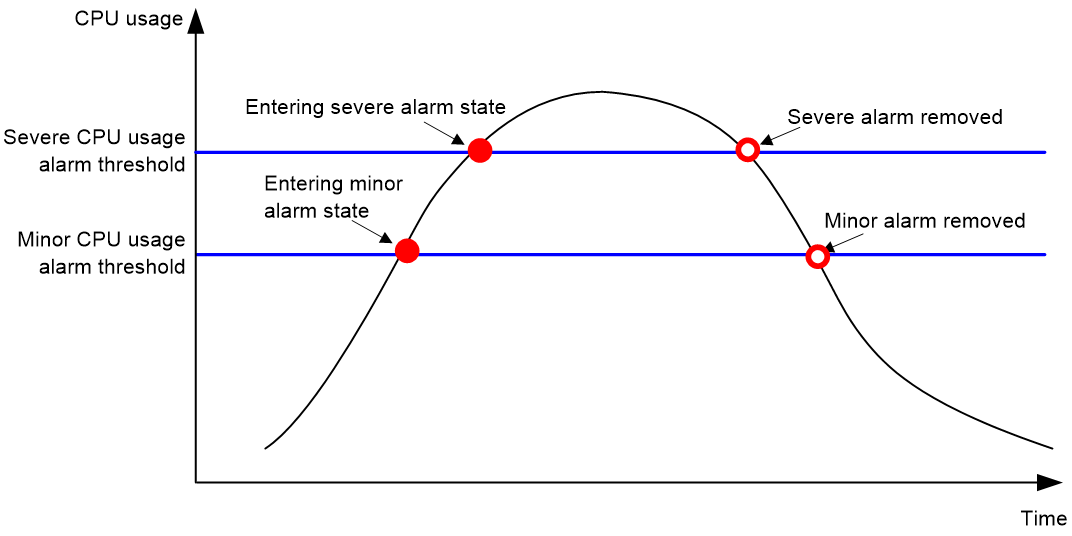
Figure 2 CPU alarms and alarm-removed notifications
Procedure
1. Enter system view.
system-view
2. Set the CPU usage alarm thresholds.
monitor cpu-usage threshold severe-threshold [ minor-threshold minor-threshold recovery-threshold recovery-threshold ] [ slot slot-number [ cpu cpu-number ] ]
By default, the CPU usage alarm threshold is 99%.
|
|
CAUTION: If you set the severe CPU usage alarm threshold to a too low value, the device will reach the threshold easily. Normal service processing will be affected. |
3. Set the CPU usage alarm resending intervals.
monitor resend cpu-usage { minor-interval minor-interval | severe-interval severe-interval } * [ slot slot-number [ cpu cpu-number ] ]
By default, the minor CPU usage alarm resending interval and severe CPU usage alarm resending interval are 300 seconds and 60 seconds, respectively.
Configuring CPU usage tracking
About this task
After you enable CPU usage tracking, the system samples CPU usage at intervals and saves the samples to a buffer. You can use the display cpu-usage history command to view the recent CPU usage.
Procedure
1. Enter system view.
system-view
2. Set the sampling interval for CPU usage tracking.
monitor cpu-usage interval interval [ slot slot-number [ cpu cpu-number ] ]
By default, the sampling interval for CPU usage tracking is 1 minute.
3. Enable CPU usage tracking.
monitor cpu-usage enable [ slot slot-number [ cpu cpu-number ] ]
By default, CPU usage tracking is enabled.
Configuring CPU diagnostic troubleshooting
CPU diagnostic troubleshooting detects whether CPU usage is normal. If CPU usage exceeds alarm thresholds or suddenly increases, this feature helps you to locate CPU usage issues. For more information about CPU diagnostic troubleshooting, see diagnostic troubleshooting in Intelligent O&M Configuration Guide.
Displaying CPU usage monitoring information
Perform display tasks in any view.
· Display CPU usage monitoring settings.
display cpu-usage configuration [ slot slot-number [ cpu cpu-number ] ]
· Display the current CPU usage statistics.
display cpu-usage [ data-plane ] [ summary ] [ slot slot-number ]
· Display the historical CPU usage statistics in a coordinate system.
display cpu-usage history [ job job-id ] [ slot slot-number [ cpu cpu-number ] ]
Monitoring memory usage
Setting memory alarm thresholds
About this task
To ensure correct operation and improve memory efficiency, the system monitors the amount of free memory space in real time. If the amount of free memory space reaches the minor, severe, or critical alarm threshold, the system issues an alarm to affected service modules and processes.
The system can also issue an early warning to warn you of an approaching insufficient-memory condition.
(On devices that do not support low memory.) You can use the display memory command to display memory usage information.
(On devices that support low memory.) The system monitors only the amount of free low-memory space. You can use the display memory command to display memory usage information.
(On devices with slots that support low memory.) For slots that support low memory, the system monitors only the amount of free low-memory space. You can use the display memory command to display memory usage information. If the LowMem field is displayed for a slot, the slot supports low memory.
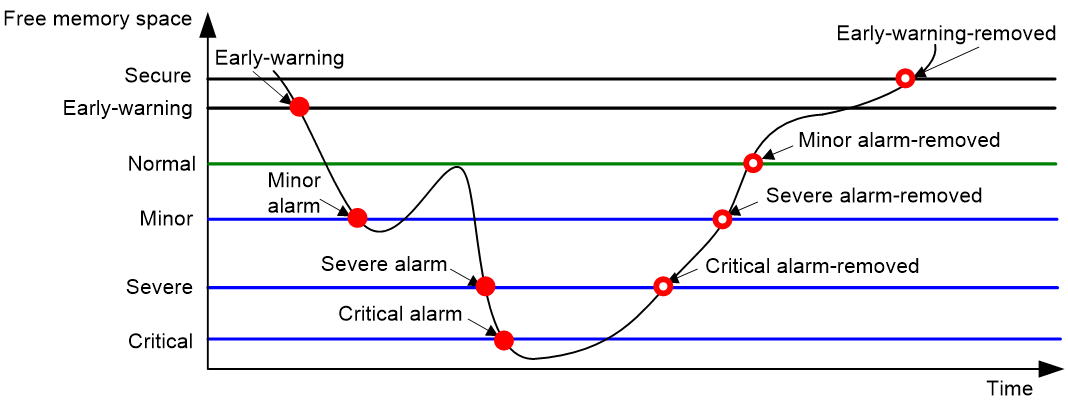
As shown in the following table and figure, the system supports these free-memory thresholds:
· Sufficient-memory threshold.
· Early-warning threshold.
· Normal state threshold.
· Minor alarm threshold.
· Severe alarm threshold.
· Critical alarm threshold.
Table 1 Memory alarm notifications and memory alarm-removed notifications
|
Notification |
Triggering condition |
Remarks |
|
Early-warning notification |
The amount of free memory space decreases to or below the early-warning threshold. |
After generating and sending an early-warning notification, the system does not generate and send any additional early-warning notifications until the early warning is removed. |
|
Minor alarm notification |
The amount of free memory space decreases to or below the minor alarm threshold. |
After generating and sending a minor alarm notification, the system does not generate and send any additional minor alarm notifications until the minor alarm is removed. |
|
Severe alarm notification |
The amount of free memory space decreases to or below the severe alarm threshold. |
After generating and sending a severe alarm notification, the system does not generate and send any additional severe alarm notifications until the severe alarm is removed. |
|
Critical alarm notification |
The amount of free memory space decreases to or below the critical alarm threshold. |
After generating and sending a critical alarm notification, the system does not generate and send any additional critical alarm notifications until the critical alarm is removed. |
|
Critical alarm-removed notification |
The amount of free memory space increases above the severe alarm threshold. |
N/A |
|
Severe alarm-removed notification |
The amount of free memory space increases above the minor alarm threshold. |
N/A |
|
Minor alarm-removed notification |
The amount of free memory space increases above the normal state threshold. |
N/A |
|
Early-warning-removed notification |
The amount of free memory space increases above the sufficient-memory threshold. |
N/A |
Figure 3 Memory alarm notifications and alarm-removed notifications
The sending intervals for memory alarms are as follows:
· If the amount of the free memory space has been over the early-warning alarm threshold for 1 hour, an early-warning alarm notification is sent.
· If the amount of the free memory space has been over the minor alarm threshold for 12 hour, a minor alarm notification is sent.
· If the amount of the free memory space has been over the severe alarm threshold for 3 hour, a severe alarm notification is sent.
· If the amount of the free memory space has been over the critical alarm threshold for 1 hour, a critical alarm notification is sent.
Restrictions and guidelines
If a memory alarm occurs, delete unused configuration items or disable some features to increase the free memory space. Because the memory space is insufficient, some configuration items might not be able to be deleted.
The system will restart a card if one of the following conditions is met:
· After a critical alarm occurs, the remaining free-memory value has been smaller than the critical alarm threshold for 30 seconds.
· The interval between two consecutive critical alarms is shorter than 30 seconds.
· The critical alarm has occurred three times within three minutes.
· After a critical alarm occurs, the system will periodically sample free memory space and predict if the free memory space will be exhausted within 30 seconds. If the prediction result indicates that the free memory space will be exhausted within 30 seconds, the system will restart the card.
Once the free memory space reaches the early warning, minor, severe, or critical alarm threshold, the device will display the current memory usage information when you log in to the device through console or Telnet login, or execute every command.
Procedure
1. Enter system view.
system-view
2. Set the memory usage threshold.
memory-threshold [ slot slot-number [ cpu cpu-number ] ] usage memory-threshold
By default, the memory usage threshold is 100%.
3. Set the free-memory thresholds.
memory-threshold [ slot slot-number [ cpu cpu-number ] ] [ ratio ] minor minor-value severe severe-value critical critical-value normal normal-value [ early-warning early-warning-value secure secure-value ]
The default settings vary by device model.
Configuring memory diagnostic troubleshooting
Memory diagnostic troubleshooting detects whether free memory space is normal. If free memory space exceeds alarm thresholds or suddenly decreases, this feature helps you to locate memory space issues. For more information about memory diagnostic troubleshooting, see diagnostic troubleshooting in Intelligent O&M Configuration Guide.
Displaying memory usage monitoring information
Perform display tasks in any view.
· Display memory usage information.
display memory [ summary ] [ slot slot-number [ cpu cpu-number ] ]
· Display memory alarm thresholds and statistics.
display memory-threshold [ slot slot-number [ cpu cpu-number ] ]
Monitoring disk usage
About this task
This feature enables the device to periodically sample the usage of a disk and compare the usage with the threshold. If the disk usage exceeds the threshold, the device sends an alarm notification.
Disk usage alarm notifications are sent to NETCONF and the information center to be encapsulated as NETCONF event and log messages. For more information about NETCONF and information center, see Network Management and Monitoring Configuration Guide.
Procedure
1. Enter system view.
system-view
2. Set the disk usage sampling interval.
monitor disk-usage interval interval
By default, the disk usage sampling interval is 300 seconds.
3. Set the disk usage threshold.
monitor disk-usage [ slot slot-number ] disk disk-name threshold threshold-value
The default disk usage threshold varies by device model.
Monitoring resource usage
Configuring resource monitoring
About this task
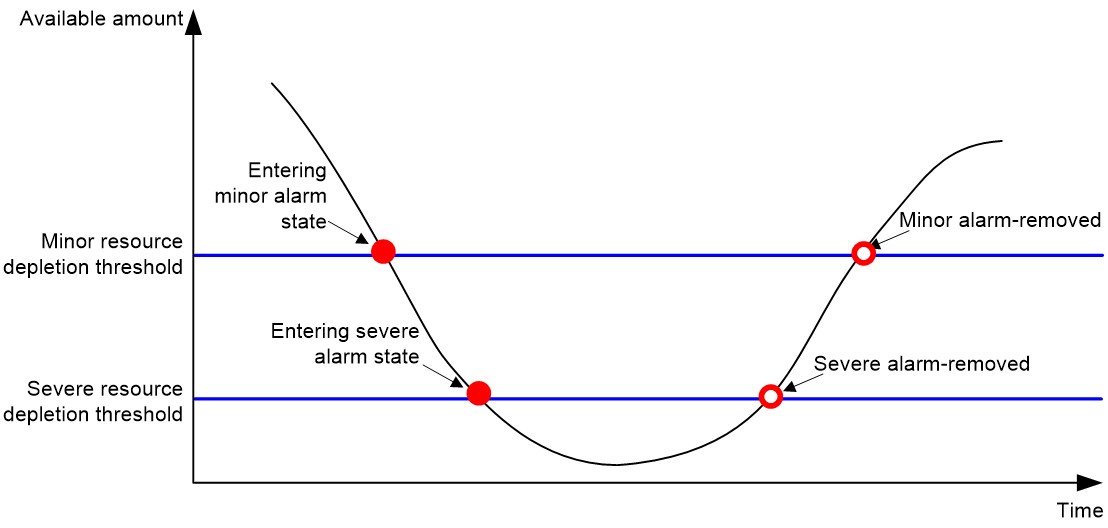
The resource monitoring feature enables the device to monitor the available amounts of types of resources, for example, the space for ARP entries. The device samples the available amounts periodically and compares the samples with resource depletion thresholds to identify the resource depletion status.
The device supports a minor resource depletion threshold and a severe resource depletion threshold for each supported resource type.
· If the available amount is equal to or less than the minor resource depletion threshold but greater than the severe resource depletion threshold, the resource type is in minor alarm state.
· If the available amount is equal to or less than the severe resource depletion threshold, the resource type is in severe alarm state.
· If the available amount increases above the minor resource depletion threshold, the resource type is in recovered state.
When a resource type enters severe alarm state, the device issues a severe alarm. If the resource type stays in severe alarm state, the device resends severe alarms periodically.
When a resource type enters minor alarm state, the device issues a minor alarm. If the resource type stays in minor alarm state or changes from severe alarm state to minor alarm state, the device identifies whether resending of minor resource depletion alarms is enabled. If the feature is disabled, the device does not issue additional minor alarms. If the feature is enabled, the device resends minor alarms periodically.
Resource depletion alarms can be sent to NETCONF, SNMP, and the information center to be encapsulated as NETCONF events, SNMP traps and informs, and log messages. For more information about NETCONF and SNMP, see NETCONF configuration and SNMP configuration, in Network Management and Monitoring Configuration Guide. For more information about information center, see "Configuring the information center."
Figure 4 Resource depletion alarms and alarm-removed notifications
Procedure
1. Enter system view.
system-view
2. Set resource depletion thresholds.
resource-monitor resource resource-name slot slot-number cpu cpu-number { by-percent } minor-threshold minor-threshold severe-threshold severe-threshold
The default settings vary by resource type. Use the display resource-monitor command to display the resource depletion thresholds.
3. Specify destinations for resource depletion alarms.
resource-monitor output { netconf-event | snmp-notification | syslog } *
By default, resource depletion alarms are sent to NETCONF, SNMP, and the information center.
4. Enable resending of minor resource depletion alarms.
resource-monitor minor resend enable
By default, resending of minor resource depletion alarms is enabled.
Displaying resource monitoring information
To display resource monitoring information, execute the following command in any view:
display resource-monitor [ resource resource-name ] [ slot slot-number [ cpu cpu-number ] ]
Setting the port status detection timer
About this task
The device starts a port status detection timer when a port is shut down by a protocol. If the port has been in down state before the timer expires, the device will set the port status to the port's physical status.
Procedure
1. Enter system view.
system-view
2. Set the port status detection timer.
shutdown-interval time
The default is 30 seconds.
Setting the operating mode for an interface module
About this task
Some interface modules can operate in multiple modes to provide different types of interfaces. Use this feature to set the operating mode for an interface module.
Restrictions and guidelines
Whether the setting takes effect immediately depends on the device model. If the new setting does not take effect immediately, you must perform one of the following tasks to activate the setting:
· Restart the device.
· Hot swap the interface module if the interface module supports hot swapping.
Procedure
1. Enter system view.
system-view
2. Set the operating mode for an interface module.
card-mode slot slot-number subslot subslot-number mode-name
The default varies by device model.
The supported operating modes depend on the card model.
Setting the operating mode for a non-MPU card
About this task
This feature supports setting an operating mode for the interface module in a slot. Some interface modules can operate in multiple modes to provide different types of interfaces. Use this feature to set the operating mode for an interface module.
Restrictions and guidelines
Whether the setting takes effect immediately depends on the device model. If the new setting does not take effect immediately, you must perform one of the following tasks to activate the setting:
· Restart the device.
· Hot swap the interface module if the interface module supports hot swapping.
Procdure
1. Enter system view.
system-view
2. Set the operating mode for a non-MPU card.
line-card-mode chassis chassis-number slot slot-number mode-name
The default settings vary by device model.
Verifying and diagnosing transceiver modules
Verifying transceiver modules
About this task
You can use one of the following methods to verify the genuineness of a transceiver module:
· Display the key parameters of a transceiver module, including its transceiver type, connector type, central wavelength of the transmit laser, transfer distance, and vendor name.
· Display its electronic label. The electronic label is a profile of the transceiver module and contains the permanent configuration, including the serial number, manufacturing date, and vendor name. The data was written to the transceiver module or the device's storage component during debugging or testing of the transceiver module or device.
The device regularly checks transceiver modules for their vendor names. If a transceiver module does not have a vendor name or the vendor name is not H3C, the device repeatedly outputs traps and log messages. For information about logging rules, see "Configuring the information center."
Procedure
To verify transceiver modules, execute the following commands in any view:
· Display the key parameters of transceiver modules.
display transceiver interface [ interface-type interface-number ]
· Display the electrical label information of transceiver modules.
display transceiver manuinfo interface [ interface-type interface-number ]
Diagnosing transceiver modules
About this task
The device provides the alarm and digital diagnosis functions for transceiver modules. When a transceiver module fails or is not operating correctly, you can perform the following tasks:
· Check the alarms that exist on the transceiver module to identify the fault source.
· Examine the key parameters monitored by the digital diagnosis function, including the temperature, voltage, laser bias current, TX power, and RX power.
Procedure
To diagnose transceiver modules, execute the following commands in any view:
· Display transceiver alarms.
display transceiver alarm interface [ interface-type interface-number ]
· Display the current values of the digital diagnosis parameters on transceiver modules.
display transceiver diagnosis interface [ interface-type interface-number ]
· Display key optical parameters for transceiver modules.
display transceiver optics interface [ interface-type interface-number ]
Only the CFP2-200G-DCO-Tunable and QSFPDD-400G-ZR transceiver modules support this command.
· Display the versatile diagnostics monitoring (VDM) information of a transceiver module.
display transceiver vdm interface interface-type interface-number vdm-id vdm-id
This command is available only for 200G and 400G transceiver modules that support CMIS 4.0.
Specifying an ITU channel number for a transceiver module
About this task
ITU numbers and identifies fiber signals by wavelength and frequency. A transceiver module sends signals of a specific wavelength and frequency based on the specified ITU channel number.
This feature is required in dense wavelength division multiplexing scenarios.
Restrictions and guidelines
This feature is supported only on the HPE X130 10G SFP+ LC LH80 Tunable Transceiver (JL250A) transceiver module.
This feature is supported only on the SFP-XG-LH80-Tunable transceiver module.
The ITU channel number is saved in a register on the transceiver module. It is not saved to the configuration file.
Procedure
1. Enter system view.
system-view
2. Enter Ethernet interface view.
interface interface-type interface-number
3. Specify an ITU channel number.
itu-channel channel-number
By default, the ITU channel number is 1.
Displaying ITU channel information
To display ITU channel information for transceiver modules, execute the following command in any view:
display transceiver itu-channel interface [ interface-type interface-number [ supported-channel ] ]
Enabling loopback testing on a transceiver module lane
About this task
This task allows you to enable loopback testing on a transceiver module lane and specify the loopback testing mode.
Restrictions and guidelines
This task is available only for 200G and 400G transceiver modules that support CMIS 4.0.
This task tests whether messages can be forwarded correctly between the designated transmitter and receiver and helps identify the point of failure when the transceiver module fails to forward messages.
This task settings will be saved in a register of the transceiver module. If the transceiver module has a power loss, the task settings will be cleared. You must reconfigure the task after a power recovery.
Procedure
1. Enter system view.
system-view
2. Enter interface view.
interface interface-type interface-number
3. Enable loopback testing on a transceiver module lane and specify a loopback testing mode.
transceiver lane [ lane-number ] loopback loopback-mode
By default, loopback testing is disabled for transceiver module lanes.
Specifying the signal mode and PRBS pattern for a transceiver module lane
Restrictions and guidelines
This task is available only for 200G and 400G transceiver modules that support CMIS 4.0.
This task settings will be saved in a register of the transceiver module. If the transceiver module has a power loss, the task settings will be cleared. You must reconfigure the task after a power recovery.
Procedure
1. Enter system view.
system-view
2. Enter interface view.
interface interface-type interface-number
3. Specify the signal mode and PRBS pattern for a transceiver module lane.
transceiver lane [ lane-number ] pattern [ host-checker | host-generator media-checker | media-generator ] prbs-pattern
The default settings vary by device model.
Displaying device hardware information
To display device hardware information, execute the following command in any view:
display device [ harddisk | usb ] [ slot slot-number [ subslot subslot-number ] | verbose ]
Displaying device hardware electronic label information
To display hardware electronic label information for the device, execute the following command in any view:
display device manuinfo [ slot slot-number [ subslot subslot-number ] ]
Displaying backplane electronic label information
To display electronic label information for the backplane, execute the following command in any view:
display device manuinfo chassis-only
Displaying device hardware alarm information
To display device hardware alarm information, execute the following command in any view:
display alarm [ slot slot-number ]
