- Table of Contents
- Related Documents
-
| Title | Size | Download |
|---|---|---|
| 01-Text | 1.14 MB |
UBA breadcrumb navigation menu
Managing UBA data source devices
Modifying and deploying UBA server configuration
Viewing user behavior audit list
Viewing database usage statistics
Viewing database space usage trend statistics
Modifying the data export configuration
Auditing the exported log files
Viewing the filter strategy list
Viewing filter strategy details
Viewing the anomaly detection template list
Viewing details about an anomaly template that uses common parameters
Viewing details about an anomaly template that uses type-specific parameters
Modifying an anomaly template that uses common parameters
Modifying an anomaly template that uses type-specific parameters
Viewing general audit task details
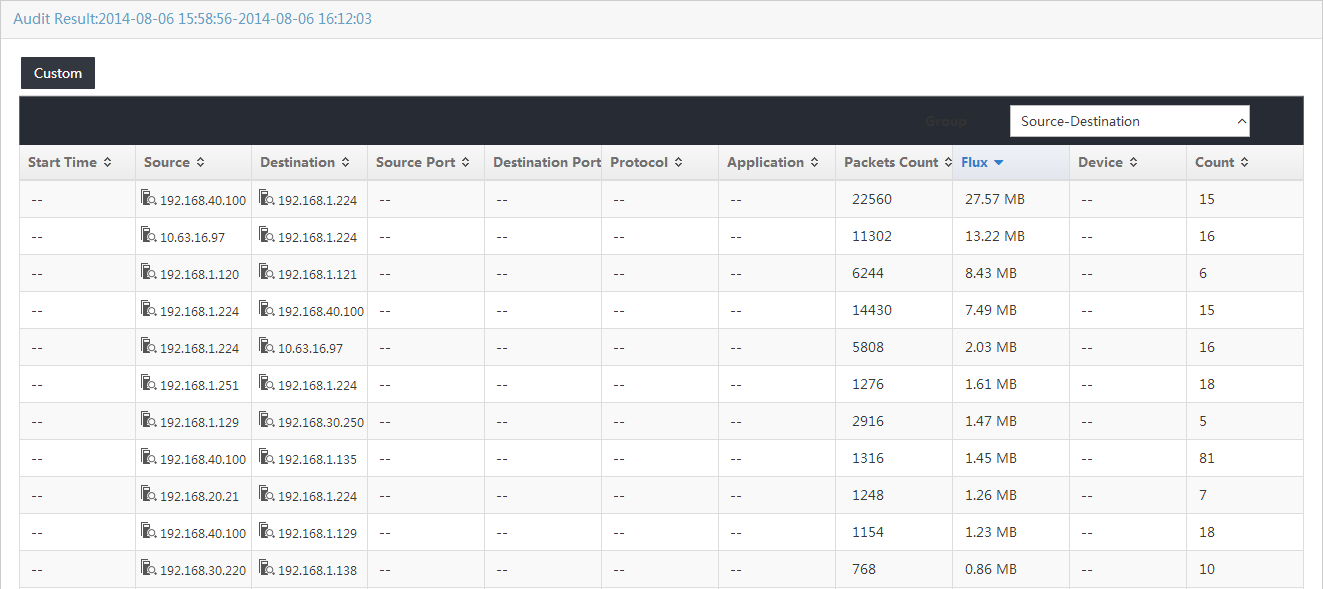
Viewing audit results for a general audit task
Querying audit results for a general audit task
Viewing the audit result list for a general audit task
Viewing audit results for a general audit task by group
Modifying a general audit task
Viewing NAT audit task details
Viewing the audit results for a NAT audit task
Querying audit results for a NAT audit task
Viewing the audit result list for a NAT audit task
Viewing audit results for a NAT audit task by group
Viewing Web visiting audit task details
Adding a Web visiting audit task
Viewing audit results for a Web visiting audit task
Querying audit results for a Web visiting audit task
Viewing the audit result list for a Web visiting audit task
Viewing audit results for a Web visiting audit task by group
Displaying the Title column in different encoding modes
Displaying the URI column in different grades
Modifying a Web visiting audit task
Deleting Web visiting audit tasks
Viewing FTP audit task details
Viewing the audit results for an FTP audit task
Querying audit results for an FTP audit task
Viewing the audit result list for an FTP audit task
Viewing audit results for an FTP audit task by group
Viewing mail audit task details
Viewing audit results for a mail audit task
Querying audit results for a mail audit task
Viewing the audit result list for a mail audit task
Viewing audit results for a mail audit task by group
Viewing Telnet audit task details
Viewing audit results for a Telnet audit task
Querying audit results for a Telnet audit task
Viewing the audit result list for a Telnet audit task
Viewing audit results for a Telnet audit task by group
User behavior audit and audit analysis
Managing behavior audit reports
Adding a behavior audit report
Viewing a behavior audit report
Modifying a behavior audit report
Deleting a behavior audit report
Configuring NetStream on the S7503E switch
Adding the NetStream device to UBA
Modifying the UBA server configuration
Overview
User Behavior Auditor (UBA) is an IMC service component used to audit flow records that are generated by network devices. By analyzing flow records, UBA obtains information about network behaviors of users, which helps you to optimize network resources and regulate network behaviors.
Flow record types
Network devices use flow records to record network user behaviors. The UBA server can receive these flow records, analyze them, and then generate audit reports. UBA supports the following types of flow records:
· NAT 1.0—Records NAT session information, including IP address and port number translation, user access, and network flows.
· Flow 3.0—Records users' access to networks based on flows. Each flow is identified by a 5-tuple of the source IP address, destination IP address, source port, destination port, and protocol number.
· NetStream V5/V9 (HPE devices)—Records users' access to networks based on flows. Each flow is identified by a 7-tuple of the source IP address, destination IP address, source port, destination port, and protocol number, Type of Service (ToS), and inbound or outbound interface.
· NetFlow V5/V9 (Cisco devices)—Records users' access to networks based on flows. The NetFlow-enabled router or switch will examine each packet based on seven key fields: source and destination IP address, source and destination port, Layer 3 protocol type, ToS byte, and input logical interface. If packets share identical contents in each of the seven fields, the router or switch will assume these packets to be part of the same flow.
· DIG—For a device that does not support NAT 1.0, Flow 3.0, NetStream V5/V9, or NetFlow V5/V9, configure port mirroring on the device to mirror the traffic to be analyzed to the probe server. The probe server collects statistics of the received mirrored traffic and generates DIG logs. For more information about installing and configuring probes, see HPE Intelligent Management Center v7.3 Probe Installation Guide.
Collecting flow records
1. Identify the source data devices that will generate flow records according to the areas that you want to capture network flow data for.
For example, if you want to monitor network behaviors of the financial department staff, use the convergence layer switches or routers of the financial department network as the source data devices.
2. Choose traffic flow-based traffic statistics technologies according to your needs.
For example, if you want to monitor user behaviors of accessing external networks, use Flow or NAT. If you want to monitor network behaviors between internal network users, use NetStream, NetFlow, or DIG probe.
|
|
NOTE: Support for flow-based traffic statistics technologies depends on the vendor and the device model. |
3. Configure source data devices or probes.
If you choose Flow, NAT, NetStream, or NetFlow for generating flow records, configure the corresponding flow-based traffic statistics technology on the devices that will generate flow records. For more information, see related configuration guide of your device. Make sure the source data devices and the UBA server can reach from each other.
If you choose the DIG probe for generating flow records, deploy a DIG probe in the network and configure port mirroring on the device to mirror the traffic to be analyzed to the probe. Make sure the DIG probe and the UBA server can reach from each other. For more information about deploying a probe, see HPE Intelligent Management Center v7.3 Probe Installation Guide.
4. Configure the UBA server.
For the UBA server to receive flow records from a device, add the device to UBA and select the device in the server configuration.
For the UBA server to receive flow records from a probe, add the probe to UBA, select the probe in the server configuration, and configure FTP parameters. You must set up an FTP server on the same host as the UBA server. The probe server uploads the probe traffic logs to the UBA server by using FTP.
5. Deploy the server configuration.
Processing flow records
UBA processes flow records according to configurations of various functions of UBA, such as device management or probe management, server configuration, audit task management, application management, and filter strategy management. For example, UBA process or discards received flow records according to filter strategies and audits flow records according to predefined and custom applications.
Quick start guide
The following information guides you quickly through the main functions of the UBA component.
UBA navigation menu
UBA provides a breadcrumb navigation menu and a navigation tree. The navigation tree provides pop-up menus. This document uses the navigation tree.
UBA breadcrumb navigation menu
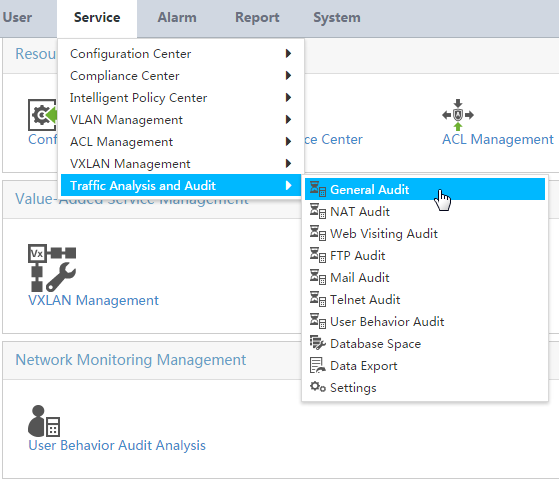
As shown in Figure 1, the breadcrumb navigation menu has two levels. Point to Service > Traffic Analysis and Audit to display the submenus. For more information about each menu item's function, see Table 1.
Figure 1 UBA breadcrumb navigation menu
UBA navigation tree
Figure 2 shows the UBA navigation tree.
To access the UBA navigation tree:
1. Click the Service tab on the top navigation bar.
2. From the left navigation tree, click Traffic Analysis and Audit to expand the UBA navigation menu.
For more information about each menu item's function, see Table 1.
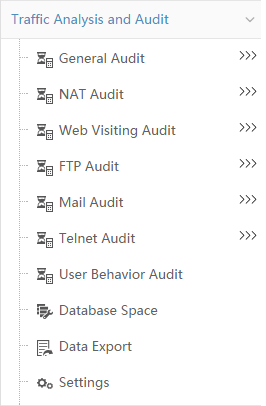
Table 1 UBA navigation menu items
|
Item |
Function |
|
General Audit |
Audits user behaviors according to audit conditions, such as the source IP address, destination IP address, source port, destination port, protocol, application, packet count, flux, and device IP. |
|
NAT Audit |
Audits user behaviors according to the IP addresses and the port before and after translation. |
|
Web Visiting Audit |
Audits user behaviors of visiting websites, and displays websites users have visited and files users have browsed. |
|
FTP Audit |
Audits user behaviors of transferring FTP files, and displays the FTP accounts user use and the files users upload or download. |
|
Mail Audit |
Audits user behaviors of sending mails, and displays the senders, receivers, and titles of mails. |
|
Telnet Audit |
Audits users' Telnet behaviors, and displays Telnet user names and commands executed by Telnet users. |
|
User behavior Audit |
Query audit results according to the audit server, time range, audit condition, and special audit conditions. |
|
Database Space |
View current database disk usage and usage trend statistics over the specified time period for each audit server. |
|
Data Export |
Configure UBA to export log files automatically, query data export records, and download the Log File Audit tool to audit exported log files. |
|
Settings |
Provides access to the management and configuration functions such as device management, probe management, server configuration, user behavior audit management, application management, filter strategy management, and parameters management. |
|
|
NOTE: By default, only the User Behavior Audit, Database Space, Data Export, and Settings menu items are displayed. The General Audit, NAT Audit, Web Visiting Audit, FTP audit, Mail Audit, or Telnet Audit menu item is displayed only after you create audit tasks of the corresponding audit type. |
Navigation tree pop-up menus
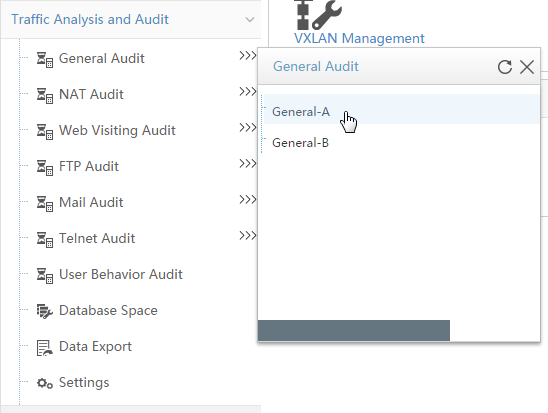
The navigation tree provides pop-up menus that allow you to quickly view audit results.
To display the pop-up menu for an audit type:
1. Point to the Expand
icon ![]() next to an audit type.
next to an audit type.
The pop-up menu for the audit type opens
and displays all audit tasks of the audit type. You can click a task name to
view its audit result. To view the most recent audit tasks, click the Refresh icon ![]() .
.
2. Click the Close icon
![]() or click any other area except the pop-up menu to close the pop-up
menu.
or click any other area except the pop-up menu to close the pop-up
menu.
Figure 3 Navigation tree pop-up menu
UBA workflow
To configure a user behavior audit task to audit user behaviors:
1. Add a device or probe to UBA.
2. Modify the server configuration and deploy the server configuration.
3. Add a user behavior audit task.
4. View the audit result.
Flow records collection
UBA can audit flow records collected from the following types of sources:
· Device—Switches or routers that support a flow-based traffic statistics collection technology, such as Flow, NetStream, or NetFlow. You must configure the flow-based traffic statistics collection technology on the devices. For more information, see related configuration guide of your device.
· Probe—For devices that do not support flow-based traffic statistics collection technologies, deploy a probe to collect flow records. You must configure port mirroring on the device to mirror the traffic to be analyzed to the probe. For more information about deploying a probe, see HPE Intelligent Management Center v7.3 Probe Installation Guide. For more information about configuring port mirroring, see related configuration guide of your device.
Device/Probe management
The Device Management function allows you to add a device to UBA to act as a flow records source. For more information about device management, see "Managing UBA data source devices."
The Probe Management function allows you to add a probe to UBA to act as a flow records source. For more information about probe management, see "Managing probes."
Server configuration
For the UBA server to receive flow records from a device, select the device in the server configuration.
For the UBA server to receive flow records from a probe, select the probe in the server configuration and configure FTP parameters. You can also enable special audits. The probe collects flow records of the received mirrored traffic received from the device and uploads the flow records to the UBA server by using FTP.
Excessive data greatly affects UBA processing efficiency. You can configure the intranet network segment for network flow monitoring. The UBA server processes data only in the specified network segment. You can also create a filter strategy and deploy it to the UBA server. A filter strategy defines whether the flow records that the UBA server receives are processed or directly discarded by UBA. For more information about filter strategy configuration, see "Managing filter strategies."
For more information about server configuration, see "Managing UBA servers."
Audit tasks and results
UBA provides the following types of audit tasks:
· General Audit.
· NAT Audit.
· Web Visiting Audit.
· FTP Audit.
· Mail Audit.
· Telnet Audit.
The Web Visiting Audit, FTP Audit, Mail Audit, and Telnet Audit are special audits used to monitor Layer 7 applications. These special audit types are displayed in the navigation tree only when the following requirements are met:
· Deploy a probe for flow records collection.
· Enable the corresponding special audits for the probe in the server configuration.
UBA provides the following method of viewing audit results:
· Viewing audit results through the pop-up menus on the navigation tree. For more information, see "Navigation tree pop-up menus."
· View audit results on the user behavior audit management page. For more information, see "Viewing audit results."
Common operations
Navigating a list
If a list contains enough entries, use the following aids to navigate the list:
· Click the Next Page icon ![]() to page forward
in the list.
to page forward
in the list.
· Click the Last Page icon ![]() to page forward
to the end of the list.
to page forward
to the end of the list.
· Click the Previous Page
icon ![]() to page backward
in the list.
to page backward
in the list.
· Click the First Page icon
![]() to page backward
to the front of the list.
to page backward
to the front of the list.
· Click a page number to display the page in the list.
· Select 8, 15, 50, 100, or 200 at the bottom of the list to configure how many items per page you want to display.
Sorting a list
You can sort a list by every field that
contains a Sort icon ![]() in the column
label.
in the column
label.
· When the list is sorted by a field in ascending order, the column label of the selected
field is blue and contains an Ascending icon ![]() .
.
· When the list is sorted by a field in descending
order, the column label of the selected field is blue and contains a Descending icon ![]() .
.
Setting the query time
Use one of the following methods to set the start time and end time of a time range:
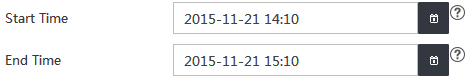
· Enter time in the Start Time and End Time fields in the format of YYYY-MM-DD hh:mm.
Figure 4 Enter a time in the Start Time and End Time fields
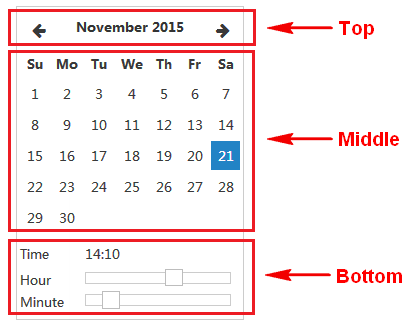
· Click the Calendar icon
![]() next to the Start Time
and End Time fields and set the time on the calendar that opens, as
shown in Figure 5:
next to the Start Time
and End Time fields and set the time on the calendar that opens, as
shown in Figure 5:
a. Click the Last Month
icon ![]() or the Next Month icon
or the Next Month icon ![]() to
scroll between months.
to
scroll between months.
b. Click a day.
The day you click is highlighted. By default, the current day is selected and is grayed out.
c. Drag the timeline sliders next to the Hour and Minute fields to set the hour and minute, respectively.
The set time opens in the Time field.
Figure 5 Set the time on the calendar
Customizing UBA lists
1. Click Custom in a UBA list.
The Column List page opens. The Column Name column displays all column names of the UBA list.
2. Select the column name that you want to display in the UBA list or select the check box at upper left corner of the page to select all column names.
3. In the Order column, click the Move Up icon ![]() or the Move Down icon
or the Move Down icon ![]() to modify the
rank of the column names in the UBA list.
to modify the
rank of the column names in the UBA list.
Click Default if you want to restore the default columns and rank of the UBA list.
4. Click OK.
UBA views
For better user experience, IMC provides diversified views for different services and solutions to display UBA functions.
Default perspective
To enter the default perspective:
1. Log in to IMC.
2. Click the Service tab on the top navigation bar.
3. From the navigation tree, select Traffic Analysis and Audit.
This document describes UBA functions in default perspective.
Desktop view
To enter the desktop view:
1. Log in to IMC.
2. Perform one of the following tasks on the IMC home page:
¡ Click
the Desktop icon ![]() in the top right
corner.
in the top right
corner.
¡ Select Desktop View from the View list in the top right corner.
3. In the desktop view, click the Add application icon ![]() .
.
You can customize applications as needed. For more information about the desktop view, see HPE Intelligent Management Center v7.3 Enterprise and Standard Platform Administrator Guide.
4. To switch to the default perspective, use one of the following methods:
¡ Click
the Start icon ![]() at the left of the desktop.
at the left of the desktop.
¡ Right-click the desktop, and then select Classic from the shortcut menu.
Quick service process
To enter the quick service process:
1. Log in to IMC.
2. Select Quick Service Process from the View list in the top right corner of the IMC home page.
3. In the Select Template Category area, select NTA&UBA Configuration Management.
For information about the quick service process, see HPE Intelligent Management Center v7.3 Enterprise and Standard Platform Administrator Guide.
4. To switch to the default perspective, click Default Perspective in the top right corner.
Settings
The Settings page allows you to manage UBA data sources, configure UBA servers, create user behavior audit tasks, and view audit results.
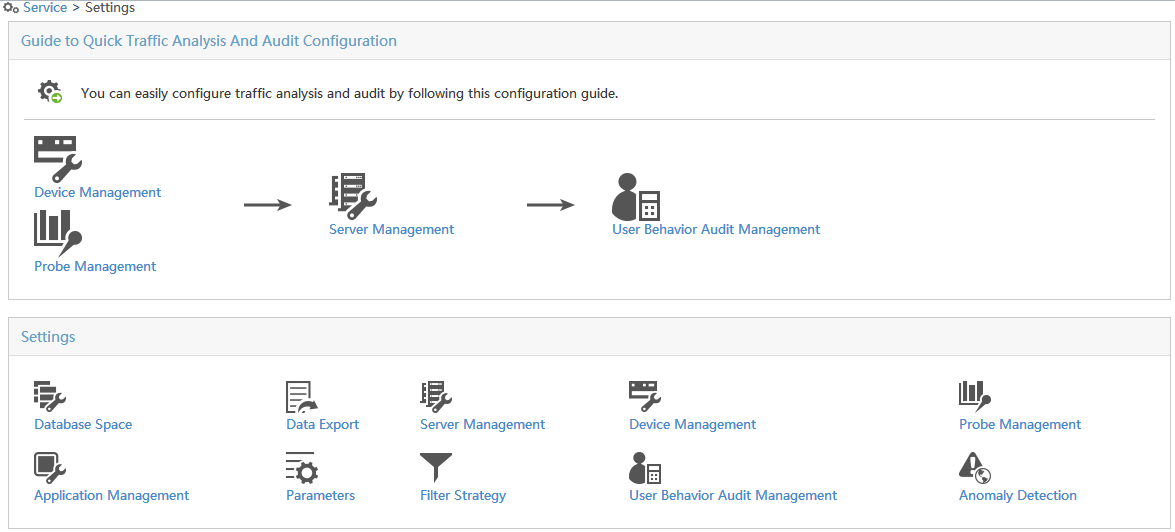
The Settings page includes the following areas:
· Guide to Quick Traffic Analysis And Audit Configuration—Guides you quickly through the configuration procedures for UBA.
· Settings—Provides an access to each function of UBA, as shown in Figure 6. You can click a function name or icon to access the corresponding page.
Accessing the Settings page
1. Click the Service tab.
2. From the navigation tree, select Traffic Analysis and Audit > Settings.
The Settings page opens, as shown in Figure 6.
Managing UBA data sources
Managing UBA data source devices
Viewing UBA data source device list
1. Access the Settings page.
2. In the Settings
area, click the Device Management link or icon ![]() .
.
The Device Management page opens and displays all devices that have been added to UBA.
Device List contents
¡ Name—Name of the device. By default, UBA autopopulates this field with the device label when you add a device by selecting the device from the IMC Platform. You can click the device name to view device details.
¡ Device IP—IP address of the device.
¡ Description—Description for the device.
¡ Device Resource Info—This field is
available for only devices that you add to UBA by selecting devices from the
IMC Platform. You can click the Device Resource Info
icon ![]() to view the device resource information.
to view the device resource information.
¡ Modify—Allows you to click the Modify icon ![]() to modify the
device information.
to modify the
device information.
¡ Delete—Allows you to click the Delete icon ![]() to delete the device from UBA.
to delete the device from UBA.
Viewing UBA data source device details
1. Access the Device Management page.
2. In the device list, click a device name.
The Device Details page opens and displays all parameters that were configured when you add a UBA data source device.
Device Details contents
¡ Device IP—IP address of the device.
¡ Name—Name of the device.
¡ Description—Description for the device.
¡ SNMP Community—SNMP community string for the device in cipher text.
¡ SNMP Port—SNMP listening port number for the device. The default value is 161.
¡ Log Source IP—IP address of the log source for the device. This field is available only if you configured it when you added a device.
¡ NetStream Statistics Identifier—Indicates whether the NetStream statistics identifier is valid for the device.
¡ NetStream New Feature—Indicates whether the NetStream flow sampling feature is enabled for the device.
¡ NetStream Sampling Ratio—NetStream sampling rate configured for the device. The value of 1 indicates that the sampling rate is 1:1, and the value of 100 indicates that the sampling rate is 1:100. This field is available only if you configured it when you added a device.
3. Click Back to return to the Device Management page.
Adding a UBA data source device
You can add data source devices either by adding devices manually or by selecting devices from the IMC Platform.
· If you add data source devices manually, the devices do not consume licenses of the IMC Platform. However, you cannot view the device resource information for the devices.
· If you add data source devices by selecting devices from the IMC Platform, you can view the device resource information for the devices. However, these devices consume licenses of the IMC Platform.
Adding a data source device manually
1. Access the Device Management page.
2. In the device list, click Add.
The Add Device page opens.
3. In the Device IP field, enter the IP address of the device you want to add.
Make sure the IP address communicates with the UBA server correctly. You cannot modify this field once you have specified it.
4. In the Name field, enter the name of the device.
You cannot modify this field once you have specified it.
5. In the Description field, enter the description for the device.
6. In the SNMP Community field, enter the SNMP community string of the device.
UBA reads the interface information of the device by using the SNMP community string. The SNMP community string in UBA must be the same as that in the SNMP configuration on the device.
You can only configure SNMP community strings of SNMPv1 or v2c version for devices that are added manually. For devices that use SNMP community strings of SNMPv3, add them by selecting them from the IMC Platform.
7. In the SNMP Port field, enter the SNMP listening port number for the device. The default value is UDP port 161.
UBA uses the SNMP listening port number to communicate with and receive data from the device forwarding network flow data.
8. In the Log Source IP field, enter the IP address of the log source for the device.
If UBA cannot access a device through SNMP, you must specify the log source IP address.
9. Select Valid from the NetStream Statistics Identifier list if the identifier is supported on the device. If it is not, select Invalid.
10. Select Enable from the NetStream New Feature list if the device supports the NetStream sampling, and go to Step 12. If the feature is not supported, select Disable.
NetStream sampling collects statistics on fewer packets and is useful when the network has a large amount of traffic.
|
|
NOTE: · Only HPE Comware 5 and Comware 7 support the NetStream new feature. · For Cisco devices, select Invalid from the NetStream Statistics Identifier list, and select Disable from the NetStream New Feature list. |
11. In the NetStream Sampling Ratio field, enter the sampling rate.
The sampling rate is in the range of 1 to 65536. The value of 1 indicates that the sampling rate is 1:1, and the value of 100 indicates that the sampling rate is 1:100. The sampling rate you enter must be the same as that you have configured on the device. Otherwise, traffic statistics errors occur. If you have not configured a sampling rate on the device, enter 1, which indicates that the sampling rate is 1:1.
12. Click OK.
|
|
NOTE: The sFlow Settings field is applicable only to the NTA component. |
Adding a data source device by selecting devices from the IMC Platform
1. Access the Device Management page.
2. In the device list, click Add.
The Add Device page opens.
3. Click Select next to the Device IP field.
The Select Devices dialog box opens.
4. Do one of the following:
¡ On the Select Devices dialog box, click the By View tab.
Click the Expand icon ![]() to the
left of the IP View, Device View, or Custom View, and then select a subview. All devices in the subview are
displayed in the Devices Found area:
to the
left of the IP View, Device View, or Custom View, and then select a subview. All devices in the subview are
displayed in the Devices Found area:
- IP View—Displays all devices by network segment.
- Device View—Displays all devices by device category.
- Custom View—Displays all devices by custom view and Devices Not In Views. All devices that do not belong to any view are automatically added to Devices Not In Views.
¡ On the Select Devices dialog box, click the Advanced tab.
Specify one or more of the following query criteria:
- Device IP—Enter the IP address you want to query. Select Exact Query if you want UBA to query the exact IP address you have entered.
- Device IP List—Configure
multiple device IP addresses to be searched. Click the Device
IP List Configuration icon ![]() . The Device IP List Configuration page opens. Enter one or
multiple device IP addresses in the Input Device IP
field (to enter multiple IP addresses, enter one IP address on each line), and
click Add to add the entered IP addresses to the Device IP List field below.
. The Device IP List Configuration page opens. Enter one or
multiple device IP addresses in the Input Device IP
field (to enter multiple IP addresses, enter one IP address on each line), and
click Add to add the entered IP addresses to the Device IP List field below.
Repeat the steps above to add all device IP addresses to be searched.
To delete an IP address in the Device IP List field, select the IP address, click Delete, and click OK.
Make sure the device IP addresses to be
queried have been added to the Device
IP List field. To clear the Device IP List
field, click the Clear icon ![]() .
.
- Device Label—Enter a name for the devices you want to add. UBA supports fuzzy matching for this field.
- Device Status—Select device status from the Device Status list.
- Device Category—Select a device type from the Device Category list.
- Device Series—Select a device series from the Device Series list.
- Contact—Enter the contact name information you want to search by. This field supports fuzzy matching.
- Location—Enter the location information you want to search for. This field supports fuzzy matching.
- Device Reachability—Select device reachability status from the Device Reachability list.
Click Query. All matching devices are displayed in the Devices Found area.
5. Highlight the device you want to select from
the Devices Found list and click the Add selected button ![]() to add it to
the Selected Devices list. To remove a device,
highlight the device and click the Remove selected
button
to add it to
the Selected Devices list. To remove a device,
highlight the device and click the Remove selected
button ![]() .
.
6. Confirm that the device you have selected has been added by reviewing the Selected Devices list.
7. Click OK.
UBA autopopulates the Device IP, Name, and SNMP Community field.
8. In the Description field, enter the description for the device.
9. In the SNMP Port field, enter the SNMP listening port number for the device. The default value is UDP port 161.
UBA uses the SNMP listening port number to communicate with and receive data from the device forwarding network flow data.
10. In the Log Source IP field, enter the IP address of the log source for the device.
If UBA cannot access a device through SNMP, you must specify the log source IP address.
11. Select Valid from the NetStream Statistics Identifier list if the identifier is supported on the device. If it is not, select Invalid.
12. Select Enable from the NetStream New Feature list if the device supports the NetStream sampling , and go to Step 14. If the feature is not supported, select Disable.
NetStream sampling collects statistics on fewer packets and is useful when the network has a large amount of traffic.
|
|
NOTE: · Only HPE Comware 5 and Comware 7 support the NetStream New feature. · For Cisco devices, select Invalid from the NetStream Statistics Identifier list, and select Disable from the NetStream New Feature list. |
13. In the NetStream Sampling Ratio field, enter the sampling rate.
The sampling rate is in the range of 1 to 65536. The value of 1 indicates that the sampling rate is 1:1, and the value of 100 indicates that the sampling rate is 1:100. The sampling rate you enter must be the same as that you have configured on the device. Otherwise, traffic statistics errors occur. If you have not configured a sampling rate on the device, enter 1, which indicates that the sampling rate is 1:1.
14. Click OK.
|
|
NOTE: The sFlow Settings field is applicable only to the NTA component. |
Modifying a UBA data source device
1. Access the Device Management page.
2. In the device list, click
the Modify icon ![]() for the UBA data source device you want to modify.
for the UBA data source device you want to modify.
The Modify Device page opens.
3. Modify device parameters as needed.
You cannot modify the Device IP and Name field. For more information about modifying UBA data source device parameters, see "Adding a UBA data source device."
4. Click OK.
Deleting a UBA data source device
Deleting a device from UBA does not delete the data received from the device prior to the deletion.
To delete a UBA data source device:
1. Access the Device Management page.
2. In the device list, click
the Delete icon ![]() for the UBA data source device entry you want to delete.
for the UBA data source device entry you want to delete.
A confirmation dialog box opens.
3. Click OK.
|
|
NOTE: Once a UBA data source device has been deleted, all user behavior audit tasks associated with the device will be terminated. |
Managing probes
Viewing the probe list
1. Access the Settings page.
2. Click the Probe
Management link or icon ![]()
The Probe Management page opens and displays all probes that have been added to UBA.
Probe List contents
¡ Name—Name of the probe. You can click the probe name to view details for the probe.
¡ IP—IP address of the probe.
¡ Description—Description for the probe.
¡ Enable Layer 7 Application Identification—Indicates whether Layer 7 application identification is enabled for the probe.
¡ Modify—Allows you to click the Modify icon ![]() to modify the
probe.
to modify the
probe.
¡ Delete—Allows you to click the Delete icon ![]() to delete the
probe.
to delete the
probe.
Viewing probe details
1. Access the Probe Management page.
2. In the probe list, click a probe name.
The Probe Details page for the device opens and displays all parameters that were configured when you add a probe.
Probe Details contents
¡ Name—Name of the probe.
¡ IP—IP address of the probe.
¡ Description—Description for the probe.
¡ Enable Layer 7 Application Identification—Indicates whether Layer 7 application identification is enabled for the probe.
3. Click Back to return to the Probe Management page.
Adding a probe
1. Access the Probe Management page.
2. In the probe list, click Add.
The Add Probe page opens.
3. In the Name field, enter a name for the probe.
The name for each probe must be unique.
4. In the IP field, enter the IP address of the probe.
The IP address must be an IPv4 address and must communicate with the UBA server correctly.
5. In the Description field, enter a description for the probe.
6. Select Yes from the Enable Layer 7 Application Identification list if you want UBA to analyze Layer 7 application data. Select No from the Enable Layer 7 Application Identification list if you want UBA to analyze only Layer 4 application data.
7. Enter the password for the probe in the Probe Password field.
The password must be consistent with the password on the probe. If you have not set a password on the probe, leave this field empty.
8. Click OK.
Modifying a probe
1. Access the Probe Management page.
2. In the probe list, click
the Modify icon ![]() for the probe you want
to modify.
for the probe you want
to modify.
The Modify Probe page opens.
3. Modify probe parameters as needed.
You cannot modify the IP field. For more information about modifying probe parameters, see "Adding a probe."
4. Click OK.
Deleting a probe
Deleting a probe from UBA does not delete the data received from the probe prior to the deletion.
To delete a probe:
1. Access the Probe Management page.
2. Click the Delete icon ![]() for the probe you want to delete.
for the probe you want to delete.
A confirmation dialog box opens.
3. Click OK.
|
|
NOTE: Once a probe has been deleted, all user behavior audit tasks associated with the probe will be terminated. |
Managing UBA servers
The Server Management feature in UBA allows you to manage the configuration of all UBA servers, whether or not the UBA server is local to the IMC Platform server. Each UBA server is added to the server list when the UBA server is installed. When the UBA service module is installed on the IMC Platform server, the UBA server name will be the loopback address 127.0.0.1 by default. When the UBA service module is deployed on a server other than the IMC Platform server, the UBA server name will be the server's IP address by default. When the UBA service module is uninstalled, the installation program will remove the UBA instance from the server list.
In a distributed deployment, UBA can be deployed to 10 servers at most. Multiple servers can share load to improve the UBA service performance.
Viewing the UBA server list
1. Access the Settings page.
2. Click the Server
Management link or icon ![]() .
.
The Server Management page opens and displays all UBA servers.
Server List contents
¡ Server Name—Name of the UBA server. You can click the server name to view details for the UBA server.
¡ Server IP—IP address of the UBA server. This field displays the loopback address of the local server when UBA is installed on the same server as the IMC Platform.
¡ Description—Description for the UBA server.
¡ Capture Flux Log—This field is available only for NTA. For more information, see HPE Intelligent Management Center v7.3 Network Traffic Analyzer Administrator Guide.
¡ Deploy Configuration—Allows you to
click the Deploy Configuration icon ![]() to
deploy server configuration of the UBA server.
to
deploy server configuration of the UBA server.
¡ Modify—Allows you to click the Modify icon ![]() to modify the server configuration for the UBA server.
to modify the server configuration for the UBA server.
Viewing UBA server details
1. Access the Server Management page.
2. In the UBA server list, click a UBA server name.
The Server Details page for the UBA server opens.
Basic Information area
¡ Server Name—Name of the UBA server.
¡ Server Description—Description for the UBA server.
¡ Processor IP—IP address of the UBA server.
¡ Listening Port—Port numbers that the UBA server uses to communicate with the devices and probes that send traffic data. The default values are 9020, 9021, and 6343.
¡ FTP Main Directory—Root directory for the FTP service running on the UBA server.
¡ FTP Username—Username of the FTP account used by probes to upload data to the UBA server.
¡ Traffic Analysis Log Aggregation Policy—Aggregation policy that is applied to the network flow records directed to the UBA server.
¡ Filter Policy—Indicates whether a filtering policy is applied to network flow records directed to the UBA server.
¡ Usage Threshold of the Database Disk (1-95%)—Threshold for the percent of database disk utilization defined for the UBA server.
¡ When Database Disk Usage Reaches Threshold—Action that is taken when the database disk usage reaches the threshold specified in the Usage Threshold of the Database Disk field.
Device Information area
¡ Device Name—Name of the device that provides network flow data for the UBA server.
¡ Device IP—IP address of the device that provides network flow data for the UBA server.
¡ Device Description—Description for the device that provides the network flow data for the UBA server.
Probe Information area
¡ Probe Name—Name of the probe that provides the network flow data for the UBA server.
¡ Probe IP—IP address of the probe that provides the network flow data for the UBA server.
¡ Enable Layer 7 Application Identification—Indicates whether the Layer 7 application identification is enabled for the probe that provides the network flow data for the UBA server.
¡ Enable Special Audit—Special audits that are enabled for the UBA server.
Intranet Monitor Information area
Intranet Information—Intranet IP segments that are added when you modify the server configuration for the UBA server.
3. Click Back to return to the Server Management page.
Modifying and deploying UBA server configuration
1. Access the Server Management page.
2. In the UBA server list, click the Modify
icon ![]() for the UBA server you
want to modify.
for the UBA server you
want to modify.
The Server Configuration page opens.
3. In the Basic Information area, modify UBA server parameters as needed:
a. In the Server Name field, enter a new server name. By default, this field displays the loopback address of the local server when UBA is installed on the same server as the IMC Platform.
b. In the Server Description field, enter a new description for the UBA server.
c. You cannot modify the Server IP field.
d. In the Listening Port field, modify the UDP port number that UBA uses to communicate with the devices and probes that send traffic data. The default values are 9020, 9021, and 6343.
The listening port numbers in UBA must be the same as that in the listening port configuration on devices. Otherwise, UBA fails to receive flow records from devices.
e. Configure the FTP Main Directory field, FTP Username field, and FTP Password field.
Make sure the FTP main directory, username, and password settings in UBA are the same as those you configure for the FTP server set on the UBA server.
f. From the Traffic Analysis Log Aggregation Policy list, select one of the following aggregation policies:
- No Aggregation (Best Report Timeliness)—The UBA server does not aggregate data, and it processes each flow record. This option is only suitable for scenarios that have a priority on report timeliness, which require the most disk space.
- Aggregation (Standard)—The UBA server aggregates data at a fixed interval. This option requires less disk space than the No Aggregation aggregation policy and more disk space than the Aggregation (Rough Granularity) aggregation policy.
- Aggregation (Rough Granularity)—The UBA server aggregates data at an interval longer than that of the Aggregation (Standard) aggregation policy. This option is suitable for scenarios that have a small number of logs generated, which requires the least disk space.
g. From the Filter Policy list, select a predefined filter policy. Select Not Filter if you do not want to filter flow records.
For more information about configuring a filter policy, see "Managing filter strategies."
h. In the Usage Threshold of the Database Disk (1-95%) field, enter a usage threshold of the database disk.
4. When the usage threshold of the database disk is reached, the UBA database space management module is triggered to inform the IMC alarm management module to generate alarms. The IMC alarm management module then sends notifications to inform administrators of the alarms. For more information about the UBA database space management module, see "Managing database space." For more information about the IMC alarm management module, see HPE Intelligent Management Center v7.3 Enterprise and Standard Platform Administrator Guide.
a. From the When Database Disk Usage Reaches Threshold list, select the action you want UBA to take when the UBA database disk usage reaches the threshold set in Usage Threshold of the Database Disk (1-95%) field. Options are:
- Stop Receiving Logs—The UBA server stops monitoring network data and stops receiving flow records.
- Delete Logs to Release Space—The UBA server deletes oldest logs from the database until the disk space usage drops below the threshold.
5. In the Device Information area, select the devices that send flow records.
6. In the Probe Information area, select the probes that send flow records and enable the special audits as needed for each selected probe.
You can add audit tasks of special audit types only after you enable the corresponding special audits and successfully deploy the server configuration.
7. In the Intranet Monitor Information area, enter an IP segment to be monitored in the Intranet Information field, and click Add.
The IP segment uses the format of 10.153.89.0/24, 10.153.89.0/255.255.255.0, or a001:410:0:1::1/64.
To delete an IP segment, click the Delete icon ![]() for
the IP segment.
for
the IP segment.
8. Click Deploy.
The Configuration Deployment Result page opens and displays the processor deployment result, receiver deployment result, and the probe deployment result.
9. Click Back to return to the Server Management page.
Managing user behavior audit
The user behavior audit management function allows you to perform the following tasks:
· Add, view, modify, and delete audit tasks of various audit types.
· View audit results.
The following information describes common operations for managing audit tasks and viewing audit results. For more information about managing audit tasks of an audit type, see the related chapter of the audit type.
Viewing user behavior audit list
1. Access the Settings page.
2. Click the User Behavior Audit Management link
or icon ![]() .
.
The User Behavior Audit Management page opens and displays all audit tasks that have been added.
User Behavior Audit Task List contents
¡ Name—Name of the audit task. You can click the audit task name to view the audit task details.
¡ Server—IP address of the UBA server. When the UBA service module is installed on the IMC platform server, this field displays the loopback address 127.0.0.1.
¡ Type—Type of the audit task.
¡ Audit—Allows you to click the Audit icon ![]() to view audit
results for the audit task.
to view audit
results for the audit task.
¡ Modify—Allows you to click the Modify icon ![]() to modify the
audit task.
to modify the
audit task.
¡ Delete—Allows you to click the Delete icon ![]() to delete the
audit task. Click the icon and click OK in the
confirmation dialog box that opens. To delete audit tasks in bathes, select one
or more audit tasks, click Delete, and click OK in the confirmation dialog box that opens.
to delete the
audit task. Click the icon and click OK in the
confirmation dialog box that opens. To delete audit tasks in bathes, select one
or more audit tasks, click Delete, and click OK in the confirmation dialog box that opens.
|
|
NOTE: To view the user behavior audit list for an audit type, select the corresponding audit type from the navigation tree after you add audit tasks of the audit type. |
Viewing audit results
Querying audit results for an audit task
By default, the audit result page for an audit task displays the audit results of the last one hour. You can set the audit time to query the audit results generated in a specific period of time.
To query the audit results for an audit task:
1. Access the User Behavior Audit Management page.
2. Click the Audit icon
![]() for the audit task for which you want to view audit results.
for the audit task for which you want to view audit results.
The audit result page for the audit task opens.
3. In the query area, select any of the following options from the Audit Time list:
¡ Last 1 hour—View the audit results generated in the last one hour.
¡ Last 2 hours—View the audit results generated in the last two hours.
¡ Custom—Customize a period of time to query the audit results. If you select this option, you must set the start time and the end time. For more information about setting the query time, see "Setting the query time."
4. Click Audit.
Showing/hiding access users
When both UBA and UAM components are deployed, UBA can work with UAM to obtain information about access users, such as the user name, operating system type, and terminal type. To view the access user names in the audit result list, click Show Access User in the audit result list. Then, the user names of online access users are displayed in the Source and Destination columns. To display the IP addresses in the Source and Destination columns, click Hide Access User.
Querying hosts
To view the name of the host that use a
destination or source IP address, click the Query Hosts icon ![]() next to the
source or destination IP address in the audit result list. A tip opens and
displays the name of the host that uses the IP address. If the host name cannot
be obtained, the tip displays the IP address.
next to the
source or destination IP address in the audit result list. A tip opens and
displays the name of the host that uses the IP address. If the host name cannot
be obtained, the tip displays the IP address.
Saving audit results
You can save the audit results generated in a specific time range for further query.
To save audit results:
1. On the audit result page for an audit task, click Save.
The audit details page for the audit task opens.
2. Click Save.
The save result page for the audit results opens and displays messages about the operation result, the number of logs that are saved, and the directory where the logs are saved.
To download the log file locally, click
the Save icon ![]() .
.
Managing database space
The database space management function allows you to view the current UBA database space usage and usage trend statistics over a specific time range. You can plan the log backup, data export, and physical memory expansion according to the database space usage and usage trend statistics.
Viewing database usage statistics
1. Access the Settings page.
2. Click the Database
Space link or icon ![]() .
.
The Database Space page opens and displays all database space usage statistics.
Database Space Usage List contents
¡ Server Name—Name of the UBA server. You can click the server name to view the database space usage trend of the UBA server.
¡ Server Description—Description for the UBA server.
¡ Data File Usage—Usage of the Database.
¡ Disk Usage—Usage of the disk space where the database files reside.
|
|
NOTE: The database space management function is unavailable when UBA uses a remote database. |
Viewing database space usage trend statistics
1. Access the Settings page.
2. Click the Database
Space link or icon ![]() .
.
The Database Space page opens.
3. Click a server name.
The database usage trend page for the UBA server opens. By default, the page displays the database space usage trend chart over the last 24 hours in the Database Space Usage Trend area.
4. To change the query time for the database space usage trend, do one of the following tasks:
¡ In the Query Database Space Usages area, select a time range from the Time list. Options are Last 24 hours, Last 7 days, Last 30 days, Last 3 months, and Custom. By default, the Last 24 hours option is used.
¡ Select Custom from the Time list, and set the start time and the end time. For more information about setting query time range, see "Setting the query time".
5. Click Query.
To restore the default query time, click Reset.
6. In the Database Space Usage Trend area, view the database space usage trend chart over the specified time range.
¡ ![]() Used Database Space—Size of the used database space.
Used Database Space—Size of the used database space.
¡ ![]() Available Disk Space—Size of the available disk space
where the database files reside.
Available Disk Space—Size of the available disk space
where the database files reside.
¡ ![]() Available Database Space—Size of the available database
space.
Available Database Space—Size of the available database
space.
¡ ![]() Other Used Disk Space—Size of the used disk space where
the database files reside.
Other Used Disk Space—Size of the used disk space where
the database files reside.
To hide or display a trend area, click the legend in the illustration.
Point to an edge of a trend area to view the usage trend statistics of a specific time.
7. In the Details area, view the database space usage trend statistics that are displayed in list.
Database Space Usage Statistics List contents
¡ Information Collection Time—Collection time of the database space usage statistics. The granularity of the database space usage information varies with the length of the query time. The shorter the time length of the query, the finer the granularity will be. The finest granularity is 10 minutes.
¡ Used Database Space—Size of the used database space.
¡ Total Database Space—Total size of the database space.
¡ Available Disk Space—Size of the available disk space where the database files reside.
¡ Other Used Disk Space—Size of the used disk space where the database files reside.
¡ Data File Usage—Usage of the Database.
¡ Disk Usage—Usage of the disk space where the database files reside.
Managing data export
The data export function allows you to view data export logs, modify data export configuration, and audit exported log files.
After you enable data export, either the log lifetime or the data space alarm can trigger data export.
· Log Lifetime—UBA will check the lifetime of each log in the database in the early morning every day. A log whose lifetime expires is exported to a data file. The log lifetime is set in the UBA system parameters. You can also set the exported file lifetime in the UBA system parameters. The default value is 90 days. Exported files whose lifetime expires are automatically deleted. For information about modifying the log lifetime and the exported file lifetime, see "Managing system parameters."
· Data space alarm—If the Trigger Data Export by Data Space Alarm option selected, the UBA server automatically exports the oldest data when the data space alarms occur. The data space alarms are generated based on the data file usage and the usage of the disk where the database resides. An operator can modify the threshold for the usage of the disk where the database resides. For information about modifying the threshold, see "Managing UBA servers."
Data export triggered by the log lifetime is independent of data export triggered by the data space alarm.
Viewing the data export list
1. Access the Settings page.
2. Click the Data Export
link or icon ![]() .
.
The Data Export page opens and displays data export information for all UBA servers.
Data Export List contents
¡ Server Name—Name of the UBA server.
¡ Server IP—IP address of the UBA server.
¡ Status—Whether or not the data export is enabled for the UBA server: Enabled or Disabled.
¡ Last Time of Export—Last time when the UBA server exported data, in the format of YYYY-MM-DD hh:mm:ss.
¡ Data Export Log—Allows you to click the Data Export Log
icon ![]() to view the data export logs over a specific time range for the UBA
server.
to view the data export logs over a specific time range for the UBA
server.
¡ Modify—Allows you click the Modify icon ![]() to modify data
export configuration for the UBA server.
to modify data
export configuration for the UBA server.
Viewing data export logs
1. Access the Settings page.
2. Click the Data Export
link or icon ![]() .
.
The Data Export page opens and displays data export information for all UBA servers.
3. Click the Data Export Log icon ![]() for a UBA server.
for a UBA server.
The Data Export Log page opens. By default, the page displays data export logs over last seven days.
Data Export Log List contents
¡ Date of Exported Data—Date when the exported data is generated, in the format of YYYY-MM-DD.
¡ Table Name—Name of the exported table in the database.
¡ File Name—Name of the exported file.
¡ Exported Time—Time when the data is exported, in the format of YYYY-MM-DD hh:mm:ss.
¡ Count—Number of entries in the exported file.
¡ Export Result—Result of the export.
4. To change the query time for data export logs, do one of the following tasks:
¡ Enter time in the From and To fields in the format of YYYY-MM-DD.
¡ Click the From and To fields and set the time on the calendar that opens.
To restore the default query time, click Reset.
Modifying the data export configuration
1. Access the Settings page.
2. Click the Data Export
link or icon ![]() .
.
The Data Export page opens and displays data export information for all UBA servers.
3. Click the Modify
icon ![]() for the UBA server
that you want to modify
for the UBA server
that you want to modify
The Modify page opens.
4. Select the Enable Data Export option to enable the data export function.
By default, the data export function is disabled.
5. Select the Trigger Data Export by Data Space Alarm option as needed.
If the Trigger Data Export by Data Space Alarm option is selected, the UBA server automatically exports the oldest data when the data space alarms occur. If you do not select the Trigger Data Export by Data Space Alarm option, the UBA server can export data according to only the log lifetime.
6. In the Path of Exported File field, enter the path of exported files.
7. Select Enable FTP Upload as needed, and configure the following parameters:
¡ FTP Server IP—Enter the IPv4 address of the FTP server.
¡ FTP Port—Enter the port number of the FTP server, which must be the same as that configured on the FTP server. The default is 21.
¡ FTP Main Directory—Enter the FTP main directory in format such as :/home/transfer. Make sure the FTP user has the read and write permissions to this directory.
¡ FTP Username—Enter the FTP user name.
¡ FTP Password—Enter the FTP user password.
¡ Delete the file after saving it through FTP—Select this option to enable the system to delete the exported files from the storage path after they are uploaded to the FTP server. If you do not select this option, the exported files still remain in the storage path after they are uploaded to the FTP server.
After the configuration, UBA uploads exported files saved on the UBA server to the specified directory of the FTP server.
8. Click OK.
Auditing the exported log files
You can use the log file audit tool provided by UBA to audit the exported log files.
JRE is required for the log file audit tool. Before using the log file audit tool for the first time, download JRE by click the If the log file audit tool fails to run remotely, please download and install JRE link.
To audit the exported log files:
1. Access the Settings page.
2. Click the Data Export
link or icon ![]() .
.
The Data Export page opens and displays data export information for all UBA servers.
3. Click Log File Audit to download the log file audit tool.
4. Run the log file audit tool.
5. In the Basic Settings area, perform the following tasks:
a. Click File Path. On the dialog box that opens, select the directory where the exported log files are located.
b. In the Max Displayed Entries For Audit field, enter a value in the range of 1 to 100000, and click Set.
6. In the Basic Conditions area, perform the following tasks:
a. Click Start Time and End Time to set the query time.
b. Select one or more query conditions and specify the corresponding values. Options are Source, Destination, Source Port, Destination Port, Protocol, Application, and Device. Select Meet All if you want to audit log files meeting all query conditions you have selected. Select Meet Any if you want to audit log files meeting any of the query conditions you have selected.
7. In the Special Conditions area, perform the following tasks:
a. Select the Special Conditions option.
b. Select one special condition and configure parameters for the special condition.
8. Click Query.
The Audit Result page opens and displays all matching log files.
9. Click Save to save the audit results.
Managing applications
The application management function allows you to manage the following types of applications:
· Layer 4 applications—Applications that are identified by the combination of the protocol and the port. For example, the combination of TCP and port 80 identifies HTTP applications. UBA predefines more than 200 common Layer 4 applications. You can also create Layer 4 applications by specifying the protocol and the port if necessary.
· Layer 7 applications—Applications that use dynamic ports and are identified by the characteristics of Layer 7 data, such as BT, and eDonkey, and other P2P applications. Applications that use dynamic ports are common in most networks. These applications consume considerable UBA system resources. UBA predefines most of the applications that use dynamic ports as Layer 7 applications, such as BTDC, eDonkey, and MSN. You can also create Layer 7 applications by specifying the regular expression strings that UBA uses to compare against the contents of the Layer 7 portion of IP packet if necessary. Layer 7 application identification is applicable to only flow records that are collected from probes.
Viewing the application list
1. Access the Settings page.
2. Click the Application
Management link or icon ![]() .
.
The Application Management page opens and displays all predefined applications and custom applications.
Application List contents
¡ Application—Name of the application. You can click the application name to view application details.
¡ Protocol—Protocol type for the application.
¡ Port—Port number for the Layer 4 application. This field is empty for Layer 7 application.
¡ Application Type—Layer 4 or Layer 7.
¡ Description—Description for the application.
¡ Enable—Whether the application is enabled: Yes or No.
¡ Pre-defined—Whether the application is predefined: Yes or No.
¡ Modify—Allows you to click the Modify icon ![]() to modify
application information.
to modify
application information.
¡ Delete—Allows you to click the Delete icon ![]() to delete a
custom application.
to delete a
custom application.
Querying applications
UBA provides basic query and advanced query.
Performing basic query
1. Access the Application Management page.
2. In the query box ![]() , enter
an application name.
, enter
an application name.
This field support fuzzy matching.
3. Click the Query
icon ![]() .
.
The application list displays all applications that match the query criterion.
Performing advanced query
1. Access the Application Management page.
2. Click the Advanced
icon ![]() next to the query box to expand the query area.
next to the query box to expand the query area.
3. Specify one or more of the following query criteria:
¡ Application—Enter an application name. This field supports fuzzy matching.
¡ Protocol—Select a protocol type from the Protocol list. Options are TCP, UDP, and TCP/UDP.
¡ Port—Enter a port number in the range of 1 to 65535, such as 9020. You can also enter a port number range, such as 4000-4200. This field does not take effect when you add a Layer 7 application.
¡ Application Type—Select an application type from the Application Type list. Options are Layer 4, Layer 7, and All.
¡ Pre-defined—Select Yes from the Pre-defined list if you want to query for predefined applications. Select No from the Pre-defined list if you want to query for custom applications. Select Not limited from the Pre-defined list if you want to query for both predefined and custom applications.
Empty fields are ignored.
4. Click Query.
The application list displays all applications that match the query criteria.
To restore the default of all query criteria and display all applications in the list, click Reset.
Adding an application
When you add a Layer 4 application, follow these restrictions and guidelines:
· A custom application takes precedence over a predefined application when the port number or port number range of the custom application is the same as or overlaps with that of the predefined application.
· If the host IP of an application is the same as that of an existing application, the protocol type and port number of the application cannot both be the same as those of the existing application.
To add an application:
1. Access the Application Management page.
2. In the application list, click Add.
The Add Application page opens.
3. In the Application field, enter an application name.
4. In the Description field, enter a description for the application.
5. From the Protocol list, select a protocol type. Options are TCP, UDP, and TCP/UDP.
If you select TCP/UDP, you will add two applications to the application list, one using TCP and the other using UDP.
6. From the Application Type list, select an application type. Options are Layer 4 and Layer 7.
7. If you selected Layer 4, perform the following tasks:
a. In the Port field, enter the port number in the format of 9020 or 4000-4200. The port number is in the range of 1 to 65535.
b. In the Host IP field, enter the host IP address and click Add next to the Host IP field.
You can enter an IP address, an IP segment in dotted decimal notation or CIDR notation, or an IP address range. Make sure no two IP addresses, IP segments, or IP address ranges entered in the Host IP field overlap.
An example of a valid IP address entry:
10.153.89.10
An example of a valid network/subnet mask entry in dotted decimal notation:
10.153.89.0/255.255.255.0
An example of a valid network/subnet mask entry using CIDR notation:
10.153.89.0/24
An example of a valid IPv4 address range entry:
1.1.1.1-2.2.2.2
An example of a valid IPv6 address entry:
a001:410:0:1::1
An example of a valid IPv6 address and subnet mask entry using CIDR notation:
a001:410:0:1::1/64
An example of a valid IPv6 address entry:
a001:410:0:1::1- a001:410:0:1::100
To delete a host IP, select the host IP and click Delete next to the Host IP List field. You can specify up to 50 host IP entries.
8. If you selected Layer 7, perform the following tasks:
a. In the Regular Expression field, enter a regular expression string that UBA will use to identify Layer 7 applications. For more information about regular expressions, see "Regular expressions in UBA."
b. Select Yes from the Enable list if you want to enable the application. Select No if you do not want to disable the application.
9. Click OK to create the application.
Batch importing applications
UBA allows you to import custom applications from a CSV file in batches. The CSV file cannot be larger than 2MB and must be encoded in ANSI. Each line of the file defines one application, including the application name, protocol, port number, and application description.
To import custom applications to UBA in batches:
1. Access the Application Management page.
2. In the application list, click Import.
The Import Application page opens.
3. Click Browse.
The page for selecting an application definition file opens.
4. Select the application definition file to be imported, and click Open.
IMC will automatically populate Application Definition File field with the file's name.
5. Click Upload File.
UBA starts to resolve the file contents. The Import Application page will be refreshed to display the resolution result in the application List.
Imported Application List contents
¡ Line NO.—Number of the line that holds the application.
¡ Application—Name of the application, which is defined by the first column of the file.
¡ Protocol—Protocol used by the application, which is defined by the second column of the file.
¡ Port—Port number used by the application, which is defined by the third column of the file.
¡ Description—Description for the application, which defined by the fourth column of the file.
¡ Status—Status of the application. After UBA finishes the resolution, the correct status of an application is To be imported. If prompted wrong status, check the file format.
6. Click Import.
If the import succeeds, the Status field on the Application List displays Successful. If the import is failed, the Status field shows the reason for the failure.
7. Click Back to return to the Application Management page.
Modifying an application
1. Access the Application Management page.
2. In the application list, click the Modify
icon ![]() for the application you want to modify.
for the application you want to modify.
The Modify Application page opens.
3. Modify application parameter as needed.
For a predefined application, you cannot modify the Protocol, Application Type, and Port fields. For a custom application, you cannot modify the Protocol and Application Type fields. For more information about modifying application parameters, see "Adding an application."
4. Click OK.
Deleting applications
You can delete only custom applications.
To delete a custom application from UBA:
1. Access the Application Management page.
2. In the application list, click the Delete icon ![]() for the
application you want to delete.
for the
application you want to delete.
A confirmation dialog box opens.
3. Click OK.
Deleting applications in batches
1. Access the Application Management page.
2. In the application list, Select one or more applications.
3. Click Batch Delete.
4. Click OK to confirm the deletion of the selected applications.
Regular expressions in UBA
If you selected Layer 7 from the Application Type list to add an application, you must enter a regular expression in the Regular Expression field that UBA will use to identify Layer 7 applications.
A regular expression contains 1 to 255 characters in hexadecimal notation or in text string. The hexadecimal notation contains \x01 through \xff. The text string can contain letters, digits, and symbols (or known as metacharacters).
The metacharacters in regular expression
The following terms describe the metacharacters in a regular expression.
· Brackets ([])—A bracket expression matches a single character contained within the brackets. For example, [abc] matches a, b, or c.
· Vertical bar (|)—The alternation operator matches either the expression before or the expression after the operator. For example, ab | cd matches ab or cd.
· Parentheses (())—Defines a subexpression. For example, a(b|c)d matches abd or acd, but not ab, cd, or abcd.
· Dot (.)—Matches any single character. For example, a.b matches avb, but not ab or avwb. Contained within a bracket expression, this character matches a literal dot.
· Asterisk (*)—Matches the preceding element zero or more times. For example, a*bc matches bc, abc, aabc, and so on. Contained within a bracket expression, this character matches a literal asterisk.
· Plus sign (+)—Matches the preceding element one or more times. For example, a+bc matches abc, aabc, aaabc, and so on. Contained within a bracket expression, this character matches a literal plus sign.
· Question mark (?)—Matches the preceding element zero or one time. For example, a?bc only matches bc or abc. Contained within a bracket expression, this character matches a literal question mark.
· Caret (^)—Matches the beginning of a string. For example, ^the matches the string “the man is tall”, but not “is the man tall." A bracket expression containing this character ([^]) matches a single character that is not contained within the brackets. For example, [^abc] matches abcd or ef, but not ac or bc.
· Dollar sign ($)—Matches the end of a string. For example, man$ matches the string “abnormal man”, but not “the man is tall."
· Minus sign (-)—Represents a range if it is not the first or last character within the brackets. For example, [a-c] matches any lower-case character from a to c (that is, a, b, or c). Being the first or last character in a bracket expression, this character matches a literal minus sign.
Regular expression examples
· Example 1
Regular expression ^\x13BitTorrent protocol matches the content of a BitTorrent handshake packet, which starts with hexadecimal character \x13 and is followed with the string “BitTorrent protocol." The regular expression would match “\x13BitTorrent protocol 1.22v”, but not “BitTorrent protocol 1.22v” or “our protocol is \x13BitTorrent protocol”, which do not start with \x13.
· Example 2
Regular expression ^a[bc].*d$ would match abd, ab random words d, or ac random words d, but not aed (in which e is not included in bracket expression [bc]), the abd (which does not start with a), or acde (which does not end with d).
· Example 3
Regular expression a+b? matches any string that contains one or more as followed with zero or one b. It would match ab, a, aa, aab, or cabd, but not bb.
· Example 4
Regular expression a(bc)+d matches any string that contains a and d with the string bc opens one or more times in between. It would match abcd or abcbcbcd, but not abcbd.
Managing system parameters
The system parameters management function allows you adjust system parameters according to the hardware configurations, service requirements, and network environments.
To view and configure UBA basic and advanced parameters:
1. Access the Settings page.
2. Click the Parameters link or icon![]() .
.
The Parameter Management page opens.
3. In the Basic Settings area, configure the following parameters:
¡ Log Lifetime (1-1,824 days)—Enter the number of days you want to retain UBA logs in the Log Lifetime field. The log lifetime is in the range 1 to 1824 days (5 years). The default value is 7 days. If you enable the data export function, the logs whose log lifetime expires are exported from the database to disks of the UBA server. An operator can use the log audit tool to audit the exported log files. After completing the configuration, click OK next to the Log Lifetime field.
¡ Exported File Lifetime (2-1,825 days)—Enter the number of days you want to retain exported log files in the Exported File Lifetime field. The exported file lifetime is in the range of 2 to 1825 days. The default value is 90 days. The lifetime of an exported file is the current time minus the time of logs in the file. After completing the configuration, click OK next to the Exported File Lifetime field.
4. In the Advanced Settings area, configure the following parameters:
¡ Max. Displayed Entries for Audit (1-100,000)—Enter the maximum number of audit results that you want UBA to display. The maximum number of entries displayed is in the range of 1 to 100000. The default value is 10000. After completing the configuration, click OK next to the Max. Displayed Entries for Audit field.
¡ DNS Setting—Enable or disable the DNS resolution function for UBA. If you enable the function, you can specify DNS server IP addresses. When a user queries the host information for an IP address, UBA uses the specified DNS servers to query the domain name for the IP address. To enable the function, select Enable from the DNS Settings list. To add a DNS server IP address, enter a DNS server IP address in the DNS Server IP field and then click Add. Repeat this operation to add more DNS server IP addresses. To delete an existing DNS server IP address, select the IP address and then click Delete. After completing the configuration, click OK next to the DNS Setting field.
|
|
NOTE: You can specify only IPv4 addresses for DNS servers, and you can specify up to five DNS server IP addresses. |
Managing filter strategies
The filter strategies management function allows you to define whether network flow records that UBA receives are processed or discarded by UBA. You can save system resources and improve UBA processing efficiency by using filter strategies.
Create filter strategies before you configuring the UBA server. For a filter strategy to take effect, select the filter strategy in the server configuration. A filter strategy can be used by multiple UBA servers, which avoids unnecessary repetitive configurations.
Each filter strategy has a default filter policy and filter policies defined for every filter condition. Filter conditions are matched based on their orders from up to down in the filter condition list. If a filter condition is matched, the data is processed by the filter policy of the matched filter condition, and the matching process ends. If no filter condition is matched, the data is processed by the default policy (Receive or Discard).
Viewing the filter strategy list
1. Access the Settings page.
2. Click the Filter Strategy link or icon ![]() .
.
The Filter Strategy Management page opens.
Filter Strategy List contents
¡ Name—Name of the filter strategy. You can click the filter strategy name to view filter strategy details.
¡ Description—Description for the filter strategy.
¡ Modify—Allows you to click the Modify icon ![]() to modify the
filter strategy.
to modify the
filter strategy.
¡ Delete—Allows you to click the Delete icon ![]() to delete the
filter strategy.
to delete the
filter strategy.
Viewing filter strategy details
1. Access the Filter Strategy Management page.
2. In the filter strategy list, click a filter strategy name.
The Filter Strategy Details page opens.
Basic Information area
¡ Name—Name of the filter strategy.
¡ Description—Description for the filter strategy.
¡ Default Policy—Default filter policy for the filter strategy: Receive or Discard.
Filter Condition List area
¡ Priority—Priority number of the filter condition. The smaller the number is, the higher the priority is.
¡ Policy—Filter policy for the filter condition: Receive or Discard.
¡ Source Host—Source IP address of the flow record.
¡ Source Port—Source port number of the flow record.
¡ Destination Host—Destination IP address of the flow record.
¡ Destination Port—Destination port number of the flow record.
¡ Protocol—Protocol type of the flow record.
3. Click Back to return to the Filter Strategy Management page.
Adding a filter strategy
1. Access the Filter Strategy Management page.
2. In the filter strategy list, click Add.
The Add Filter Strategy page opens.
3. In the Basic Information area, perform the following tasks:
a. In the Name field, enter a unique filter strategy name.
b. In the Description field, enter a description for the filter strategy.
c. From the Default Policy list, select Receive or Discard.
4. In the Filter Condition List area, click Add. On the Filter Condition Configuration dialog box that opens, perform the following tasks:
a. From the Policy list, select Receive or Discard.
b. In the Source Host field, enter the source IP address.
You can enter an IP address or an IP address segment in dotted decimal notation or CIDR notation.
An example of a valid IP address entry:
10.153.89.10
An example of a valid network/subnet mask in dotted decimal notation:
10.153.89.0/255.255.255.0
A valid network/subnet mask entry in CIDR notation:
10.153.89.0/24
An example of a valid IPv6 address entry:
a001:410:0:1::1
A valid IPv6 address and subnet mask in CIDR notation:
a001:410:0:1::1/64
c. In the Source Port field, enter the source port number.
d. In the Destination Host field, enter the destination IP address.
You can enter an IP address or an IP segment in dotted decimal notation or CIDR notation. The format of the destination IP address is the same as that of the source IP address.
e. In the Destination Port field, enter the destination port number.
f. From the Protocol list, select a protocol type. Options are TCP, UDP, ICMP, and IPv6-ICMP.
g. Click OK.
The new filter condition opens in the filter strategy list. Empty fields are ignored.
h. Repeat the above steps to add more filter conditions.
|
|
NOTE: Add at least one filter condition for a filter strategy. Make sure at least one of the filter conditions you create differs in policy from the Default Policy. |
5. To modify a filter condition, click the Modify icon ![]() for the filter condition,
and modify the filter condition in the same way the filter condition is added.
for the filter condition,
and modify the filter condition in the same way the filter condition is added.
6. To delete a filter condition, click the Delete icon ![]() for the filter condition.
for the filter condition.
7. To re-prioritize filter conditions, click
the ![]() icon in the Sort field for the filter condition you want to move up
in the list. Click the
icon in the Sort field for the filter condition you want to move up
in the list. Click the ![]() icon in the Sort field for the filter condition you want to move
down in the list.
icon in the Sort field for the filter condition you want to move
down in the list.
8. On the Add Filter Strategy page, click OK.
Modifying a filter strategy
1. Access the Filter Strategy page.
2. In the filter strategy list, click the Modify icon ![]() for the filter
strategy you want to modify.
for the filter
strategy you want to modify.
The Modify Filter Strategy page opens.
3. Modify filter strategy parameters as needed.
For more information about modifying filter strategy parameters, see "Adding a filter strategy."
4. Click OK.
Deleting a filter strategy
1. Access the Filter Strategy page.
2. In the filter strategy list, click the Delete icon ![]() for the filter
strategy you want to delete.
for the filter
strategy you want to delete.
A confirm dialog box opens.
3. Click OK.
Managing anomaly detection
UBA collects statistics on flow records and compares the statistics with the thresholds in the anomaly detection templates. If a threshold is exceeded, UBA generates an alarm and informs the administrator of the alarm through the IMC alarm management module.
UBA provides the following predefined anomaly detection templates. You cannot add or delete anomaly detection templates, but you can modify them.
· TCP Null Scan—Used to determine whether a port is closed on the target host. The attacker sends to the target host port a TCP packet with no flags in the packet header. If the port is closed, the host returns a TCP RST packet. Otherwise, the packet is discarded.
· TCP Fin Scan—Used to determine port status and the operating system version (UNIX or Windows) on the target host. The attacker sends to the target host port a TCP packet with the FIN bit set in the packet header. If the port is closed, the host returns a TCP RST packet. Otherwise, the packet is discarded.
· TCP Syn Fin Scan—Indicates that a network attack has occurred. TCP SYN is used to initiate a TCP connection, and cannot be set together with the FIN and RST bits. Other similar combinations include SYN/FIN, SYN/FIN/PSH, SYN/FIN/RST, and SYN/FIN/RST/PSH.
· TCP Xmas Scan—Used to determine whether ports are closed on the target host. The attacker sends to the target host port a TCP packet with the FIN, URG, and PSH bits set in the packet header. If the port is closed, the host returns a TCP RST packet. Otherwise, the packet is discarded.
· UDP Bomb Attack—Used to attack old version operating systems. The attacker fills the UDP header with some invalid values, such as Length values. Some old version operating systems will crash when flooded with such packets.
· Snork Attack—Denial of service (DoS) attack against Windows NT RPC service. This attack is accomplished by sending UDP packets with source port 7, 19, or 135, and destination port 135.
· UDP Flood Attack—UDP-based DoS attack. This attack significantly consumes the network bandwidth and degrades the network performance.
· DNS Rogue Hack—An attack that exploits the DNS protocol to transmit illegal data. The attacker disguises the data as DNS traffic to send through the UDP port 53. Administrators must specify a list of valid DNS servers to distinguish between legitimate and disguised DNS traffic.
· Invalid ToS—Packets that contain invalid ToS values, such as 0, 2, 4, 8, and 16.
· Land Attack—Used to attack a host operating system. This attack is accomplished by sending spoofed packets with source address the same as the destination address, causing the operating system flooded with these packets to crash or "hang."
· Invalid IP Protocol—Spoofed IP packets with protocol numbers equal to or greater than 134. These protocol numbers are unassigned or reserved, and cannot be used in normal networks.
· Corrupt IP Option—Used to attack Windows operating system hosts. The attacker crashes the target Window system or bypasses security checks by sending packets to the system with carefully crafted IP options.
· Time Stamp IP Option—Used to attack NetBSD hosts. The attacker launches a remote DOS attack against the target NetBSD system by flooding the system with TCP packets. The TCP packets contain unmatched IP timestamp options, which causes the NetBSD system to crash.
· Source Route IP Option—The attacker uses IP source options to hide their true address and access restricted areas of a network by specifying a different path.
· Record Route IP Option—The attacker uses IP route record options to gain information about the architecture and topology information of the network through which the IP packets passed.
· Security IP Option—Forged IP packets with security options in the packet header. The IP security option is obsolete and therefore its presence in the IP header is suspect.
· Stream ID IP Option—Forged IP packets with stream ID options in the packet header. The stream ID option is obsolete and therefore its presence in the IP header is suspect.
· Ping of Death Attack—Used to attack hosts or network devices. The attacker sends large ICMP packets of more than 65507 bytes in size, which causes the hosts or network devices that receive these packets to crash, freeze, or reboot.
· Large ICMP Packet—Large ICMP packet attack detection. Typically, ICMP packets contain very short messages. The presence of large ICMP packets might indicate that something is wrong in the network.
· Fragmented ICMP Packet—ICMP fragment detection. Because ICMP packets contain very short messages, there is no legitimate reason for ICMP packets to be fragmented.
· ICMP Redirects—The attacker sends spoofed ICMP redirect packets to the target host to alter its routing table.
· ICMP Destination Unreachable—Some operating systems will drop the connection to a specific network upon receiving an ICMP unreachable packet indicating that the network is unreachable. The attacker uses spoofed ICMP unreachable packets to mislead the target host to cut the connection to a specific network.
· ICMP Request Excess—Used to attack a host operating system. The attacker floods the target host with ICMP echo requests, or ping messages, which significantly consumes the resources and bandwidth of the host.
· ICMP Reply Excess—The attacker uses the ICMP reply messages to probe a host for its operating system information.
· ICMP Source Quench—The attacker uses spoofed ICMP source quench packets to limit the bandwidth available to other users. ICMP source quench packets can reduce the data transmission rate, which will be recovered once the sending of such packets is stopped.
· ICMP Parameter Problem—ICMP packets that contain invalid parameters.
· ICMP Time Exceeded—The attacker sends spoofed ICMP time exceeded messages to either or both of the communication parties to cut their connection.
· DHCP Offer Packet—The attacker sends a spoofed DHCP Offer packet with a random IP address to the host requesting the DHCP service, causing network anomalies.
The anomaly detection templates include the following types:
· Anomaly detection templates that use common parameters (see Table 2).
· Anomaly detection templates that use type-specific parameters in addition to common parameters (see Table 3).
Viewing the anomaly detection template list
1. Access the Settings page.
2. Click the Anomaly
Detection link or icon ![]() .
.
The Anomaly Detection page opens.
Basic Configuration area
¡ Time Window—Select the time window mode for generating anomaly alarms. Options are Fixed and Sliding. If Fixed is selected, the anomaly detection generates only one alarm within every time window duration. If Sliding is selected, the anomaly detection does not generate another alarm for attacks of the same type within the specified time window duration once an alarm is generated. After completing the configuration, click OK next to the Time Window field.
¡ Window Size (1 to 10 min)—Set the size of the time window in the range of 1 to 10 minutes. After completing the configuration, click OK next to the Window Size field.
Anomaly Detection List area
¡ Name—Anomaly that UBA can monitor. You can click the anomaly name to view anomaly details.
¡ Description—Description for the anomaly.
¡ Threshold—Threshold at which the anomaly detection generates an alarm.
¡ Alarm Level—Level of the alarm. Options are Critical, Major, Minor, Warning, and Info.
¡ Enable—Whether or not the anomaly detection is enabled.
¡ Modify—Allows you to click the Modify icon ![]() to
modify the anomaly detection template.
to
modify the anomaly detection template.
Viewing details about an anomaly template that uses common parameters
Table 2 shows the anomaly detection templates that use common parameters.
Table 2 Anomaly detection templates that use common parameters.
|
Template name |
Template name |
Template name |
|
TCP Null Scan |
TCP Fin Scan |
TCP Syn Fin Scan |
|
TCP Xmas Scan |
UDP Bomb Attack |
Snork Attack |
|
UDP Flood Attack |
Invalid ToS |
Land Attack |
|
Invalid IP Protocol |
Corrupt IP Option |
Time Stamp IP Option |
|
Source Route IP Option |
Record Route IP Option |
Security IP Option |
|
Stream ID IP Option |
Fragmented ICMP Packet |
ICMP Redirects |
|
ICMP Destination Unreachable |
ICMP Request Excess |
ICMP Reply Excess |
|
ICMP Source Quench |
ICMP Parameter Problem |
ICMP Time Exceeded |
To view details about an anomaly template that uses common parameters:
1. Access the Anomaly Detection page.
2. In the anomaly detection template list, click the name for an anomaly template that uses common parameters.
The Anomaly Detection Details page opens.
Anomaly Detection Details contents
¡ Name—Anomaly that UBA can monitor.
¡ Description—Description for the anomaly.
¡ Threshold—Threshold at which the anomaly detection generates an alarm.
¡ Alarm Level—Level of the alarm. Options are Critical, Major, Minor, Warning, and Info.
¡ Enable—Whether or not the anomaly detection is enabled.
3. Click Back to return to the Anomaly Detection page.
Viewing details about an anomaly template that uses type-specific parameters
Table 3 shows the anomaly detection templates that use their respective specific parameters.
Table 3 Anomaly detection templates that uses type-specific parameters
|
Template name |
Type-specific parameters |
|
DNS Rogue Hack |
Host IP List—List of IP addresses of valid DNS servers. |
|
Large ICMP Packet |
Packet Size—ICMP packet size threshold. |
|
Ping of Death Attack |
Packet Size—Ping packet size threshold. |
|
DHCP Offer Packet |
· Host IP List—List of IP addresses of valid DNS servers. · DHCP Monitor Time—Includes one or more days of a week, the start time, and the end time. The start time and end time are in the format of hh:mm. |
To view details about an anomaly template that uses type-specific parameters:
1. Access the Anomaly Detection page.
2. In the anomaly detection template list, click the name for an anomaly template that uses type-specific parameters.
The Anomaly Detection Details page opens.
For more information about description for type-specific parameters, see Table 3.
Modifying an anomaly template that uses common parameters
The methods for modifying anomaly templates that uses common parameters are the same. This example uses the TCP Fin Scan template.
To modify the TCP Fin Scan template:
1. Access the Anomaly Detection page.
2. In the anomaly detection template list, click
the Modify icon ![]() for TCP Fin Scan.
for TCP Fin Scan.
The Modify Anomaly Detection page opens. You cannot modify the Monitor Name and Description fields.
3. In the Threshold field, enter a new threshold.
4. From the Alarm Level list, select an alarm level. Options are Critical, Major, Minor, Warning, and Info.
5. Select whether to enable anomaly detection for TCP FIN Scan packets.
6. Click OK.
Modifying an anomaly template that uses type-specific parameters
The following information describes modifying the type-specific parameters for each anomaly template that uses type-specific parameters. For more information about modifying common parameters for anomaly templates that uses type-specific parameters, see "Modifying an anomaly template that uses common parameters."
DHCP Offer Packet
1. Access the Anomaly Detection page.
2. In the anomaly detection template list, click
the Modify icon ![]() for DHCP Offer Packet.
for DHCP Offer Packet.
The Modify Anomaly Detection page opens.
3. In the Valid DHCP Servers area, enter the IP address of a valid DHCP server in the Host IP field, and click Add.
The IP address opens in the Host IP List field. You can specify up to 10 IP addresses. To delete an IP address, select the IP address and click Delete.
4. In the DHCP Monitor Time area, perform the following tasks:
a. Select one or more days of a week for the Monitor Data field.
b. In the Start Time field, enter the start time in the format of hh:mm.
c. In the End Time field, enter the end time in the format of hh:mm.
5. Click OK.
DNS Rogue Hack
1. Access the Anomaly Detection page.
2. In the anomaly detection template list, click
the Modify icon ![]() for DNS Rogue Hack.
for DNS Rogue Hack.
The Modify Anomaly Detection page opens.
3. In the Host IP field, enter the IP address of a valid DNS server, and click Add.
The IP address opens in the Host IP List field. You can specify up to 10 IP addresses. To delete an IP address, select the IP address and click Delete.
4. Click OK.
Large ICMP Packet
1. Access the Anomaly Detection page.
2. In the anomaly detection template list, click
the Modify icon ![]() for Large ICMP Packet.
for Large ICMP Packet.
The Modify Anomaly Detection page opens.
3. In the Packet Size field, enter the ICMP packet size threshold.
If the size of an ICMP packet exceeds the threshold, UBA monitors the ICMP packet.
4. Click OK.
Ping of Death Attack
1. Access the Anomaly Detection page.
2. In the anomaly detection template list, click
the Modify icon ![]() for Ping of Death Attack.
for Ping of Death Attack.
The Modify Anomaly Detection page opens.
3. In the Packet Size field, enter the ping packet size threshold.
If the size of a ping packet exceeds the threshold, UBA monitors the ICMP packet.
4. Click OK.
Managing general audit
General audit tasks allow you to audit user behaviors according to the source IP address, destination IP address, source port, destination port, protocol, application, packet count, flux, and device.
Viewing general audit task details
1. Click the Service tab.
2. From the navigation tree, select Traffic Analysis and Audit > Settings.
The Settings page opens.
3. Click the User Behavior Audit Management link
or icon ![]() .
.
The User Behavior Audit Management page opens and displays all user behavior audit tasks that have been added.
4. Click a user behavior task whose type is General.
The Custom General Audit Detail page opens.
Basic Info area
¡ Name—Name of the general audit task.
¡ Server—Name of the UBA server that audits user behaviors for the general audit task.
¡ Reader—Operator groups that have the right to view the task.
Basic Audit Condition area
¡ Custom Query—Query type for the audit conditions: Meet All or Meet Any.
¡ Access User—Account used by the access user that is managed by UAM.
¡ Terminal Type—Type of the endpoint used by the access user.
¡ Operating System—Operating system of the endpoint used by the access user.
¡ Source—Source IP address of the user behavior.
¡ Destination—Destination IP address of the user behavior.
¡ Source Port—Source port number of the user behavior.
¡ Destination Port—Destination port number of the user behavior.
¡ Protocol—Protocol type of the user behavior: Unlimited, TCP, UDP, ICMP, or IPv6-ICMP.
¡ Application—Applications of the user behavior.
¡ Device—IP address of the device or probe that generates flow records.
The Access User, Terminal Type, and Operating System fields are displayed only when UBA works with UAM.
5. Click Back to return to the User Behavior Audit Management page.
Adding a general audit task
1. Access the User Behavior Audit Management page.
2. In the user behavior audit task list, click Add.
The Select Audit Type page opens.
3. Select General Audit and click Next.
The Add Custom General Audit page opens.
4. In the Basic Information area, perform the following tasks:
a. In the Name field, enter the task name.
b. From the Server list, select the audit server.
c. Click Select next to the Reader field. On the page that opens, select operator groups that have the right to view the task, and click OK.
5. In the Basic Audit Condition area, perform the following tasks:
a. Select Meet All or Meet Any.
If you select Meet All, UBA audits only flow records that meet all of the audit conditions you will select. If you select Meet Any, UBA audits flow records that meet any of the audit conditions you will select.
b. Select the Access User option and perform the following tasks:
- Enter the account name used by the access user that is managed by UAM in the Access User field.
- Select the terminal type from the Terminal Type list and the operating system from the Operating System list. By default, the terminal type and the operating system are unlimited.
The Access User, Terminal Type, and Operating System fields are displayed only when UBA works with UAM. For more information about UBA working with UAM, see "Showing/hiding access users."
When you select the Access User option, you cannot select the Source and Destination options.
c. Select the Source and Destination options, and enter the source and destination addresses.
You can enter an IP address, an IP segment, or an IP address range.
An example of a valid IPv4 address entry:
10.153.89.1
An example of a valid IPv4 segment:
10.153.89.*
An example of a valid IPv4 address range entry:
1.1.1.1-2.2.2.2
An example of a valid IPv6 address entry:
a001:410:0:1::1
An example of a valid IPv6 address and subnet mask entry using CIDR notation:
a001:410:0:1::1/64
An example of a valid IPv6 address entry:
a001:410:0:1::1-a001:410:0:1::100
d. Select the Source Port and Destination Port options and enter the source and destination port numbers in the format of 21 or 21-100.
e. Select the Protocol option and select a protocol type from the Protocol list. Options are Unlimited, TCP, UDP, ICMP, and IPv6-ICMP.
f. Select the Application option and select one or more applications. If you select the Application option, you cannot select the Source Port, Destination Port, and Protocol options.
To select applications:
- Click Select next to the Application field.
- On the Query Applications page that opens, enter an application name in the Application field. This field supports fuzzy matching. Select Not Limited, Yes, or No from the Pre-Defined list.
- Click Query.
The application list displays all applications that match the criteria. To clear the criteria, click Reset. To display all applications, specify no criteria and click Query.
- In the application list, select one or applications.
You can select up to five applications.
- Click OK to return to the Add Custom General Audit page.
g. Select the Device option and enter a single IPv4 or IPv6 device IP address in the Device field.
The device is the switch, router, or probe that generates flow records.
6. Click OK.
|
|
NOTE: You must configure the Name and Server fields. You can configure other fields as needed. |
Viewing audit results for a general audit task
Querying audit results for a general audit task
1. Access the User Behavior Audit Management page.
2. Click the Audit icon
![]() for the general audit task for which you want to view audit
results.
for the general audit task for which you want to view audit
results.
The audit result page for the general audit task opens.
For more information about querying audit results for a general audit task, see "Querying audit results for an audit task."
Viewing the audit result list for a general audit task
The audit result list for a general audit task displays the audit results for the audit task in the specified time range.
If the number of audit result entries exceeds the value of the Max. Displayed Entries for Audit field in the system parameters configuration, for example, 1000, the list displays only 1000 audit result entries. If you want to view more audit result entries, click Continue. The list displays the next 1000 audit result entries each time you click Continue.
The audit result list for a general audit task displays the following contents:
· Start Time—Start time of the user behavior.
· End Time—End time of the user behavior.
· Source—Source IP address of the user behavior.
· Destination—Destination IP address of the user behavior.
· Source Port—Source port number of the user behavior.
· Destination Port—Destination port number of the user behavior.
· Protocol—Protocol type of the user behavior: TCP, UDP, ICMP, or IPv6-ICMP.
· Application—Applications of the user behavior.
· Packets Count—Number of packets.
· Flux—Size of the generated traffic.
· Device—IP address of the device or probe that generates flow records.
· Terminal Type—Type of the endpoint used by the access user.
· Operating System—Operating system of the endpoint used by the access user.
The Terminal Type and the Operating System columns are displayed only when UBA works with UAM.
Viewing audit results for a general audit task by group
You can select one of the following group types from the Group list: Not Group, Source, Destination, Source Port, Destination Port, Protocol, Application, Source-Destination, SPort-DPort, Source-SPort, Desination-DPort, Source-DPort, Destination-SPort, Terminal Type, and Operating System. The Terminal Type and the Operating System options are displayed only when UBA works with UAM.
In the audit result list, select a group type from the Group list. The audit result list displays values in the following columns based on the group type:
· Packets Count—Number of packets.
· Flux—Total size of the generated traffic.
· Count—Count of audit results.
By default, the audit result list displays the grouped results in descending order of the value of the Count column. This helps you to view the hosts, ports, protocols, applications, or others whose user behaviors are more active. For example, if you select Source from the Group list, you can quickly view the source IP addresses whose user behaviors are more active.
Modifying a general audit task
1. Access the User Behavior Audit Management page.
2. In the user behavior audit task list, click
the Modify icon ![]() for the general
audit task you want to modify.
for the general
audit task you want to modify.
The Modify Custom General Audit page opens.
3. Modify parameters for the general audit task as needed.
You cannot modify the Name field. For more information about modifying other general audit task parameters, see "Adding a general audit task."
4. Click OK to return to the User Behavior Audit Management page.
Deleting general audit tasks
Deleting a general audit task from UBA does not delete the flow records associated with the task prior to the deletion.
To delete one or more general audit tasks:
1. Access the User Behavior Audit Management page.
2. In the user behavior audit task list, perform one of the following tasks:
¡ To delete
a general audit task, click the Delete
icon ![]() for the general audit task and click OK in the confirmation dialog box
that opens.
for the general audit task and click OK in the confirmation dialog box
that opens.
¡ To delete general audit tasks in bathes, select one or more general audit tasks, click Delete, and click OK in the confirmation dialog box that opens.
Managing NAT audit
NAT audit tasks allow you to audit user behaviors according to the IP addresses and the port before and after translation.
Viewing NAT audit task details
1. Click the Service tab.
2. From the navigation tree, select Traffic Analysis and Audit > Settings.
The Settings page opens.
3. Click the User Behavior Audit Management link
or icon ![]() .
.
The User Behavior Audit Management page opens and displays all user behavior audit tasks that have been added.
4. Click a user behavior task whose type is NAT.
The Custom NAT Audit Detail page opens.
Basic Info area
¡ Name—Name of the NAT audit task.
¡ Server—Name of the UBA server that audits user behaviors for the NAT audit task.
¡ Reader—Operator groups that have the right to view the task.
NAT Condition area
¡ NAT IP—Source IP address after translation.
¡ NAT Port—Source port number after translation.
¡ Operator—Reason why NAT flow records are generated: Unlimited, Reserved, Ended Normally, Aged upon Timeout, Aged upon Configuration Change, Aged for Resource Insufficiency, NAT Mapping, Long-lasting, Removed Due to Substitution, Creation Records, Undefined Flows, or Others.
Basic Audit Condition area
¡ Custom Query—Query type for the audit conditions: Meet All or Meet Any.
¡ Access User—Account used by the access user that is managed by UAM.
¡ Terminal Type—Type of the endpoint used by the access user.
¡ Operating System—Operating system of the endpoint used by the access user.
¡ Source—Source IP address before translation.
¡ Destination—Destination IP address before translation.
¡ Source Port—Source port number before translation.
¡ Destination Port—Destination port number before translation.
¡ Protocol—Protocol type used by the NAT packet: Unlimited, TCP, UDP, ICMP, or IPv6-ICMP.
¡ Application—Applications used by the NAT packet.
¡ Device—IP address of the device or probe that generates flow records.
The Access User, Terminal Type, and Operating System fields are displayed only when UBA works with UAM.
5. Click Back to return to the User Behavior Audit Management page.
Adding a NAT audit task
1. Access the User Behavior Audit Management page.
2. In the user behavior audit task list, click Add.
The Select Audit Type page opens.
3. Select NAT Audit and click Next.
The Add Custom NAT Audit page opens.
4. In the Basic Information area, perform the following tasks:
a. In the Name field, enter the task name.
b. From the Server list, select the audit server.
c. Click Select next to the Reader field. On the page that opens, select operator groups that have the right to view the task, and click OK.
5. In the Audit Condition area, perform the following tasks:
a. Select the NAT IP option and enter the NAT IP addresses.
You can enter an IP address, an IP segment, or an IP address range.
An example of a valid IPv4 address entry:
10.153.89.1
An example of a valid IPv4 segment:
10.153.89.*
An example of a valid IPv4 address range entry:
1.1.1.1-2.2.2.2
An example of a valid IPv6 address entry:
a001:410:0:1::1
An example of a valid IPv6 address and subnet mask entry using CIDR notation:
a001:410:0:1::1/64
An example of a valid IPv6 address entry:
a001:410:0:1::1-a001:410:0:1::100
b. Select the NAT Port option and enter the NAT port number in the format of 21 or 21-100.
c. Select the Operator option and select an operator that is used to identify the cause of terminating a network flow from the Operator list. Options are:
- Unlimited—Unlimited.
- Reserved—Reserved.
- Ended Normally—Indicates the flow ends normally.
- Aged upon Timeout—Indicates the flow is aged due to timeout.
- Aged upon Configuration Change—Indicates the flow aged due to changing Clear/Configuration.
- Aged for Resource Insufficiency—Indicates the flow aged due to the insufficient resource.
- NAT Mapping—Indicates one-on-one NAT mapping. Only the source IP address, transferred IP address, and time fields are valid in the flow records.
- Long-lasting—Indicates the intermediate forwarding records last a long time.
- Removed Due to Substitution—Indicates the flow is removed due to substitution operation.
- Creation Records—Indicates the records of creating a flow.
- Undefined Flows—Indicates a flow that is not defined in the system.
- Others—Other reasons that cause flow termination.
6. In the Basic Audit Condition area, perform the following tasks:
a. Select Meet All or Meet Any.
If you select Meet All, UBA audits only flow records that meet all of the audit conditions you will select. If you select Meet Any, UBA audits flow records that meet any of the audit conditions you will select.
b. Select the Access User option, enter the access user name in the Access User field, and select the terminal type from the Terminal Type list and the operating system from the Operating System list.
The Access User, Terminal Type, and Operating System fields are displayed only when UBA works with UAM. For more information about UBA working with UAM, see "Showing/hiding access users."
The default settings for the Terminal Type and Operating System fields are Unlimited. When you select the Access User option, you cannot select the Source and Destination options.
c. Select the Source and Destination options, and enter the source and destination addresses.
You can enter an IP address, an IP segment, or an IP address range.
An example of a valid IPv4 address entry:
10.153.89.1
An example of a valid IPv4 segment:
10.153.89.*
An example of a valid IPv4 address range entry:
1.1.1.1-2.2.2.2
An example of a valid IPv6 address entry:
a001:410:0:1::1
An example of a valid IPv6 address and subnet mask entry using CIDR notation:
a001:410:0:1::1/64
An example of a valid IPv6 address entry:
a001:410:0:1::1-a001:410:0:1::100
d. Select the Source Port and Destination Port options and enter the source and destination port numbers in the format of 21 or 21-100.
e. Select the Protocol option and select a protocol type from the Protocol list. Options are Unlimited, TCP, UDP, ICMP, and IPv6-ICMP.
f. Select the Application option and select one or more applications. If you select the Application option, you cannot select the Source Port, Destination Port, and Protocol options.
To select applications:
- Click Select next to the Application field.
- On the Query Applications page that opens, enter an application name in the Application field. This field supports fuzzy matching. Select Not Limited, Yes, or No from the Pre-Defined list.
- Click Query.
The application list displays all applications that match the criteria. To clear the criteria, click Reset. To display all applications, specify no criteria and click Query.
- In the application list, select one or applications.
You can select up to five applications.
- Click OK to return to the Add Custom NAT audit page.
g. Select the Device option and enter a single IPv4 or IPv6 device IP address in the Device field.
7. Click OK.
|
|
NOTE: You must configure the Name and Server fields. You can configure other fields as needed. |
Viewing the audit results for a NAT audit task
Querying audit results for a NAT audit task
1. Access the User Behavior Audit Management page.
2. Click the Audit icon
![]() for the NAT audit task for which you want to view audit results.
for the NAT audit task for which you want to view audit results.
The audit result page for the NAT audit task opens.
For more information about querying audit results for a NAT audit task, see "Querying audit results for an audit task."
Viewing the audit result list for a NAT audit task
The audit result list for a NAT audit task displays the audit results for the audit task in the specified time range.
If the number of audit result entries exceeds the value of the Max. Displayed Entries for Audit field in the system parameters configuration, for example, 1000, the list displays only 1000 audit result entries. If you want to view more audit result entries, click Continue. The list displays the next 1000 audit result entries each time you click Continue.
The audit result list for a NAT audit task displays the following contents:
· Start Time—Start time of the NAT translation.
· End Time—End time of the NAT translation.
· Source—Source IP address before translation.
· Destination—Destination IP address before translation.
· Source Port—Source port number before translation.
· Destination Port—Destination port number before translation.
· Protocol—Protocol type used by the NAT packet: TCP, UDP, ICMP, or IPv6-ICMP.
· Application—Applications used by the NAT packet.
· NAT IP—Source IP address after translation.
· NAT Port—Source port number after translation.
· Terminal Type—Type of the endpoint used by the access user.
· Operating System—Operating system of the endpoint used by the access user.
The Terminal Type and the Operating System columns are displayed only when UBA works with UAM.
Viewing audit results for a NAT audit task by group
You can select one of the following group types from the Group list: Not Group, Source, Destination, Source Port, Destination Port, Protocol, Application, Source-Destination, SPort-DPort, Source-SPort, Desination-DPort, Source-DPort, Destination-SPort, Terminal Type, and Operating System. The Terminal Type and the Operating System options are displayed only when UBA works with UAM.
In the audit result list, select a group type from the Group list. The audit result list displays the count of audit results in the Count column based on the group type.
By default, the audit result list displays the grouped results in descending order of the value of the Count column. This helps you to view the IP addresses, ports, or others whose NAT translation are more active.
Modifying a NAT audit task
1. Access the User Behavior Audit Management page.
2. In the user behavior audit task list, click
the Modify icon ![]() for the NAT audit
task you want to modify.
for the NAT audit
task you want to modify.
The Modify Custom NAT audit page opens.
3. Modify parameters for the NAT audit task as needed.
You cannot modify the Name field. For more information about modifying other NAT audit task parameters, see "Adding a NAT audit task."
4. Click OK to return to the User Behavior Audit Management page.
Deleting NAT audit tasks
Deleting a NAT audit task from UBA does not delete the flow records associated with the task prior to the deletion.
To delete one or more NAT audit tasks:
1. Access the User Behavior Audit Management page.
2. In the user behavior audit task list, perform one of the following tasks:
¡ To
delete a NAT audit task, click the Delete icon ![]() for the NAT audit task and click OK in the confirmation dialog box that opens.
for the NAT audit task and click OK in the confirmation dialog box that opens.
¡ To delete NAT audit tasks in bathes, select one or more NAT audit tasks, click Delete, and click OK in the confirmation dialog box that opens.
Managing Web visiting audit
Web visiting audit tasks allow you to audit user behaviors of Web visiting and view websites that users have visited and resources that users have browsed.
Viewing Web visiting audit task details
1. Click the Service tab.
2. From the navigation tree, select Traffic Analysis and Audit > Settings.
The Settings page opens.
3. Click the User Behavior Audit Management link
or icon ![]() .
.
The User Behavior Audit Management page opens and displays all user behavior audit tasks that have been added.
4. Click a user behavior task whose type is Web Visiting.
The Custom Web Visiting Audit Detail page opens.
Basic Info area
¡ Name—Name of the Web visiting audit task.
¡ Server—Name of the UBA server that audits user behaviors for the Web visiting audit task.
¡ Reader—Operator groups that have the right to view the task.
Web Visiting Condition area
¡ Web Site—Address of the website that users visit.
¡ Title—Title of the website that users visit.
¡ URI—URI of the website that users visit.
Audit Condition area
¡ Custom Query—Query type for the audit conditions: Meet All or Meet Any.
¡ Access User—Account used by the access user that is managed by UAM.
¡ Terminal Type—Type of the endpoint used by the access user.
¡ Operating System—Operating system of the endpoint used by the access user.
¡ Source—Source IP address of the user that visit the website.
¡ Destination—IP address of the website.
¡ Destination Port—Port number of the website.
¡ Device—IP address of the device or probe that generates flow records.
The Access User, Terminal Type, and Operating system fields are displayed only when UBA works with UAM.
5. Click Back to return to the User Behavior Audit Management page.
Adding a Web visiting audit task
1. Access the User Behavior Audit Management page.
2. In the user behavior audit task list, click Add.
The Select Audit Type page opens.
3. Select Web Visiting and click Next.
The Add Custom Web Visiting Audit page opens.
4. In the basic information area, perform the following tasks:
a. In the Name field, enter the task name.
b. From the Server list, select the audit server.
c. Click Select next to the Reader field. On the page that opens, select operator groups that have the right to view the task, and click OK.
5. In the Web Visiting Condition area, perform the following tasks:
a. Select the Web Site option and enter the address of the website.
b. Select the Title option and enter the title of the website.
c. Select the URI option and enter the URI of the website.
6. In the Audit Condition area, perform the following tasks:
a. Select Meet All or Meet Any.
If you select Meet All, UBA audits only flow records that meet all audit conditions you will select. If you select Meet Any, UBA audits flow records that meet any of the audit conditions you will select.
b. Select the Access User option and perform the following tasks:
- Enter the account name used by the access user that is managed by UAM in the Access User field.
- Select the terminal type from the Terminal Type list and the operating system from the Operating System list. By default, the terminal type and the operating system are unlimited.
The Access User, Terminal Type, and Operating system fields are displayed only when UBA works with UAM. For more information about UBA working with UAM, see "Showing/hiding access users"
When you select the Access User option, you cannot select the Source and Destination options.
c. Select the Source and Destination options, and enter the source and destination addresses.
You can enter an IP addresses, an IP segment, or an IP address range.
An example of a valid IPv4 address entry:
10.153.89.1
An example of a valid IPv4 segment:
10.153.89.*
An example of a valid IPv4 address range entry:
1.1.1.1-2.2.2.2
An example of a valid IPv6 address entry:
a001:410:0:1::1
An example of a valid IPv6 address and subnet mask entry using CIDR notation:
a001:410:0:1::1/64
An example of a valid IPv6 address entry:
a001:410:0:1::1-a001:410:0:1::100
d. Select the Destination Port option and enter the destination port number in the format of 21 or 21-100.
e. Select the Device option and enter a single IPv4 or IPv6 device IP address in the Device field.
The device is the switch, router, or probe that generates flow records.
7. Click OK.
|
|
NOTE: You must configure the Name and Server fields. You can configure other fields as needed. |
Viewing audit results for a Web visiting audit task
Querying audit results for a Web visiting audit task
1. Access the User Behavior Audit Management page.
2. Click the Audit icon
![]() for the Web visiting audit task for which you want to view audit
results.
for the Web visiting audit task for which you want to view audit
results.
The audit result page for the Web visiting audit task opens.
For more information about querying audit results for a Web visiting audit task, see "Querying audit results for an audit task"
Viewing the audit result list for a Web visiting audit task
The audit result list for a Web visiting audit task displays the audit results for the audit task in the specified time range.
If the number of audit result entries exceeds the value of the Max. Displayed Entries for Audit field in the system parameters configuration, for example, 1000, the list displays only 1000 audit result entries. If you want to view more audit result entries, click Continue. The list displays the next 1000 audit result entries each time you click Continue.
The audit result list for a Web visiting audit task displays the following contents:
· Start Time—Start time of the web visiting.
· End Time—End time of the web visiting.
· Source—Source IP address of the user web visiting.
· Destination—Destination IP address of the website that the user visits.
· Port—Port number of the website that the user visits.
· Web Site—Address of the website that users visit.
· URI—URI of the website that users visit.
· Title—Title of the website that users visit.
· Device—IP address of the device or probe that generates flow records.
· Terminal Type—Type of the endpoint used by the access user.
· Operating System—Operating system of the endpoint used by the access user.
The Terminal Type and the Operating System columns are displayed only when UBA works with UAM.
Viewing audit results for a Web visiting audit task by group
You can select one of the following group types from the Group list: Not Group, Source, Destination, Web Site, Device, Source-Destination, Web Site-Device, Source-Web Site, Destination-Device, Source-Device, Destination-Web Site, Terminal Type, and Operating system. The Terminal Type and the Operating System options are displayed only when UBA works with UAM.
In the audit result list, select a group type from the Group list. The audit result list displays values in the following columns based on the group type.
By default, the audit result list displays the grouped results in descending order of the value of the Count column. This helps you to view the websites or website resources whose visiting are more active.
Displaying the Title column in different encoding modes
The Default Title Encoding function allows you to change the default title encoding mode for the Title column. You can select one of the default tile encoding modes from the Default Title Encoding list: UTF-8, US-ASCII, ISO-8859-1, Chinese Simplified, Chinese Traditional, Japanese, Korean, Central European, Cyrillic, and Arabic. The default value is UTF-8. For example, the values that are encoded in US-ASCII cannot be displayed correctly in the UTF-8 mode in the Title column. To display the values correctly, change the default encoding mode to US-ASCII.
Displaying the URI column in different grades
The URI Grade function allows you to change the URI grade for the URI column. You can select one of the grades from the URI Grade list: Not Grade, 1, 2, 3, 3, 4, and 5. The default value is Not Grade. For example, to display imc/business/index.jsf as imc/business in the URI column, you can change the URI grade to 2.
Modifying a Web visiting audit task
1. Access the User Behavior Audit Management page.
2. In the user behavior audit task list, click
the Modify icon ![]() for the Web
visiting audit task you want to modify.
for the Web
visiting audit task you want to modify.
The Modify Custom Web Visiting Audit page opens.
3. Modify parameters for the Web visiting audit task as needed.
You cannot modify the Name field. For more information about modifying other Web visiting audit task parameters, see "Adding a general audit task."
4. Click OK to return to the User Behavior Audit Management page.
Deleting Web visiting audit tasks
Deleting a Web visiting audit task from UBA does not delete the flow records associated with the task prior to the deletion.
To delete one or more Web visiting audit task:
1. Access the User Behavior Audit Management page.
2. In the user behavior audit task list, perform one of the following tasks:
¡ To
delete a Web visiting audit task, click the Delete icon ![]() for the Web visiting audit task and click OK in the confirmation dialog box that opens.
for the Web visiting audit task and click OK in the confirmation dialog box that opens.
¡ To delete Web visiting audit tasks in bathes, select one or more Web visiting audit tasks, click Delete, and click OK in the confirmation dialog box that opens.
Managing FTP audit
FTP audit tasks allow you to audit user behaviors of FTP file transferring, and view the FTP account a user uses and the files a user uploads or downloads.
Viewing FTP audit task details
1. Click the Service tab.
2. From the navigation tree, select Traffic Analysis and Audit > Settings.
The Settings page opens.
3. Click the User Behavior Audit Management link
or icon ![]() .
.
4. The User Behavior Audit Management page opens and displays all user behavior audit tasks that have been added.
5. Click a user behavior task whose type is FTP.
The Custom FTP Audit Detail page opens.
Basic Info area
¡ Name—Name of the FTP audit task.
¡ Server—Name of the UBA server who audits user behaviors for the FTP audit task.
¡ Reader—Operator groups that have the right to view the task.
FTP Condition area
¡ FTP User—User name of the FTP transferring.
¡ File—File of the FTP transferring.
¡ Transfer Mode—Mode of the FTP transferring: Unlimited, Upload, or Download.
Audit Condition area
¡ Custom Query—Query type for the audit conditions: Meet All or Meet Any.
¡ Access User—Account used by the access user that is managed by UAM.
¡ Terminal Type—Type of the endpoint used by the access user.
¡ Operating System—Operating system of the endpoint used by the access user.
¡ Source—Source IP address of the FTP transferring.
¡ Destination—Destination IP address of the FTP transferring.
¡ Destination Port—Destination port of the FTP transferring.
¡ Device—IP address of the device or probe that generates flow records.
The Access User, Terminal Type, and Operating system fields are displayed only when UBA works with UAM.
6. Click Back to return to the User Behavior Audit Management page.
Adding an FTP audit task
1. Access the User Behavior Audit Management page.
2. In the user behavior audit task list, click Add.
The Select Audit Type page opens.
3. Select FTP Audit and click Next.
The Add Custom FTP Audit page opens.
4. In the basic information area, perform the following tasks:
a. In the Name field, enter the task name.
b. From the Server list, select the audit server.
c. Click Select next to the Reader field. On the page that opens, select operator groups that have the right to view the task, and click OK.
5. In the FTP Condition area, perform the following tasks:
a. Select the FTP user option and enter the FTP user name.
b. Select the File option and enter the file name.
c. Select the Transfer Mode option and select a transfer mode. Options are Unlimited, Upload, and Download.
6. In the Audit Condition area, perform the following tasks
a. Select Meet All or Meet Any.
If you select Meet All, UBA audits only flow records that meet all audit conditions you will select. If you select Meet Any, UBA audits flow records that meet any of the audit conditions you will select.
b. Select the Access User option, enter the access user name in the Access User field, and select the terminal type from the Terminal Type list and the operating system from the Operating System list.
The Access User, Terminal Type, and Operating system fields are displayed only when UBA works with UAM. For more information about UBA working with UAM, see "Showing/hiding access users."
The default settings for the Terminal Type and Operating system fields are Unlimited. When you select the Access User option, you cannot select the Source and Destination options.
c. Select the Source and Destination options, and enter the source and destination addresses.
You can enter an IP addresses, an IP segment, or an IP address range.
An example of a valid IPv4 address entry:
10.153.89.1
An example of a valid IPv4 segment:
10.153.89.*
An example of a valid IPv4 address range entry:
1.1.1.1-2.2.2.2
An example of a valid IPv6 address entry:
a001:410:0:1::1
An example of a valid IPv6 address and subnet mask entry using CIDR notation:
a001:410:0:1::1/64
An example of a valid IPv6 address entry:
a001:410:0:1::1-a001:410:0:1::100
d. Select the Destination Port option and enter the destination port number in the format of 21 or 21-100.
e. Select the Device option and enter a single IPv4 or IPv6 device IP address in the Device field.
7. Click OK.
|
|
NOTE: You must configure the Name and Server fields. You can configure other fields as needed. |
Viewing the audit results for an FTP audit task
Querying audit results for an FTP audit task
1. Access the User Behavior Audit Management page.
2. Click the Audit icon
![]() for the FTP audit task for which you want to view audit results.
for the FTP audit task for which you want to view audit results.
The audit result page for the FTP audit task opens.
For more information about querying audit results for an FTP audit task, see "Querying audit results for an audit task."
Viewing the audit result list for an FTP audit task
The audit result list for an FTP audit task displays the audit results for the audit task in the specified time range.
If the number of audit result entries exceeds the value of the Max. Displayed Entries for Audit field in the system parameters configuration, for example, 1000, the list displays only 1000 audit result entries. If you want to view more audit result entries, click Continue. The list displays the next 1000 audit result entries each time you click Continue.
The audit result list for an FTP audit task displays the following contents:
· Start Time—Start time of the FTP transferring.
· End Time—End time of the FTP transferring.
· Source—Source IP address of the FTP transferring.
· Destination—Destination IP address of the FTP transferring.
· Port—Port number of the FTP transferring.
· FTP User—User name of the FTP transferring.
· File—File of the FTP transferring.
· Transfer Mode—Mode of the FTP transferring: Unlimited, Upload, or Download.
· Device—IP address of the device or probe that generates flow records.
· Terminal Type—Type of the endpoint used by the access user.
· Operating System—Operating system of the endpoint used by the access user.
The Terminal Type and the Operating System columns are displayed only when UBA works with UAM.
Viewing audit results for an FTP audit task by group
You can select one of the following group types from the Group list: Not Group, Source, Destination, FTP User, File, Transfer Mode, Device, Source-Destination, FTP User-File, Source-FTP User, Destination-File, Source-File, Destination-FTP User, Terminal Type, and Operating system. The Terminal Type and the Operating System options are displayed only when UBA works with UAM.
In the audit result list, select a group type from the Group list. The audit result list displays the count of audit results in the Count column based on the group type.
By default, the audit result list displays the grouped results in descending order of the value of the Count column. This helps you to view the FTP users, files, or transfer modes associated with which the FTP transferring is more active.
Modifying an FTP audit task
1. Access the User Behavior Audit Management page.
2. In the user behavior audit task list, click
the Modify icon ![]() for the FTP audit
task you want to modify.
for the FTP audit
task you want to modify.
The Modify Custom FTP audit page opens.
3. Modify parameters for the FTP audit task as needed.
You cannot modify the Name field. For more information about modifying other FTP audit task parameters, see "Adding an FTP audit task."
4. Click OK to return to the User Behavior Audit Management page.
Deleting FTP audit tasks
Deleting an FTP audit task from UBA does not delete the flow records associated with the task prior to the deletion.
To delete one or more FTP audit task:
1. Access the User Behavior Audit Management page.
2. In the user behavior audit task list, perform one of the following tasks:
¡ To
delete an FTP audit task, click the Delete icon ![]() for the FTP audit task and click OK in the confirmation dialog box that opens.
for the FTP audit task and click OK in the confirmation dialog box that opens.
¡ To delete FTP audit tasks in bathes, select one or more FTP audit tasks, click Delete, and click OK in the confirmation dialog box that opens.
Managing mail audit
Mail audit tasks allow you to audit user behaviors of sending and receiving mails, and view the mail senders, mail receivers, and mail titles.
Viewing mail audit task details
1. Click the Service tab.
2. From the navigation tree, select Traffic Analysis and Audit > Settings.
The Settings page opens.
3. Click the User Behavior Audit Management link
or icon ![]() .
.
The User Behavior Audit Management page opens and displays all user behavior audit tasks that have been added.
4. Click a user behavior task whose type is Mail.
The Custom Mail Audit Detail page opens.
Basic Info area
¡ Name—Name of the mail audit task.
¡ Server—Name of the UBA server that audits user behaviors for the mail audit task.
¡ Reader—Operator groups that have the right to view the task.
Mail Condition area
¡ Sender—Mail address of the sender.
¡ Receiver—Mail address of the receiver.
¡ Title—Title of the mail.
Audit Condition area
¡ Custom Query—Query type for the audit conditions: Meet All or Meet Any.
¡ Access User—Account used by the access user that is managed by UAM.
¡ Terminal Type—Type of the endpoint used by the access user.
¡ Operating System—Operating system of the endpoint used by the access user.
¡ Source—Source IP address of the mail sending.
¡ Destination—Destination IP address of mail sending.
¡ Destination Port—Destination port number of the mail sending.
¡ Device—IP address of the device or probe that generates flow records.
The Access User, Terminal Type, and Operating system fields are displayed only when UBA works with UAM.
5. Click Back to return to the User Behavior Audit Management page.
Adding a mail audit task
1. Access the User Behavior Audit Management page.
2. In the user behavior audit task list, click Add.
The Select Audit Type page opens.
3. Select Mail Audit and click Next.
The Add Custom Mail Audit page opens.
4. In the basic information area, perform the following tasks:
a. In the Name field, enter the task name.
b. From the Server list, select the audit server.
c. Click Select next to the Reader field. On the page that opens, select operator groups that have the right to view the task, and click OK.
5. In the Mail Condition area, perform the following tasks:
a. Select the Sender option and enter the mail address of the sender.
b. Select the Receiver option and enter the mail address of the receiver.
c. Select the Title option and enter the mail title.
6. In the Audit Condition area, perform the following tasks:
a. Select Meet All or Meet Any.
If you select Meet All, UBA audits only flow records that meet all audit conditions you will select. If you select Meet Any, UBA audits flow records that meet any of the audit conditions you will select.
b. Select the Access User option and perform the following tasks:
- Enter the account name used by the access user that is managed by UAM in the Access User field.
- Select the terminal type from the Terminal Type list and the operating system from the Operating System list. By default, the terminal type and the operating system are unlimited.
The Access User, Terminal Type, and Operating system fields are displayed only when UBA works with UAM. For more information about UBA working with UAM, see "Showing/hiding access users."
When you select the Access User option, you cannot select the Source and Destination options.
c. Select the Source and Destination options, and enter the source and destination addresses.
You can enter an IP addresses, an IP segment, or an IP address range.
An example of a valid IPv4 address entry:
10.153.89.1
An example of a valid IPv4 segment:
10.153.89.*
An example of a valid IPv4 address range entry:
1.1.1.1-2.2.2.2
An example of a valid IPv6 address entry:
a001:410:0:1::1
An example of a valid IPv6 address and subnet mask entry using CIDR notation:
a001:410:0:1::1/64
An example of a valid IPv6 address entry:
a001:410:0:1::1-a001:410:0:1::100
d. Select the Destination Port option and enter the destination port number in the format of 21 or 21-100.
e. Select the Device option and enter a single IPv4 or IPv6 device IP address in the Device field.
The device is the switch, router, or probe that generates flow records.
7. Click OK.
|
|
NOTE: You must configure the Name and Server fields. You can configure other fields as needed. |
Viewing audit results for a mail audit task
Querying audit results for a mail audit task
1. Access the User Behavior Audit Management page.
2. Click the Audit icon
![]() for the mail audit task for which you want to view audit results.
for the mail audit task for which you want to view audit results.
The audit result page for the mail audit task opens.
For more information about querying audit results for a mail audit task, see "Querying audit results for an audit task."
Viewing the audit result list for a mail audit task
The audit result list for a mail audit task displays the audit results for the audit task in the specified time range.
If the number of audit result entries exceeds the value of the Max. Displayed Entries for Audit field in the system parameters configuration, for example, 1000, the list displays only 1000 audit result entries. If you want to view more audit result entries, click Continue. The list displays the next 1000 audit result entries each time you click Continue.
The audit result list for a mail audit task displays the following contents:
· Start Time—Start time of the mail sending.
· End Time—End time of mail sending.
· Source—Source IP address of the mail sending.
· Destination—Destination IP address of mail sending.
· Port—Port number of the mail sending.
· Sender—Mail address of the sender.
· Receiver—Mail address of the receiver.
· Title—Title of the mail.
· Device—IP address of the device or probe that generates flow records.
· Terminal Type—Type of the endpoint used by the access user.
· Operating System—Operating system of the endpoint used by the access user.
The Terminal Type and the Operating System columns are displayed only when UBA works with UAM.
Viewing audit results for a mail audit task by group
You can select one of the following group types from the Group list: Not Group, Source, Destination, Sender, Device, Source-Destination, Sender-Device, Source-Sender, Destination-Device, Source-Device, Destination-Sender, Terminal Type, and Operating system. The Terminal Type and the Operating System options are displayed only when UBA works with UAM.
In the audit result list, select a group type from the Group list. The audit result list displays the count of audit results in the Count column based on the group type.
By default, the audit result list displays the grouped results in descending order of the value of the Count column. This helps you to view the senders, receivers, or mail titles associated with which the mail sending and receiving are more active.
Modifying a mail audit task
1. Access the User Behavior Audit Management page.
2. In the user behavior audit task list, click
the Modify icon ![]() for the mail audit task you want to modify.
for the mail audit task you want to modify.
The Modify Custom Mail Audit page opens.
3. Modify parameters for the mail audit task as needed.
You cannot modify the Name field. For more information about modifying other mail audit task parameters, see "Adding a mail audit task."
4. Click OK to return to the User Behavior Audit Management page.
Deleting mail audit tasks
Deleting a mail audit task from UBA does not delete the flow records associated with the task prior to the deletion.
To delete one or more mail audit task:
1. Access the User Behavior Audit Management page.
2. In the user behavior audit task list, perform one of the following tasks:
¡ To
delete a mail audit task, click the Delete icon ![]() for the mail audit task and click OK in the confirmation dialog box that opens.
for the mail audit task and click OK in the confirmation dialog box that opens.
¡ To delete mail audit tasks in bathes, select one or more mail audit tasks, click Delete, and click OK in the confirmation dialog box that opens.
Managing Telnet audit
Telnet audit tasks allow you to audit users' Telnet behaviors. You can view Telnet user names and commands executed by the Telnet users.
Viewing Telnet audit task details
1. Click the Service tab.
2. From the navigation tree, select Traffic Analysis and Audit > Settings.
The Settings page opens.
3. Click the User Behavior Audit Management link
or icon ![]() .
.
The User Behavior Audit Management page opens and displays all user behavior audit tasks that have been added.
4. Click a user behavior task whose type is Telnet.
The Custom Telnet Audit Detail page opens.
Basic Info area
¡ Name—Name of the Telnet audit task.
¡ Server—Name of the UBA server that audits user behaviors for the Telnet audit task.
¡ Reader—Operator groups that have the right to view the task.
Telnet Condition area
¡ Telnet User Name—Name of the Telnet user.
¡ Execute Command—Command executed by the Telnet user.
Audit Condition area
¡ Custom Query—Query type for the audit conditions: Meet All or Meet Any.
¡ Access User—Account used by the access user that is managed by UAM.
¡ Terminal Type—Type of the endpoint used by the access user.
¡ Operating System—Operating system of the endpoint used by the access user.
¡ Source—Source IP address of the Telnet behavior.
¡ Destination—Destination IP address of the Telnet behavior.
¡ Destination Port—Destination port number of the Telnet behavior.
¡ Device—IP address of the device or probe that generates flow records.
The Access User, Terminal Type, and Operating system fields are displayed only when UBA works with UAM.
5. Click Back to return to the User Behavior Audit Management page.
Adding a Telnet audit task
1. Access the User Behavior Audit Management page.
2. In the user behavior audit task list, click Add.
The Select Audit Type page opens.
3. Select Telnet Audit and click Next.
The Add Custom Telnet Audit page opens.
4. In the basic information area, perform the following tasks:
a. In the Name field, enter a task name.
This field is required.
b. From the Server list, select an audit server.
This field is required.
c. Click Select next to the Reader field. On the page that opens, select operator groups that have the right to view the task, and then click OK.
Whether an operator group has the right to modify or delete the task depends on the privileges granted to the operator group.
5. In the Telnet Condition area, perform the following tasks:
a. Select the Telnet User Name option and enter a Telnet user name.
b. Select the Execute Command option and enter the command executed by the Telnet user.
6. In the Audit Condition area, perform the following tasks:
a. Select Meet All or Meet Any.
If you select Meet All, UBA audits only flow records that meet all audit conditions you select. If you select Meet Any, UBA audits flow records that meet any of the audit conditions you select.
b. Configure the following parameters:
- Access User—Select the Access User option, enter the account name used by an access user that is managed by UAM in the Access User field, and then select a terminal type from the Terminal Type list and an operating system from the Operating System list. By default, the terminal type and the operating system are unlimited.
This option is displayed only when UBA works with UAM. For more information about UBA working with UAM, see "Showing/hiding access users."
- Source/Destination—Select the Source and Destination options, and then enter source and destination addresses. These options are unavailable when the Access User option is selected.
You can enter an IP address, an IP segment, or an IP address range.
An example of a valid IPv4 address entry:
10.153.89.1
An example of a valid IPv4 segment:
10.153.89.*
An example of a valid IPv4 address range entry:
1.1.1.1-2.2.2.2
An example of a valid IPv6 address entry:
a001:410:0:1::1
An example of a valid IPv6 address and subnet mask entry using CIDR notation:
a001:410:0:1::1/64
An example of a valid IPv6 address entry:
a001:410:0:1::1-a001:410:0:1::100
- Destination Port—Select the Destination Port option and enter a destination port number value (for example, 21 or 21-100).
- Device—Select the Device option and enter a single IPv4 or IPv6 IP address of the switch, router, or probe that generates flow records.
7. Click OK.
Viewing audit results for a Telnet audit task
Querying audit results for a Telnet audit task
1. Access the User Behavior Audit Management page.
2. Click the Audit icon
![]() for the Telnet audit task for which you want to view audit results.
for the Telnet audit task for which you want to view audit results.
The audit result page for the Telnet audit task opens.
For more information about querying audit results for a Telnet audit task, see "Querying audit results for an audit task."
Viewing the audit result list for a Telnet audit task
The audit result list for a Telnet audit task displays the audit results for the audit task in the specified time range.
If the number of audit result entries exceeds the value of the Max. Displayed Entries for Audit field in the system parameters configuration, for example, 1000, the list displays only 1000 audit result entries. If you want to view more audit result entries, click Continue. The list displays the next 1000 audit result entries each time you click Continue.
The audit result list for a Telnet audit task displays the following contents:
· Start Time—Start time of the Telnet behavior.
· End Time—End time of the Telnet behavior.
· Source—Source IP address of the Telnet behavior.
· Destination—Destination IP address of the Telnet behavior.
· Port—Port number of the Telnet behavior.
· Telnet User Name—Name of the Telnet user.
· Execute Command—Command executed by the Telnet user.
· Device—IP address of the router, switch, or probe that generates flow records.
· Terminal Type—Type of endpoint used by the access user.
· Operating System—Operating system of the endpoint used by the access user.
The Terminal Type and the Operating System columns are displayed only when UBA works with UAM.
Viewing audit results for a Telnet audit task by group
You can select one of the following group types from the Group list: Not Group, Source, Destination, Telnet User Name, Execute Command, Device, Terminal Type, and Operating System. The Terminal Type and the Operating System options are displayed only when UBA works with UAM.
In the audit result list, select a group type from the Group list. The audit result list displays the count of audit results in the Count column based on the selected group type.
By default, the audit result list displays the grouped results in descending order of the value of the Count column. This helps you to view Telnet users who are more active.
Modifying a Telnet audit task
1. Access the User Behavior Audit Management page.
2. In the user behavior audit task list, click
the Modify icon ![]() for the Telnet
audit task you want to modify.
for the Telnet
audit task you want to modify.
The Modify Custom Telnet Audit page opens.
3. Modify parameters for the Telnet audit task as needed.
You cannot modify the Name field. For more information about modifying other Telnet audit task parameters, see "Adding a Telnet audit task."
4. Click OK to return to the User Behavior Audit Management page.
Deleting Telnet audit tasks
Deleting a Telnet audit task from UBA does not delete the flow records associated with the task prior to the deletion.
To delete one or more Telnet audit task:
1. Access the User Behavior Audit Management page.
2. In the user behavior audit task list, perform one of the following tasks:
¡ To
delete a Telnet audit task, click the Delete icon ![]() for the Telnet audit task, and then click OK in the confirmation dialog box that opens.
for the Telnet audit task, and then click OK in the confirmation dialog box that opens.
¡ To delete Telnet audit tasks in batches, select one or more Telnet audit tasks, click Delete, and then click OK in the confirmation dialog box that opens.
User behavior audit and audit analysis
User behavior audit
1. Click the Service tab.
2. From the navigation tree, select User Behavior Audit.
The User Behavior Audit page opens.
3. From the Server list, select the name of the UBA server that audits user behaviors.
4. In the Start Time and the End Time fields, set the start time and end time.
For more information about setting querying time, see "Setting the query time."
5. In the Audit Condition area, configure the general audit conditions.
The Audit Condition area displays the audit conditions of the general audit. For more information about configuring audit conditions of the general audit, see "Adding a general audit task."
6. Select the Special Audit option and perform one or more of the following tasks:
¡ Select the NAT Condition option, and then configure NAT audit conditions on the area that is displayed. For more information about configuring NAT audit conditions, see "Adding a NAT audit task."
¡ Select the Web Visiting Audit option, and then configure Web visiting audit conditions on the area that is displayed. For more information about configuring Web visiting audit conditions, see "Adding a Web visiting audit task."
¡ Select the FTP Audit option, and then configure FTP audit conditions on the area that is displayed. For more information about configuring FTP audit conditions, see "Adding an FTP audit task."
¡ Select the Mail Audit option, and then configure mail audit conditions on the area that is displayed. For more information about configuring mail audit conditions, see "Adding a mail audit task."
¡ Select the Telnet Audit option, and then configure Telnet audit conditions on the area that is displayed. For more information about configuring Telnet audit conditions, see "Adding a Telnet audit task."
The Web Visiting Audit, FTP Audit, Mail Audit, and Telnet Audit options are displayed only when the corresponding audit type is enabled in the server configuration.
7. Click Audit.
The Audit Result area displays the audit results.
To save the audit results, click Save. For more information about saving audit results, see "Saving audit results."
User behavior audit analysis
1. Click the Service tab.
2. In the Network Monitoring Management area, click
the User Behavior Audit Analysis link or icon ![]() .
.
The User Behavior Audit Analysis page opens and displays the audit result of the last hour in pie charts in the following areas, as shown in Figure 7.
¡ Top 10 Source Host—Displays the top 10 source IP addresses with the most audit results and the percentage of audit results of each source IP address. You can click the slice for a source IP address to view audit results for the source IP address.
¡ Top 10 Destination Host—Displays the top 10 destination IP addresses with the most audit results and the percentage of audit results of each destination IP address. You can click the slice for a destination IP address to view audit results for the destination IP address.
¡ Top 10 Application—Displays the top 10 applications with the most audit results and the percentage of audit results of each application. You can click the slice for an application to view audit results for the application.
¡ Top 10 Unknown Application—Displays the top 10 unknown applications with the most audit results and the percentage of audit results of each unknown application. You can click the slice for an unknown application to view audit results for the unknown application.
For more information about viewing audit results, see "Viewing audit results for a general audit task."
Figure 7 User behavior audit analysis

Managing behavior audit reports
UBA uses the report management function of the IMC Platform to display the behavior audit reports. UBA provides the following types behavior audit report templates:
· FTP Destination TopN
· FTP User TopN
· FTP Source TopN
· Mail Sender TopN
· Web User TopN
· Web Site TopN
· Unknown Application TopN
· Application TopN
· Source TopN
· Destination TopN
Each type of report template has daily report and weekly report. You can operate (add, view, modify, or delete) a daily report in the same way a weekly report is operated. The only difference between them is that they use different time granularities.
· Daily Report—The granularity of the statistics collection time is one hour.
· Weekly Report—The granularity of the statistics collection time is one day.
Adding a behavior audit report
1. Click the Report tab.
2. In the upper right corner of the page that opens,
click the Add My Real Time Report link or icon ![]() .
.
The page for selecting templates opens and displays all real-time templates to be added in the template list.
Template List contents
¡ Template Name—Name of the real-time report template.
¡ Type—Type of the real-time report template.
¡ Definition Type—Definition type of the real-time report template: Pre-defined or Custom. For more information about custom real-time report templates, see HPE Intelligent Management Center v7.3 Enterprise and Standard Platform Administrator Guide.
3. In the Query Template area, perform one of the following tasks to query real-time templates:
¡ In the Template Name field, enter the name of a behavior audit report template and click Query.
The template list displays all templates that match the query criterion.
This field supports fuzzy matching and case-insensitive query. For example, if you enter u, this field matches all template names that contain u or U.
¡ From the Type list, select Behavior Audit Report and click Query.
The template list displays all templates whose type is Behavior Audit Report.
To reset the query criteria to default value, click Reset.
4. In the template list, select one or more behavior audit report templates and click OK.
The behavior audit reports created from the behavior audit report templates are displayed in the My Real Time Reports area on the report page.
Viewing a behavior audit report
1. Click the Report tab.
2. Click My Real Time Reports to expand the real-time reports.
The Behavior Audit Reports area displays all behavior audit reports that you have added.
3. Click a behavior audit report name.
This example uses Application Weekly Report V2.
4. On the Set Parameter page that opens, perform the following tasks:
a. Select a value from the TopN list. Options are 10, 20, 50, and 100.
b. Click the Start Time field and set the start time on the calendar that opens.
c. Click the End Time field and set the end time on the calendar that opens.
5. Click OK.
The Application Weekly Report page opens, as shown in Figure 8. The report displays the TopN applications with the most audit results in the specified query time in a pie chart and a list. The pie chart also displays the percentage of audit results of each application. You can click the slice for an application to view the number of audit results for the application. The list also displays the number of audit results of each TopN application.
To export the report, click the Export icon ![]() . To
print the report to PDF, click the Print icon
. To
print the report to PDF, click the Print icon ![]() . For
more information about exporting and printing reports, see HPE Intelligent Management
Center v7.3 Enterprise and Standard Platform
Administrator Guide.
. For
more information about exporting and printing reports, see HPE Intelligent Management
Center v7.3 Enterprise and Standard Platform
Administrator Guide.
Figure 8 Application weekly report
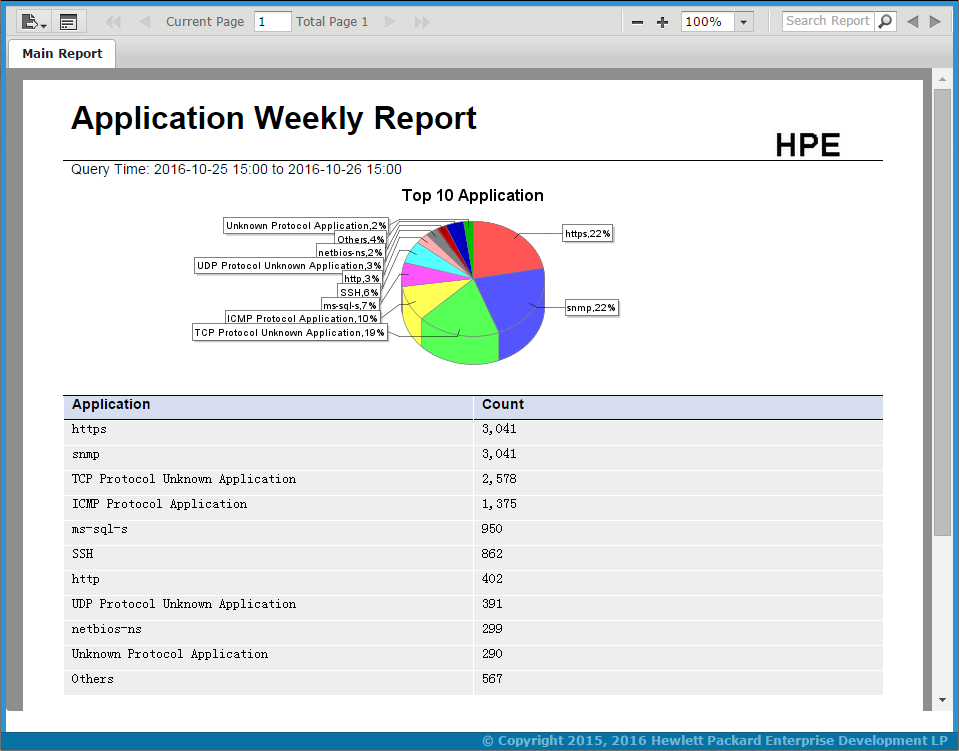
Modifying a behavior audit report
1. Click the Report tab.
2. Click My Real Time Reports to expand the real-time reports.
The Behavior Audit Reports area displays all behavior audit reports that you have added.
3. Click the Edit Model link next to My Real Time Reports.
The View Model link is displayed next to My Real Time Reports. The Modify icon ![]() and
the Delete icon
and
the Delete icon ![]() are displayed next to each report.
are displayed next to each report.
4. Click the Modify icon ![]() for the report you want to modify.
for the report you want to modify.
5. On the Modify page that opens, perform the following tasks as needed.
a. In the Display Name field, enter a new real-time report name.
b. In the Description field, enter a new description for the real-time template. By default, the description is the same as the display name.
You cannot modify the Create Time field.
6. Click OK.
Deleting a behavior audit report
Deleting a behavior audit report does not delete the flow records associated with the report prior to the deletion.
To delete a behavior audit report:
1. Click the Report tab.
2. Click My Real Time Reports to expand the real-time reports.
The Behavior Audit Reports area displays all behavior audit reports that you have added.
3. Click the Edit Model link next to My Real Time Reports.
The View Model link is displayed next to My Real Time Reports. The Modify icon ![]() and
the Delete icon
and
the Delete icon ![]() are displayed next to each report.
are displayed next to each report.
4. Click the Delete icon ![]() for the report you want to delete.
for the report you want to delete.
A confirmation dialog box opens.
5. Click OK.
UBA configuration example
The following information provides an example for using IMC UBA and H3C NetStream to monitor and audit private network user behaviors in accessing a public network.
Network requirements
As shown in Figure 9:
· Users on segments 192.168.10.0/24, 192.168.20.0/24, and 192.168.30.0/24 access the Internet through two S7503E core switches. This example uses the active core switch.
· A NetStream card is installed in the active core switch. Ten-GigabitEthernet 0/1 on the NetStream card is connected to Ten-GigabitEthernet 2/0/1 on the switch.
To audit user behaviors in UBA, perform the following tasks:
· Configure port mirroring on GigabitEthernet 2/0/2 on the switch.
Port mirroring copies the traffic to the NetStream card.
· Enable NetStream on the NetStream card, and make sure the NetStream card and the UBA server can reach each other.
· Configure the NetStream card to send NetStream logs to the UBA server for user behavior audit.
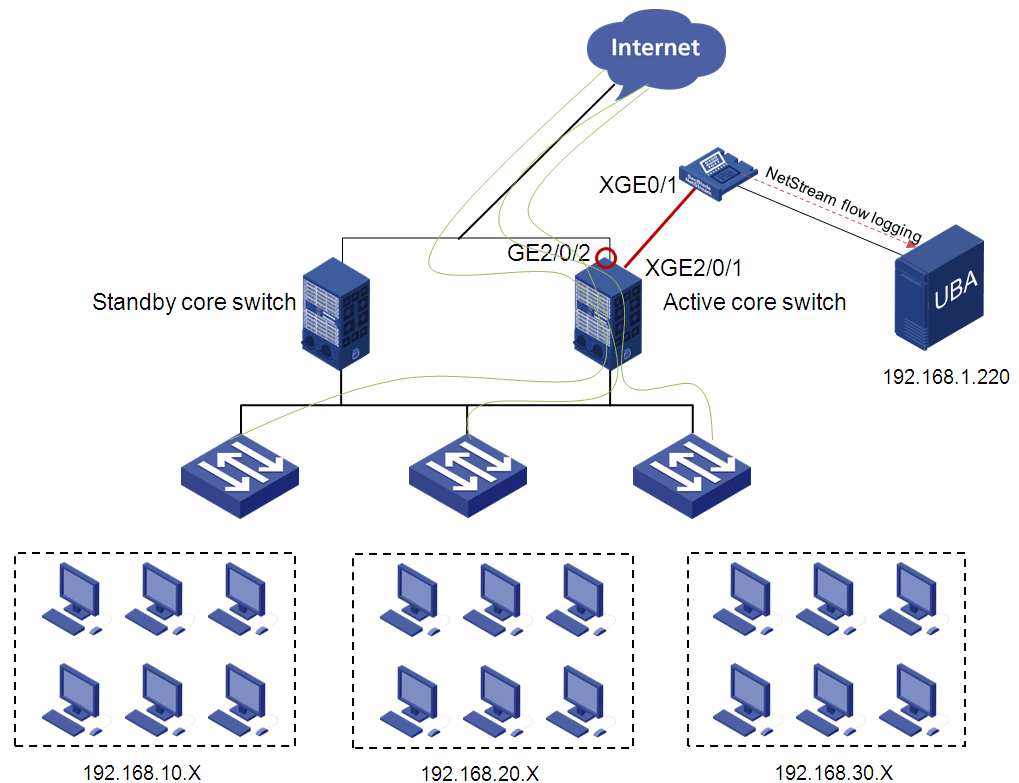
Software version used
This configuration example was created and verified on the following platforms:
· IMC PLAT 7.3 (E0503)
· IMC UBA 7.3 (E0502)
· H3C S7503E, Comware Software Version 5.20 Release 6708P08
· H3C SecBlade NetStream card, Comware Software Version 5.20 Release 3109P03
Configuring NetStream on the S7503E switch
1. Configure the S7503E switch:
# Create local mirroring group 1.
[Sysname] system-view
[Sysname] mirroring-group 1 local
# Configure mirroring group 1 to monitor the incoming and outgoing traffic on GigabitEthernet 2/0/2.
[Sysname] mirroring-group 1 mirroring-port GigabitEthernet2/0/2 both
# Configure Ten-GigabitEthernet 2/0/1 as the monitor port of mirroring group 1.
[Sysname] mirroring-group 1 monitor-port Ten-GigabitEthernet2/0/1
# Enable ACSEI server so that the NetStream card can synchronize the clock of the MPU on the switch.
[Sysname] acsei server enable
2. Configure the NetStream card:
# Create blackhole-type inline forwarding entry 1.
[Sysname] inline-interfaces 1 blackhole
# Assign Ten-GigabitEthernet 0/1 to inline forwarding entry 1.
[Sysname] interface Ten-GigabitEthernet0/1
[Sysname-Ten-GigabitEthernet0/1] port inline-interfaces 1
# Enable NetStream for incoming traffic on Ten-GigabitEthernet 0/1.
[Sysname-Ten-GigabitEthernet0/1] ip netstream inbound
# Enable ACSEI client on Ten-GigabitEthernet 0/1 so that the NetStream card can synchronize the clock of the MPU on the switch.
[Sysname-Ten-GigabitEthernet0/1] acsei-client enable
[Sysname-Ten-GigabitEthernet0/1] quit
# Specify the export destination host as 192.168.1.220 with UDP port 9020.
[Sysname] ip netstream export host 192.168.1.220 9020
# Configure the switch to export NetStream data in the version 9 format. The NetStream traditional data export uses the version 5 format by default.
[Sysname] ip netstream export version 9
Configuring UBA
Adding the NetStream device to UBA
1. Click the Service tab.
2. From the navigation tree, select Traffic Analysis and Audit > Settings.
The Settings page opens.
3. In the Guide to Quick Traffic Analysis And Audit Configuration area, click Device Management.
The Device Management page opens.
4. Click Add.
The Add Device page opens, as shown in Figure 10.
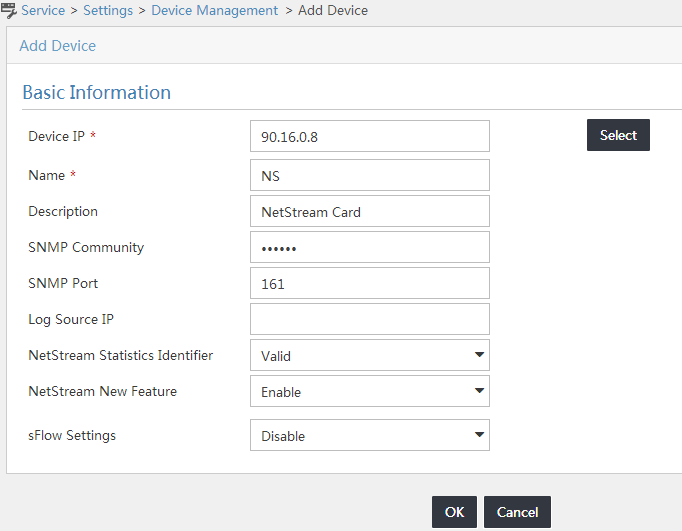
5. Add a device to UBA:
¡ If the device has been added to the IMC Platform, click Select to select it. Settings for SNMP Community, SNMP Port, and Log Source IP are optional.
¡ If the device is not added to the IMC Platform, enter the device's IP address and name in the Device IP and Name fields, respectively. Settings for SNMP Community and SNMP Port are required.
The device IP address is the management address of the Netstream card.
6. Perform the following tasks, as shown in Figure 10:
¡ Use the default settings public and 161 for SNMP Community and SNMP Port, respectively. Make sure the settings are the same as those on the device.
¡ Configure an IP address in the Log Source IP field as needed.
The IP address is used when IMC cannot obtain the device interface information through SNMP. This example does not use this parameter.
¡ Select Valid from the NetStream Statistics Identifier list.
¡ Select Enable from the NetStream New Feature list.
7. Click OK.
Modifying the UBA server configuration
1. In the Guide to Quick Traffic Analysis And Audit Configuration area, click Server Management.
The Server Management page opens.
2. Click the Modify
icon ![]() for the UBA server.
for the UBA server.
The Server Configuration page opens, as shown in Figure 11.
Figure 11 Modifying the server configuration
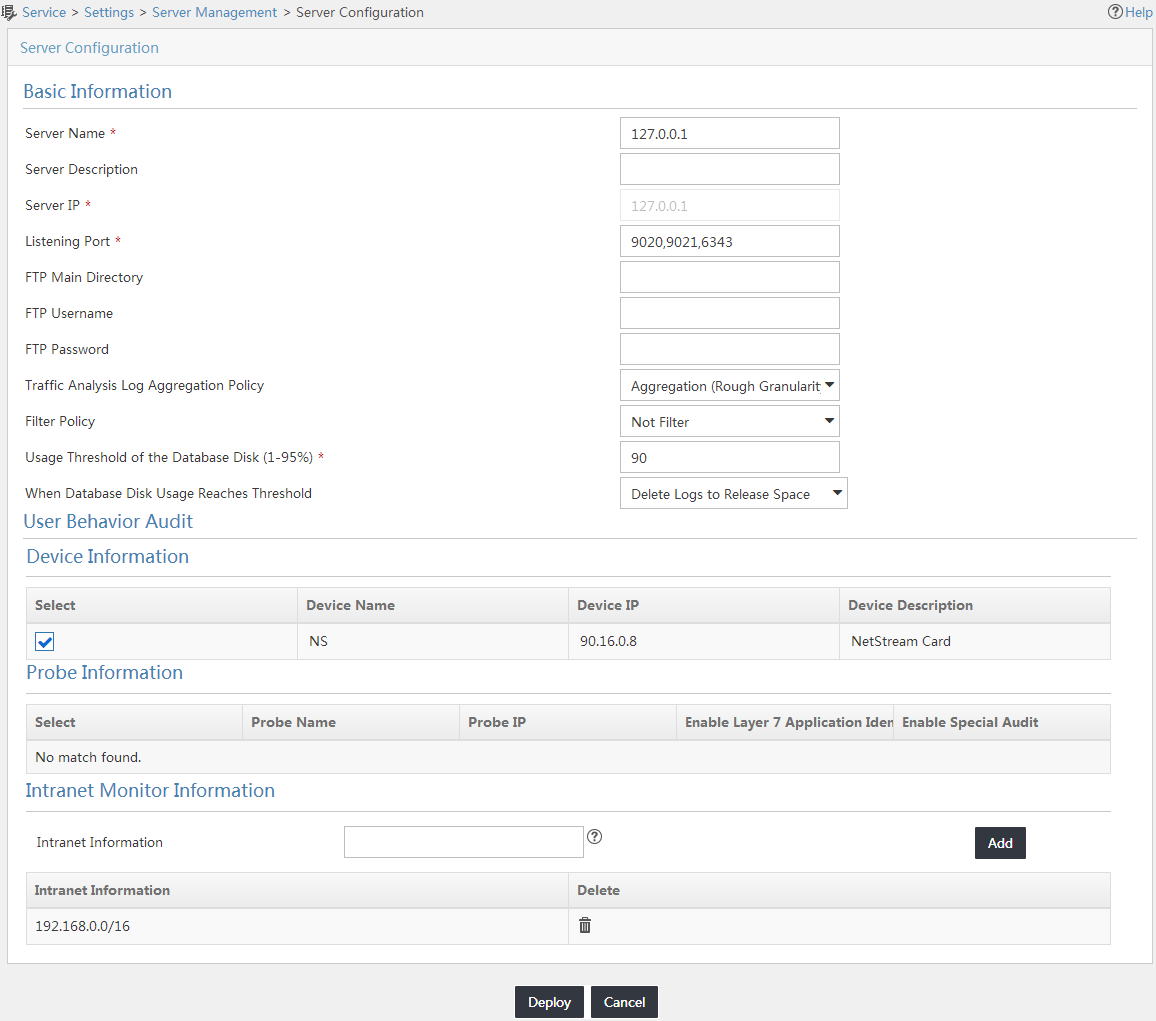
3. Keep the default settings in the Basic Information area.
4. Select 90.16.0.8 in the Device Information area in this example.
5. Enter intranet IP addresses in the Intranet Monitor Information area, and click Add.
The intranet network segments are displayed in the Intranet Information area.
6. Click Deploy.
Adding a user behavior audit task
1. In the Guide to Quick Traffic Analysis And Audit Configuration area, click User Behavior Audit Management.
The User Behavior Audit Management page opens.
2. Click Add.
The Select Audit Type page opens, as shown in Figure 12.
Figure 12 Selecting an audit type
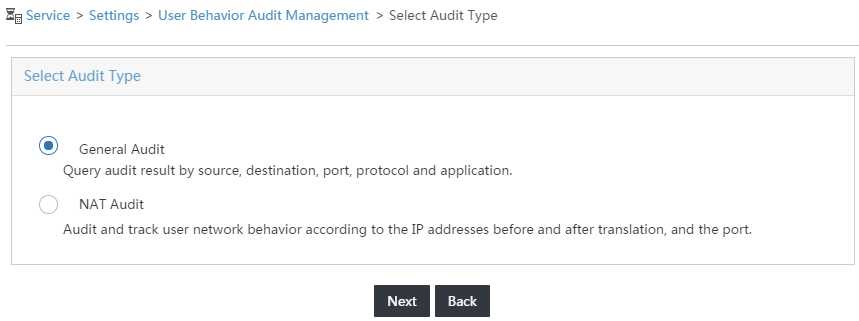
3. Select an audit type, and click Next.
This example uses General Audit. The Add Custom General Audit page opens, as shown in Figure 13.
Figure 13 Adding a custom general audit task
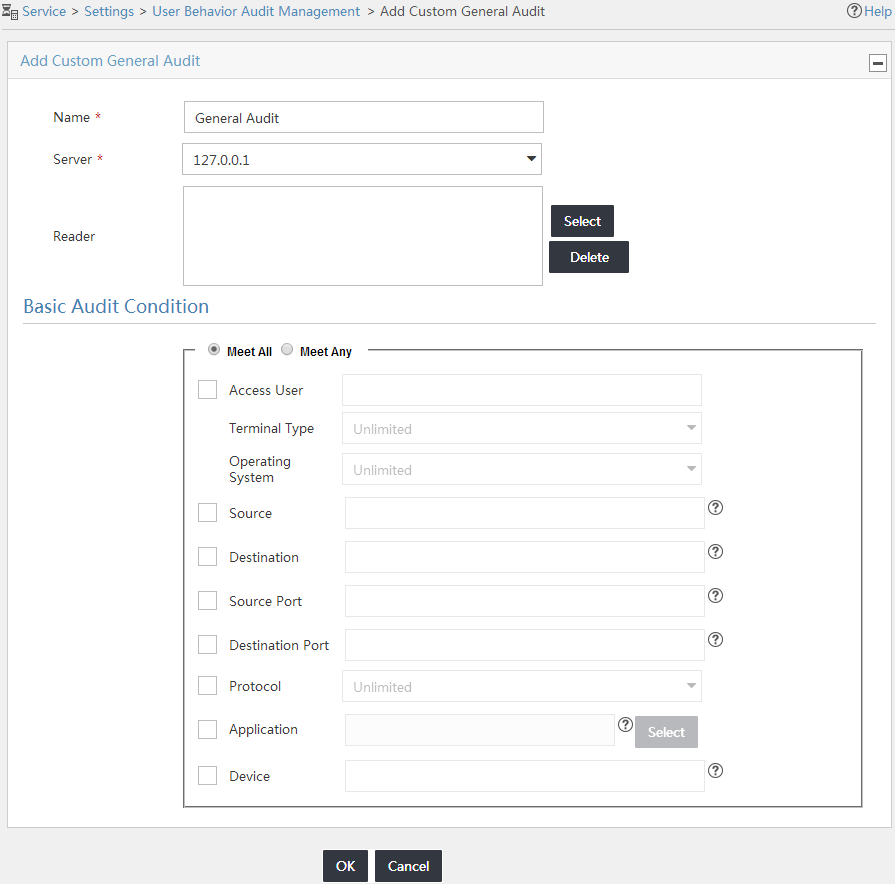
4. Enter General Audit in the Name field.
5. Select 127.0.0.1 from the Server list.
6. Select Meet All in the Basic Audit Condition area.
7. Use the default settings of other parameters.
8. Click OK.
Verifying the configuration
1. From the navigation tree, select Traffic Analysis and Audit > General Audit.
The audit task General Audit is displayed on the Custom Audit List page.
Figure 14 Viewing the audit task
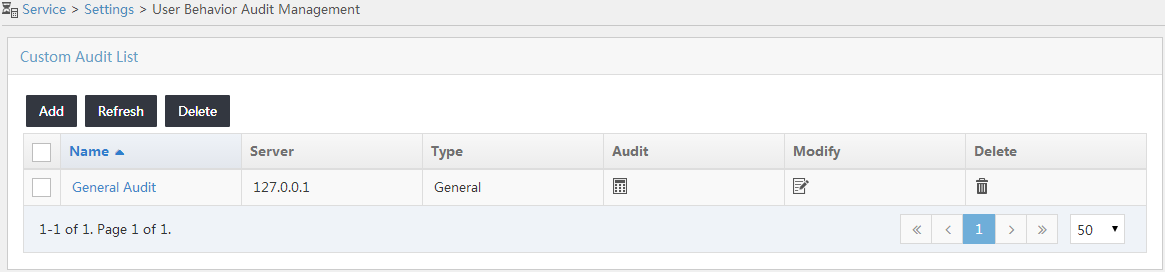
2. Click the Audit
icon ![]() for General Audit.
for General Audit.
It takes time to generate the result. You can see the information such as source IP addresses, destination IP addresses, source ports, and destination ports, as shown in Figure 15.
To view the hosts, ports, protocols, applications, or others whose user behaviors are more active, select one of the group types from the Group list and click the Flux column. The audit result list displays the audit result in descending order of the value of the Flux column. For example, if you select Source-Destination and click the Flux column, you can see the visiting to 192.168.1.224 from 192.168.40.100 is most active, as shown in Figure 16.
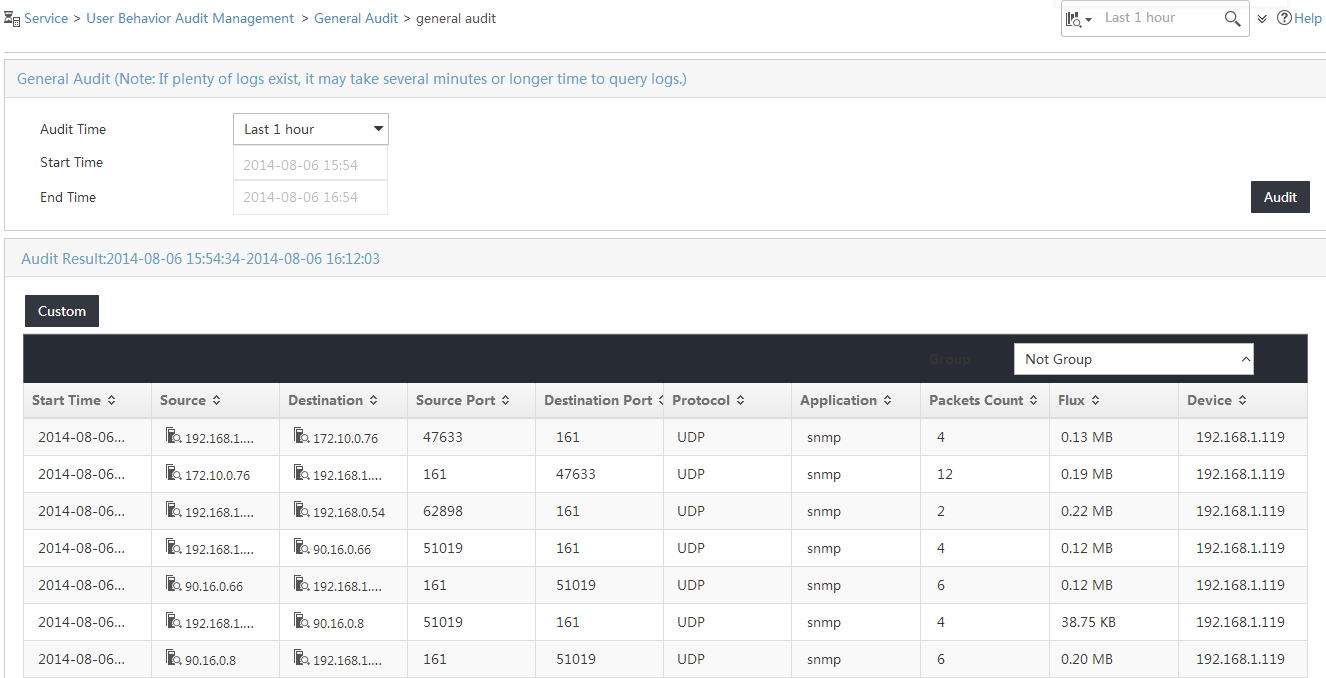
Figure 16 Viewing audit results by group