- Table of Contents
- Related Documents
-
| Title | Size | Download |
|---|---|---|
| 01-Text | 13.44 MB |
Contents
Managing the MAC address whitelist
Managing third-party network resources
Managing the scanner software and configuration
Configuring weak password detection
Creating accounts for mute terminals by MAC address
Adding an IP group or IP subnet
Batch importing or adding subnets
Deleting one or multiple IP groups or IP subnets
Modifying an IP group or IP subnet
Viewing top 10 subnets by IP usage
Deleting one or multiple IP baselines
Example: Configuring hierarchical EPS
Example: Configuring collaboration with EIA to add endpoint users to the EIA blacklist
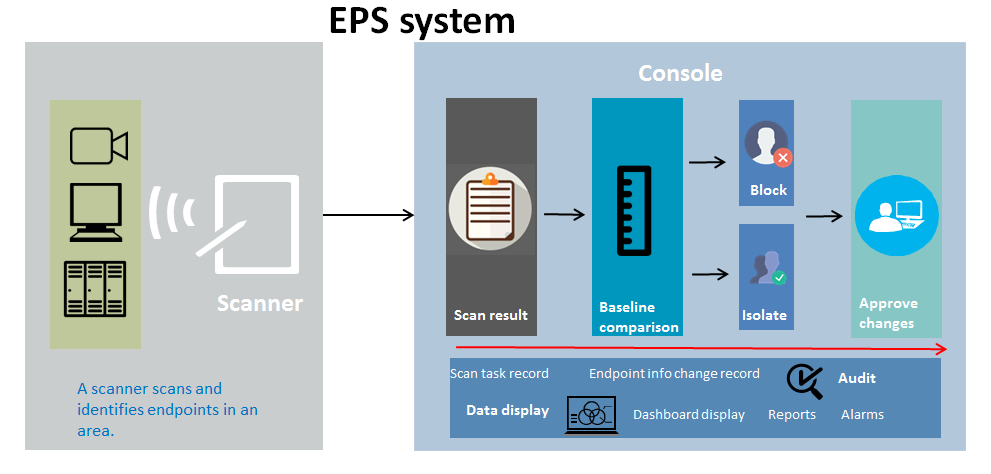
Overview
Endpoints Profiling System (EPS) is an iMC service component developed for endpoint identification and monitoring. EPS can promptly identify new and abnormal endpoints by executing a periodical or one-time scan task to scan endpoints in areas of the network.
Functions
As shown in Figure 1, EPS provides the following functions:
· Scanning endpoints—Scanners scan network-wide endpoints and send scan results to the EPS console for endpoint status update.
· Identifying endpoints—Scanners can automatically identify endpoint types, including camera, PC, switch, server, router, firewall, printer, and ATM.
· Comparing baselines—The EPS console compares the scanned endpoint information with the endpoint baseline information. IP baseline management allows you to view, edit, copy, compare, and export baseline information.
· Discovering abnormal endpoints—The EPS console marks endpoints whose scanned information is inconsistent with the endpoint baseline information.
· Support for approving endpoint baseline changes—EPS allows the operator to approve baseline information changes.
· Blacklisting endpoints—EPS adds endpoints to the blacklist based on the collaboration with EIA or scanners. You can also configure EPS to automatically add incompliant, new, or offline endpoints to the blacklist.
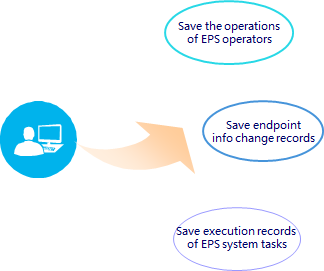
· Auditing—EPS supports system logs, operation logs, and endpoint change records for auditing.
¡ System logs record execution time of scan tasks.
¡ Operation logs record important operations of the operator.
¡ Endpoint change records contain change details of all endpoint information.
· Data display—EPS supports displaying the following statistics:
¡ The dashboard displays status, count, and area distribution of all endpoints in real time.
¡ Alarms monitor the following changes in real time:
- Endpoint information changes, including changes of endpoint type, MAC address, endpoint vendor, and operating system.
- Endpoint compliance or online status changes.
- Scanner status changes.
¡ Reports provide real-time statistics for endpoints and cameras on the network. Various types of reports are supported.
¡ The endpoint topology displays information and distribution of all endpoints in a topology.
¡ The IP subnet management is associated with endpoints and displays information about IP subnet groups, IP subnets, IP addresses, and IP usage statistics.
Benefits
EPS delivers the following benefits:
· Monitors endpoints of the whole network and displays real-time data on the dashboard in various forms.
· Executes scan tasks automatically or under the manual trigger of the operator.
· Supports importing or exporting baseline data. Existing baseline information can be exported into a .CSV or .TXT file for analysis.
· Allows the operator to approve baseline changes that are caused by device replacement or software upgrade.
· Supports event tracing and user behavior auditing based on system logs, operation logs, and endpoint change records.
Get started
EPS concepts
Scan management
Area management
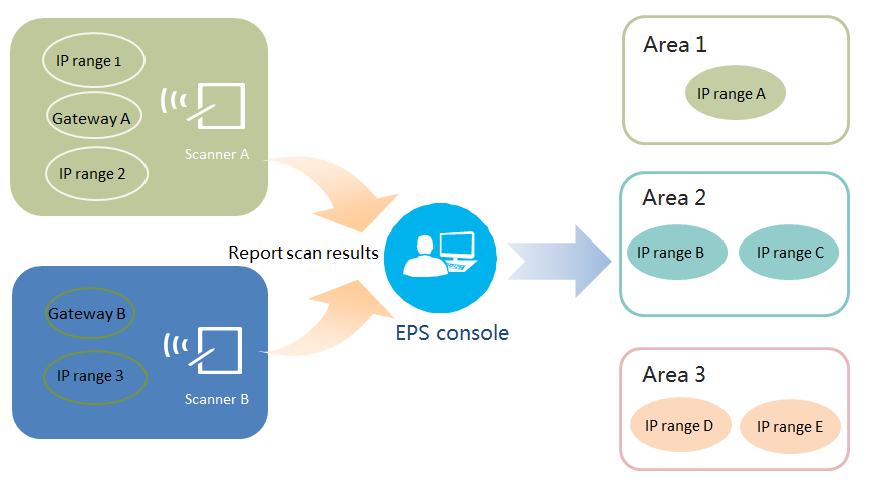
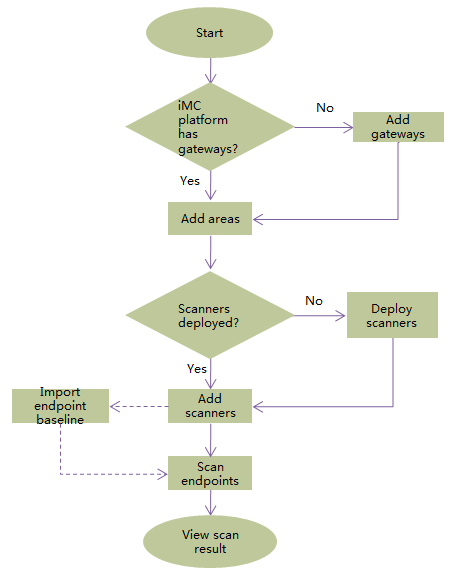
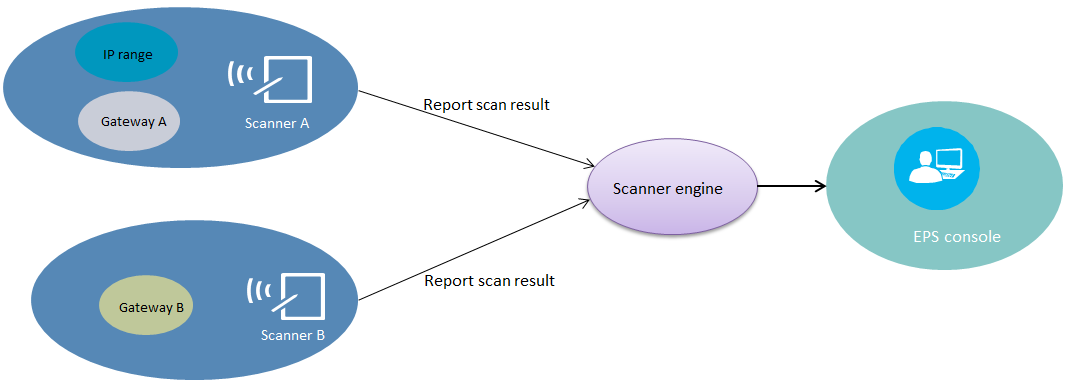
The administrator can divide the network into different areas and assign a person responsible for each area. Each area can be bound to IP address ranges or IP subnets. IP address ranges in each area cannot overlap. Scanners report scanned endpoints to the EPS console, and the EPS console assigns endpoints to areas according to the endpoint IP addresses, as shown in Figure 2.
Scan process
Scanners support the following scan methods:
· IP gateway-based scan—A scanner obtains the endpoint IP list from the gateway and scans the endpoints on the list.
· IP range-based scan—A scanner supports scanning endpoints of multiple IP address ranges. This method is applicable to scan scenarios that do not contain any gateway devices.
As shown in Figure 2, scanners discover and identify endpoints and report scan results to the EPS console. The EPS console updates online status of endpoints and determines whether to update compliance status of endpoints based on the endpoint information comparison with baseline information.
Figure 2 Area management and scan process
Endpoint management
Endpoint type
EPS supports the following predefined endpoint types: camera, AP, PC, switch, server, router, printer, firewall, ATM, and unknown. EPS supports user-defined endpoint types. Scanners can automatically identify endpoint types during the scan.
Endpoint baseline
Endpoint baseline is a set of endpoint attributes based on which the EPS console determines whether an endpoint is policy compliant. Endpoint baseline attributes include endpoint MAC, OS, vendor, and endpoint type.
Endpoint baseline can be added by the operator, or reported by the scanner and approved by the operator.
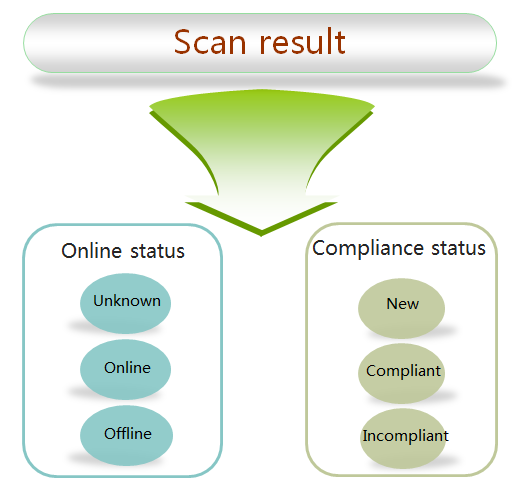
Endpoint status
Endpoint status includes compliance status and online status, as described in Table 1.
|
Endpoint status type |
Name |
Meaning |
|
Compliance status |
New |
Status of endpoints added to EPS for the first time based on the scan results. |
|
Compliant |
Status of endpoints whose scanned information is incompliant with the existing baseline. |
|
|
Incompliant |
Status of endpoints whose scanned information is incompliant with the existing baseline. |
|
|
Online status |
Unknown |
Status of endpoints added or batch imported to EPS by the operator. |
|
Online |
Status of scanned endpoints. |
|
|
Offline |
Status of endpoints that are not scanned but EPS has the baseline information of the endpoints. |
The status transition is shown in Figure 3.
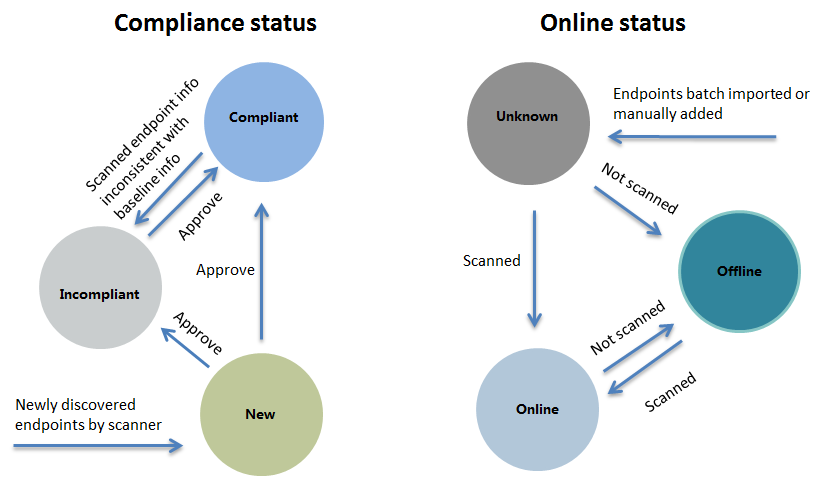
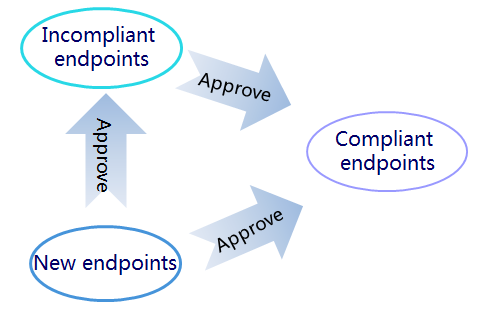
Approving an endpoint
The operator approves an endpoint based on the endpoint baseline or baseline changes. The operator can set an endpoint to compliant or incompliant.
· Set to compliant—The compliance status of an endpoint discovered by the scanner is new and it becomes compliant after the operator approves the endpoint to be compliant. After the operator approves an incompliant endpoint to be compliant, EPS modifies the baseline information based on the scanned information of the endpoint. The compliance status of the endpoint becomes compliant.
· Set to incompliant—The compliance status of an endpoint discovered by the scanner is new. The operator approves the endpoint to incompliant if the endpoint information is incorrect. The compliance status of the endpoint becomes incompliant.
Configuration process
Figure 4 Configuration process
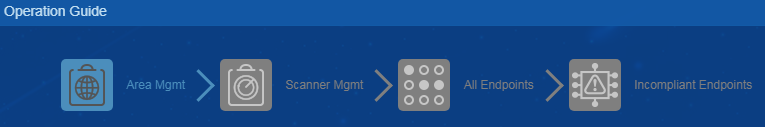
Quick start
Follow the operation wizard to fast configure EPS.
1. Access the Endpoint Profiling System > Quick Start page.
2. Click Area Mgmt and add areas. For more information, see "Area configuration."
3. Click Scanner Mgmt and add scanners. For more information, see "Adding a scanner."
4. Click All Endpoints and approve endpoint baselines. For more information, see "Endpoint device management."
5. Click Incompliant Endpoints to view and approve incompliant endpoints. For more information, see "Endpoint device management."
You can click Previous or Next, or click a configuration item to open the target configuration page.
Figure 5 Operation wizard
Features
Area management
To improve the endpoint monitoring efficiency in a large-sized network, divide the network into different areas based on the administration division and specify a person responsible for each area. When an endpoint fails in an area, the administrator can inform the person responsible for the area to troubleshoot the endpoint. For a small-sized network, the whole network can be managed as an area.
Area planning
EPS supports hierarchical area management. You can create a maximum of five levels of sub areas for an area. The operator of a parent area manages all sub areas of the parent area. IP address ranges in sub areas and the parent area cannot overlap.
Different roles of operators have privileges as follows:
· The administrator has the management privilege of all areas.
· The maintainer cannot add areas.
· The viewer has only the privilege of viewing area information.
Area configuration
Adding an area
1. From the navigation tree, select Endpoint Profiling Management > Scan Config > Area Mgmt.
2. Click Add.
3. Add an area, as shown in Figure 6.
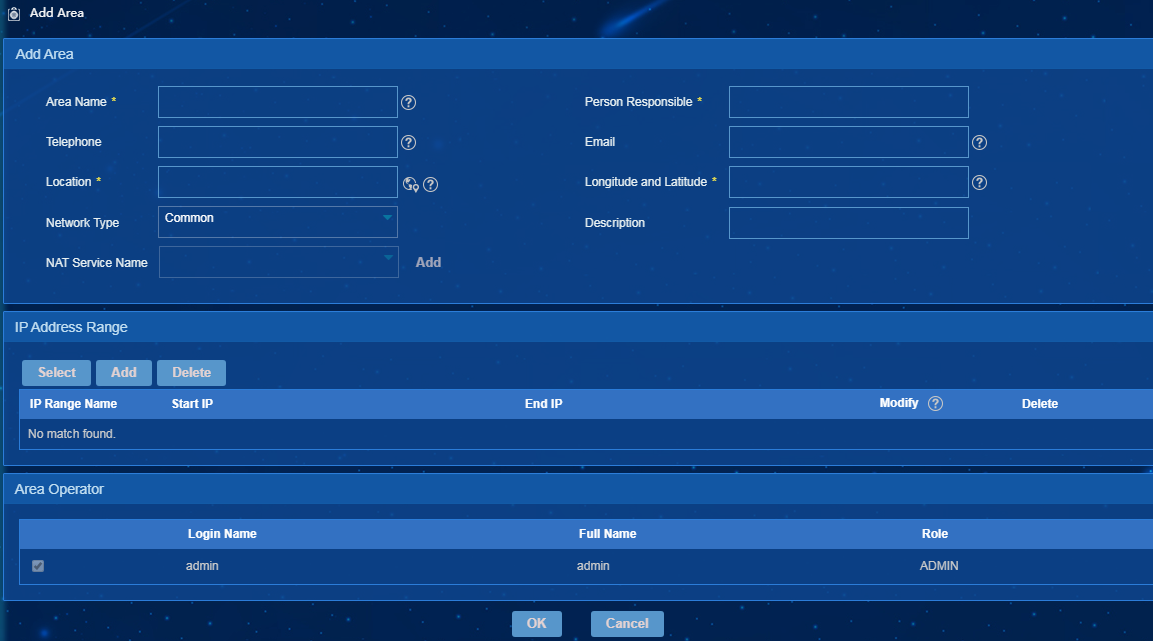
4. Click OK.
When you add an area, follow these restrictions and guidelines:
· The system supports a default area. EPS adds an endpoint to the default area if the endpoint does not belong to any other areas.
· IP address range names in each area cannot be the same. An area can contain one or multiple IP segments, but an IP segment can belong to only one area. If the IP address of an endpoint in the default area is in the IP range of a new area, the endpoint migrates to the new area.
· To select a location, click the Select from Map ![]() icon next to the Location field.
icon next to the Location field.
· When you delete an area, all sub areas of the area are also deleted. The system moves endpoints in these areas to the default area.
· When you modify IP address range of an area, the area to which an endpoint belongs will change to the default area if the IP address of an endpoint is not in the new IP range. If the IP address of an endpoint in the default area is in the new IP range of the area, the system moves the endpoint to this area from the default area.
· The Network Type list includes options Common and NAT. When you select NAT, you must configure a NAT service name.
Adding a sub area
1. Access the area list page, and click the sub area ![]() icon for an area.
icon for an area.
2. Click Add.
3. Add a sub area, as shown in Figure 7.
You can add a maximum of five levels of sub areas.
Figure 7 Adding a sub area
4. Click OK.
Changing the area of endpoints
1. Access the area list page, and click the endpoint list ![]() icon
for an area to open the endpoint list page.
icon
for an area to open the endpoint list page.
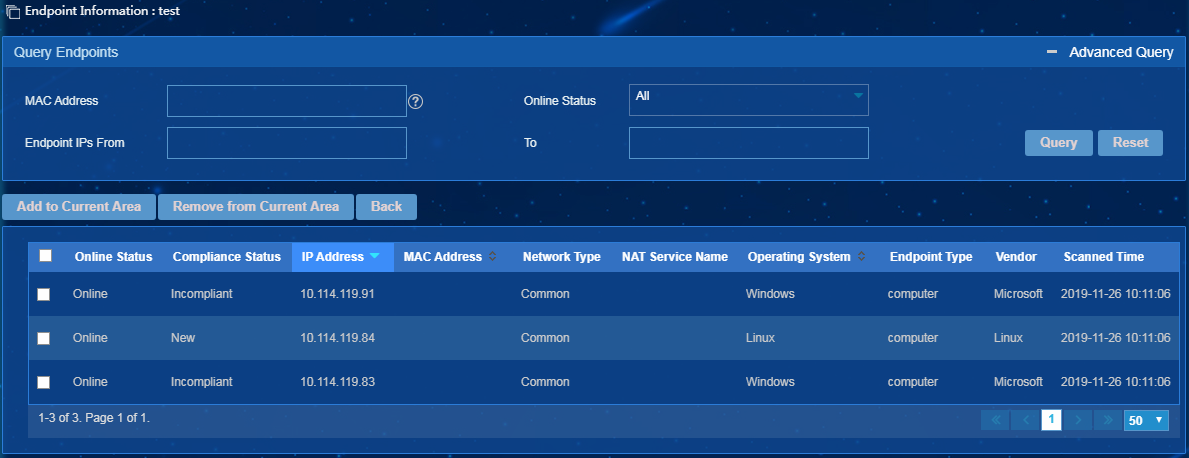
2. Click Add to Current Area or Remove from Current Area to change the area of endpoints, as shown in Figure 8.
You cannot add endpoints to the default area or remove endpoints from the default area.
Figure 8 Changing the area of endpoints
Scanner management
To use EPS, deploy scanners on the network. Deploy multiple scanners to improve the scan speed if the network contains multiple areas.
A scanner can execute scan tasks automatically or based on the instruction assigned by the EPS console. As shown in Figure 9, a scanner scans all endpoints of the specified IP address ranges or gateway, obtains endpoint information, and sends the scan result to the EPS console. The EPS console updates endpoint status based on the scan result.
Figure 9 Scanner operating process
EPS supports managing scanner groups and configuring scanner group management privileges.
Adding a scanner
Before you add a scanner, make sure the scanner has been deployed and can communicate with EPS correctly.
To add a scanner:
1. From the navigation tree, select Endpoint Profiling Management > Scan Config > Scanner Mgmt.
2. Click Add.
3. Add a scanner and configure the following parameters, as shown in Figure 10.
¡ Scanner Name—Enter the scanner name.
¡ IP Address—Enter the IP address of the host deployed with the scanner.
¡ Network Type—Select Common or NAT.
¡ NAT Service Name—Configure a NAT service name when the network type is set to NAT.
¡ Scanner Group—Select a scanner group for the scanner. You can click Add next to the Scanner Group field to add a scanner group and then add the scanner to this group.
¡ Scan Mode—Select a scan mode from the Scan Mode list. The following options are supported:
- Standard—Applicable to networks with PCs and mute terminals.
- Camera-Only—Applicable to video networks.
- Camera-First—Applicable to networks with endpoints and cameras.
¡ Port Depth—Select a port depth from the Port Depth list. Options include Shallow, Medium, and Deep. The port depth affects the endpoint information identification. The Deep port depth has a more accurate scan result but costs longer scan time. Select a depth based on the endpoint types. Select Shallow for a network with simple endpoint types. Select Deep if the endpoint types are various and have distinct differences.
¡ Protocol Depth—Select a protocol depth from the Protocol Depth list. Options include Shallow, Medium, and Deep. Protocol depth determines combination of packets used for scan. The Deep protocol depth uses more probe packets and has a more reliable scan result. Select Deep if the network has a high demand on security.
¡ Location—Click the Select from Map ![]() icon next to the Location field to select a location from the GIS map.
icon next to the Location field to select a location from the GIS map.
¡ Longitude and Latitude—You can enter the longitude and latitude or select them from the GIS map.
¡ Send Scanning Reports by Email—Select whether to send scanning reports by email. When you select Enable, configure email recipient parameters in the Email Recipients area.
¡ Scanning Policy—Select whether to enable the scanning policy feature for the scanner. A scanner can be bound to a maximum of two scanning policies. The scanner enabled with the scanning policy feature executes scan tasks based on the scanning policy settings.
¡ Description—Add a description for the scanner.
4. In the IP Gateways/IP Ranges area, add one or multiple IP gateways or IP address ranges for the scanner. The total number of IP gateways and IP address ranges associated with a scanner cannot exceed the upper limit. By default, a scanner can be associated with 20 IP gateways and IP address ranges.
5. In the NVR List area, select NVR devices for camera group management. The scanner obtains camera data from NVR devices and reports the data to the EPS server.
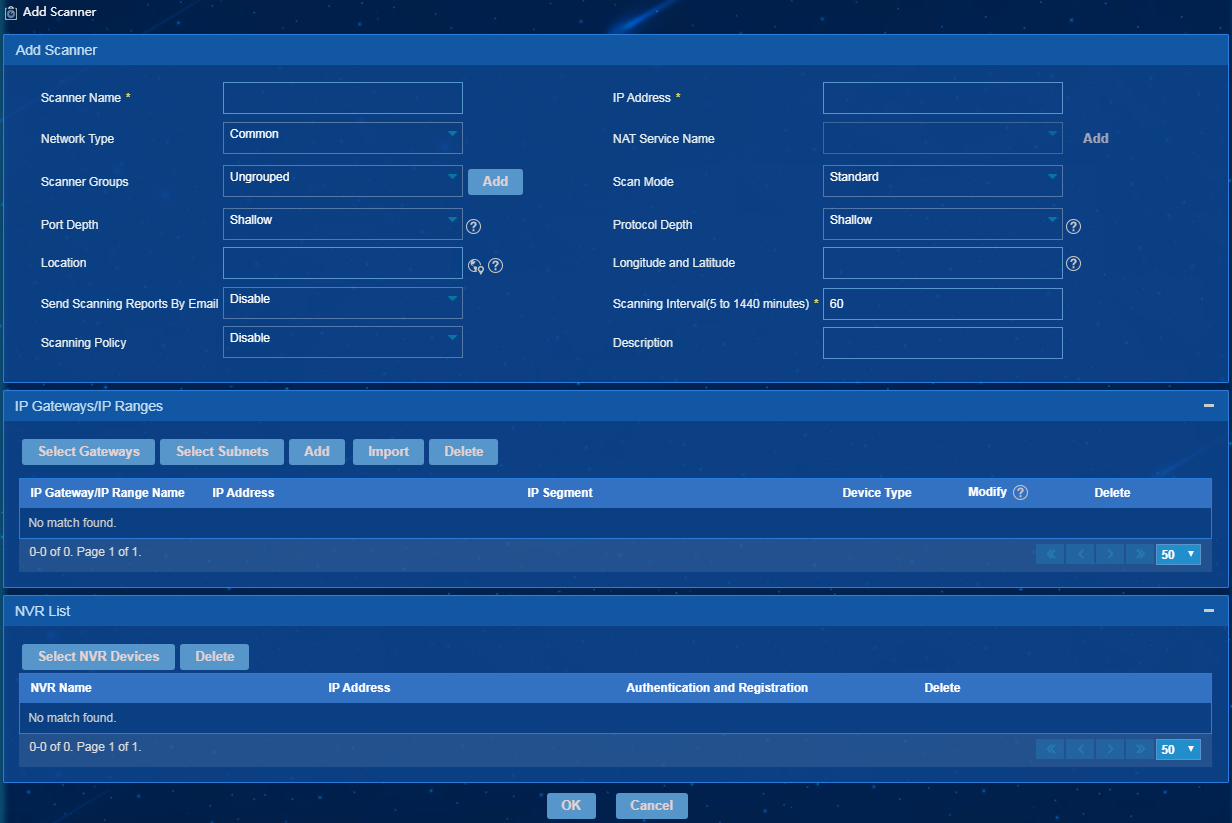
6. Click OK.
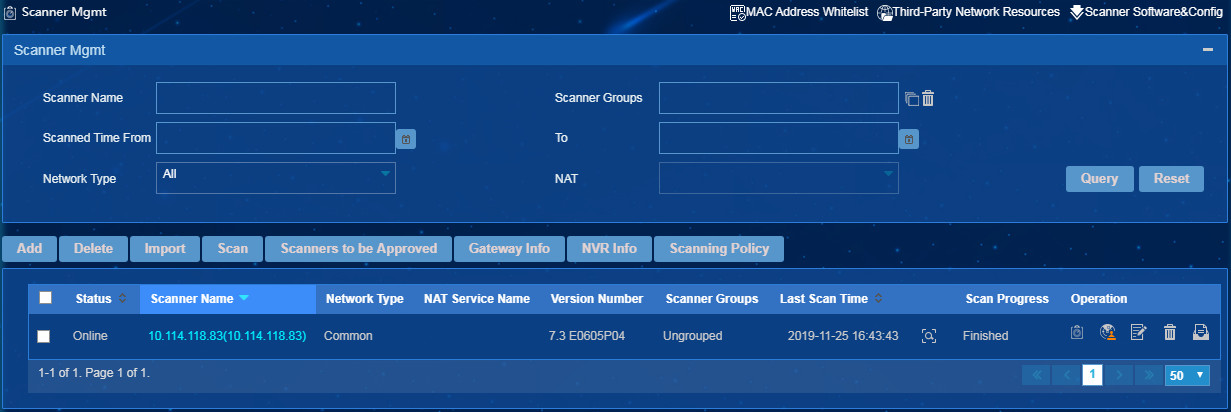
Approving a scanner
EPS does not assign any scanning policies or tasks (for example, learning gateway information) to the scanners that wait to be approved. EPS only exchanges heartbeat packets with these scanners and updates their online status. When receiving a heartbeat packet from an unknown scanner, EPS adds the scanner to the list of scanners to be approved. You can also manually set a scanner to be approved on the scanner management page.
Approving a scanner
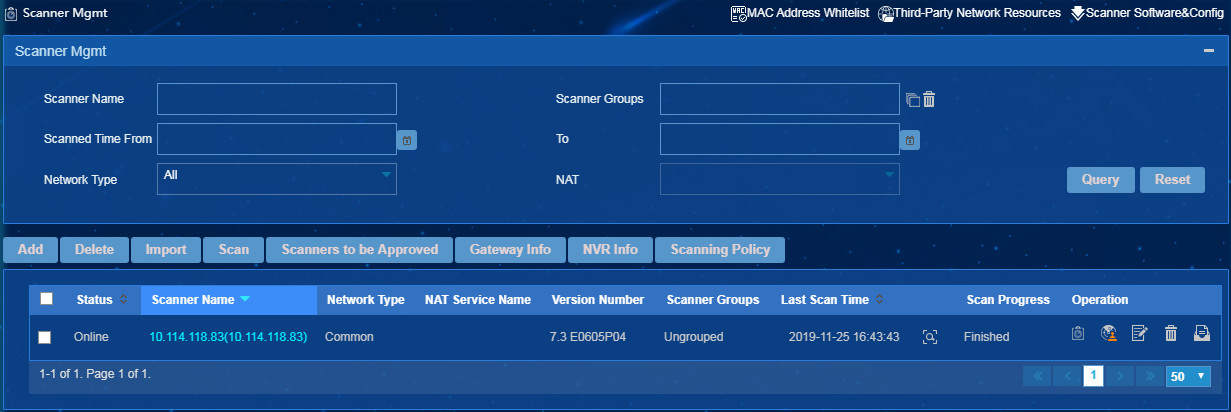
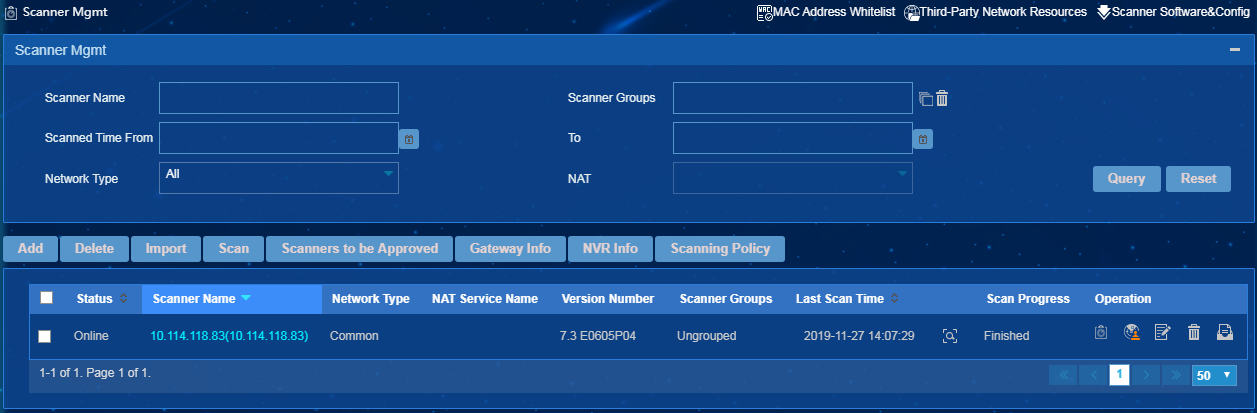
1. From the navigation tree, select Endpoint Profiling Management > Scan Config > Scanner Mgmt.
The scanner management page opens, as shown in Figure 11.

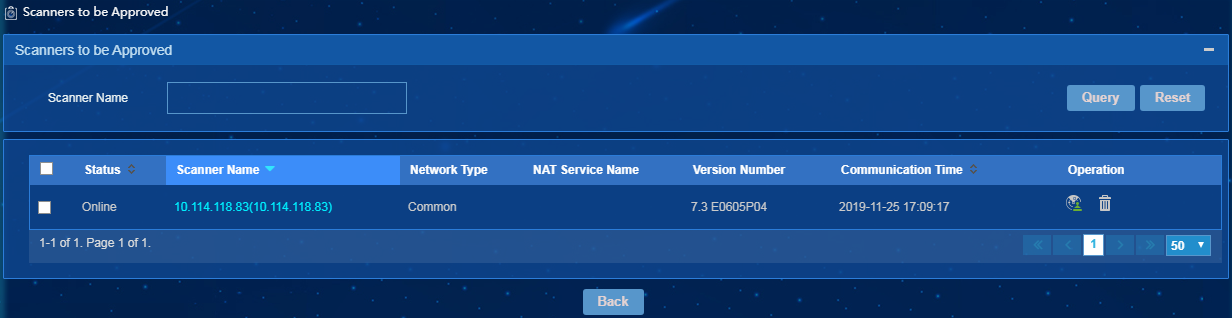
2. Click Scanners to be Approved.
The Scanners to be Approved page opens, as shown in Figure 12.
Figure 12 Scanners to be Approved page
3. Click the Approve icon ![]() for a scanner.
for a scanner.
The page for approving the scanner opens, as shown in Figure 13.
Figure 13 Approving the scanner
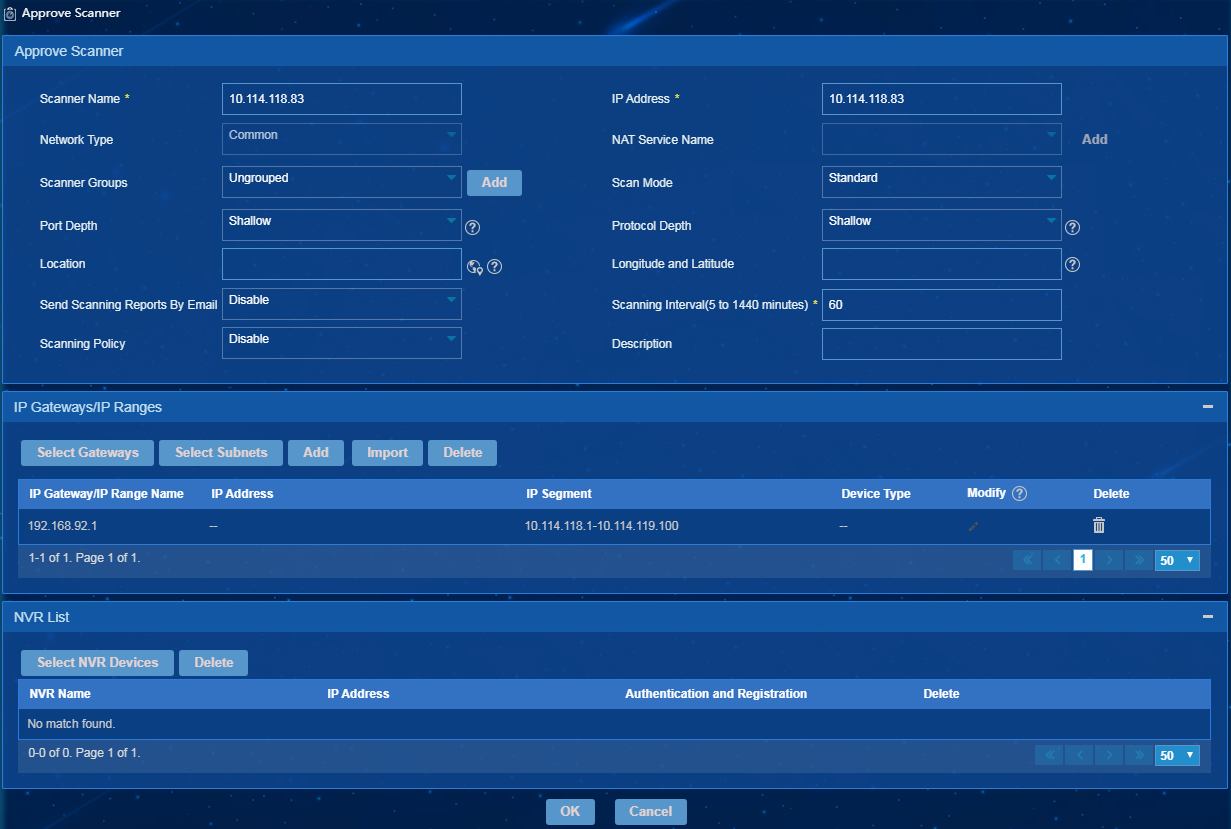
4. Enter the scanner information, select IP gateways or subnets, add IP address ranges, or select NVR devices.
5. Click OK.
Configuring the scanner state as to be approved
1. From the navigation tree, select Endpoint Profiling Management > Scan Config > Scanner Mgmt.
2. Click the Set to be Approved icon ![]() for
a scanner.
for
a scanner.
Figure 14 Setting the scanner to be approved
|
|
IMPORTANT: You cannot set a scanner to be approved when the scanner is executing a scan task. |
Adding a scanning policy
The scanning policy feature allows you to flexibly configure scan tasks for scanners.
To add a scanning policy:
1. From the navigation tree, select Endpoint Profiling Management > Scan Config > Scanner Mgmt.
2. Click Scanning Policy.
The Scanning Policy page opens, as show in Figure 15.
Figure 15 Scanning Policy page
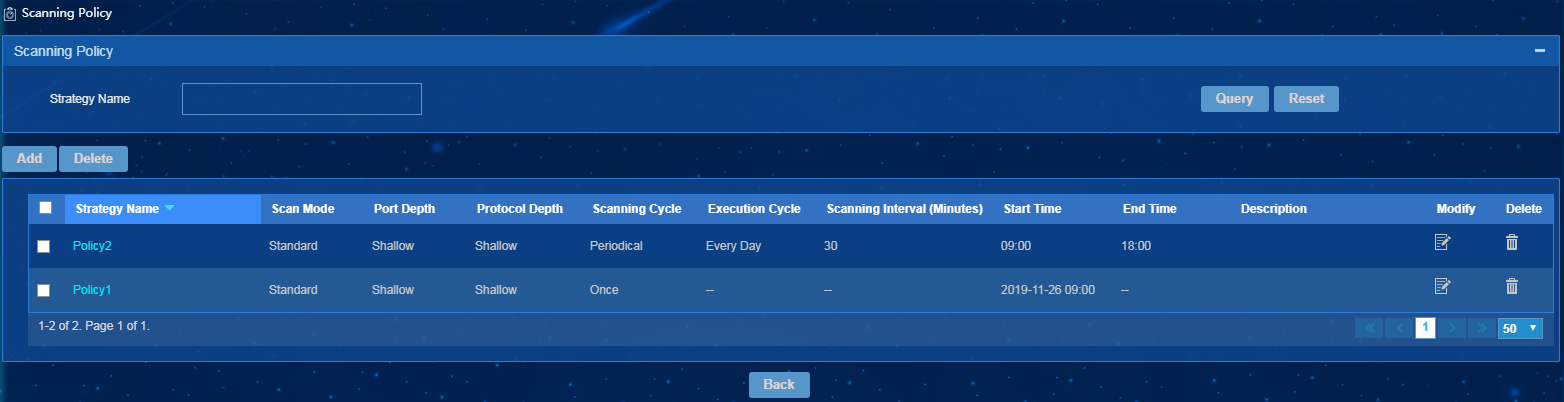
3. Click Add.
The page for adding a scanning policy opens, as shown in Figure 16.
Figure 16 Adding a scanning policy
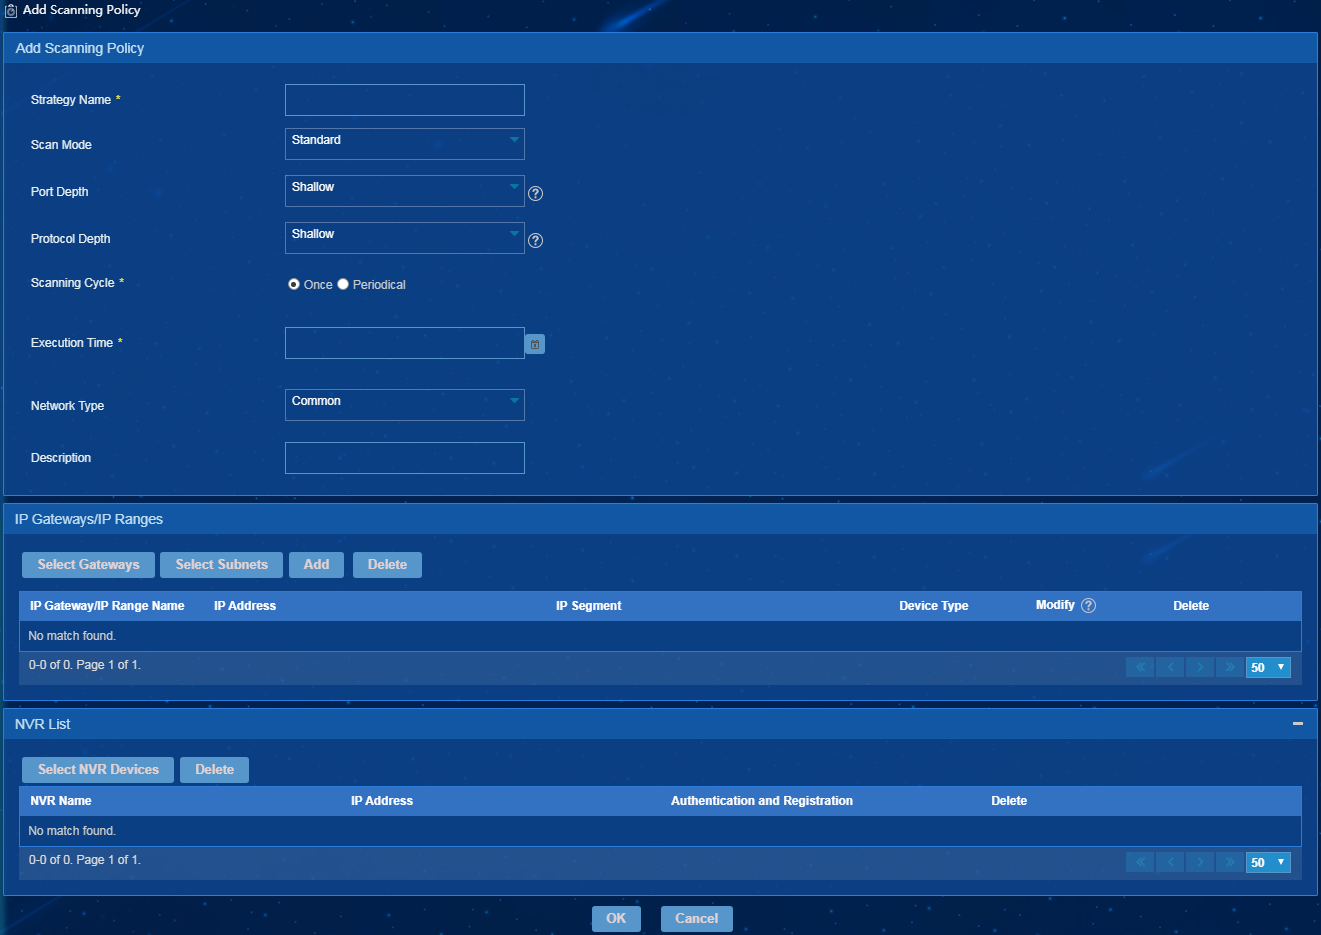
4. Configure the following basic parameters:
¡ Policy Name—Enter the name of the scanning policy.
¡ Scan Mode—Select a scan mode from the Scan Mode list. The following options are supported:
- Standard—Applicable to networks with PCs and mute terminals.
- Camera-Only—Applicable to video networks.
- Camera-First—Applicable to networks with endpoints and cameras.
¡ Port Depth—Select a port depth from the Port Depth list. Options include Shallow, Medium, and Deep. The port depth affects the endpoint information identification. The Deep port depth has a more accurate scan result but costs longer scan time. Select a depth based on the endpoint types. Select Shallow for a network with simple endpoint types. Select Deep if the endpoint types are various and have distinct differences.
¡ Protocol Depth—Select a protocol depth from the Protocol Depth list. Options include Shallow, Medium, and Deep. Protocol depth determines combination of packets used for scan. The Deep protocol depth uses more probe packets and has a more reliable scan result. Select Deep if the network has a high demand on security.
¡ Scanning Cycle—Select Once or Periodical.
- Once—The scanner executes only the scan task only once. You must set the execution time for the scan task.
- Periodical—The scanner executes scan tasks periodically. For periodical scanning tasks, set the execution cycle, scanning interval, start time, and end time.
¡ Execution Time—Set the execution time for the scan task.
¡ Execution Cycle—Select Every Day or Every Week for periodical scan tasks.
¡ Scanning Interval—Set the interval at which the scanner executes scan tasks.
¡ Start Time—Set the start time of the execution cycle.
¡ End time—Set the end time of the execution cycle.
5. In the IP Gateways/IP Ranges area, add one or multiple IP gateways or IP address ranges. The total number of IP gateways and IP address ranges associated with a scanner cannot exceed the upper limit. By default, a scanner can be associated with 20 IP gateways and IP address ranges.
6. In the NVR List area, select NVR devices for camera group management. The scanner obtains camera data from NVR devices and reports it to the EPS server.
7. Click OK.
Scan task
The system supports the following types of scan tasks:
· Automatic scan task—The scan task is assigned by the EPS console or the scanner client. A scanner automatically scans endpoints based on the scanning interval configured on the EPS console or the scanner client.
· Manual scan task—The scan task is manually triggered by the operator.
Automatic scan task
To enable a scanner to automatically scan endpoints, use one of the following methods:
· From the navigation tree, select Endpoint Profiling Management > System Mgmt > System Parameters. In the Basic Parameters area, configure the parameters, as shown in Figure 17.
Figure 17 Configuring the basic parameters
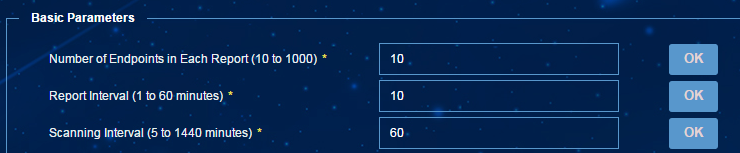
The Report Interval parameter specifies the interval at which a scanner reports the online status of endpoints. The scanner can monitor the online status of endpoints periodically and report the monitoring information at the specified intervals.
The Scanning Interval parameter specifies the interval at which a scanner scans endpoints. The scanner reports all information about endpoints after each scan.
If a scanner is enabled with the scanning policy feature, it executes scan tasks based on the scanning policy settings.
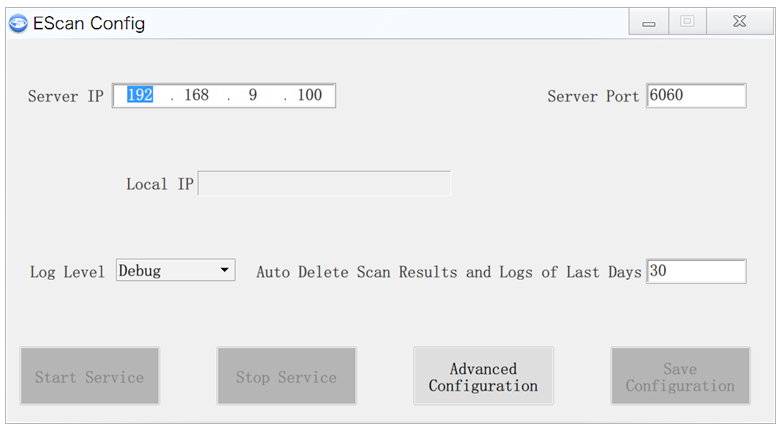
· Configure the scanner client as follows:
a. Launch the scanner client, click Advanced Configuration, as shown in Figure 18.
Figure 18 Scanner client configuration
b. Clear the The following parameter settings are assigned by the server option, and configure scan parameters, as shown in Figure 19.
Figure 19 Configuring scan parameters
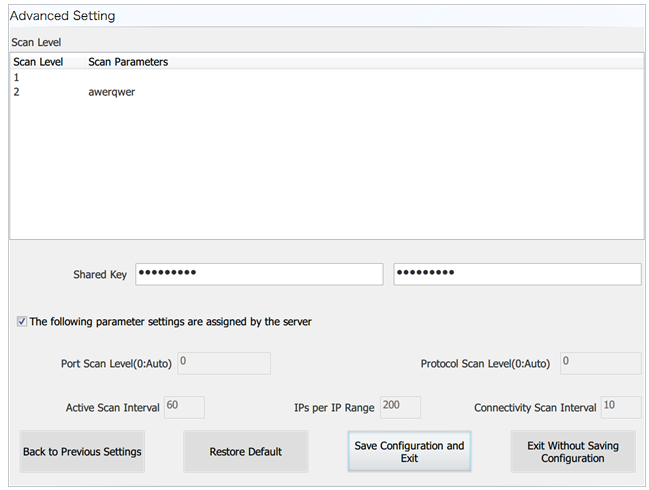
The scanning interval setting takes effect after you set and save the scanning interval setting. The EPS console or the scanner client assigns scan tasks to the scanner based on the scanning interval.
Manual scan task
To manually trigger a scan task for a
scanner, click the Scan ![]() icon
for the scanner on the scanner list. To trigger scan tasks of multiple
scanners, select scanners on the scanner list, and then click Scan.
icon
for the scanner on the scanner list. To trigger scan tasks of multiple
scanners, select scanners on the scanner list, and then click Scan.
Figure 20 Manually triggering a scan task
Scan result
Figure 21 lists endpoint status supported in the scan result.
To view the latest status of all endpoints, access the list of all endpoints.
To view newly discovered endpoints, access the list of new endpoints.
To view endpoints whose scanned information is inconsistent with baseline information, access the list of incompliant endpoints.
Figure 21 Supported endpoint status in scan results
Handling abnormal endpoints
Abnormal endpoints refer to the endpoints whose status is not compliant. The operator must confirm and handle abnormal endpoints.
To confirm an abnormal endpoint, view change items of the endpoint and confirm the changes with the person responsible for the area of the endpoint. Approve the endpoints to be compliant if endpoint changes are compliant. Remove the endpoint if the endpoint changes are incompliant. Table 2 describes common troubleshooting methods for abnormal endpoints.
Table 2 Troubleshooting abnormal endpoints
|
Endpoint status |
Possible reason |
Common troubleshooting method |
|
New |
Newly added endpoint. EPS does not have baseline information of the endpoint. |
Confirm information of the new endpoint with the person responsible for the area. If the endpoint is newly added, approve the endpoint to be compliant. If the endpoint is incompliant for network access, approve the endpoint to be incompliant. |
|
Offline |
The endpoint has been damaged or lost. |
Contact the person responsible for the area to troubleshoot or replace the endpoint. |
|
Incompliant |
The endpoint has replaced another endpoint or is used for incompliant access. |
If the endpoint is confirmed as a new endpoint for replacement and the endpoint information is correct, set the endpoint to be compliant. If the endpoint is confirmed as incompliant for network access and the feature of adding incompliant endpoints to the blacklist has been enabled in system parameter configuration, the endpoint will be added to the blacklist. You can also remove the endpoint. |
|
Unknown |
The IP address of the endpoint is incorrect in EPS, or the endpoint has been damaged or lost. |
Verify that the IP address of the endpoint is correct in EPS or the endpoint has been damaged or lost. |
|
|
NOTE: After you set an incompliant endpoint to be compliant, the baseline information of the endpoint will change to be consistent with the endpoint information. |
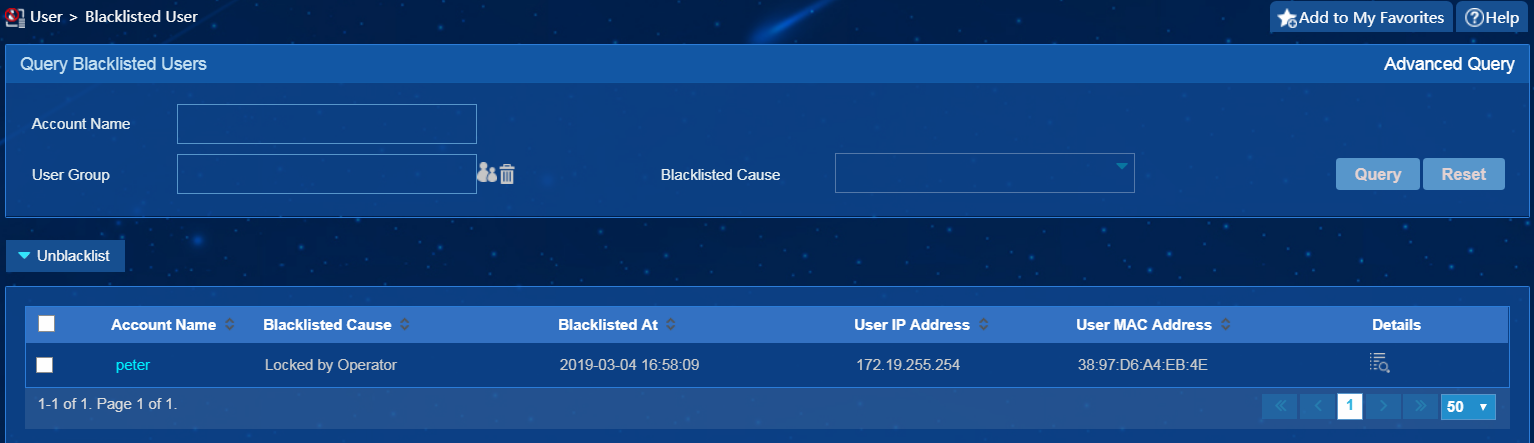
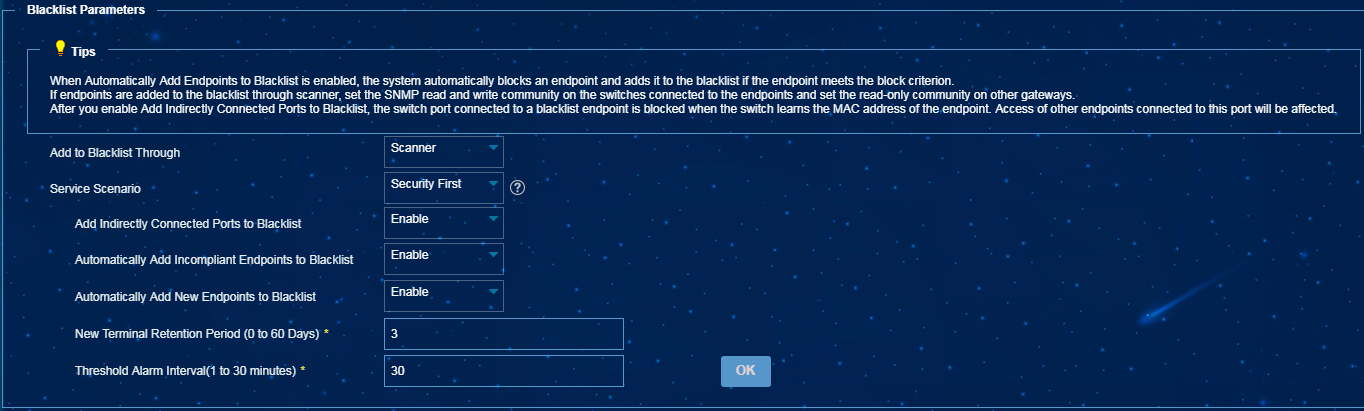
Configuring the endpoint blacklist
You can isolate a user who comes online from a suspicious endpoint. To enable EPS to automatically add new endpoints to the endpoint blacklist, select Enable for Automatically Add New Endpoints to Blacklist on the System Parameters page. To enable EPS to automatically add incompliant endpoints to the blacklist, select Enable for Automatically Add Incompliant Endpoints to Blacklist on the System Parameters page.
EPS adds an endpoint to the endpoint blacklist by using one of the following methods:
· Adds the endpoint to the blacklist through the collaboration with the EIA component.
· Adds the endpoint to the blacklist through the collaboration with scanners. The blacklist is assigned to scanners by EPS. When you use this method, you can enable the Add Indirectly Connected Ports to Blacklist option. After you enable this option, an endpoint will be added to the blacklist as long as a switch learns the MAC address of the endpoint. If this option is not enabled, the system adds an endpoint to the blacklist only when the endpoint is directly connected to the switch that learns the MAC address of endpoint.
Figure 22 Configuring endpoint blacklist parameters
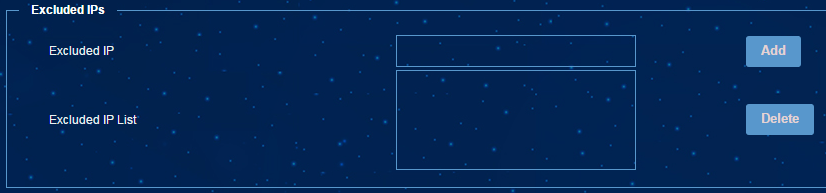
Specifying excluded IP addresses
To exclude endpoints from being scanned, specify IP addresses of these endpoints on the System Parameters page, as shown in Figure 23.
Figure 23 Specifying excluded IP addresses
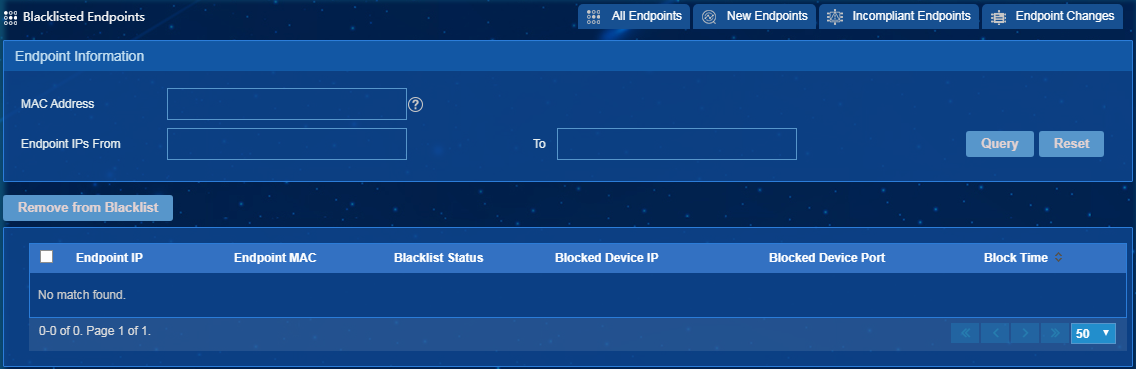
Removing endpoints from the endpoint blacklist
1. From the navigation tree, select Endpoint Profiling System > All Endpoints.
2. Click the Blacklist Endpoint tab.
3. Select endpoints and then click Remove from Blacklist, as shown in Figure 24.
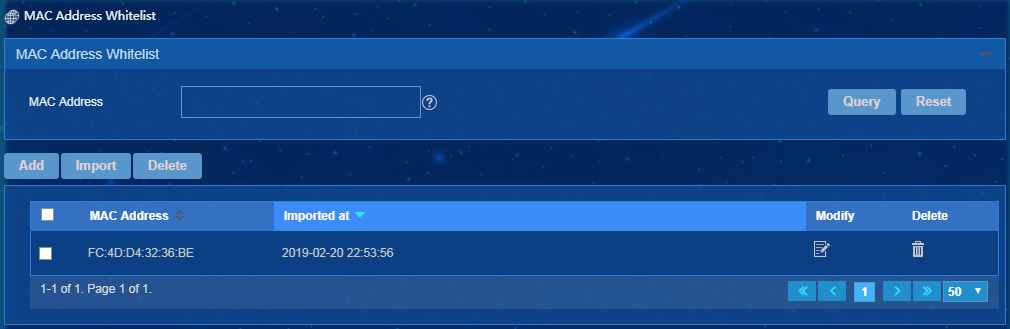
Managing the MAC address whitelist
EPS automatically approves a scanned endpoint to be compliant if the MAC address of the endpoint is on the MAC address whitelist.
You can add MAC addresses to the MAC address whitelist one by one or in bulk by importing a MAC address file.
To access the MAC address whitelist page:
1. From the navigation tree, select Endpoint Profiling System > Scan Config > Scanner Mgmt.
2. Click the MAC Address Whitelist link in the top right corner of the Scanner Mgmt page.
Figure 25 MAC address whitelist
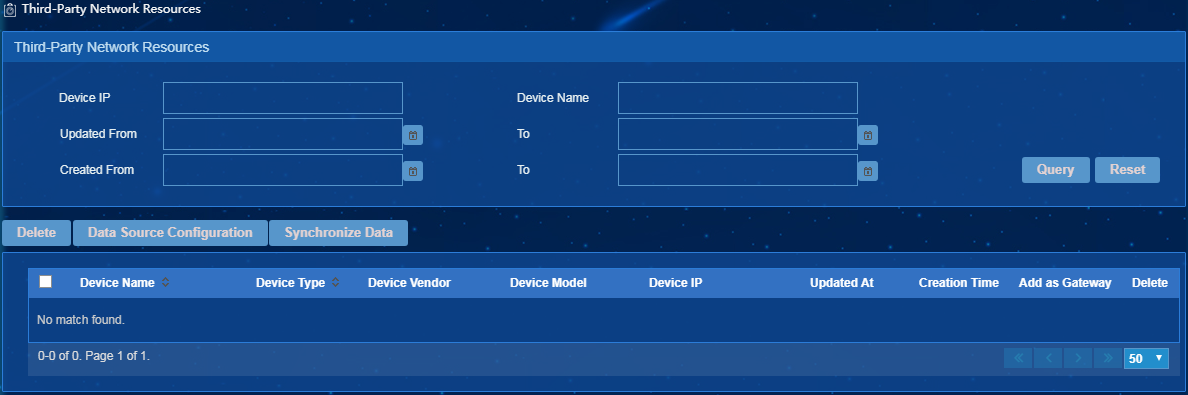
Managing third-party network resources
Use this feature to synchronize data of the third-party network resources to EPS.
To access the page for managing third-party network resources, select Endpoint Profiling Management > Scan Config > Scanner Mgmt from the navigation tree, and click the Third-Party Network Resources link.
As show in Figure 26, the third-party network resource configuration page provides the follow features:
· Data source configuration—Allows you to configure the third-party data source for data synchronization.
· Synchronize data—Synchronizes the third-party data to EPS. Before data synchronization, enable the third-party data source configuration.
· Add as Gateway—Synchronizes data to the gateway device information.
Figure 26 Configuring the third-party network resources
Managing the scanner software and configuration
Use this feature to upgrade the scanner software version or configuration version.
To access the scanner software and configuration management page, select Endpoint Profiling Management > Scan Config > Scanner Mgmt from the navigation tree, and click the Scanner Software & Configuration Management link.
The scanner software version upgrade refers to the overall software upload of the scanner.
To upgrade the scanner configuration, upload the configuration file or add files to the installation path of the scanner (C:\Program Files (x86)\Escan, for example).
Figure 27 Managing the scanner software and configuration
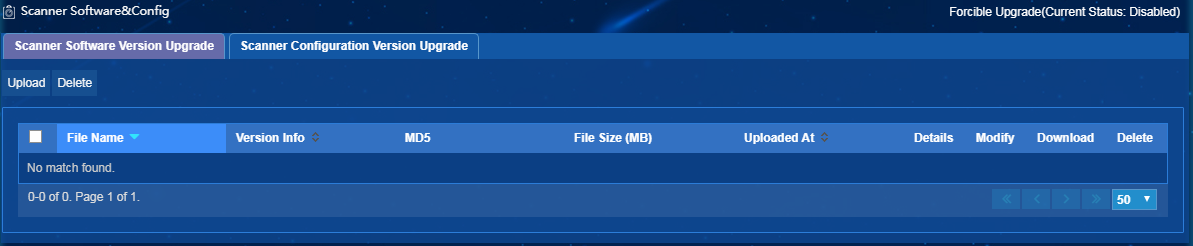
If you have upgraded the software version for scanners, you do not need to upgrade the configuration of the scanners because the software version upgrade includes updates of configuration files.
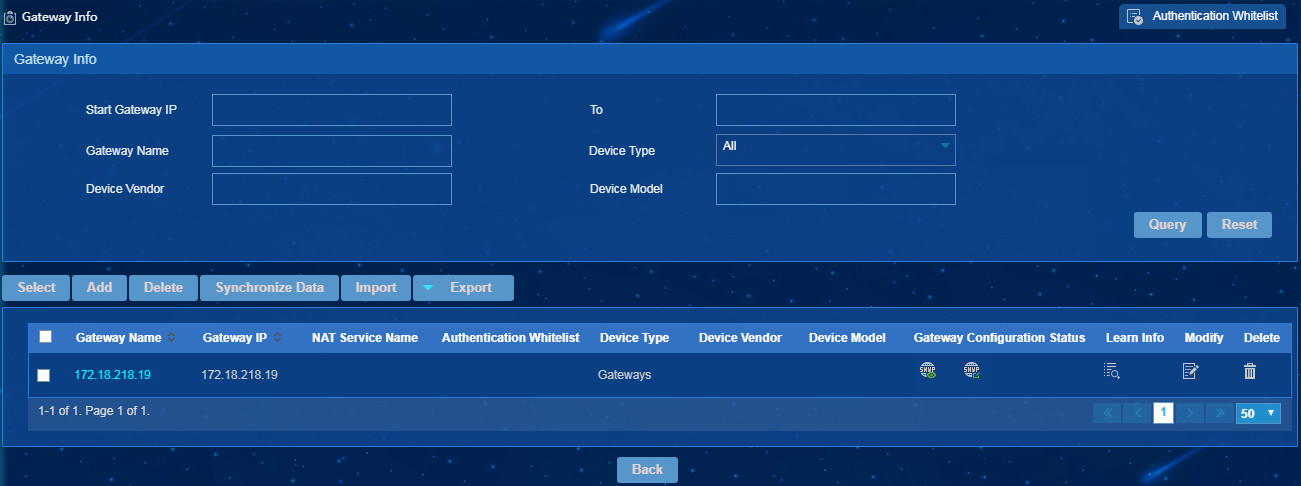
Managing gateway information
The Gateway Info page displays the following gateway information in a list form: gateway device name, IP address, device type, NAT service configuration, and SNMP parameter.
Adding gateways
You can use one of the following methods to add gateway information:
· Select gateways from the iMC platform. Unsupported devices are not displayed for selection.
· Manually add one or a few gateways.
· Batch import gateways. This method is preferred to add a large number of gateway devices.
Figure 28 Managing gateway information
Learning information
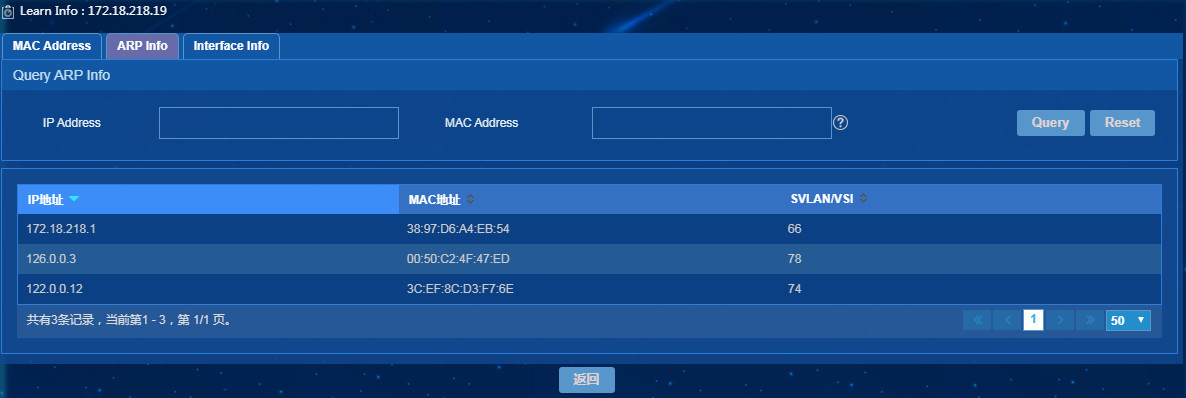
Click the Learn Info
icon ![]() to open the Learn
Info page. The page displays the gateway's MAC address table, ARP table,
and interface table learned automatically by the scanner.
to open the Learn
Info page. The page displays the gateway's MAC address table, ARP table,
and interface table learned automatically by the scanner.
· The MAC address table displays the MAC address entries of the gateway.
· The ARP table displays the IP address-to-MAC address mappings of the gateway.
· The interface table displays information about all interfaces, including their interface descriptions, IP addresses, IP address masks, MAC addresses, and interface indexes.
Figure 29 Learning information
|
|
NOTE: · The MAC address, ARP, and interface tables will be empty if the gateway cannot learn any entries because of malfunctioning or network failure. · The MAC address table is empty if the gateway is on a router. |
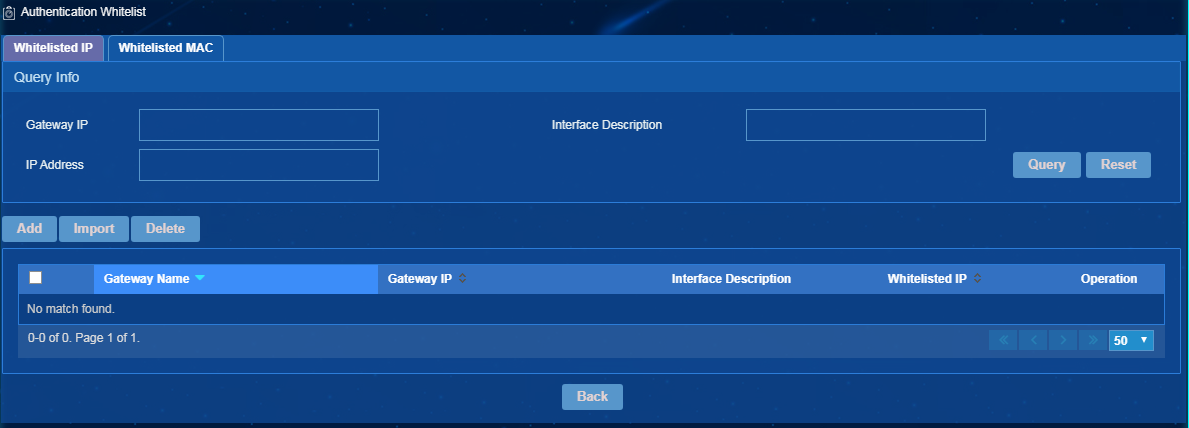
Authentication whitelist
The authentication whitelist contains the following types:
· IP authentication whitelist—Controls the network access of endpoints based on the access port and IP address.
· MAC authentication whitelist—Controls the network access of endpoints based on the access port and MAC address.
An endpoint can access the network resources through the access port only when its IP address or MAC address passes authentication. EPS allows you to manage the authentication whitelist, configure the authentication whitelist for a security gateway, and view information about all authentication whitelists.
|
|
IMPORTANT: · For an authentication whitelist to operate correctly on a gateway, enable the SNMP agent and configure correct SNMP parameters on the gateway for the gateway to obtain interface information. · The system will fail to add or import authentication whitelist addresses if you select an incorrect interface description. · A security gateway can be bound only to one scanner. |
You can view, add, import, and delete whitelisted IP and MAC addresses on the authentication whitelist page. To access the authentication whitelist page as shown in Figure 6, click the Authentication Whitelist link in the upper right corner of the gateway information page.
Figure 30 Authentication whitelist
Add one or multiple whitelisted IP addresses
1. On the Whitelisted IP tab, click Add.
The page for adding whitelisted IP addresses opens, as shown in Figure 7.
Figure 31 Adding whitelisted IP addresses
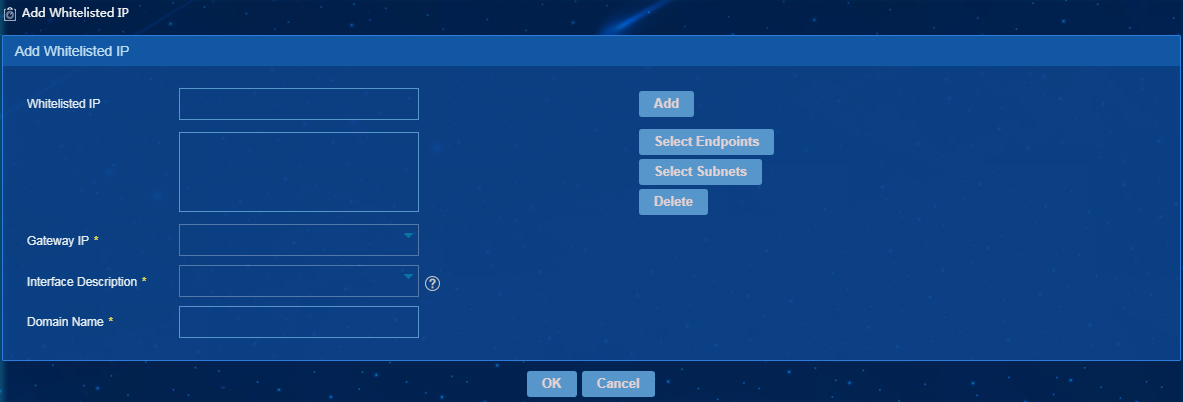
2. Configure whitelisted IP addresses as follows:
¡ Whitelisted IP—Add whitelisted IP addresses by using one of the following methods:
- Enter an IP address or IP address range, and then click Add.
- Click Select Endpoints, and then select IP addresses.
- Click Select Subnets, and then select IP subnets.
¡ Gateway IP—Select the IP address of a security gateway.
¡ Interface Description—Select the description of the security gateway interface.
¡ Domain Name—Enter the domain name of the security gateway.
3. Click OK.
|
|
IMPORTANT: · Each IP address on the IP authentication whitelist must be unique. · After you add an IP address to the IP authentication whitelist for a security gateway, it takes a period of time for the gateway to return the operation result. To view the operation result, please wait and then refresh the page. |
Adding one or multiple whitelisted MAC addresses
1. On the Whitelisted MAC tab, click Add.
The page for adding whitelisted MAC addresses opens, as shown in Figure 8.
Figure 32 Adding whitelisted MAC addresses
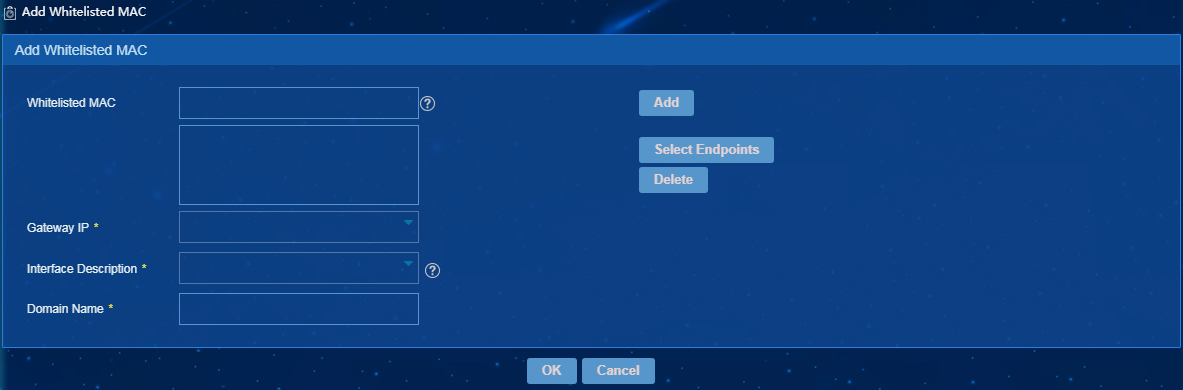
2. Configure whitelisted MAC addresses as follows:
¡ Whitelisted MAC—Add whitelisted MAC addresses by using one of the following methods:
- Enter a MAC address, and then click Add.
- Click Select Endpoints, and then select MAC addresses.
¡ Gateway IP—Select the IP address of a security gateway.
¡ Interface Description—Select the description of the security gateway interface.
¡ Domain Name—Enter the domain name of the security gateway.
3. Click OK.
|
|
IMPORTANT: · Each MAC address on the MAC authentication whitelist must be unique. · After you add a MAC address to the MAC authentication whitelist for a security gateway, it takes a period of time for the gateway to return the operation result. To view the operation result, please wait and then refresh the page. |
Configuring collaboration with security gateways
This feature allows EPS to collaborate with security gateways to remove incompliant endpoints from the authentication whitelists of the security gateways. The removed endpoints will be added to the authentication whitelists when they are approved to be compliant.
To configure collaboration with security gateways:
1. From the navigation tree, select Endpoint Profiling Management > System Mgmt > System Parameters.
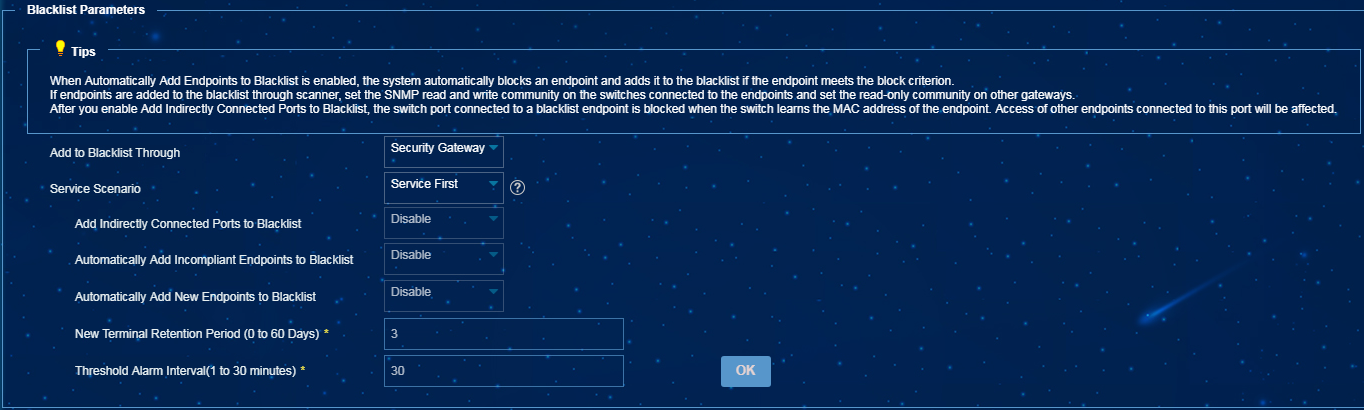
2. In the Blacklist Parameters area, select Security Gateway for Add to Blacklist Through, and then configure collaboration parameters, as shown in Figure 9.
Figure 33 Configuring the collaboration with security gateways
3. Click OK.
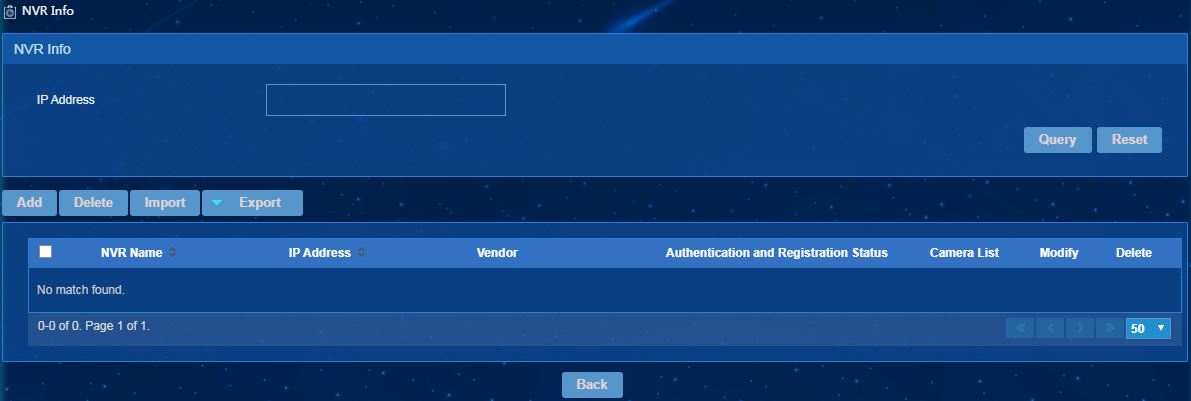
Managing NVR information
EPS uses NVR devices to manage camera groups. Scanners obtain camera data from NVR devices and report the data to the server.
To access the NVR Info page, select Endpoint Profiling Management > Scan Config > Scanner Mgmt from the navigation tree, and then click NVR Info.
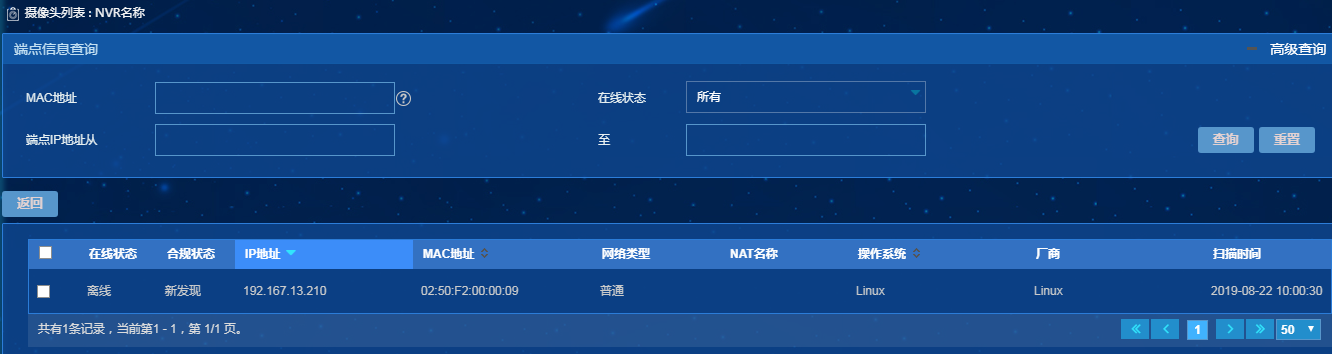
Viewing the camera list
To view cameras managed by an NVR device,
click the Camera List icon ![]() for
the NVR device on the NVR list.
for
the NVR device on the NVR list.
Figure 35 Camera list
Adding an NVR device
1. On the NVR Info page, click Add.
The page for adding an NVR device opens, as shown in Figure 12.
Figure 36 Adding an NVR device
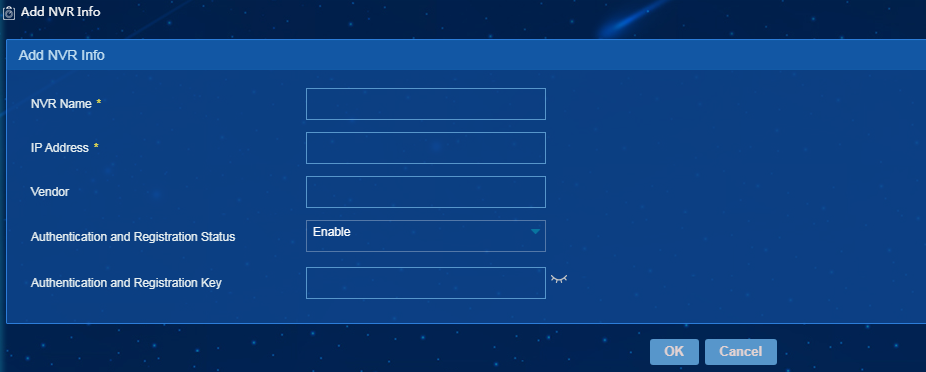
2. Configure the following parameters:
¡ NVR name—Enter a unique name of the NVR device.
¡ IP Address—Enter the IP address of the NVR device. IP addresses of NVR devices must be different.
¡ Vendor—Enter the vendor of the NVR device.
¡ Authentication and Registration Status—Select Enable or Disable. You must configure an authentication and registration key when Enable is selected for Authentication and Registration Status.
¡ Authentication and Registration Key—Enter an authentication and registration key, a string of 8 to 20 characters.
3. Click OK.
Configuring NAT
If hosts on the network use private addresses and communicate with hosts on the Internet without encryption, configure NAT for the network.
EPS supports scanning NAT networks. You can configure multiple IP address ranges for a NAT service. IP addresses in IP address ranges of the same NAT service or different NAT services cannot be the same. A NAT service supports a maximum of 20 IP address ranges.
Figure 37 Configuring NAT
Configuring dynamic IP ranges
Configure dynamic IP address ranges if endpoints obtain IP addresses through DHCP. An endpoint in a dynamic IP range is identified by its MAC address and NAT ID.
To access the Dynamic IP Range page, select Endpoint Profiling System > System Mgmt > Dynamic IP Range from the navigation tree.
|
|
IMPORTANT: If the network type is NAT, you must configure a dynamic IP range as a subset of a NAT IP range. |
Figure 38 Dynamic IP Range page
Endpoint management
Endpoint management includes endpoint device management, endpoint baseline management, and endpoint status management.
Endpoint device management
Adding endpoints
You can manually add endpoints, batch import endpoints, or scan to discover new endpoints.
Figure 39 Methods of adding endpoints
Manually adding endpoints
On the All Endpoints page, click Add to add a single endpoint, and configure endpoint information as shown in Figure 16. For a manually added endpoint, the online status is Unknown and the compliance status is Compliant.
Figure 40 Adding a single endpoint
If the endpoint requires special attention, select Yes for Followed Endpoints. The endpoint will be added to the list of followed endpoints.
Additional information includes the asset number, start date of use, asset name, maintenance times, person responsible, and organization. On the additional information list, you can specify the additional information input rules, including name, field type, and maximum length. If information of an existing endpoint does not comply with the new input rules after the input rules are modified, you must manually modify the information of the endpoint to make the information comply with new input rules.
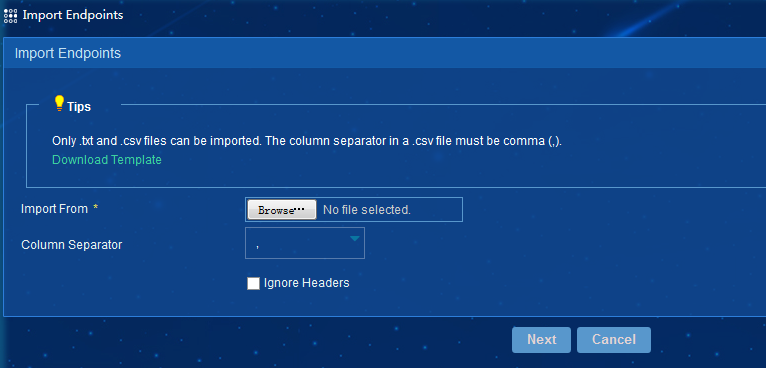
Batch importing endpoints
If you have an endpoint information file, click Import on the All Endpoints page, and then batch import endpoints as shown in Figure 17. For batch imported endpoints, the online status is Unknown and the compliance status is Compliant.
Figure 41 Batch importing endpoints
Scanning to discover endpoints
After you use scanners to discover endpoints, EPS compares information about the discovered endpoints with the endpoint baseline. If an endpoint is identified as a new endpoint after the comparison, the endpoint is added to the EPS console. For this endpoint, the online status is Online and the compliance status is New.
You can view information about new endpoints on the all endpoints list or new endpoints list.
Approving endpoints
When you think an endpoint is secure and reliable, you can approve the endpoint to be compliant, and approve or modify the endpoint baseline. Then, the compliance status of the endpoint becomes Compliant.
Figure 42 Approving endpoints
You can approve endpoints in one of the following methods.
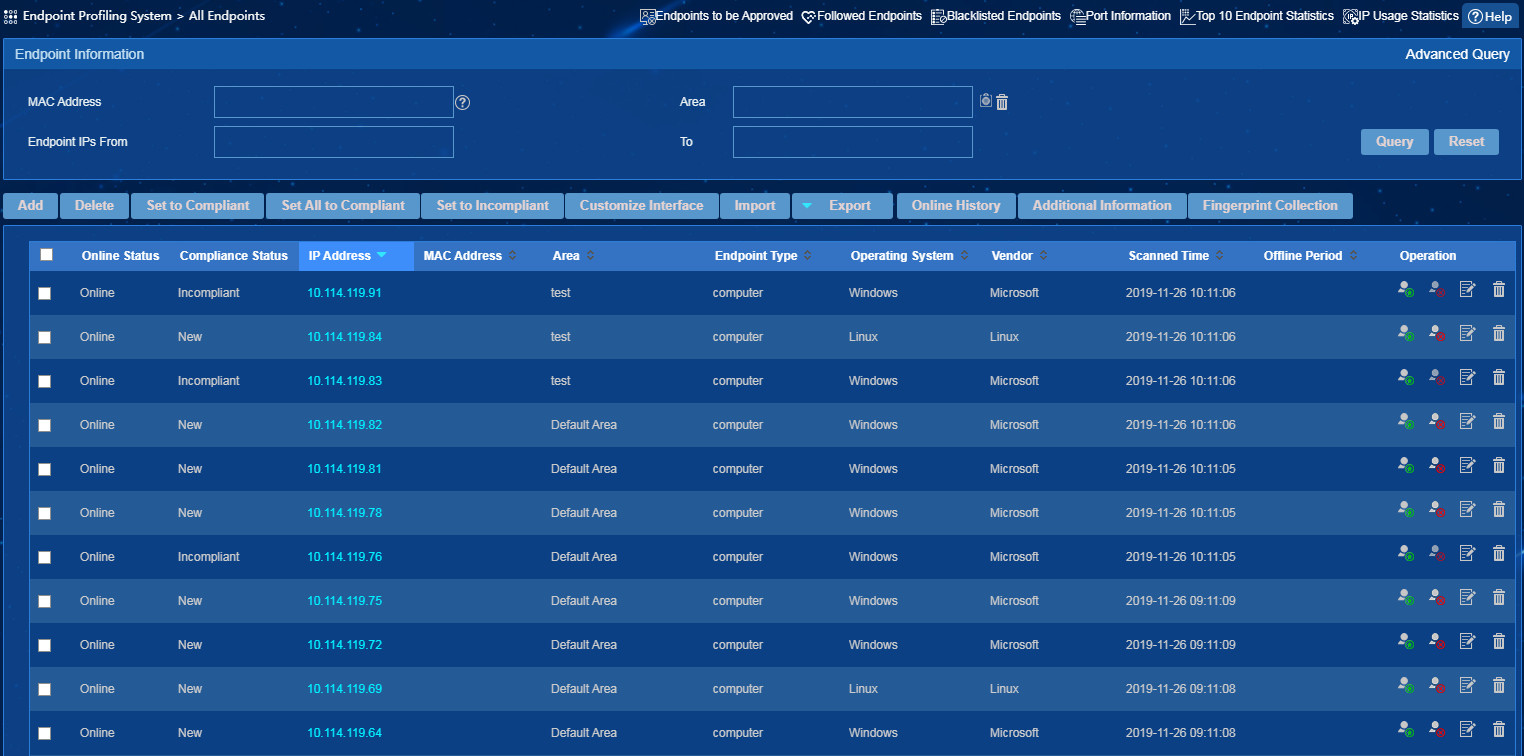
Method I: Approving new endpoints and incompliant endpoints on the all endpoints list
To set the status of multiple endpoints to compliant or incompliant, select the endpoints, and then click Set to Compliant or Set to Incompliant.
To set the status of an endpoint to compliant
or incompliant, click its Set to Compliant icon ![]() or Set to Incompliant
icon
or Set to Incompliant
icon ![]() in the Operation
column, respectively.
in the Operation
column, respectively.
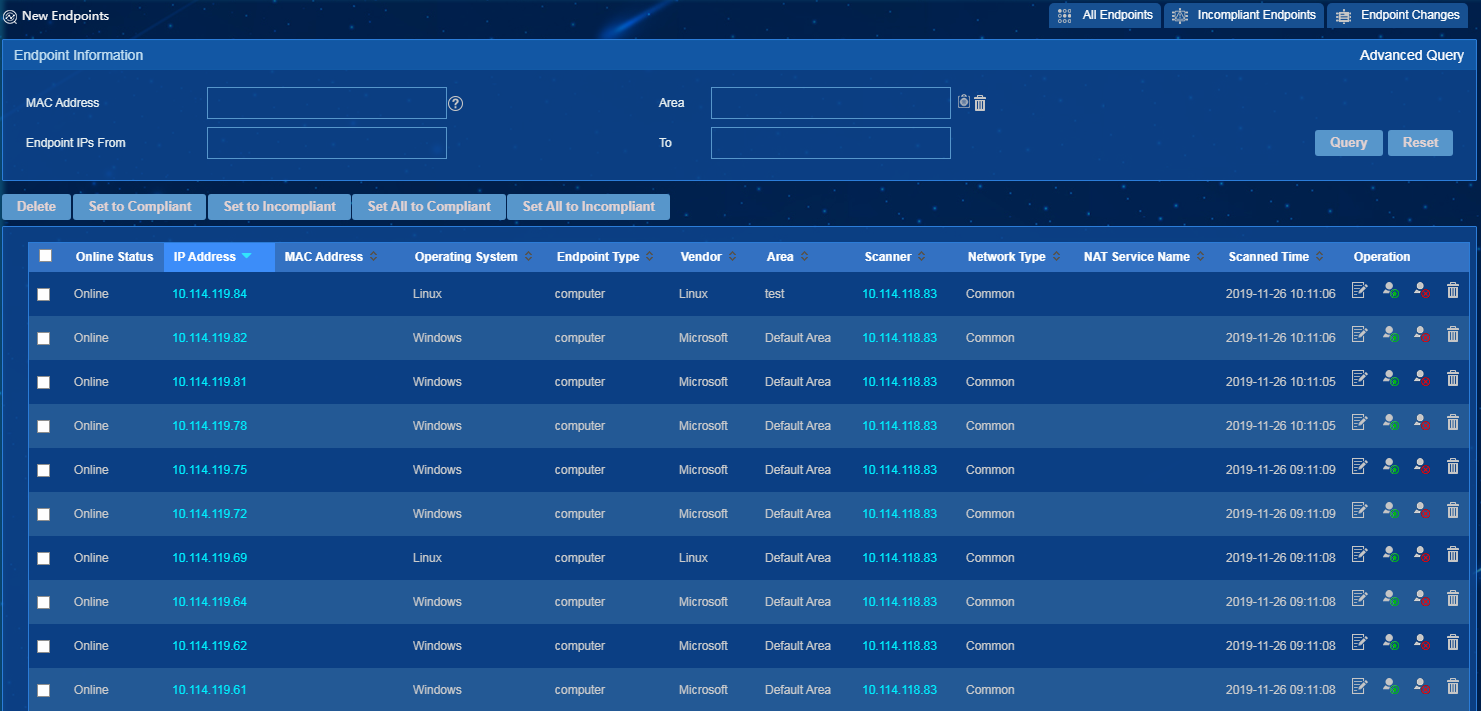
Method II: Approving new endpoints on the new endpoint list
To place all new endpoints in compliant or incompliant status, click Set All to Compliant or Set All to Incompliant, respectively.
To place multiple new endpoints in compliant or incompliant status, select the endpoints, and then click Set to Compliant or Set to Incompliant, respectively.
To place an endpoint in compliant or incompliant
status, click its Set to Compliant icon ![]() or Set to Incompliant
icon
or Set to Incompliant
icon ![]() in the Operation
column, respectively.
in the Operation
column, respectively.
Figure 44 Approving new endpoints
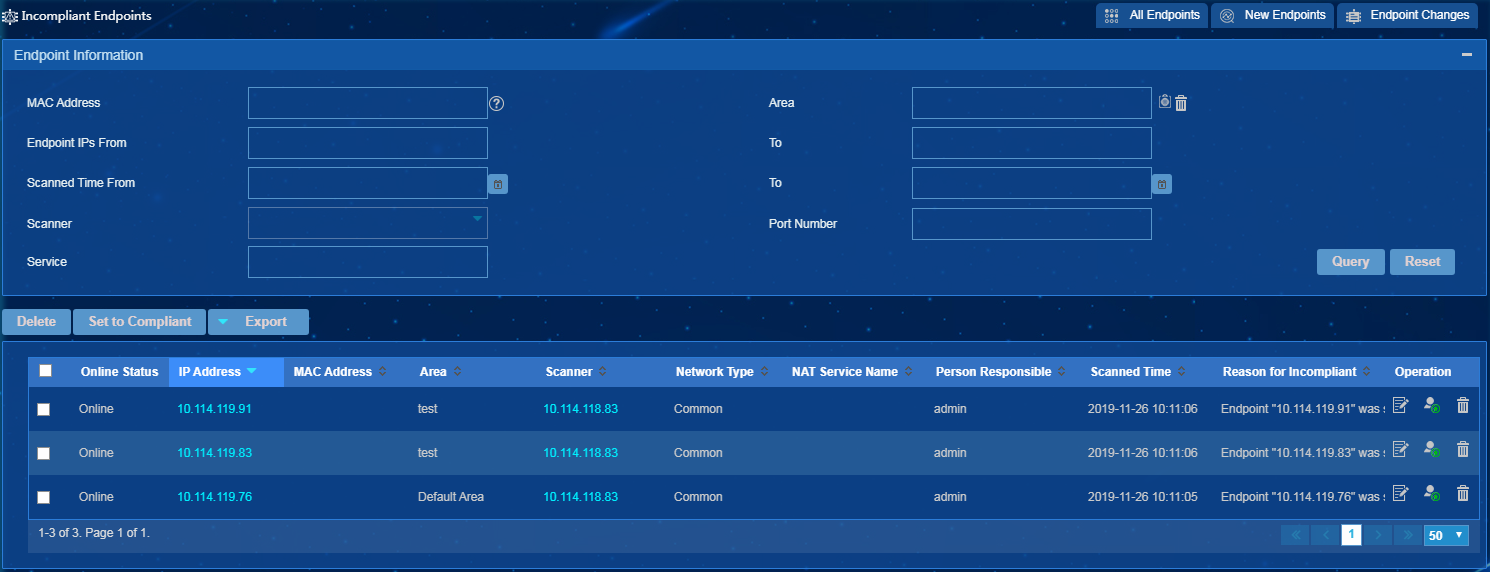
Method III: Approving incompliant endpoints on the incompliant endpoint list
To place multiple incompliant endpoints in compliant status, select the endpoints, and then click Set to Compliant.
To place an incompliant endpoint in compliant
status, click its Set to Compliant icon ![]() in the Operation
column.
in the Operation
column.
Figure 45 Approving incompliant endpoints
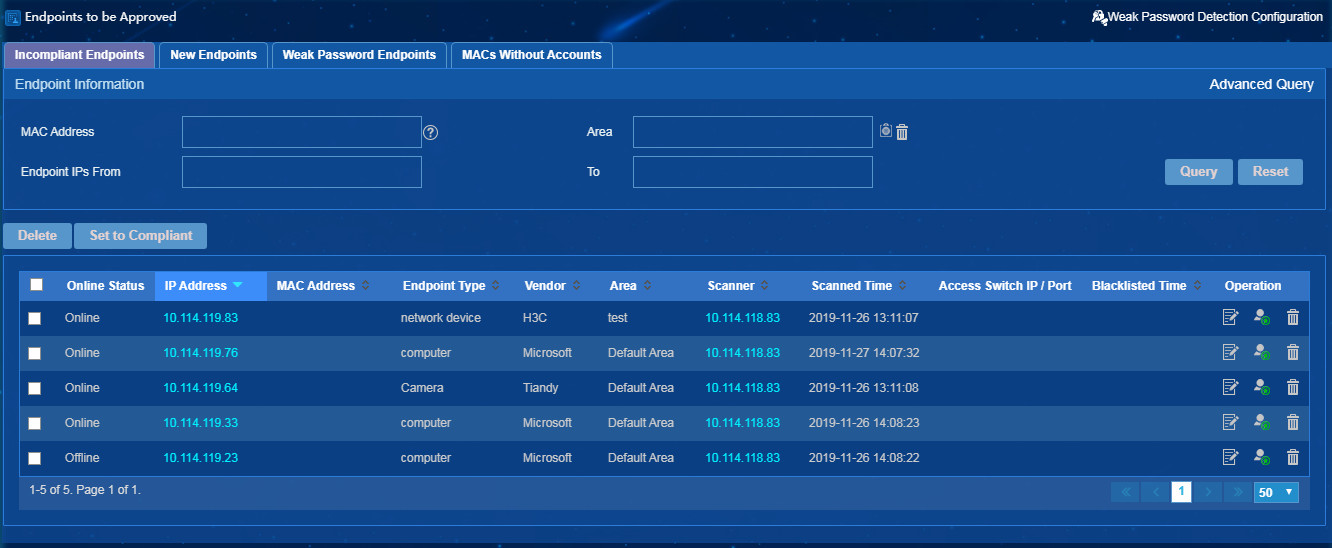
Method IV: Approving endpoints on the list of endpoints to be approved
On the Endpoints to be Approved page, you can approve incompliant endpoints, new endpoints, and endpoints with weak passwords.
· On the Incompliant Endpoints tab, to place incompliant endpoints in compliant status, select endpoints, and then click Set to Compliant.
· On the New Endpoints tab, to place all new endpoints in compliant or incompliant status, click Set All to Compliant or Set All to Incompliant. To place one or multiple new endpoints in compliant or incompliant status, select endpoints, and then click Set to Compliant or Set to Incompliant.
· On the Weak Password Endpoints tab, to place all endpoints with weak passwords in incompliant status, click Set All to Incompliant. To place one or multiple endpoints with weak password in incompliant status, select endpoints, and then click Set to Incompliant.
Figure 46 Approving endpoints
Endpoint baseline management
The endpoint baseline is the endpoint compliance information added or modified by the operator or reported by the scanners and approved by the operator. The endpoint baseline includes the endpoint's MAC, operating system, vendor, and endpoint type.
Viewing the endpoint baseline
View the endpoint baseline in one of the following methods.
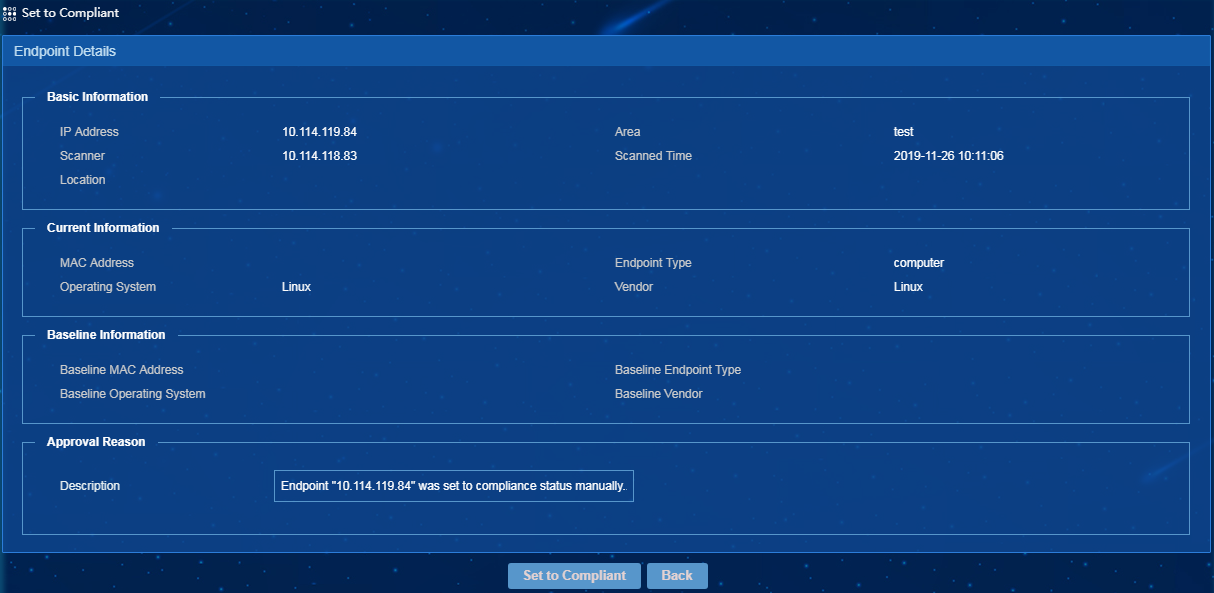
Viewing the endpoint baseline on the page for approving endpoints
When approving a single endpoint, you can
view the endpoint baseline. On the endpoint list, you can click the Set to Compliant icon ![]() or
Set to Incompliant icon
or
Set to Incompliant icon ![]() for
an endpoint in the Operation column to enter the
endpoint approval page, and view its baseline, as shown in Figure 23.
for
an endpoint in the Operation column to enter the
endpoint approval page, and view its baseline, as shown in Figure 23.
Exporting the baseline file
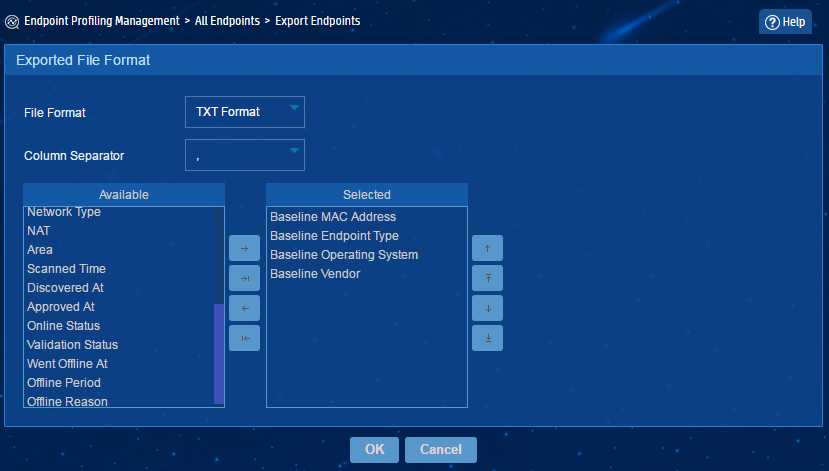
On the page for exporting endpoint information, you can select to export the endpoint baseline information (including the baseline MAC address, baseline endpoint type, baseline operating system, and baseline vendor), as shown in Figure 24. After exporting the baseline, you can download the file and view the endpoint baseline.
Figure 48 Exporting the baseline
Adding a baseline
Add a baseline in one of the following methods:
· When you batch import or manually add endpoints, the MAC addresses, operating systems, vendors, and endpoint types of these endpoints are recorded as the baselines. For information about batch importing or manually adding endpoints, see "Adding endpoints."
· For new endpoints discovered by scanners, the MAC addresses, operating systems, vendors, and endpoint types of the endpoints approved to be compliant are recorded as the baselines.
Modifying a baseline
Modifying a baseline through approving an incompliant endpoint
When the personal responsible for an area replaces an endpoint that is lost or damaged, its endpoint information (including MAC address, operating system, vendor, and endpoint type) is different from the baseline in the system. After the operator confirms with the personal responsible for the area that the incompliant endpoint is trusted, the operator can approve the endpoint to be compliant. Then, the system automatically modifies the baseline of the endpoint to be the same as endpoint information.
Manually modifying a baseline
On the endpoint list, click the ![]() icon for an endpoint in the Operation column. On the page for modifying the endpoint
information, the baseline of the endpoint changes accordingly if you modify the
MAC address, operating system, vendor, or endpoint type of the endpoint. After
you modify an endpoint, the online status of the endpoint is Unknown, and the compliance status of the endpoint is Compliant.
icon for an endpoint in the Operation column. On the page for modifying the endpoint
information, the baseline of the endpoint changes accordingly if you modify the
MAC address, operating system, vendor, or endpoint type of the endpoint. After
you modify an endpoint, the online status of the endpoint is Unknown, and the compliance status of the endpoint is Compliant.
Deleting a baseline
Deleting an endpoint in any status also deletes its baseline.
Endpoint status management
The endpoint status includes the online status and compliance status.
The online status of an endpoint can be Online, Unknown, and Offline. For more information, see Table 3.
The compliance status of an endpoint can be New, Compliant, and Incompliant. For more information, see Table 4.
Table 3 Online status comparison
|
Online status |
Whether a scanner has scanned the endpoint |
Whether EPS has the baseline of the endpoint |
Remarks |
|
Unknown |
No |
Yes |
The endpoint is manually added or batch imported, but no scanner has scanned the endpoint. |
|
Online |
Yes |
Yes |
A scanner has scanned the endpoint. |
|
Offline |
No |
Yes |
The endpoint already exists in the system, but no scanner has scanned the endpoint during the most recent scan. |
Table 4 Compliance status comparison
|
Compliance status |
Whether a scanner has scanned the endpoint |
Whether EPS has the baseline of the endpoint |
Remarks |
|
New |
Yes |
No |
The baseline of the endpoint does not exist in the system. The endpoint is newly discovered by a scanner. |
|
Compliant |
Yes |
Yes/No |
The endpoint is approved to be compliant by the operator, or the scanned endpoint information is consistent with the baseline. |
|
Incompliant |
Yes |
Yes |
The scanned endpoint information is inconsistent with the baseline. |
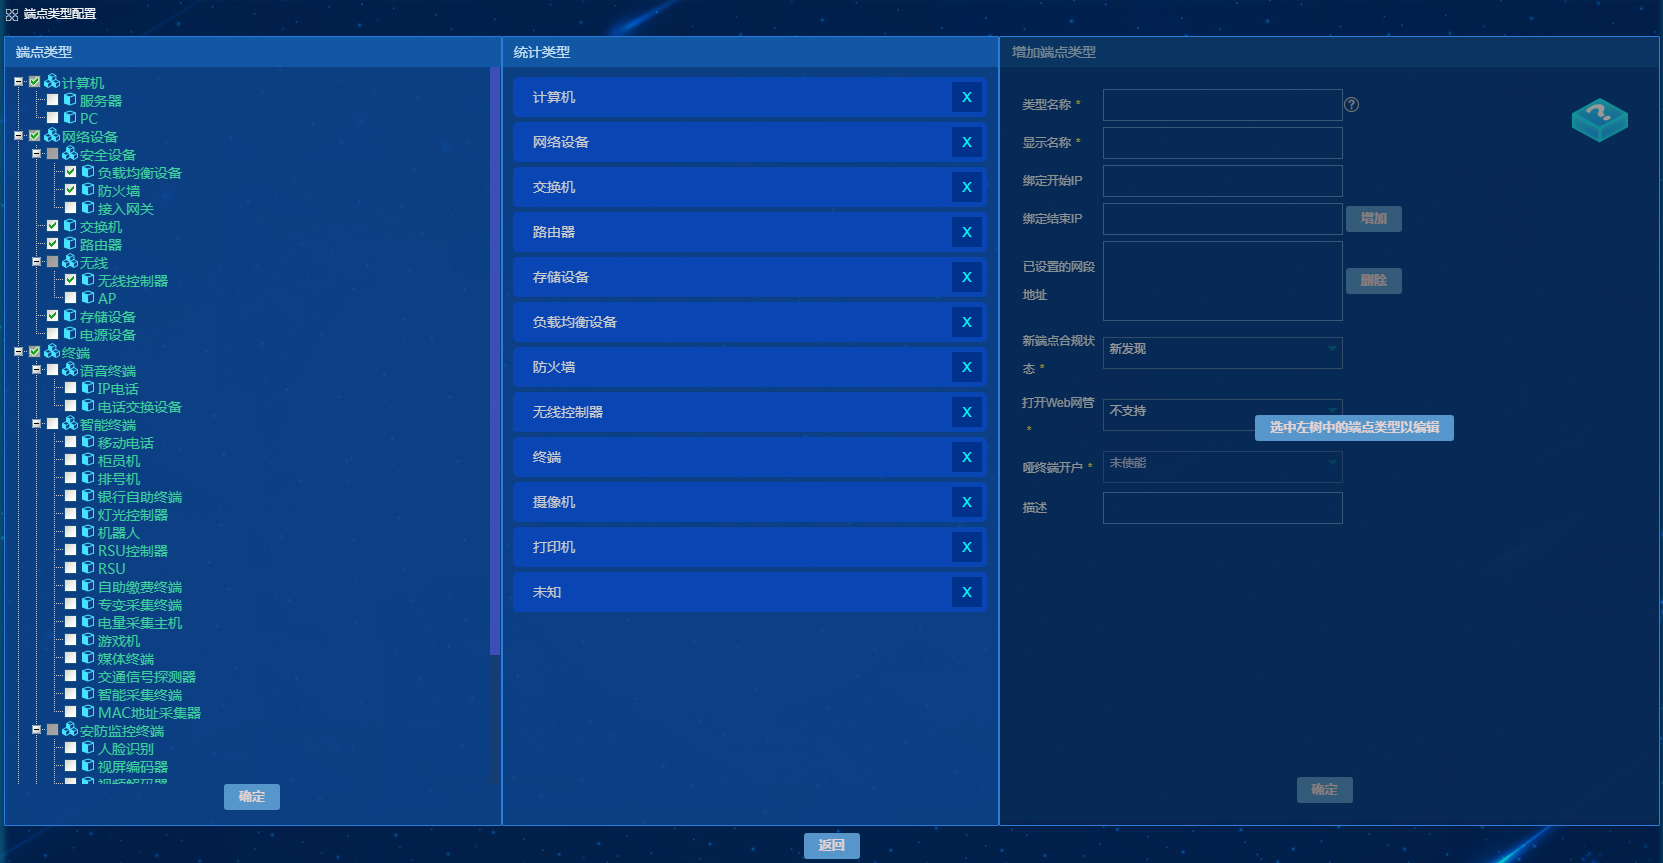
Endpoint type management
The endpoint type is a factor of the endpoint baseline. Scanners identify endpoints according to the predefined endpoint types in EPS. EPS supports three levels of endpoint types. You can configure endpoint types and statistics collection at different levels.
EPS supports the following predefined level-one endpoint types: computer, network device, voice terminal, smart terminal, security monitoring terminal, office terminal, CPE, and unknown.
On the endpoint type management page, you can define endpoint types. To access the endpoint type management page, select Endpoint Profiling Management > System Mgmt > Endpoint Type Mgmt, as shown in Figure 25.
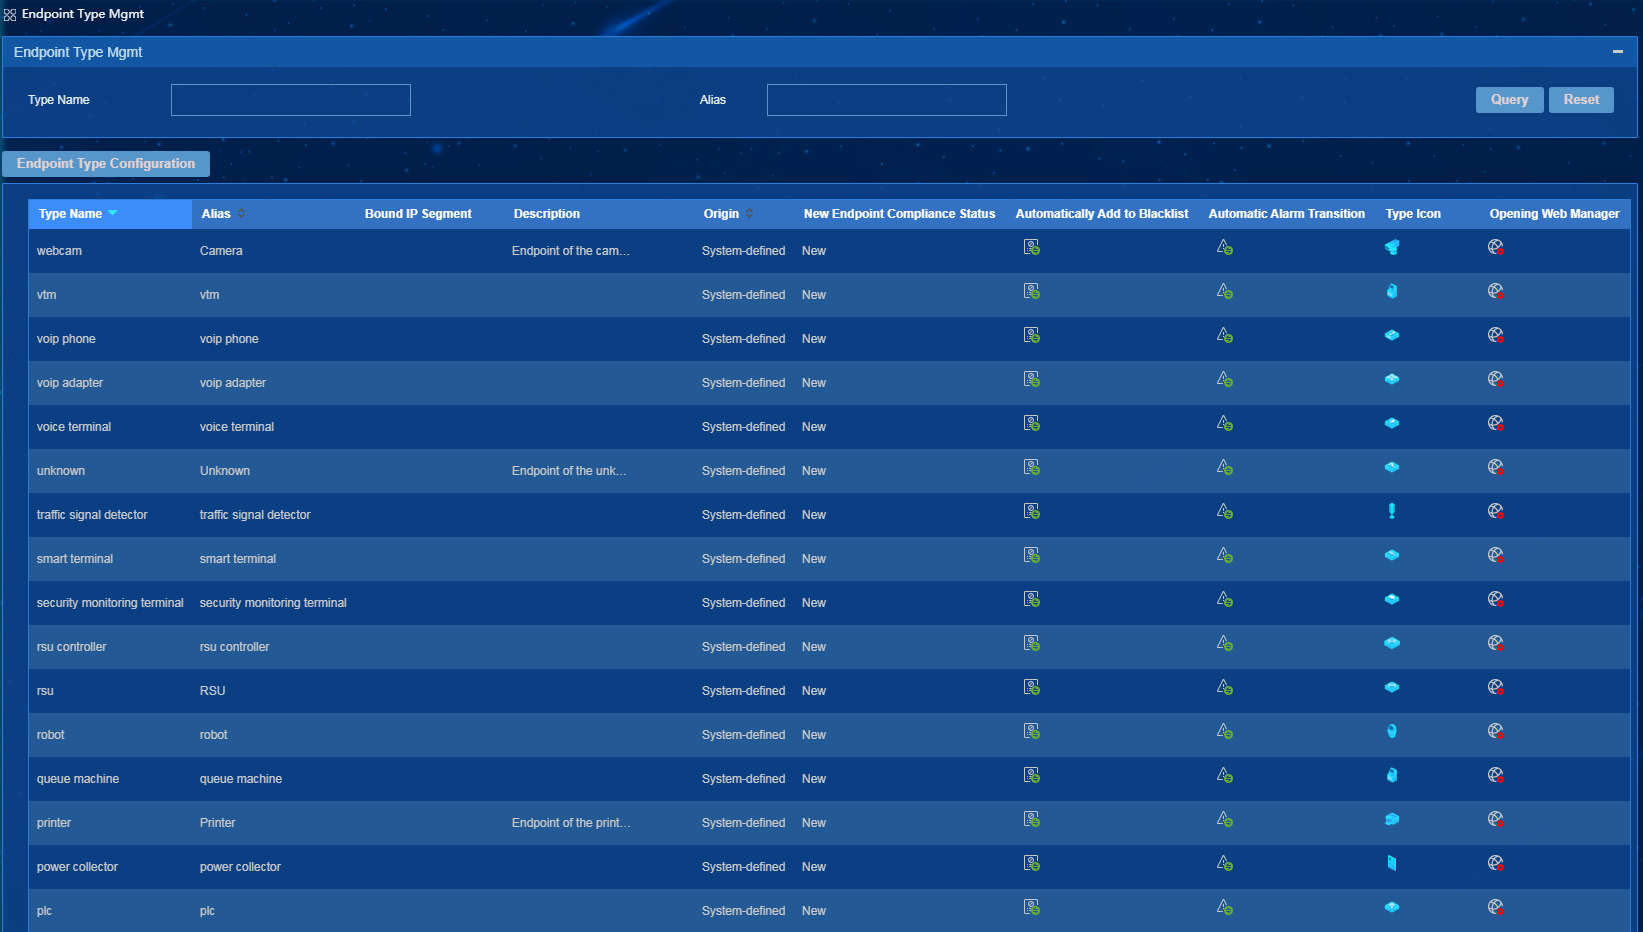
Configuring an endpoint type
1. Access the Endpoint Type Mgmt page.
2. Click Endpoint Type Configuration.
The Endpoint Type Configuration page opens, as shown in Figure 26.
Figure 50 Endpoint Type Configuration page
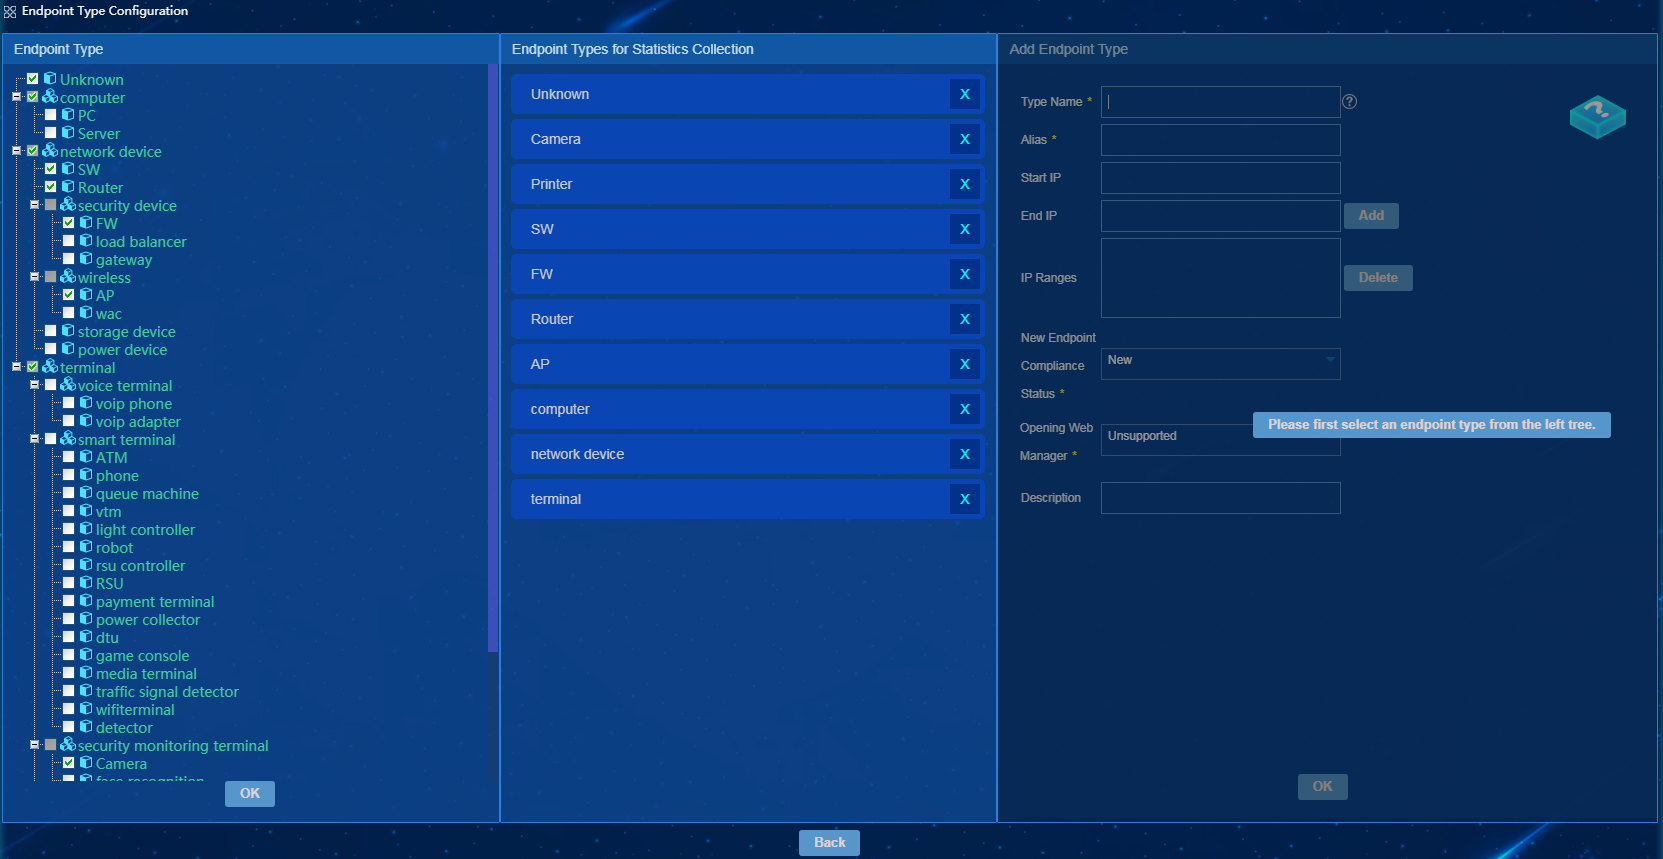
The Endpoint Type Configuration page contains the following tabs:
· Endpoint Type—Displays both predefined and user-defined endpoint types. You can select endpoint types for statistics collection, or add, modify, and delete endpoint types.
· Endpoint Types for Statistics Collection—Displays endpoint types for which statistics collection is configured.
· Add/Modify Endpoint Type—Allows you to configure parameters for a new endpoint type added on the Endpoint Type tab, and modify parameters for an endpoint type selected on the Endpoint Type tab.
Adding an endpoint type
1. On the Endpoint Type tab, hover over an endpoint type name, and then click the Add Endpoint Type icon ![]() that appears after
the name.
that appears after
the name.
New Endpoint Type 1 is displayed on the endpoint type list, as show in Figure 27.
Figure 51 Configuring an endpoint type
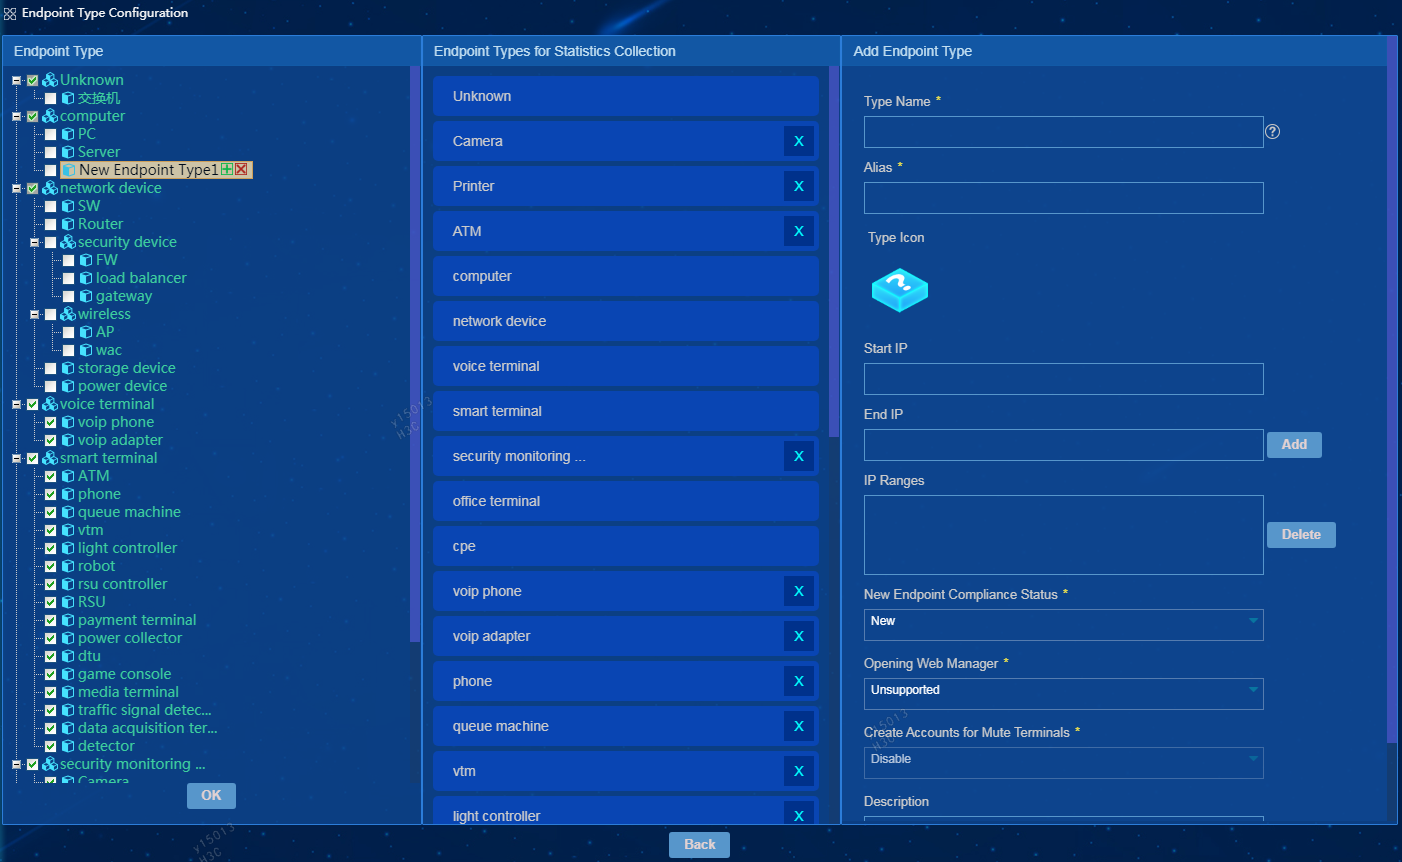
2. Select New Endpoint Type 1 and then configure the following parameters on the Add Endpoint Type tab.
¡ Type Name—Enter a unique endpoint type name.
¡ Alias—Enter a unique endpoint type alias. The endpoint type alias is displayed on the endpoint list.
¡ Start IP—Enter a start IP address of the address range.
¡ End IP—Enter an end IP address of the address range. The end IP address must be equal to or higher than the start IP address. After you enter the end IP address, click Add next to the End IP field to add the address range to the IP Ranges field.
The IP Ranges field contains IP ranges for compliant endpoints of the specified endpoint type. If endpoints of other endpoint types use IP addresses within these IP ranges, EPS marks these endpoints as incompliant and blocks them.
¡ New Endpoint Compliance Status—Select the default compliance status assigned to the newly discovered endpoints of the endpoint type when they are added to the system for the first time.
- If the IP address of a new endpoint is within an IP range listed in the IP Ranges field, the endpoint is compliant.
- If the IP address of a new endpoint is beyond all IP ranges listed in the IP Ranges field, the endpoint is placed in the default compliance status.
¡ Opening Web Manager—Specifies accessibility to the Web management interfaces of matching endpoints.
¡ Create Accounts for Mute Terminals—Select whether to create accounts for mute terminals. If this feature is enabled, the system will create accounts for mute terminals based on their MAC addresses after they are approved compliant. Mute terminal can then use these accounts to access the network.
|
|
IMPORTANT: To create accounts for mute terminals, you must enable collaboration with EIA and make sure the endpoints have MAC addresses. |
¡ Description—Enter a description for the endpoint type.
3. Click OK.
Modifying an endpoint type
To modify an endpoint type, select the endpoint type on the Endpoint Type tab, and then configure parameters on the Modify Endpoint Type tab, as shown in Figure 28.
Figure 52 Modifying an endpoint type
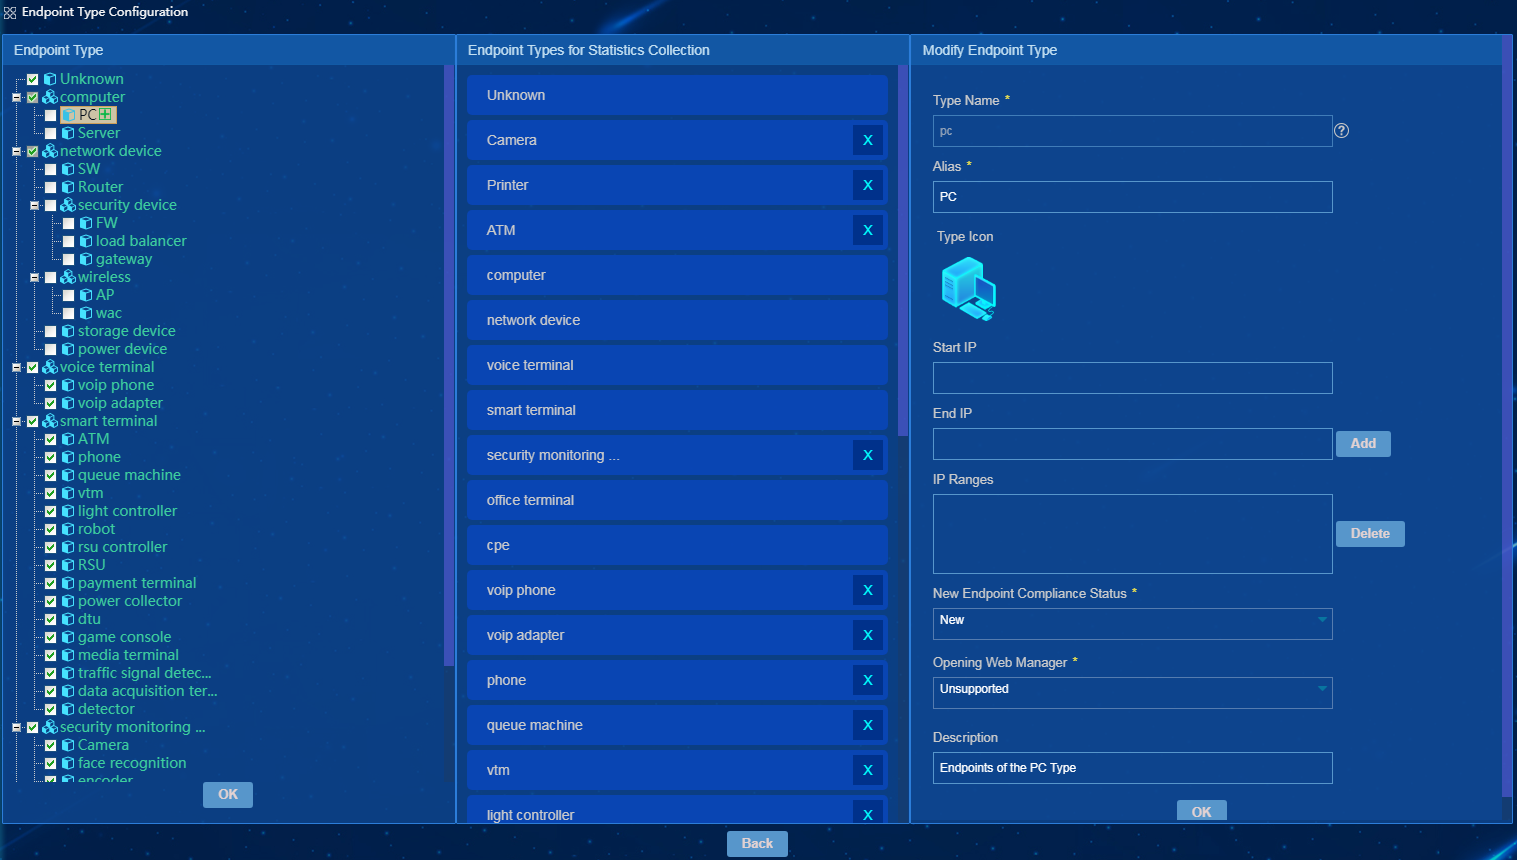
You cannot modify names of any user-defined or predefined endpoint types. In addition, the aliases and descriptions of predefined endpoint types are not modifiable.
Deleting an endpoint type
Predefined endpoint types cannot be deleted.
To delete a user-defined endpoint type,
click the Delete Endpoint Type
icon ![]() for
the endpoint type on the endpoint type list, and then click OK.
for
the endpoint type on the endpoint type list, and then click OK.
Selecting endpoint types for statistics collection
EPS supports collecting endpoint statistics based on endpoints types at different levels.
To select endpoint types for statistics collection:
1. On the Endpoint Type tab, select endpoint types.
The selected endpoint types are displayed on the Endpoint Types for Statistics Collection tab, as shown in Figure 29.
Figure 53 Selecting endpoint types
2. Click OK on the Endpoint Type tab.
EPS collects information about endpoints based on the endpoint types as follows:
· If you select all lower-level endpoint types of an upper-level endpoint type, EPS collects information about the endpoints of the selected lower-level endpoint types.
· If you select only an upper-level endpoint type, EPS collects information about the endpoints of this type.
· If you select an upper-level endpoint type and some of its lower-level types, EPS collects information about endpoint of the upper-level and the selected lower-level types.
· Level-one endpoint types are selected for statistics collection by default and cannot be canceled.
Configuring weak password detection
Use this feature to detect camera endpoints with weak user passwords.
To configure weak password detection:
1. From the navigation tree, select Endpoint Profiling System > All Endpoints.
2. Click the Endpoints to be Approved link in the upper corner of the page.
The Endpoints to be Approved page opens, as shown in Figure 30.
Figure 54 Endpoints to be Approved page

3. Click the Weak Password Detection Configuration link.
The page for configuring weak password detection opens, as shown in Figure 31.
Figure 55 Configuring weak password detection
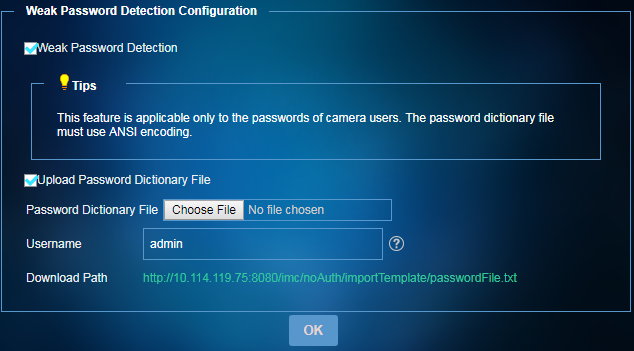
4. Select Weak Password Detection to enable weak password detection.
5. Select Upload Password Dictionary File and then upload a password dictionary file.
Only files in the TXT format are supported. As a best practice, make sure the number of weak passwords in the file does not exceed 20.
If you do not select this option, the default dictionary file is used. To view weak passwords in the default dictionary file, click the download path link.
6. In the Username field, enter the username of the user on the detected endpoint.
7. Click OK.
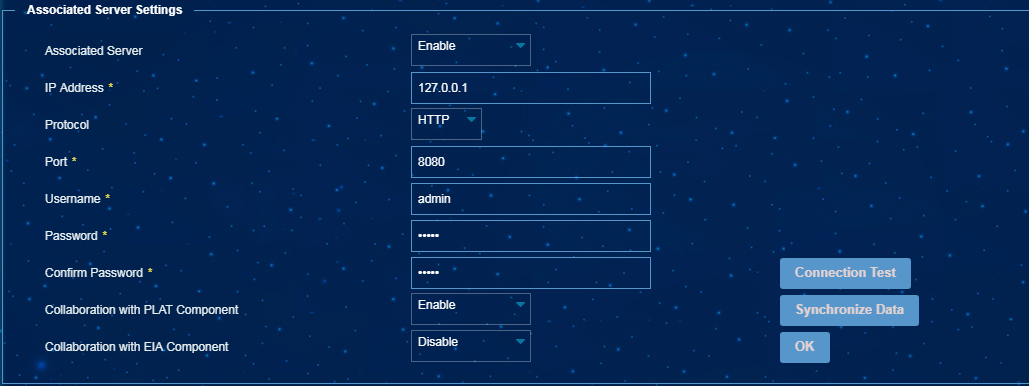
Creating accounts for mute terminals by MAC address
When mute terminals are attached to the network for the first time, they can be discovered by EPS but cannot access the network. To allow mute terminals to access the network, configure EPS to collaborate with EIA to create accounts for mute terminals based on their MAC addresses.
Configuring collaboration with EIA
1. From the navigation tree, select Endpoint Profiling Management > System Mgmt > System Parameters.
2. In the Associated Server Settings area, enable the associated server, set server parameters, and enable collaboration with the EIA component, as shown in Figure 32.
Figure 56 Configuring collaboration with EIA
Creating accounts for mute terminals
1. From the navigation tree, select Endpoint Profiling System > All Endpoints.
2. Click the Endpoints to be Approved link in the upper corner of the page.
The Endpoints to be Approved page opens.
3. Click the MACs Without Accounts tab.
4. Use one of the following methods to create accounts:
¡ To create accounts for multiple MAC addresses, select MAC addresses on the list and then click Create Account.
¡ To create an account for one MAC address, click the Create Account
icon ![]() for the MAC address in the Operation column.
for the MAC address in the Operation column.
Figure 57 Creating accounts by MAC address
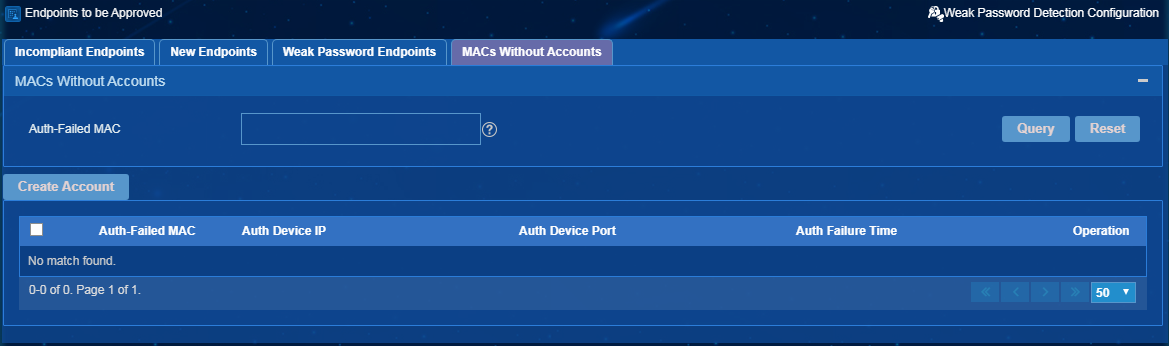
5. On the page that opens, select a mute terminal user configuration profile that has been created on EIA, and then click OK.
Fingerprint collection
Use this feature to configure endpoint fingerprints and assign them to scanners. Endpoint fingerprints help improve the accuracy of scanners in identifying an endpoint's type, operating system, and vendor.
To add a fingerprint collection task:
1. From the navigation tree, select Endpoint Profiling System > All Endpoints.
2. From the list of all endpoints, select an endpoint, and then click Fingerprint Collection.
3. Add a fingerprint collection task, as shown in Figure 34.
Figure 58 Adding a fingerprint collection task
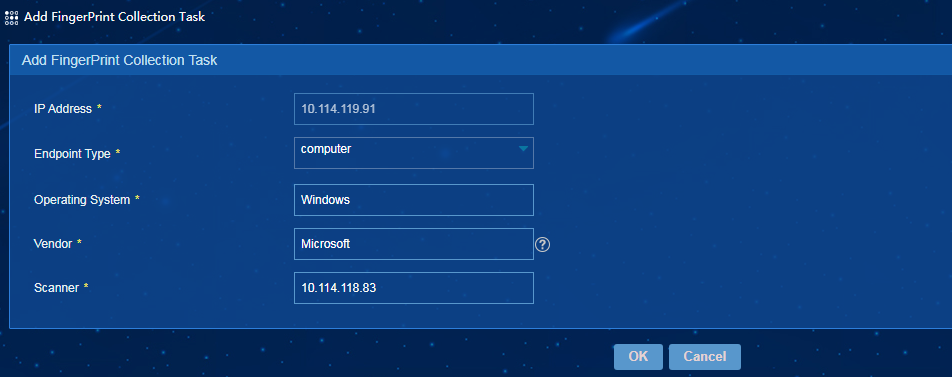
4. Click OK.
Behavior audit
EPS saves system event execution logs, operation logs of operators, and endpoint information change records. With such information, you can audit behaviors and review events.
Figure 59 Behavior audit management
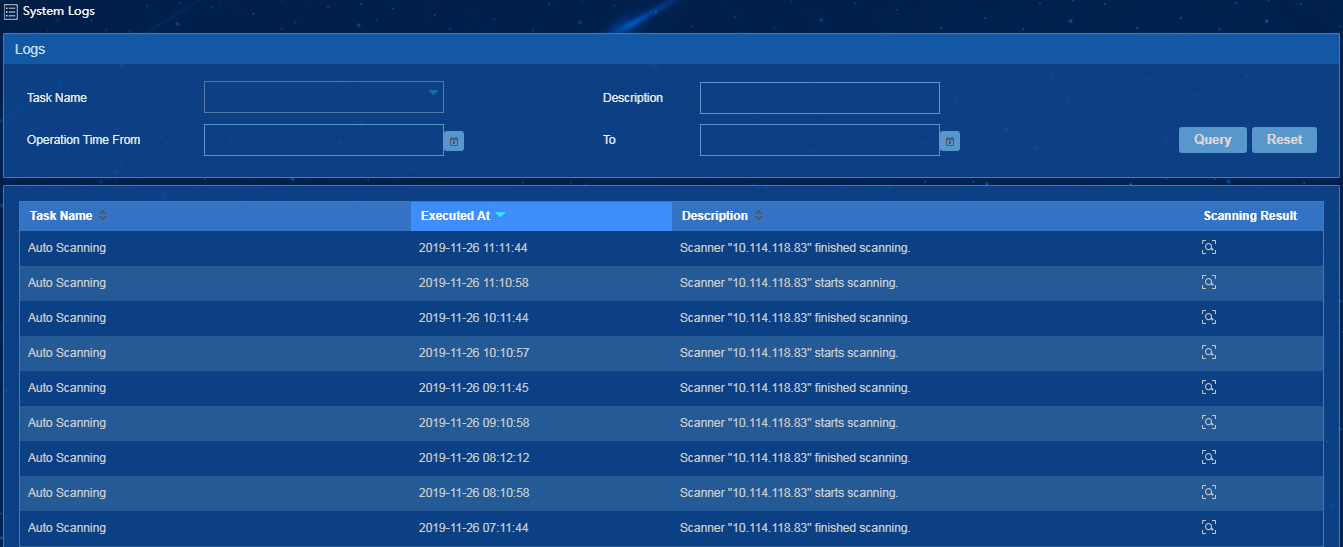
System logs
The system logs record the name, execution time, description, and scanning result of each scan task, as shown in Figure 36.
Operation logs
The operation logs record all important operations of each operator from login to logout.
|
|
NOTE: · Only the super administrator admin can view the operation logs of all operators. When the operator group of an operator has the privilege to system logs, the operator can view all operation logs of operators in the group. In the current software, the privilege cannot be set for operators. · The operation logs can be viewed but cannot be deleted. IMC can periodically export the logs. On the operation log page, click Data Export Settings. On the window that opens, configure the function of exporting logs. |
To access the operation log list:
1. Click the System tab.
2. From the navigation tree, select System Management > Operation Logs.
The operation logs of the whole IMC system are displayed on the operation log list, as shown in Figure 37.
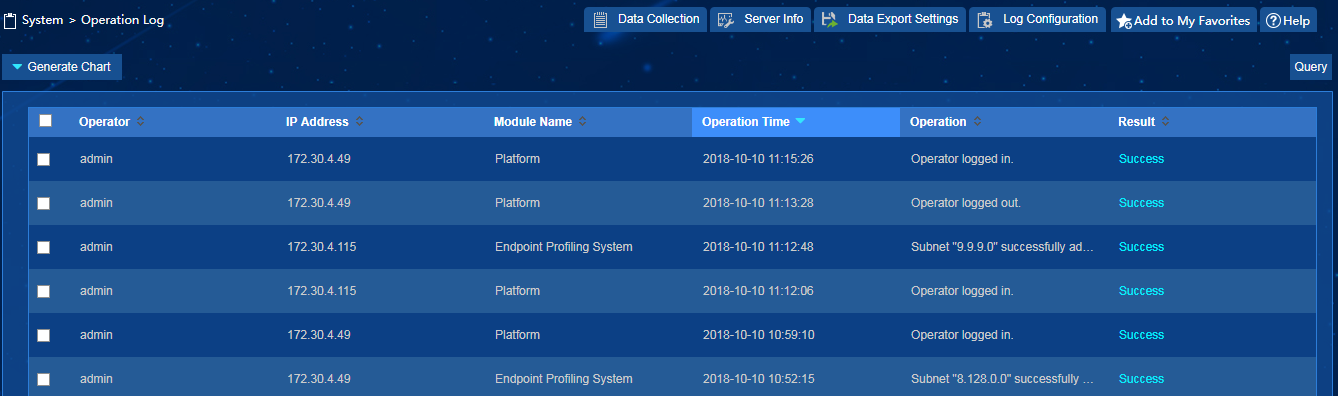
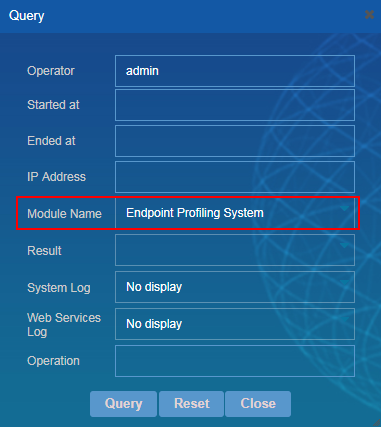
3. Click Query. From the Module Name list, select Endpoint Profiling Management to query all operation logs of EPS. You can query operation logs more exactly by specifying more query conditions.
Figure 62 Query conditions
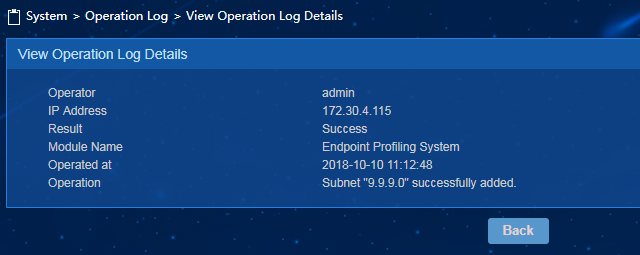
4. Click the operation result link to see log details.
Figure 63 Log details
Scanner logs
EPS supports collecting scanning logs from scanners.
Adding a log collection task
1. Click the User tab.
2. From the navigation tree, select Endpoint Profiling Management > Scan Config > Scanner Mgmt.
The scanner management page opens, as shown in Figure 40.
3. Click the Log Collection icon ![]() for
a scanner.
for
a scanner.
4. Click Add.
The page for adding a log collection task opens, as shown in Figure 41.
Figure 65 Adding a log collection task
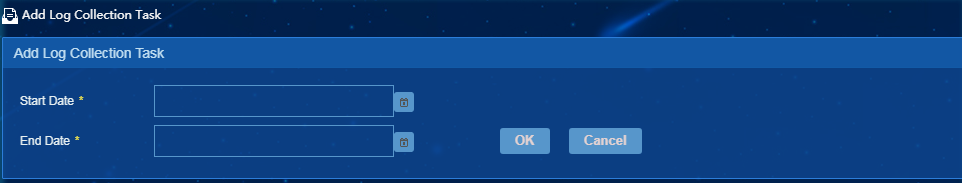
5. Select the start time and end time.
6. Click OK.
The Log Collection page displays the log collection task, as shown in Figure 42.
Figure 66 Log collection task list

Downloading logs
To download scanner logs, click a link in the Download Logs column on the log collection task list.
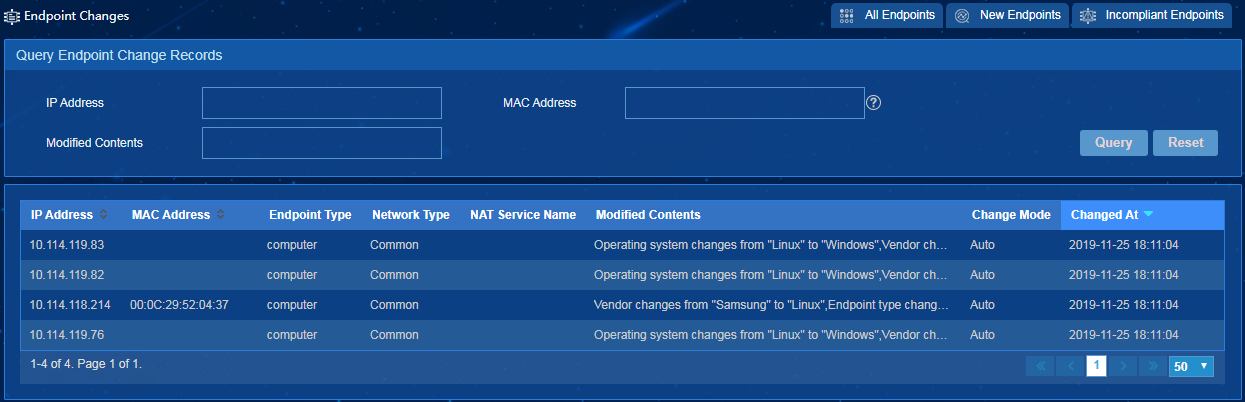
Endpoint change records
The endpoint change records list saves all endpoint information change records, including the endpoint information manually modified by the operator and the incompliant endpoints approved by the operator, as shown in Figure 43. When the operator approves an endpoint to be compliant, the system automatically generates a baseline according to the current endpoint information, and records the baseline of the endpoint in the change contents.
Figure 67 Endpoint information change
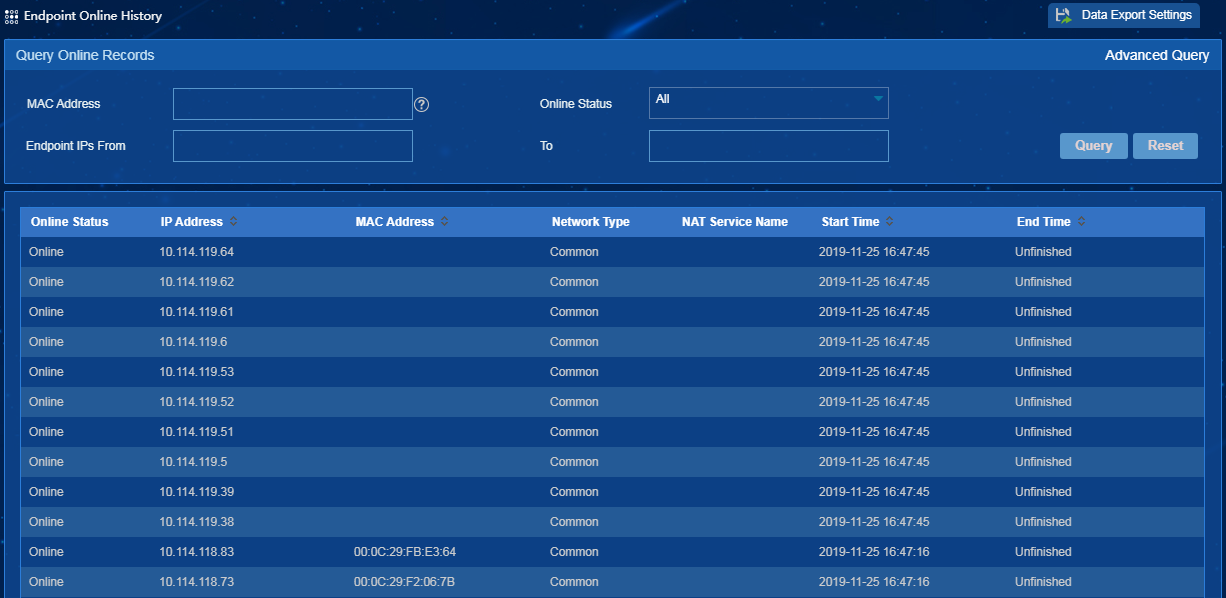
Endpoint online history
The endpoint online history saves the online status change records of all endpoints and the start time and end time of each online status change record, as shown in Figure 44.
The endpoint online history records can be exported when the data volume or record time reaches the corresponding threshold.
Figure 68 Endpoint online history
Data presentation
Dashboard
The dashboard real-time monitors information about endpoints on the network.
Viewing the overview page
From the navigation tree, select Endpoint Profiling System > Dashboard. The dashboard page opens, as shown in Figure 45.
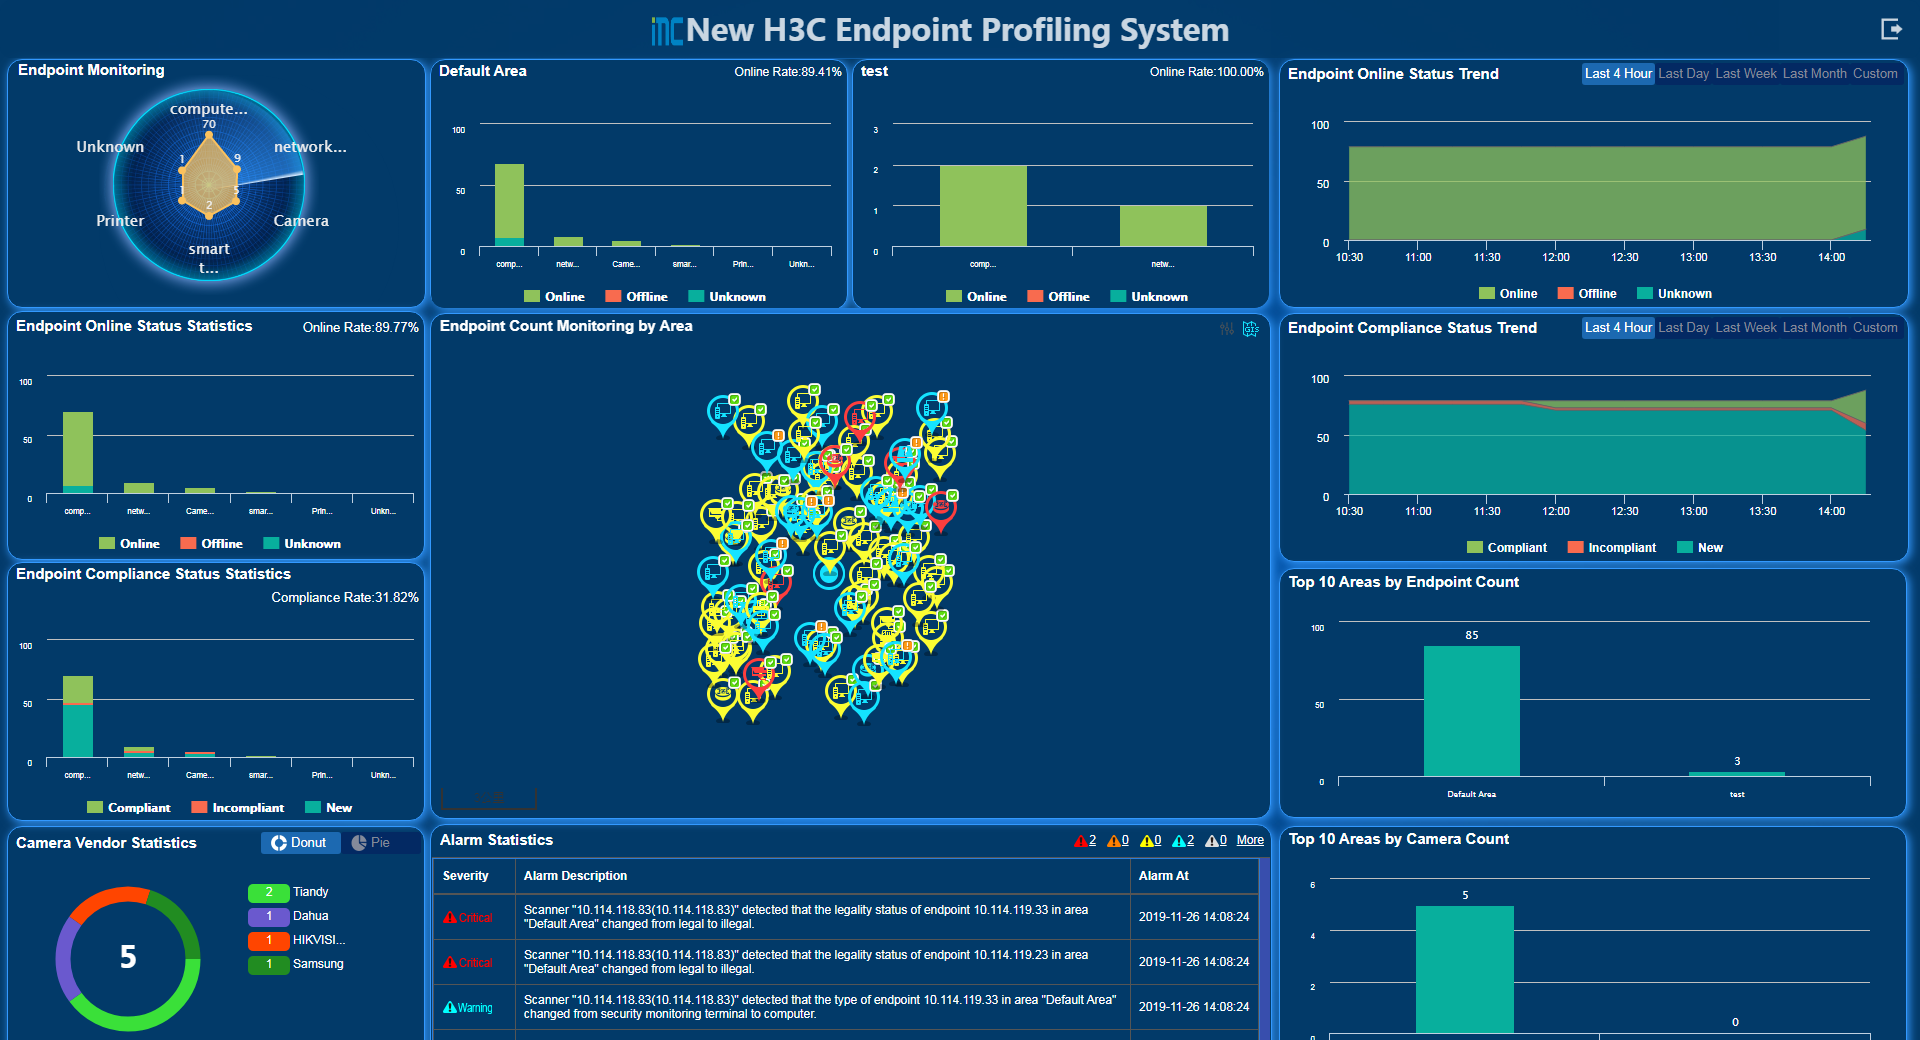
This page displays the following information:
· Number of endpoints in each online/compliance status of each type in each area.
· Trend for the number of endpoints in each online/compliance status within a certain period of time.
· Vendor statistics of cameras, top 10 areas by camera count, and camera count in each area.
· Number of compliant endpoints in each area on the map. You can view the number of endpoints in each status of each type in each sub area.
· Roll display of the number of endpoints in each compliance status of each type in each area.
· Alarm list.
Customizing dashboard
You can design the dashboard as needed to display different contents and for different display resolutions.
To access the dashboard customization page:
1. On the iMC page, click the Switch Perspective icon ![]() , and then select Endpoint Profiling System Perspective
, and then select Endpoint Profiling System Perspective
2. Click the Customize
Dashboard icon ![]() . The dashboard customization page opens, as shown in Figure 46.
. The dashboard customization page opens, as shown in Figure 46.
Figure 70 Dashboard customization page
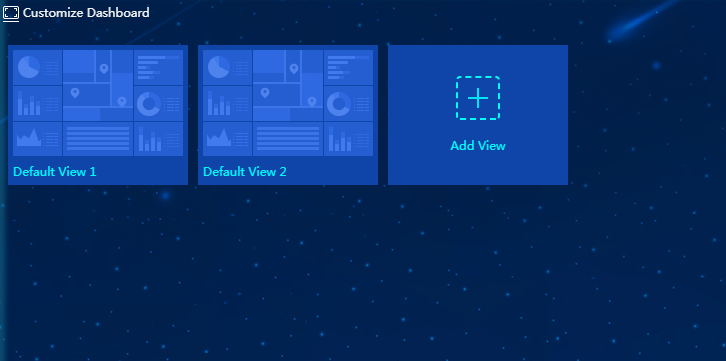
3. Click the Add View image.
The page for adding a view opens, as shown in Figure 47.
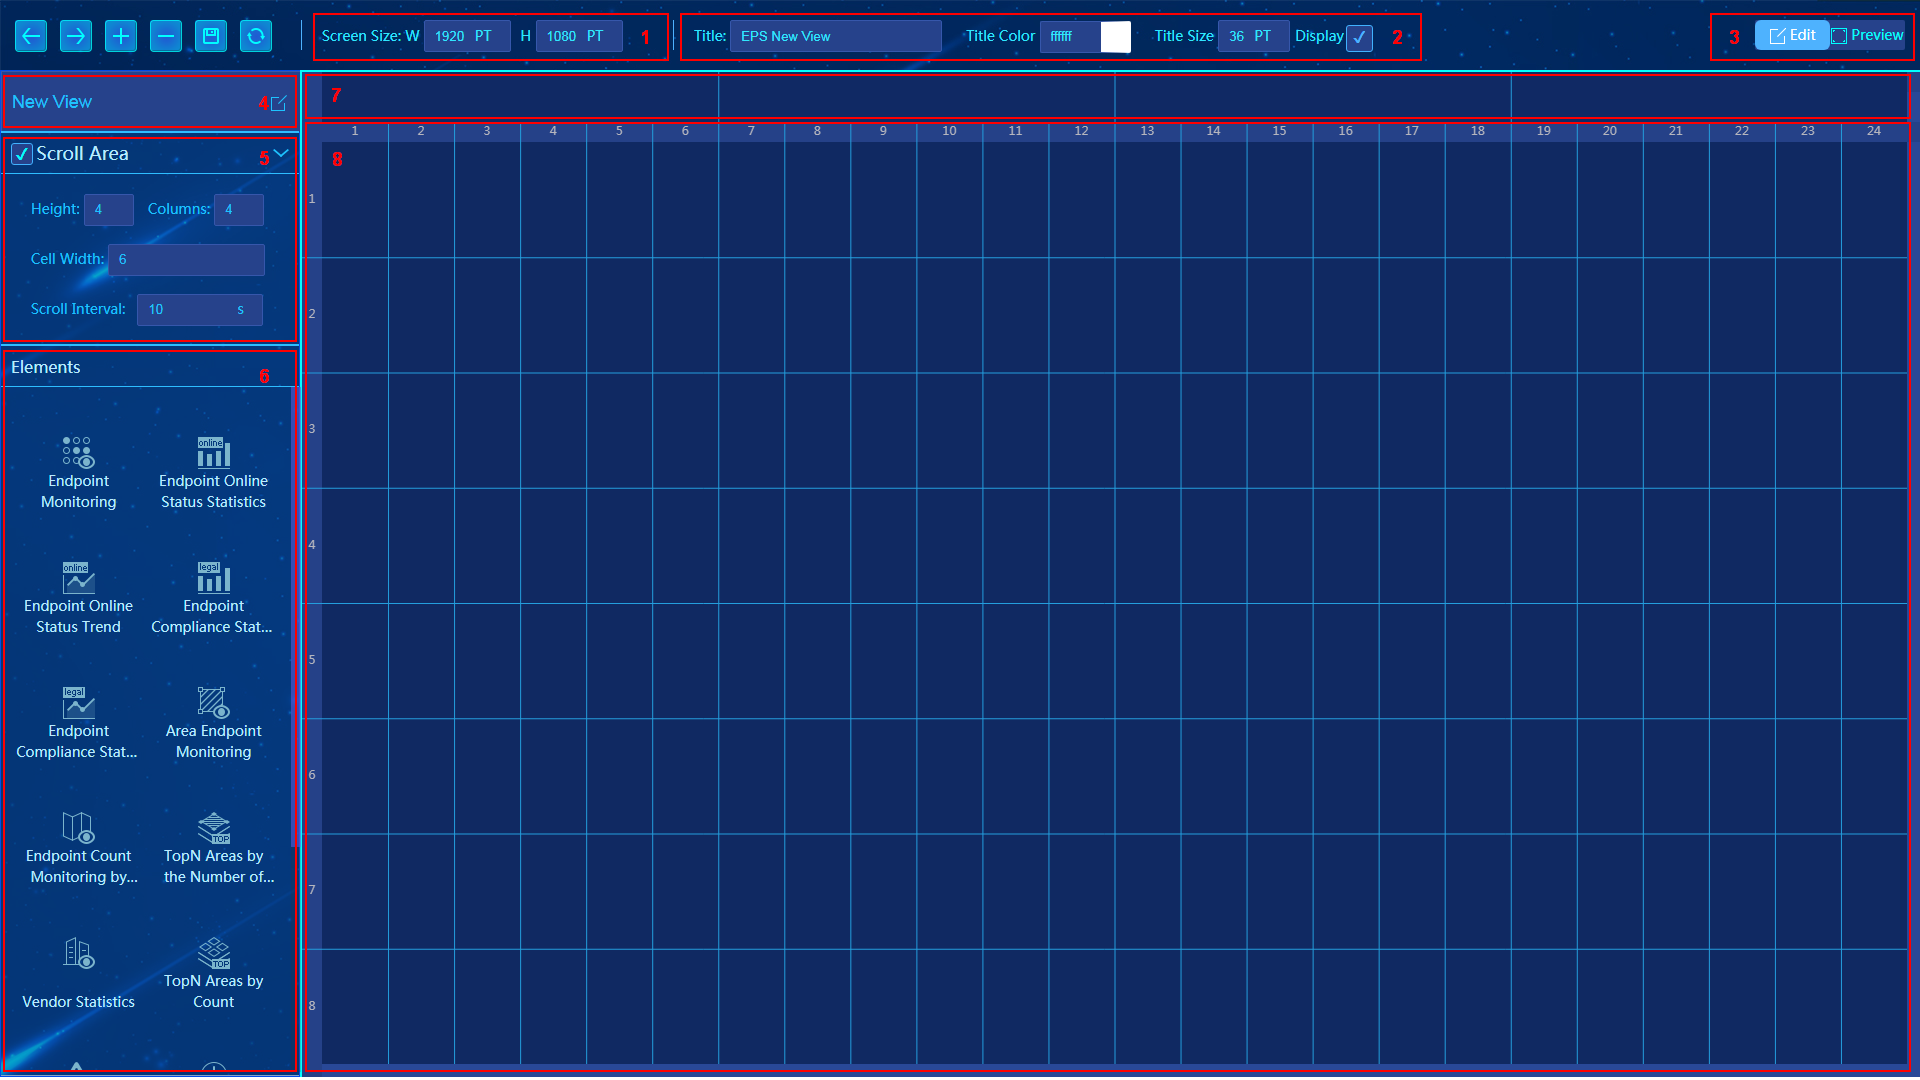
Table 5 Configuration items for adding a view
|
No. |
Item |
Description |
|
1 |
Screen Size |
Defines the display resolution. |
|
2 |
Title |
Defines the name, color, and size of title on the dashboard. To display the title on the dashboard, select the Display check box. |
|
3 |
Edit Preview |
Click the buttons to switch between the edit and preview mode. |
|
4 |
New View |
Defines the dashboard view name. Each name uniquely identifies a dashboard view. |
|
5 |
Scroll Area (Carousel) |
Allows you to set the carousel settings: · Height—Height of the carousel. The dashboard is divided into 12 rows of equal height. If you enter 4, the carousel spans 4 rows. · Columns—Number of elements in the carousel. · Cell Width—Width of each element in the carousel. The dashboard is divided into 24 columns of equal width. If you enter 6, each element spans 6 columns. · Scroll Interval—Amount of time to delay between cycling a slide. |
|
6 |
Element |
Displays all elements that the system supports. You can drag an element to a place in the carousel content area. |
|
7 |
Carousel content |
Allows you to arrange the elements to display in the carousel. You must add elements to the carousel if the Scroll Area option is selected. If you do not add any elements, the carousel will show nothing on the dashboard. |
|
8 |
Display content |
Allows you to arrange elements in other areas on the dashboard. |
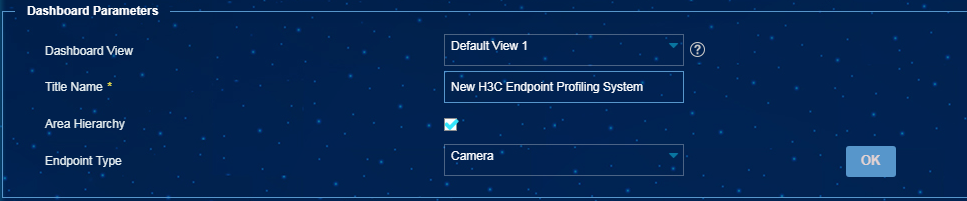
Configuring dashboard parameters
To configure the dashboard parameters, select Endpoint Profiling Management > System Mgmt > System Parameters, and configure the dashboard parameters, as shown in Figure 48.
Figure 72 Dashboard parameters
GIS monitoring
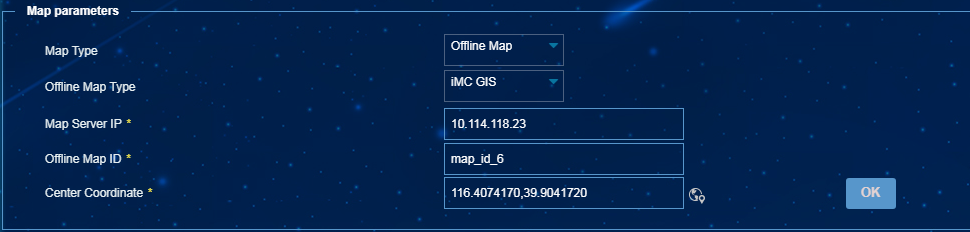
Only available in the offline map mode, GIS monitoring allows you to view endpoint information on the offline map in real time.
Configuring map parameters
1. From the navigation tree, select Endpoint Profiling Management > System Mgmt > System Parameters.
2. In the Map parameters area, configure map parameters, as shown in Figure 49:
¡ Map Type—Select Offline Map.
¡ Offline Map Type—Select an offline map type. Only iMC GIS is supported in the current software version.
¡ Map Server IP—Enter the IP address of the offline map server. Only the IPv4 address is supported.
¡ Map ID—Enter an offline map ID for map loading.
¡ Center Coordinate—Enter the latitude
and longitude of the center point on the map, or click the Select Coordinate in Map icon ![]() to select the center point.
to select the center point.
Figure 73 Configuring map parameters
Viewing GIS monitoring information
1. From the navigation tree, select Endpoint Profiling Management > Getting Started.
2. Click Monitoring and then select GIS Monitor.
Figure 74 GIS monitoring
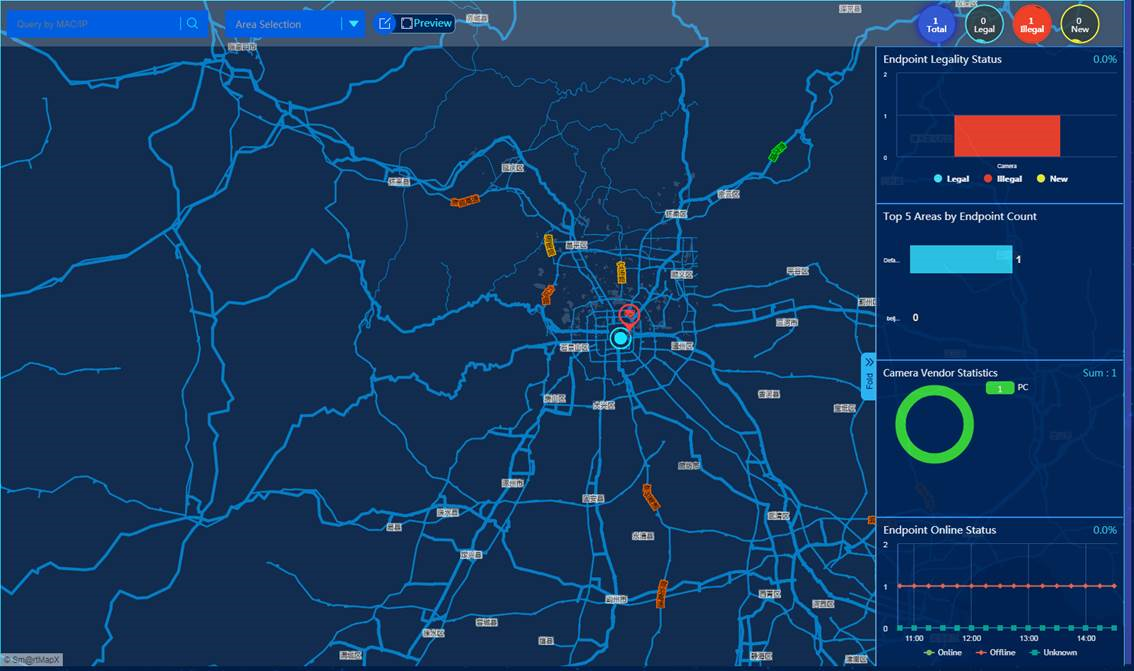
The GIS monitoring screen displays the following information:
· Endpoint information, including IP address, online status, compliance status, MAC address, endpoint type, vendor, location area, and scan time.
· Endpoint statistics and charts:
¡ Endpoint compliance status statistics.
¡ Top 5 areas by endpoint count.
¡ Camera vendor statistics.
¡ Endpoint online status statistics
To view or hide these statistics and charts, click Charts or Fold on the left of the map, respectively.
GIS monitoring supports querying endpoints and displaying information and statistics about the matching endpoints.
When you view GIS monitoring information, follow these guidelines:
· GIS monitoring supports only the offline map. To move an endpoint selected from the query result list in edit mode, you must first click another area on the map and then select the endpoint again.
· If endpoint information is covered on the screen, you can drag the map to adjust the display.
Hierarchical EPS monitoring
EPS hierarchical management allows you to manage multiple lower-level EPSs in a centralized way through a single EPS system. For more information about EPS hierarchical management, see "Example: Configuring hierarchical EPS."
Hierarchical EPS monitoring displays information about lower-level EPSs in real time.
To access the hierarchical EPS monitoring page:
1. From the navigation tree, select Endpoint Profiling System > System Mgmt > Hierarchical EPS.
2. Click the Hierarchical EPS Monitoring link in the upper right corner.
Figure 75 Hierarchical EPS monitoring
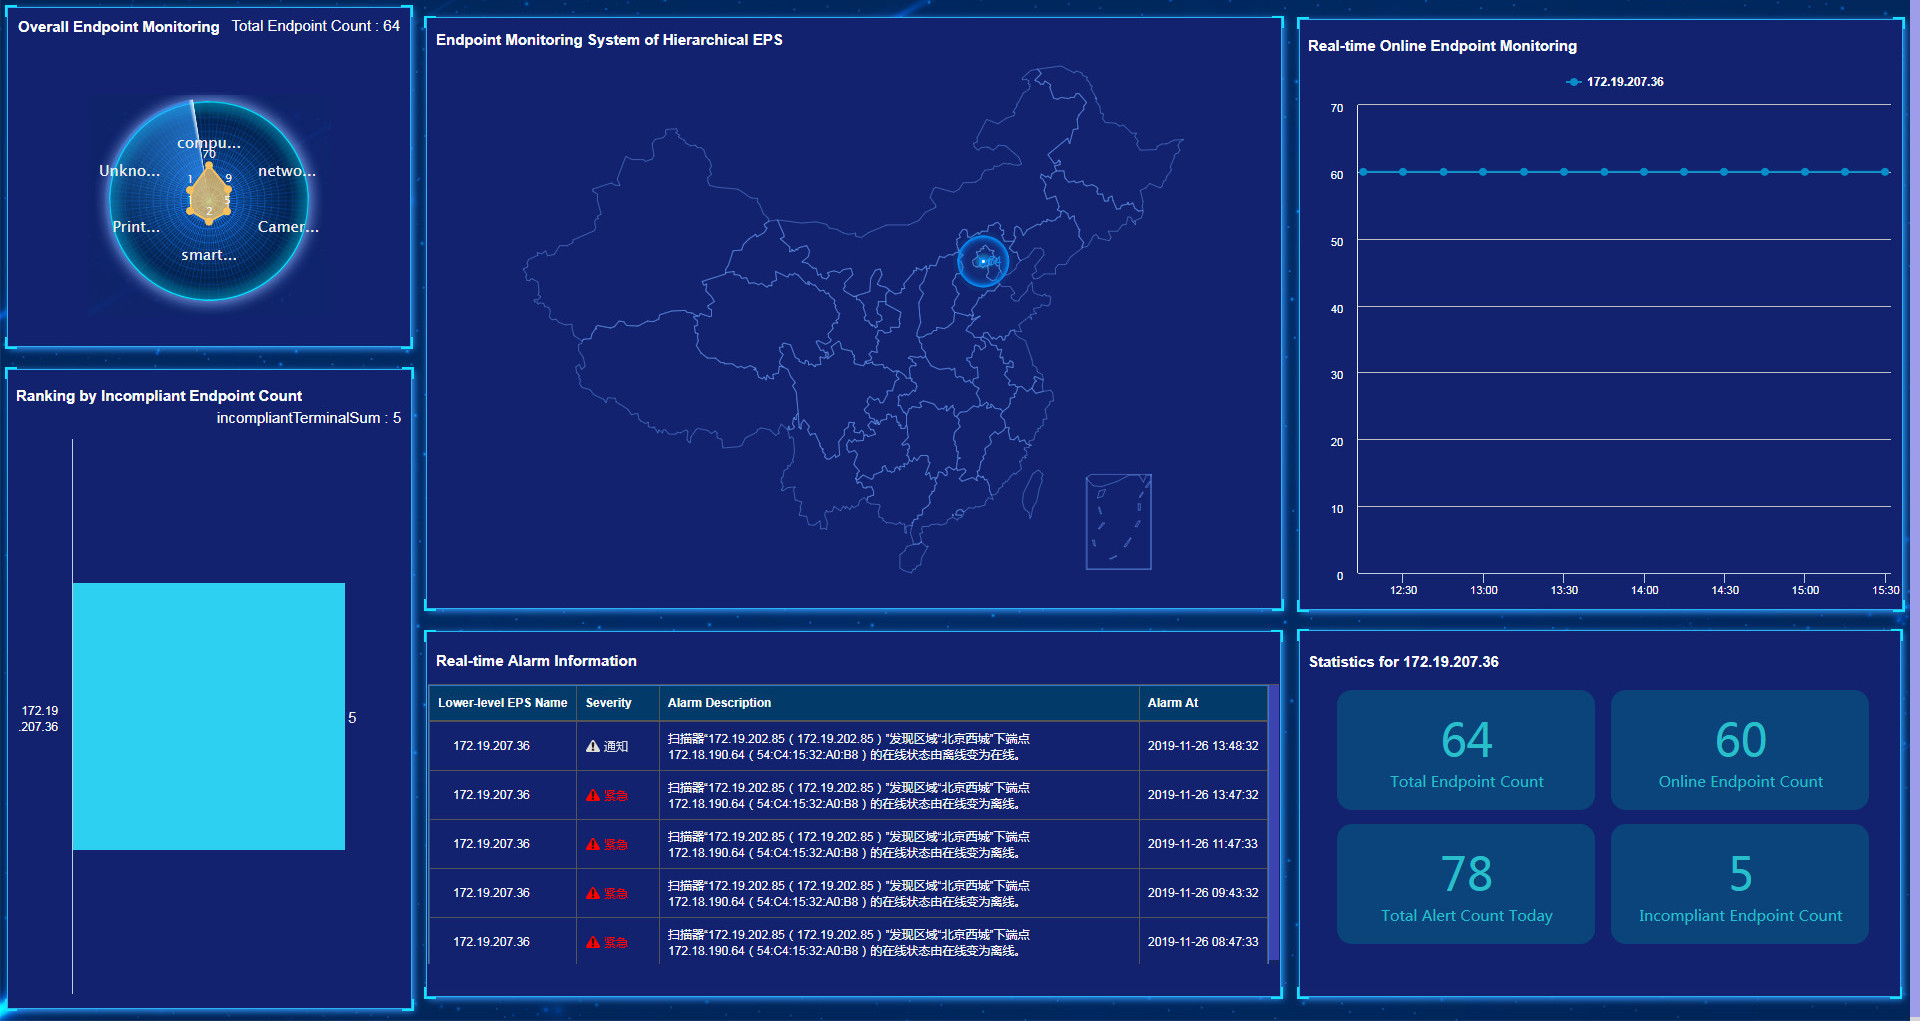
The hierarchical EPS monitoring page displays the following information:
· Statistics about endpoint types in all lower-level EPSs.
· Lower-level EPS ranking based on the number of incompliant endpoints.
· Number of compliant endpoints in each area on the map.
· Endpoint count trend within a period in each lower-level EPS.
· Statistical information in each lower-level EPS: total number of endpoints, number of online endpoints, total number of alerts today, and number of incompliant endpoints.
· Real-time alarm list.
Reports
EPS provides the following reports:
· Real-Time Network-Wide Endpoint Status Report.
· Real-Time Network-Wide Camera Status Report.
· Real-Time Network-Wide Endpoint Type Report.
· Real-Time Endpoint Status Report.
· Incompliant Endpoint Statistics Report.
· Offline Endpoint Statistics Report.
· Camera Vendor Report.
· New Endpoint Statistics Report.
· Endpoint Information Statistics Report
· Endpoint Historical Online Information Statistics Report
· Statistical Report of Hierarchical EPS
· Endpoint Port Statistics Details/Summary Report.
To view the details of a report, select Endpoint Profiling Management > Reports from the navigation tree to enter the report template list page, and then click the name of the report.
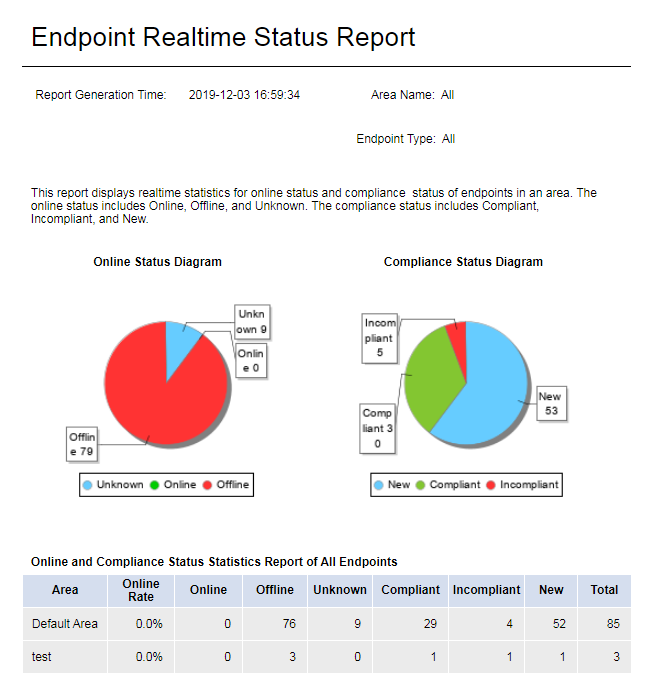
Real-Time Network-Wide Endpoint Status Report
This report displays the real-time number of endpoints in each status. The status includes online status and compliance status. The online status includes Online, Offline, and Unknown. The compliance status includes Compliant, Incompliant, and New. As shown in Figure 52, the report includes the following parts:
· A pie chart that displays the number of network-wide endpoints in each online status and a pie chart that displays the number of network-wide endpoints in each compliance status.
· Table that displays the statistics of network-wide endpoint online status and compliance status.
Figure 76 Real-time network-wide endpoint status report
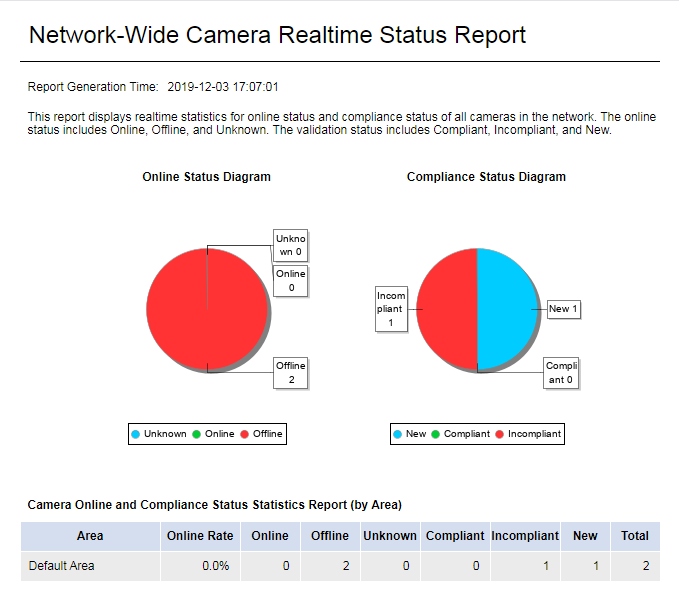
Real-Time Network-Wide Camera Status Report
This report displays the real-time number of cameras in each status. The status includes online status and compliance status. The online status includes Online, Offline, and Unknown. The compliance status includes Compliant, Incompliant, and New. As shown in Figure 53, the report includes the following parts:
· A pie chart that displays the number of network-wide cameras in each online status and a pie chart that displays the number of network-wide cameras in each compliance status.
· Table that displays the statistics of network-wide camera online status and compliance status.
Figure 77 Real-time network-wide camera status report
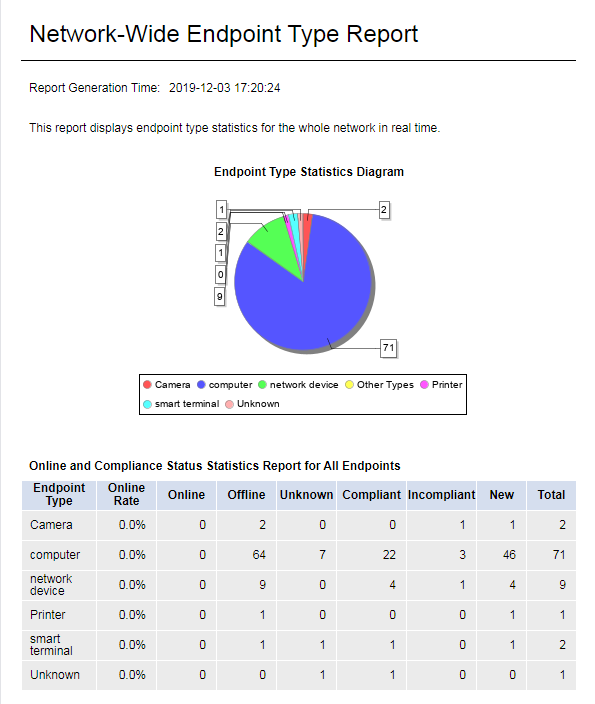
Real-Time Network-Wide Endpoint Type Report
This report provides the real-time network-wide endpoint type statistics, and displays real-time data by endpoint type, as shown in Figure 54. This report includes the following parts:
· A pie chart that displays real-time network-wide endpoint type statistic.
· A table that displays the number of endpoints of each endpoint type in each online/compliance status.
Figure 78 Real-time network-wide endpoint type report
Real-Time Endpoint Status Report
Select an area and endpoint type on the Parameter Configuration page, as shown in Figure 55.
The report displays the real-time number of endpoints in each status. The status includes the online status and compliance status. The online status includes Online, Offline, and Unknown. The compliance status includes Compliant, Incompliant, and New. As shown in Figure 56:
· A pie chart that displays the number of endpoints in each online status in the specified area and a pie chart that displays the number of endpoints in each compliance status in the specified area.
· A table that displays the statistics of in each online/compliance status in the specified area.
Figure 79 Selecting parameters
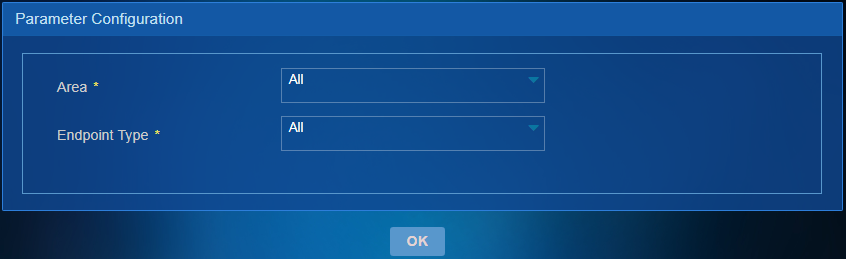
Figure 80 Real-time endpoint status report

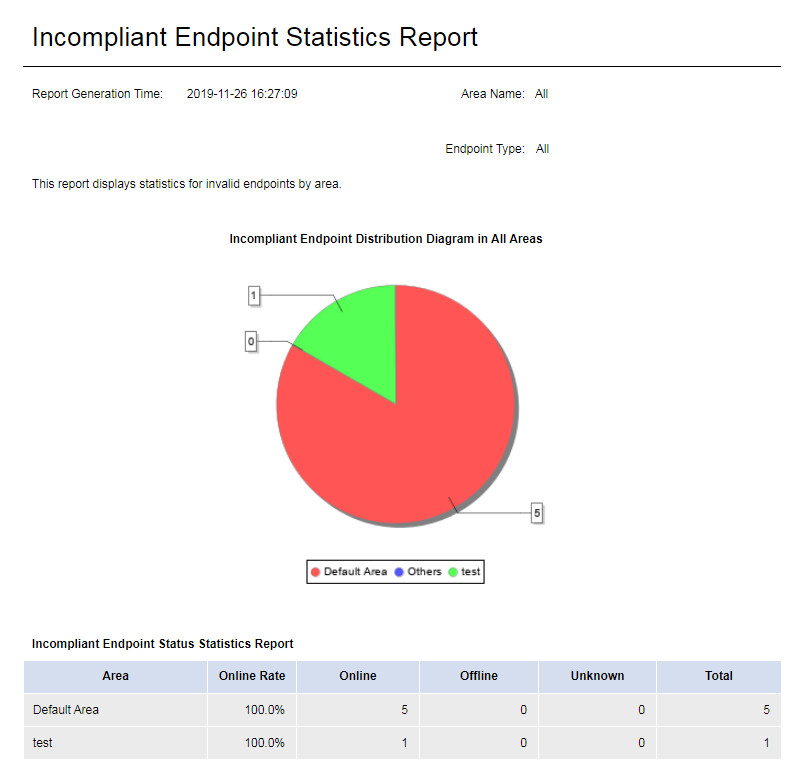
Incompliant Endpoint Statistics Report
Select an area and endpoint type on the Parameter Configuration page, as shown in Figure 55.
This report displays the number of incompliant endpoints in each area, as shown in Figure 57.
This report displays the number of incompliant endpoints in each area through a pie chart and displays the number of endpoints in each online status through a table. To view the endpoint details in an area, click the area in the pie chart.
Figure 81 Incompliant endpoint statistics report
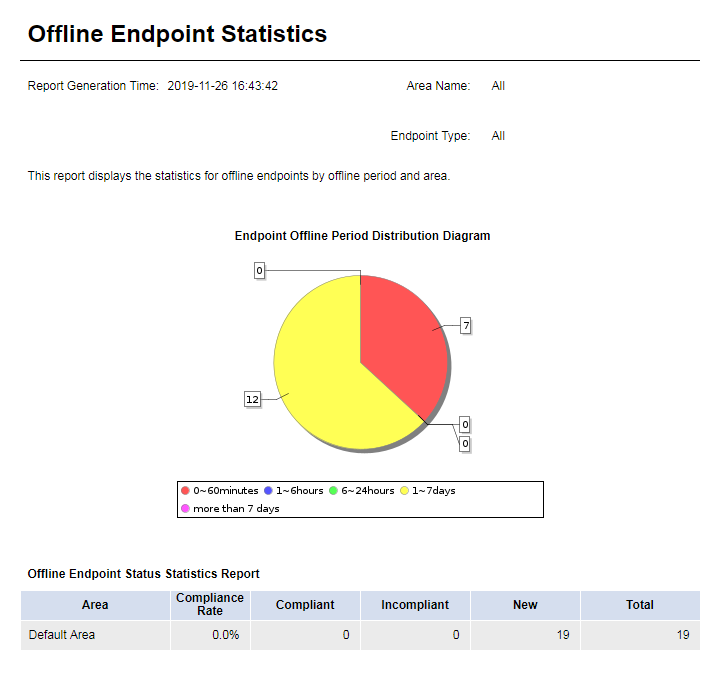
Offline Endpoint Statistics Report
This report displays the number of offline endpoints, and is classified by offline period and area, as shown in Figure 58.
Select an area and endpoint type on the Parameter Configuration page, as shown in Figure 55.
This report displays the number of endpoints within each offline period through a pie chart. This report displays the number of endpoints in each compliance status in each area. To view details of endpoints within an offline period, click the offline period in the pie chart.
Figure 82 Offline endpoint statistics report
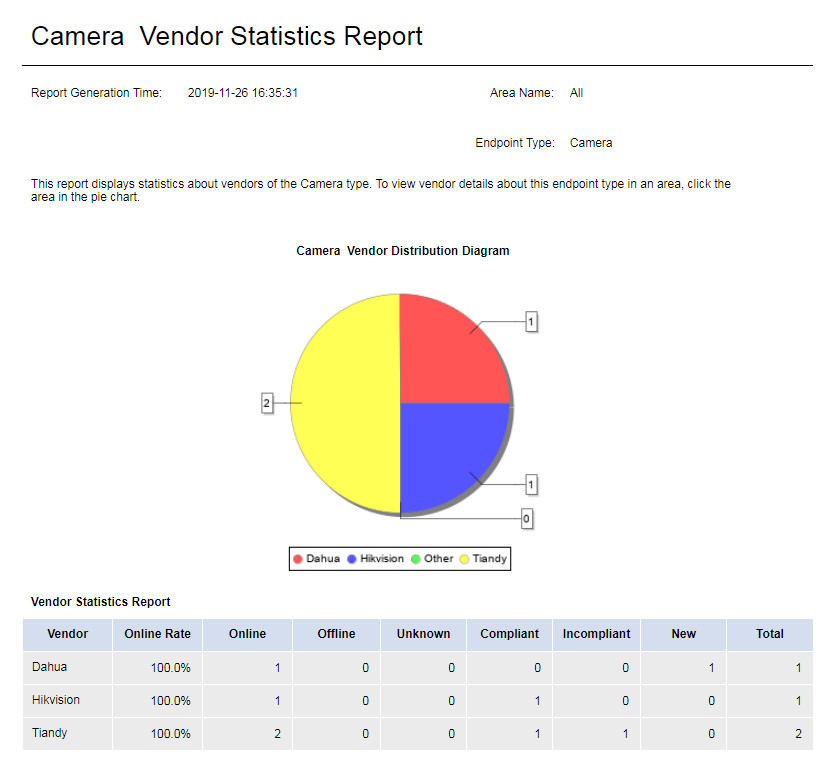
Endpoint Vendor Report
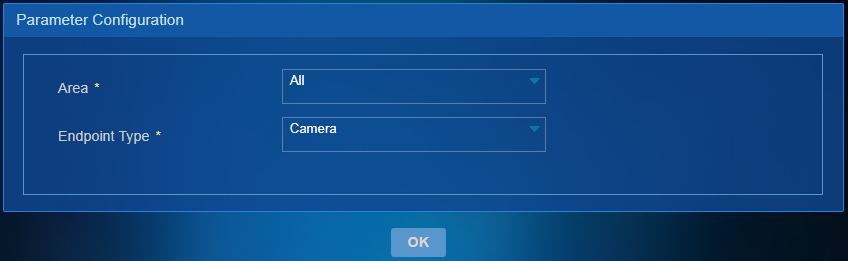
Select an area and endpoint type on the Parameter Configuration page, as shown in Figure 59.
Figure 83 Selecting parameters
This report displays the endpoint vendor statistics by vendor.
As shown in Figure 60, the report displays the camera vendor distribution through a pie chart and displays the camera count in each online/compliance status of each vendor through a table. To view details of cameras of a vendor, click the vendor in the pie chart.
Figure 84 Camera vendor report
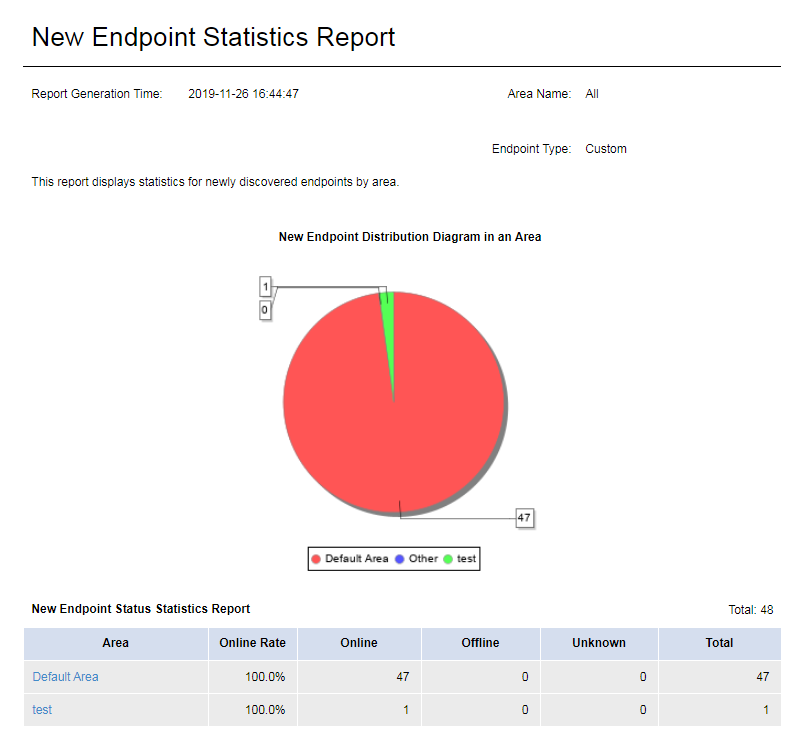
New Endpoint Statistics Report
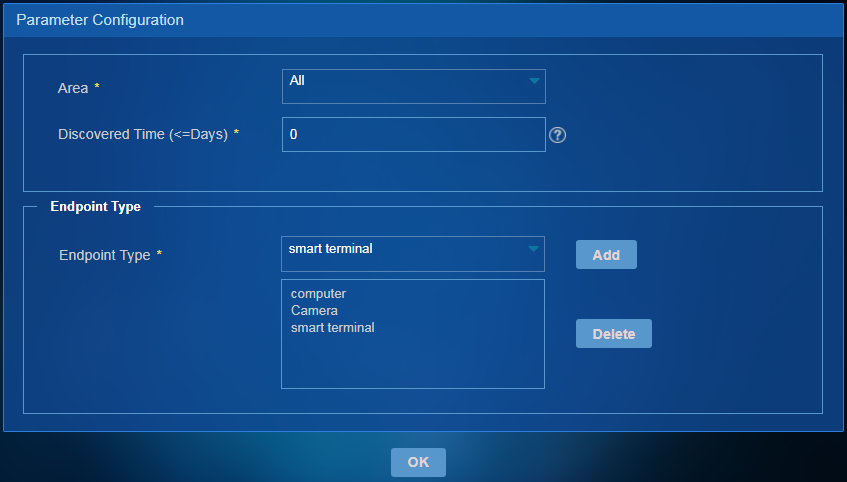
Select an area, endpoint discovery time, and endpoint type on the Parameter Configuration page, as shown in Figure 61.
Figure 85 Selecting parameters
This report displays the statistics of new endpoints by area, endpoint discovery time, and endpoint type.
As shown in Figure 62, the report displays the number of new endpoints in each area through a pie chart and displays the endpoint count in each online status in each area through a table. To view details of endpoints in an area, click the area in the pie chart.
Figure 86 New endpoint statistics report
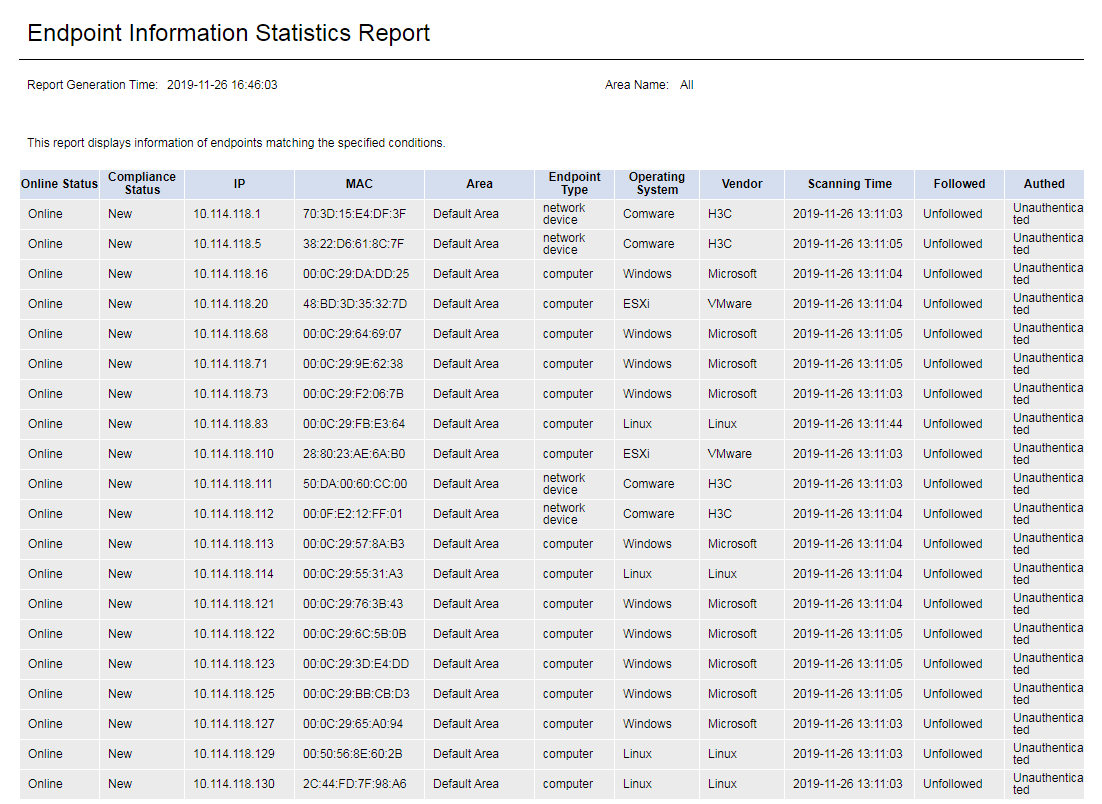
Endpoint Information Statistics Report
Select an area and endpoint type on the Parameter Configuration page, as shown in Figure 63.
Figure 87 Selecting parameters
The report displays endpoint statistics, as shown in Figure 64.
Figure 88 Endpoint information statistics report
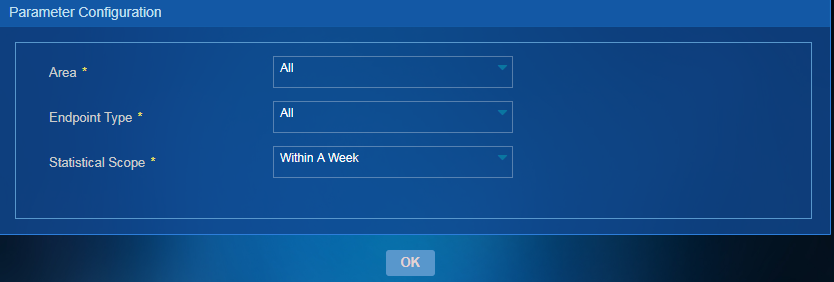
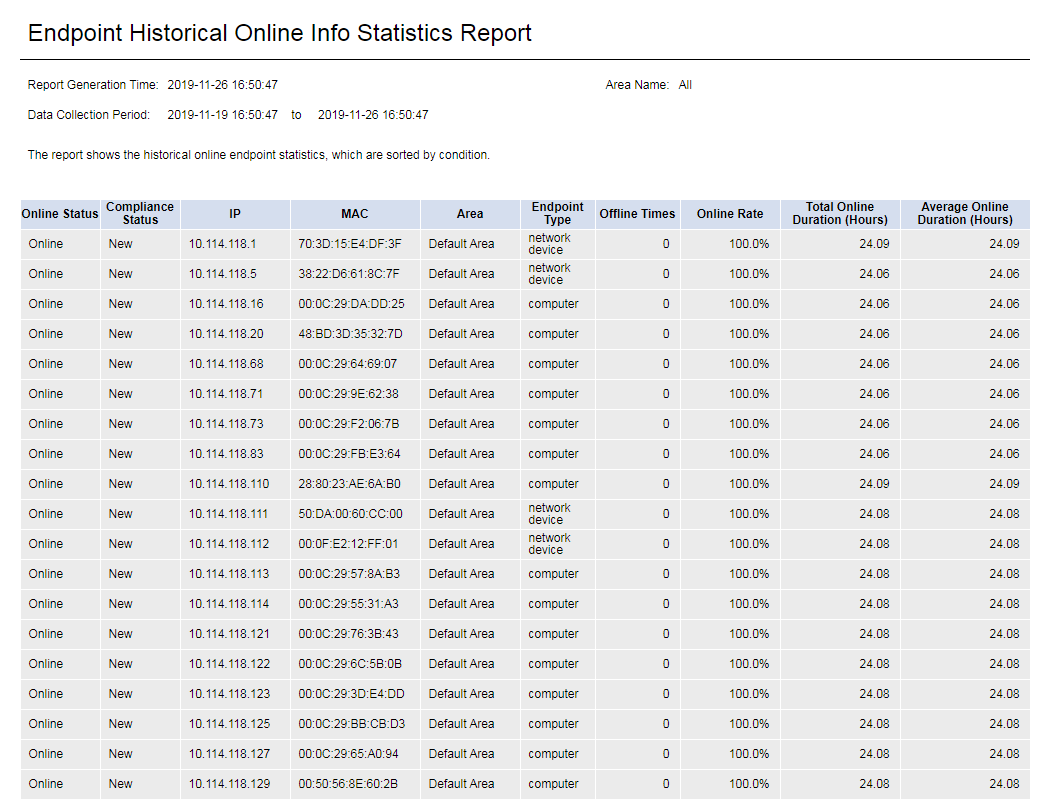
Endpoint Historical Online Information Statistics Report
To view the historical online statistics report about endpoints of interest, click the report name, and then select an area, endpoint type, and statistical scope on the Parameter Configuration page, as shown in Figure 65.
Figure 89 Selecting parameters
The report displays the historical online data about the endpoints, as shown in Figure 66.
Figure 90 Endpoint historical online information statistics report
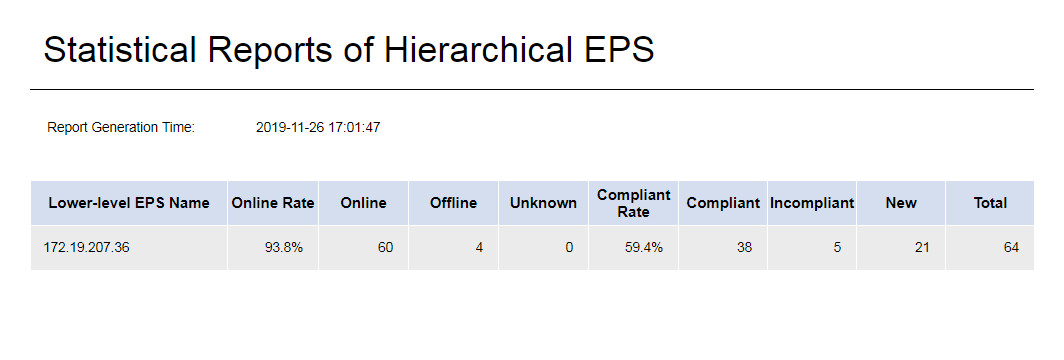
Statistical Report of Hierarchical EPS
This report displays status statistics about the endpoints in lower-level EPSs. The online status includes Online, Offline, and Unknown. The compliance status includes Compliant, Incompliant, and New.
Figure 91 Statistical report of hierarchical EPS
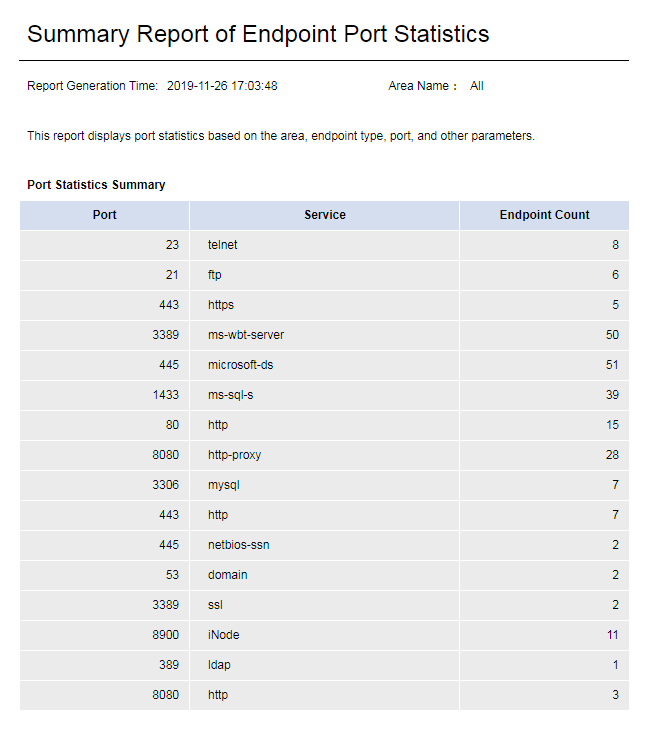
Endpoint Port Statistics Details/Summary Report
This report displays the endpoint port statistics, and is classified by area, endpoint type, and port type. You can select the area, endpoint type, and port type to be displayed on the page as shown in Figure 68.
· The endpoint port statistics details report displays the detailed statistics of endpoint ports, as shown in Figure 69.
· The endpoint port statistics summary report displays the summary statistics of endpoint ports, as shown in Figure 70.
Figure 92 Selecting parameters
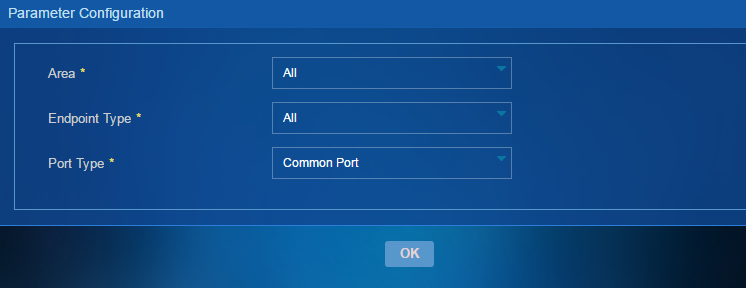
Figure 93 Endpoint port statistics details report
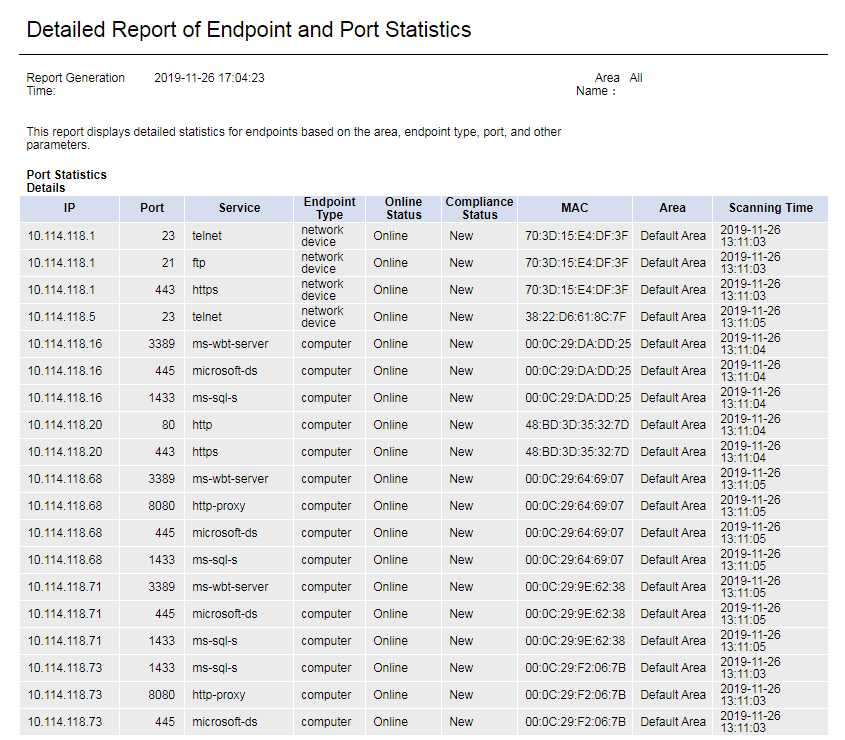
Figure 94 Endpoint port statistics summary report
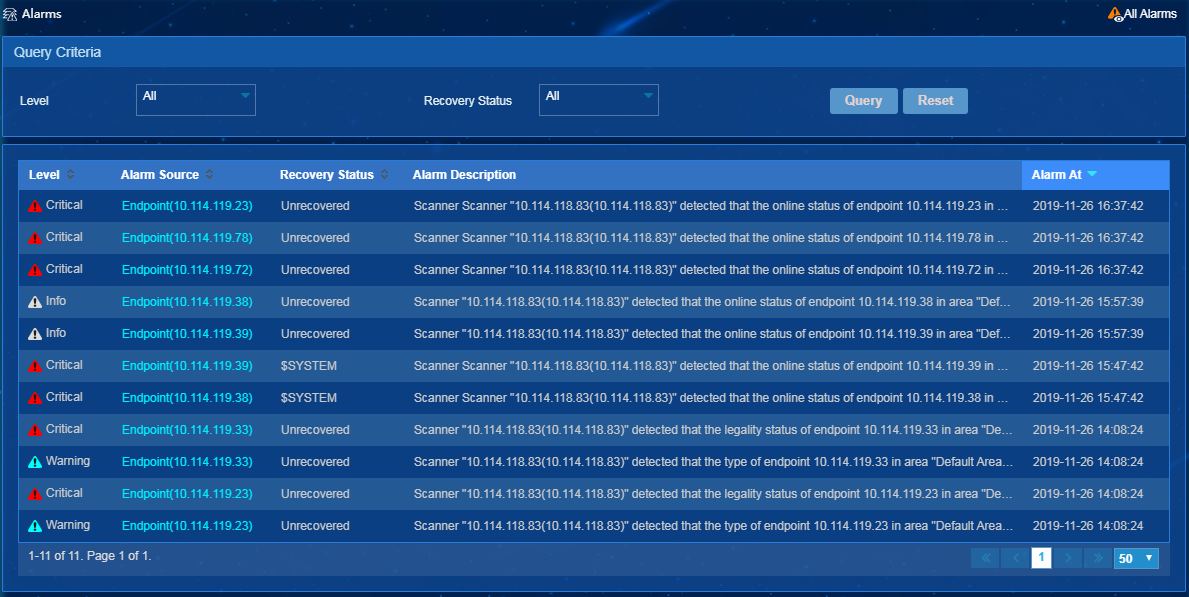
Alarms
EPS provides the alarm function, and can generate alarms in the following conditions:
· New endpoints are discovered.
· The endpoint information (including type, MAC address, vendor, and operating system) changes.
· The endpoint compliance status changes.
· The endpoint online status changes.
· The scanner status changes.
Viewing alarms
To enter the alarm page, select Endpoint Profiling Management > Alarms from the navigation tree, as shown in Figure 71.
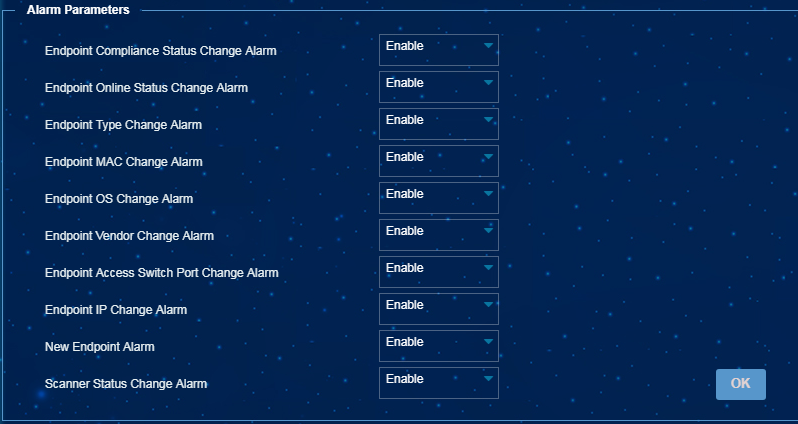
Alarm configuration
To specify the types of alarms to be generated, select Endpoint Profiling Management > System Mgmt > System Parameters from the navigation tree, and specify the alarms to be generated, as shown in Figure 72.
Figure 96 Configuring alarm parameters
Endpoint topology
The topology displays information and distribution of all endpoints in the system. Endpoints exist as nodes in the topology. Endpoints can be displayed by area level. Also, you can specify the endpoints to be displayed.
The endpoint topology operation interface includes two parts: the topology tree on the left and the topology display panel on the right.
Left topology tree
· Left topology tree: Vertically displays the tree nodes of each service topology in the system, including the endpoint topology, custom topology, IP topology, data center topology, and converged topology.
· View: Each tree node in the left topology tree is a view. When you double-click a view, a new topology page is opened on the topology display panel on the right to display the distribution of endpoints in the view. The views of the endpoint topology include the area view and custom view.
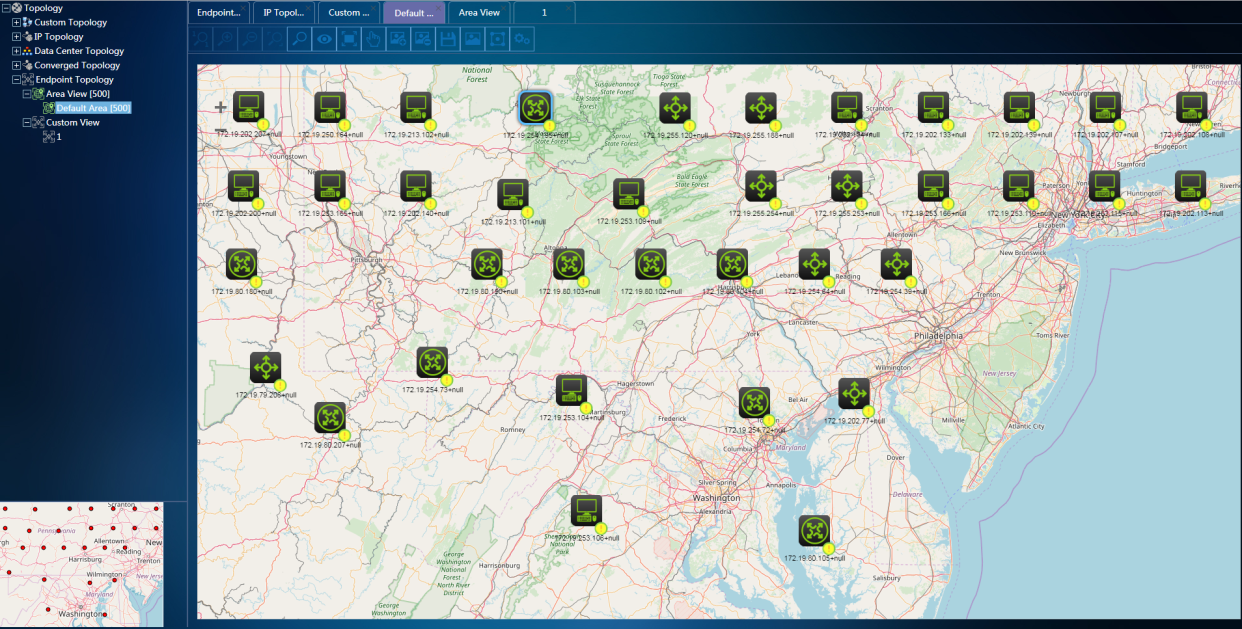
¡ Area view: The area view is synchronous with the area information (including the hierarchy of areas) in the system. When you click an area view, the topology display panel displays the sub areas of the area and endpoints in the area, as shown in Figure 73.
¡ Custom view: You can manually create, delete, or modify a custom view. You can specify existing endpoints and scanners on the network for the view and display these endpoints as nodes in the topology, as shown in Figure 74.

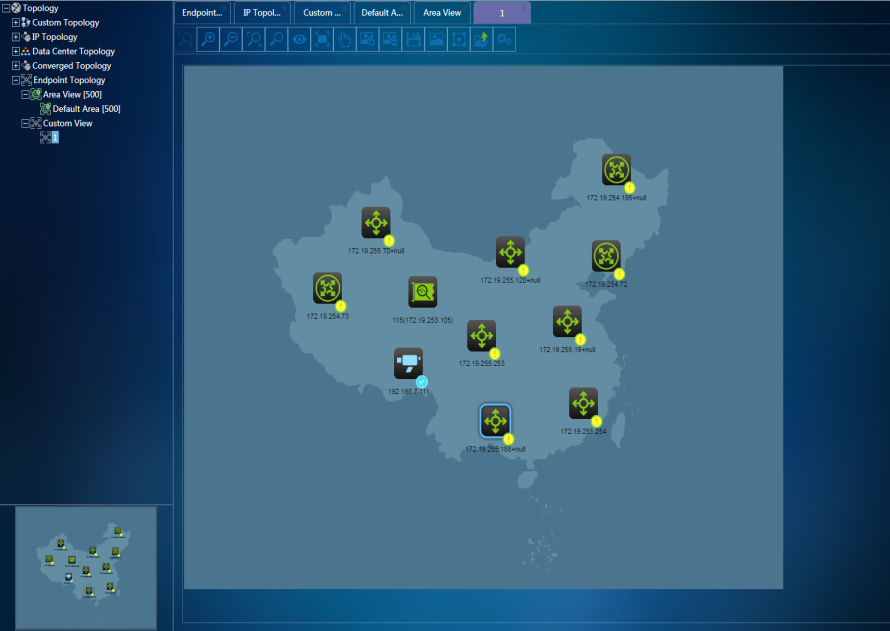
When endpoints in the same topology are connected, the links between them are displayed, as shown in Figure 75. The topology display panel displays view nodes and scanner nodes besides the endpoint nodes. The view nodes and scanner nodes are displayed only in the specific view. When real-time endpoint information is displayed, the icon, color, and corner mark of a node represent the endpoint type, online status, and compliance status.
Figure 99 Endpoint topology links
Topology display panel
· Topology display panel: You can click an endpoint node to view the details of the node. You can drag an endpoint node to any position. Right-click an endpoint node, and then you can select to add or delete an endpoint node on the shortcut menu. The node changes are synchronized to the left topology tree.
· Topology toolbar: Provides the tools for zooming in the topology, zooming out the topology, adding a background, re-laying out the topology, and saving the topology.
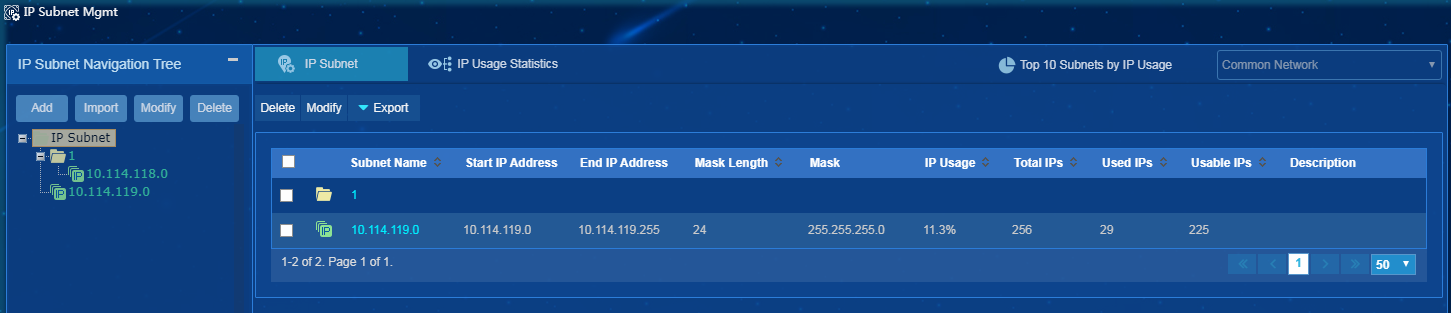
IP subnet management
IP subnet management allows you to display and manage the subnet groups, subnets, IP addresses, and IP usage statistics.
To access the IP Subnet Management page, select Endpoint Profiling Management > IP Subnet Mgmt from the navigation tree.
Table 6 describes areas on the IP Subnet Management page. Areas are numbered as shown in Figure 76.
Table 6 IP Subnet Management page layout
|
No. |
Name |
Description |
|
1 |
IP subnet navigation tree |
Contains menus for managing IP groups and IP subnets. |
|
2 |
IP subnet |
Displays all subgroups and IP subnets in an IP group. |
|
3 |
IP usage statistics |
Displays the total number of IP addresses and IP usage by IP group or displays the following information about an IP subnet: IP usage, endpoint details, top 10 endpoint types, and top 10 endpoint vendors. |
|
4 |
Top 10 subnets by IP usage |
Displays detailed information about top 10 subnets by IP usage. |
|
5 |
Network type list |
Allows you to select a network type (Common or NAT) for data display. |
Figure 100 IP Subnet Management page
Adding an IP group or IP subnet
Adding an IP group
1. Access the IP Subnet Management page.
2. From the IP subnet navigation tree, click Add and then select Add IP Group.
3. Add an IP group, as shown in Figure 77.
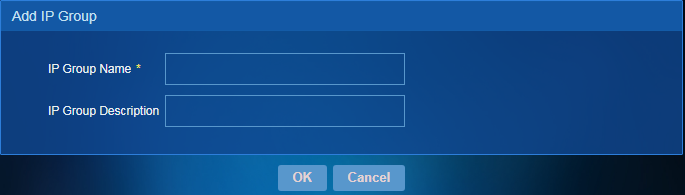
4. Click OK.
Adding an IP subnet
1. Access the IP Subnet Management page.
2. From the IP subnet navigation tree, select an IP subnet group, click Add, and then select Add IP Subnet.
3. Add and configure an IP subnet, as shown in Figure 78.
¡ Subnet Name—Enter the subnet name. Names of IP subnets must be unique.
¡ Subnet Address—Enter the subnet address.
¡ Mask Length—Enter a mask length. After you enter a subnet address and a mask length, the number of IP addresses and the IP address range in the subnet are automatically displayed.
¡ Mask—This field is automatically populated when you enter a mask length. For example, this field displays 255.255.255.0 if the mask length is 24.
¡ Auto Add IPs to Subnet—Select whether to add IP addresses to the subnet. The default setting is No, which indicates that only the subnet is added and IP addresses in the subnet are not added. If you select Yes, both the subnet and all IP addresses in the subnet are added. The added subnet and IP addresses are displayed on the IP subnet list.
¡ Description—Enter a description for the subnet.
Figure 102 Adding an IP subnet
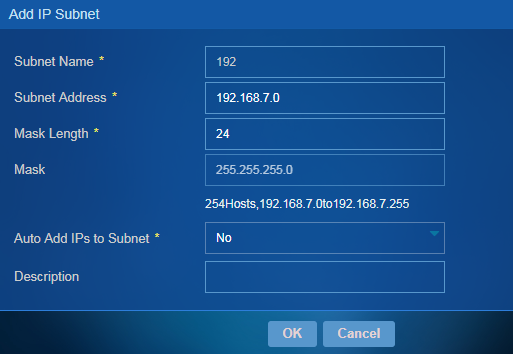
4. Click OK.
Configuring subnet allocation
Supernetting aggregates multiple subnets into a larger network and makes full use of Class C address space. A supernet address borrows network bits for network extension. For example, supernet address 192.168.0.0/21 borrows three network bits from Class C address 192.168.0.0/24. A maximum of 1024 (211-1) subnets are supported within this supernet and one host bit is reserved.
To configure subnet allocation:
1. Access the IP Subnet Management page.
2. From the IP subnet navigation tree, click Add and then select Allocate Subnet.
3. Configure the subnet allocation parameters, as shown in Figure 79.
¡ Supernet Address—Enter a supernet address.
¡ Supernet Mask Length—Select a mask length, in the range of 1 to 30.
¡ Supernet Mask—This field is automatically populated when you select a mask length.
¡ Subnet Size for Allocation—Select a subnet size. The subnet mask cannot be smaller than the supernet mask.
Figure 103 Configuring subnet allocation
4. Click OK.
Batch importing or adding subnets
Batch importing subnets
1. Access the IP Subnet Management page.
2. From the IP subnet navigation tree, select an IP subnet group, click Import, and then select Subnet Import.
3. Configure import parameters, as shown in Figure 80.
The file to be imported must be in the .csv or .txt format.
Batch adding IP subnets
1. Access the IP Subnet Management page.
2. From the IP subnet navigation tree, select an IP subnet group, click Import, and then select Batch Add.
3. Configure parameters, as shown in Figure 81.
¡ IP Address Allocation Space—Enter one or multiple subnet addresses in the subnet address/mask length format, for example 192.168.0.0/24. Enter each subnet address in one line. After you enter subnet addresses and then click Parse, the IP list displays the start IP address, end IP address, and the mask of each subnet.
¡ Auto Add IPs to Subnet—Select whether to add IP addresses to the subnet. The default setting is No, which indicates that only the subnet is added and IP addresses in the subnet are not added. If you select Yes, both the subnet and all IP addresses in the subnet are added. The added subnet and IP addresses are displayed on the IP subnet list.
Figure 105 Batch adding IP subnets
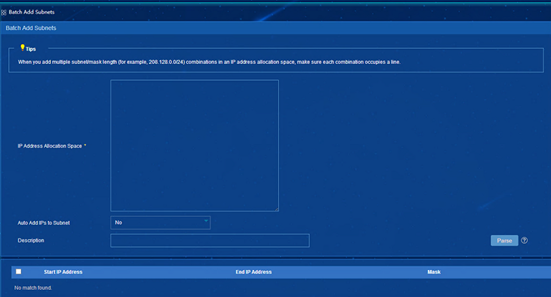
4. Click OK.
Deleting one or multiple IP groups or IP subnets
When you delete an IP group, all IP subgroups and IP subnets in the IP group are also deleted.
To delete an IP group or IP subnet:
1. Access the IP Subnet Management page.
2. From the IP subnet navigation tree, select an IP subnet or IP group, and then click Delete.
3. Click OK.
To delete multiple IP groups or IP subnets:
1. Access the IP Subnet Management page.
2. From the IP subnet navigation tree, select an IP group.
3. From the IP subnet list, select IP subnets or IP groups, and then click Delete.
4. Click OK.
Modifying an IP group or IP subnet
1. Access the IP Subnet Management page.
2. From the IP subnet navigation tree, select an IP subnet or IP group, and then click Modify.
3. On the page that opens, modify the IP subnet or IP group settings.
4. Click OK.
Viewing top 10 subnets by IP usage
1. Access the IP Subnet Management page.
2. Click the Top 10 Subnets by IP Usage link.
Figure 106 Top 10 subnets by IP usage
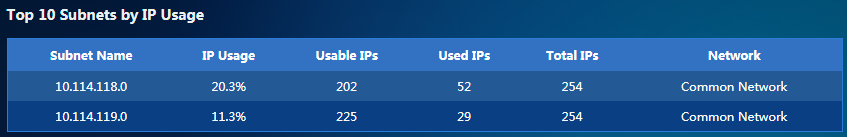
Viewing IP usage statistics
Viewing IP usage statistics for an IP group
The IP usage statistics for an IP group displays the total number of IP addresses, usable IP addresses, and used IP addresses in the group.
To view IP usage statistics for an IP group:
1. Access the IP Subnet Management page.
2. From the IP subnet navigation tree, select an IP group, and then click the IP Usage Statistics tab.
Viewing IP usage statistics for an IP subnet
The IP usage statistics for an IP subnet displays IP usage, endpoint details, top 10 endpoint types, and top 10 endpoint vendors in the subnet. The displayed endpoint details are user configurable.
To view the IP usage statistics for an IP subnet:
1. Access the IP Subnet Management page.
2. From the IP subnet navigation tree, select an IP subnet, and then click the IP Usage Statistics tab.
Figure 107 IP usage statistics
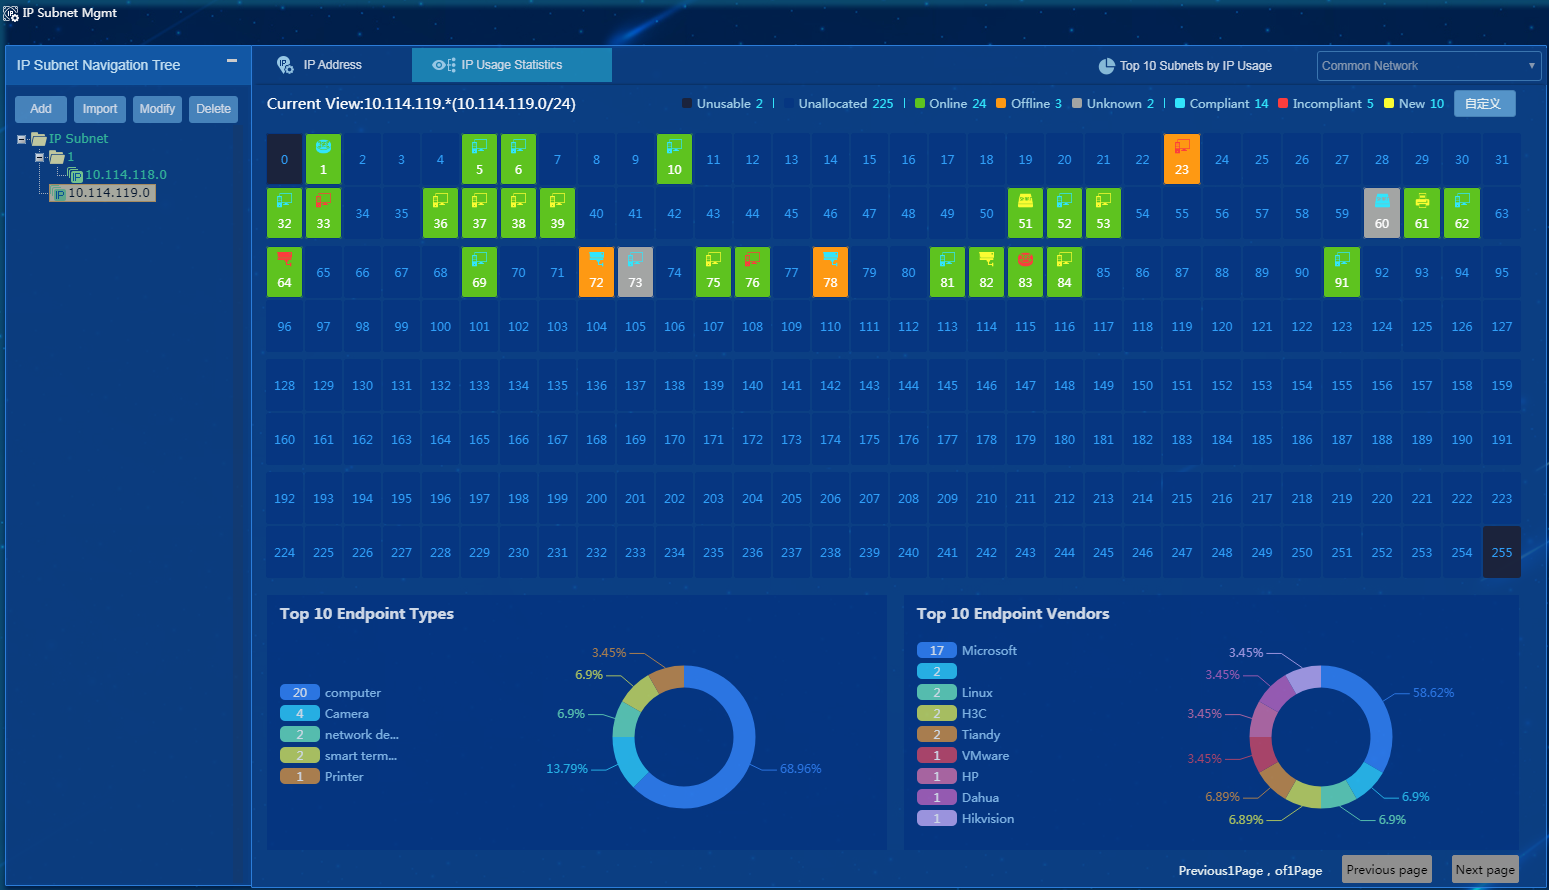
IP baseline management
The status information of an IP address at the specified time is recorded to generate a baseline. IP baseline management allows you to view the IP baseline attributes, and modify, copy, compare, and export IP baselines.
To access the IP Baseline Management page, select Endpoint Profiling Management > IP Baseline Mgmt from the navigation tree.
Figure 108 IP Baseline Management page
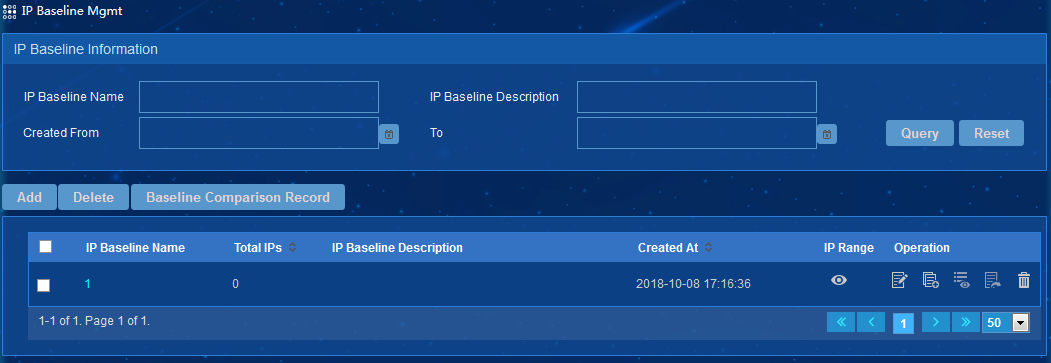
Adding an IP baseline
1. Access the IP Baseline Management page.
2. Click Add.
3. Configure an IP baseline, as shown in Figure 85.
¡ IP Baseline Name—Enter the name of the IP baseline, a string of 1 to 32 characters.
¡ IP Baseline Description—Enter a description for the IP baseline.
¡ IP Range—Click the Expand All link to list all subnets in the common network, and select the IP range for the baseline.
Figure 109 Adding an IP baseline
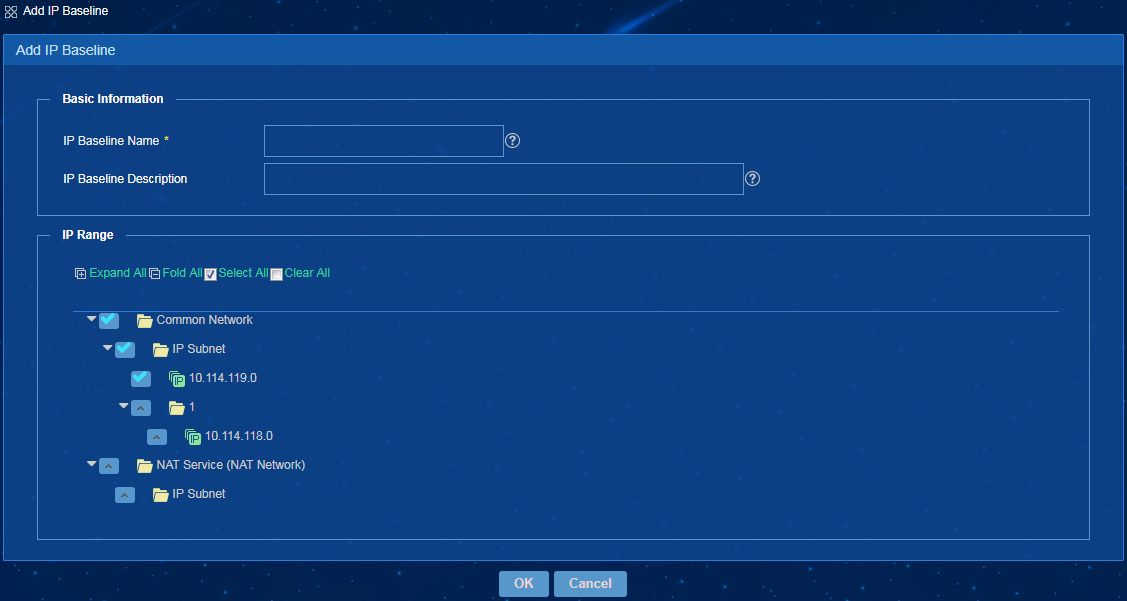
4. Click OK.
Deleting one or multiple IP baselines
When you delete an IP baseline, the baseline comparison record is also deleted.
To delete an IP baseline:
1. Access the IP Baseline Management page.
2. Click the Delete icon ![]() for
an IP baseline.
for
an IP baseline.
3. Click OK.
To delete multiple IP baselines:
1. Access the IP Baseline Management page.
2. Select IP baselines to be deleted, and then click Delete.
3. Click OK.
Baseline comparison
Comparing IP baselines
1. Access the IP Baseline Management page.
2. Click the Compare
icon ![]() for a baseline for which the total number of IP addresses is not 0. This
baseline is displayed in the Left
IP Baseline Name area on the Parameter Settings page that opens.
for a baseline for which the total number of IP addresses is not 0. This
baseline is displayed in the Left
IP Baseline Name area on the Parameter Settings page that opens.
3. Select baselines in the Right IP Baseline Name area, as shown in Figure 86.
Figure 110 Comparing IP baselines
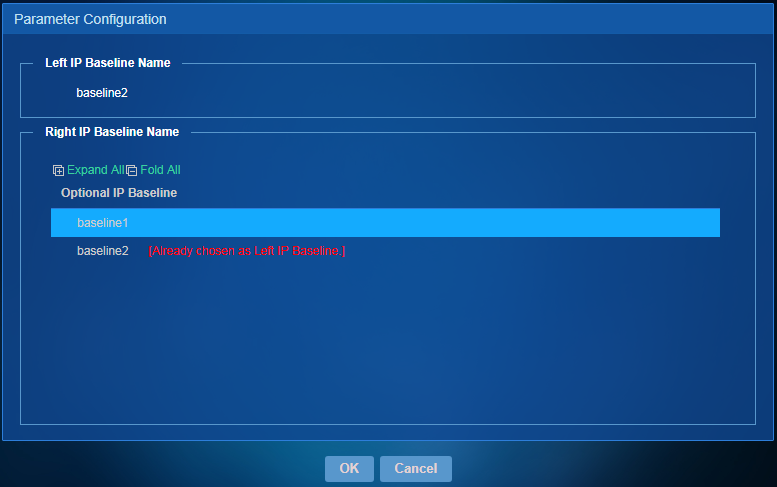
4. Click OK.
To view the baseline comparison details, click View on the baseline comparison result page. The Baseline Comparison Details page opens as shown in Figure 87. To view the comparison information for an IP address, hover over the IP address.
Figure 111 Baseline comparison details
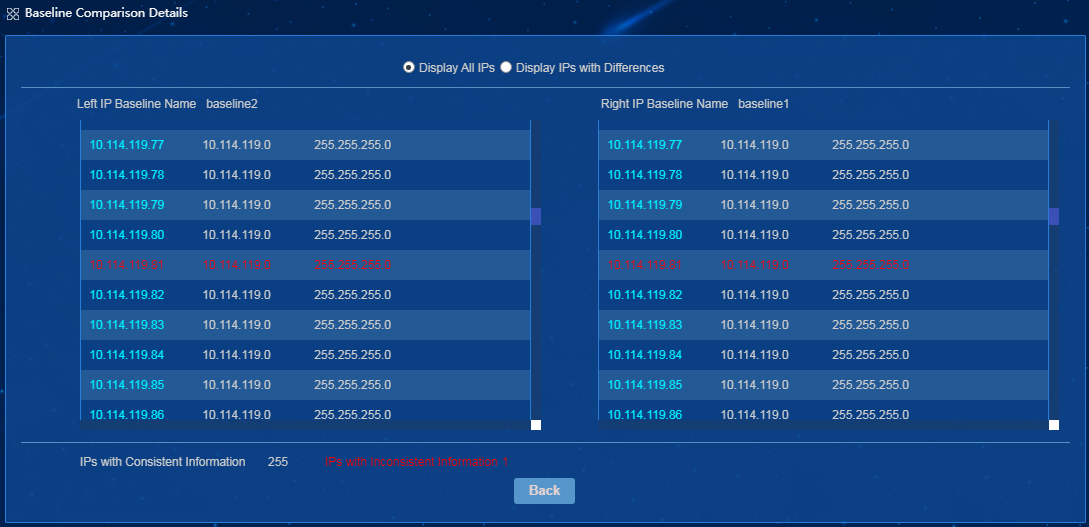
Managing baseline comparison records
1. Access the IP Baseline Management page.
2. Click Baseline Comparison Record.
The Baseline Comparison Record page pens, as shown in Figure 88. You can view, export, or delete baseline comparison records.
Figure 112 Baseline comparison record
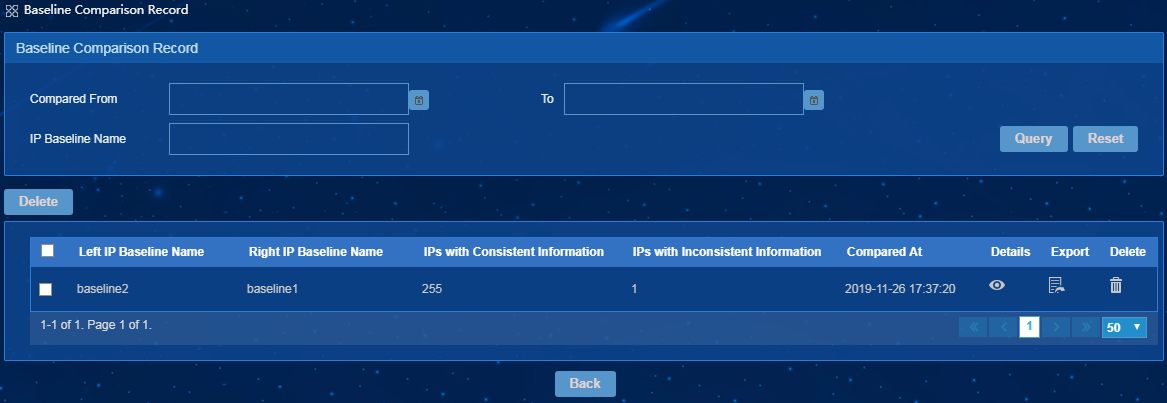
EPS configuration examples
This chapter provides configuration examples of EPS.
Example: Configuring hierarchical EPS
Network configuration
Add a lower-level EPS to the current EPS system, monitor the lower-level EPS, and generate the statistical report of hierarchical EPS.
Restrictions and guidelines
When you configure hierarchical EPS, follow these restrictions and guidelines:
· Only the administrator has the privilege to manage and view lower-level EPSs.
· EPS collects endpoint data of only immediate lower-level EPSs of the current system for hierarchical EPS monitoring. It does not collect data from lower-level EPSs that are configured under a lower-level EPS of the current system.
· To ensure the display of lower-level EPSs, configure all lower-level EPSs to use the same alias for the same endpoint type and use the same system time as the EPS server.
Procedure
Adding a lower-level EPS
1. From the navigation tree, select Endpoint Profiling System > System Mgmt > Hierarchical EPS.
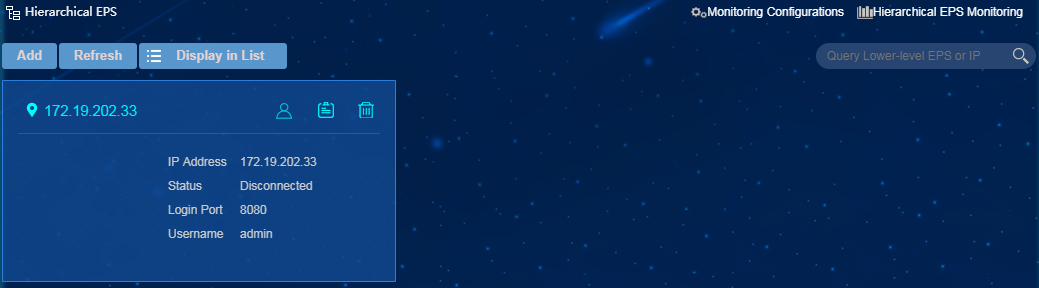
2. Click Add.
3. Add a lower-level EPS, as shown in Figure 90.
¡ Lower-level EPS Name—Enter a unique name for the lower-level EPS.
¡ IP Address—Enter the IP address of the lower-level EPS. This example uses 172.19.202.36.
¡ Login Method—Select a login method. Options include HTTP and HTTPS. This example uses HTTP.
¡ Port—Enter a port number. The default ports for HTTP and HTTPS are 8080 and 8443, respectively. This example uses the HTTP login method and port number 8080.
¡ Username—Enter the administrator username for logging in to the lower-level EPS.
¡ Login Password/Confirm Login Password—Enter and confirm the administrator password for logging in to the lower-level EPS.
¡ Location—Enter
the location of the lower-level EPS or click the Select from Map icon ![]() to select a location from the map.
to select a location from the map.
¡ Longitude and Latitude—Enter the longitude and latitude of the lower-level EPS, or click
the Select from Map icon ![]() , query and click the location to obtain its
longitude and latitude.
, query and click the location to obtain its
longitude and latitude.
¡ Person Responsible—Enter the person who is responsible for the lower-level EPS.
¡ Telephone—Enter the telephone number of the person responsible for the lower-level EPS.
¡ Email—Enter the email address of the person responsible for the lower-level EPS.
¡ Description—Enter a description for the lower-level EPS.
Figure 114 Adding a lower-level EPS
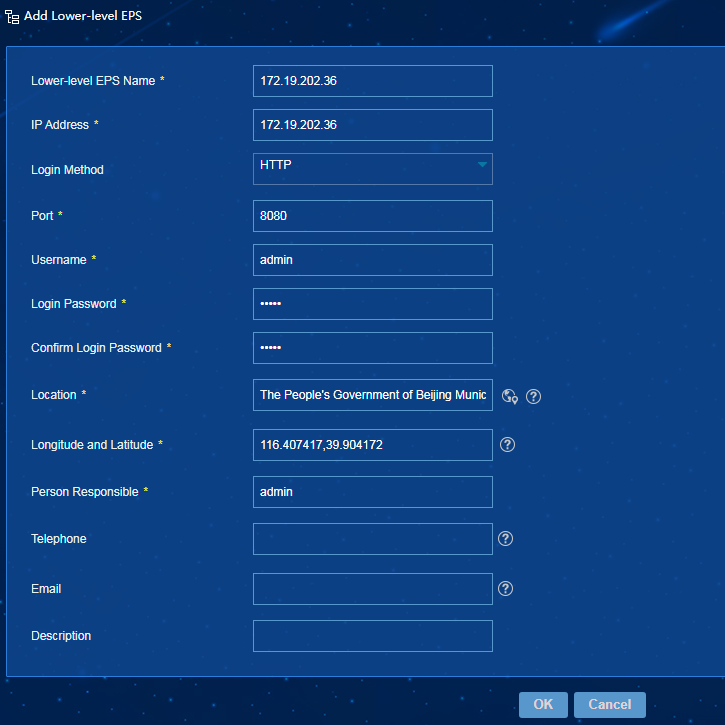
4. Click OK.
The lower-EPS is displayed on the Hierarchical EPS page, as shown in Figure 91.
Figure 115 Verifying the lower-level EPS
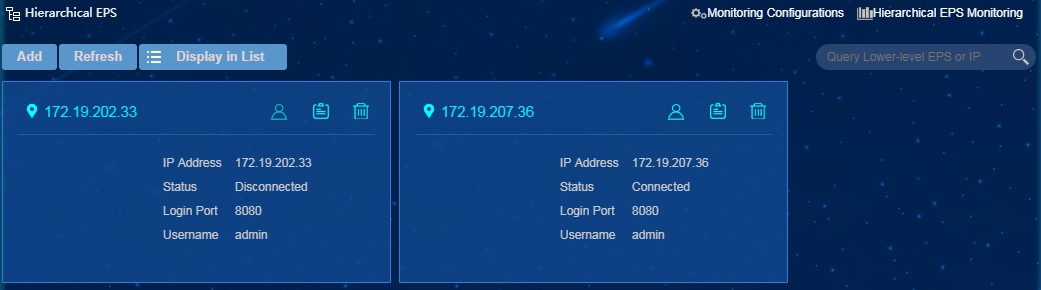
Configuring hierarchical EPS monitoring parameters
1. From the navigation tree, select Endpoint Profiling System > System Mgmt > Hierarchical EPS.
2. Click the Monitoring Configurations link in the upper right corner.
3. Configure monitoring parameters, as shown in Figure 92.
Figure 116 Hierarchical EPS monitoring parameters

4. Click OK.
Viewing hierarchical EPS monitoring information
1. From the navigation tree, select Endpoint Profiling System > System Mgmt > Hierarchical EPS.
2. Click the Hierarchical EPS Monitoring link in the upper right corner.
The page that opens displays statistics about all lower-level EPSs properly connected to the current EPS system, including the lower-level EPS at 172.19.202.36.
Figure 117 Hierarchical EPS monitoring
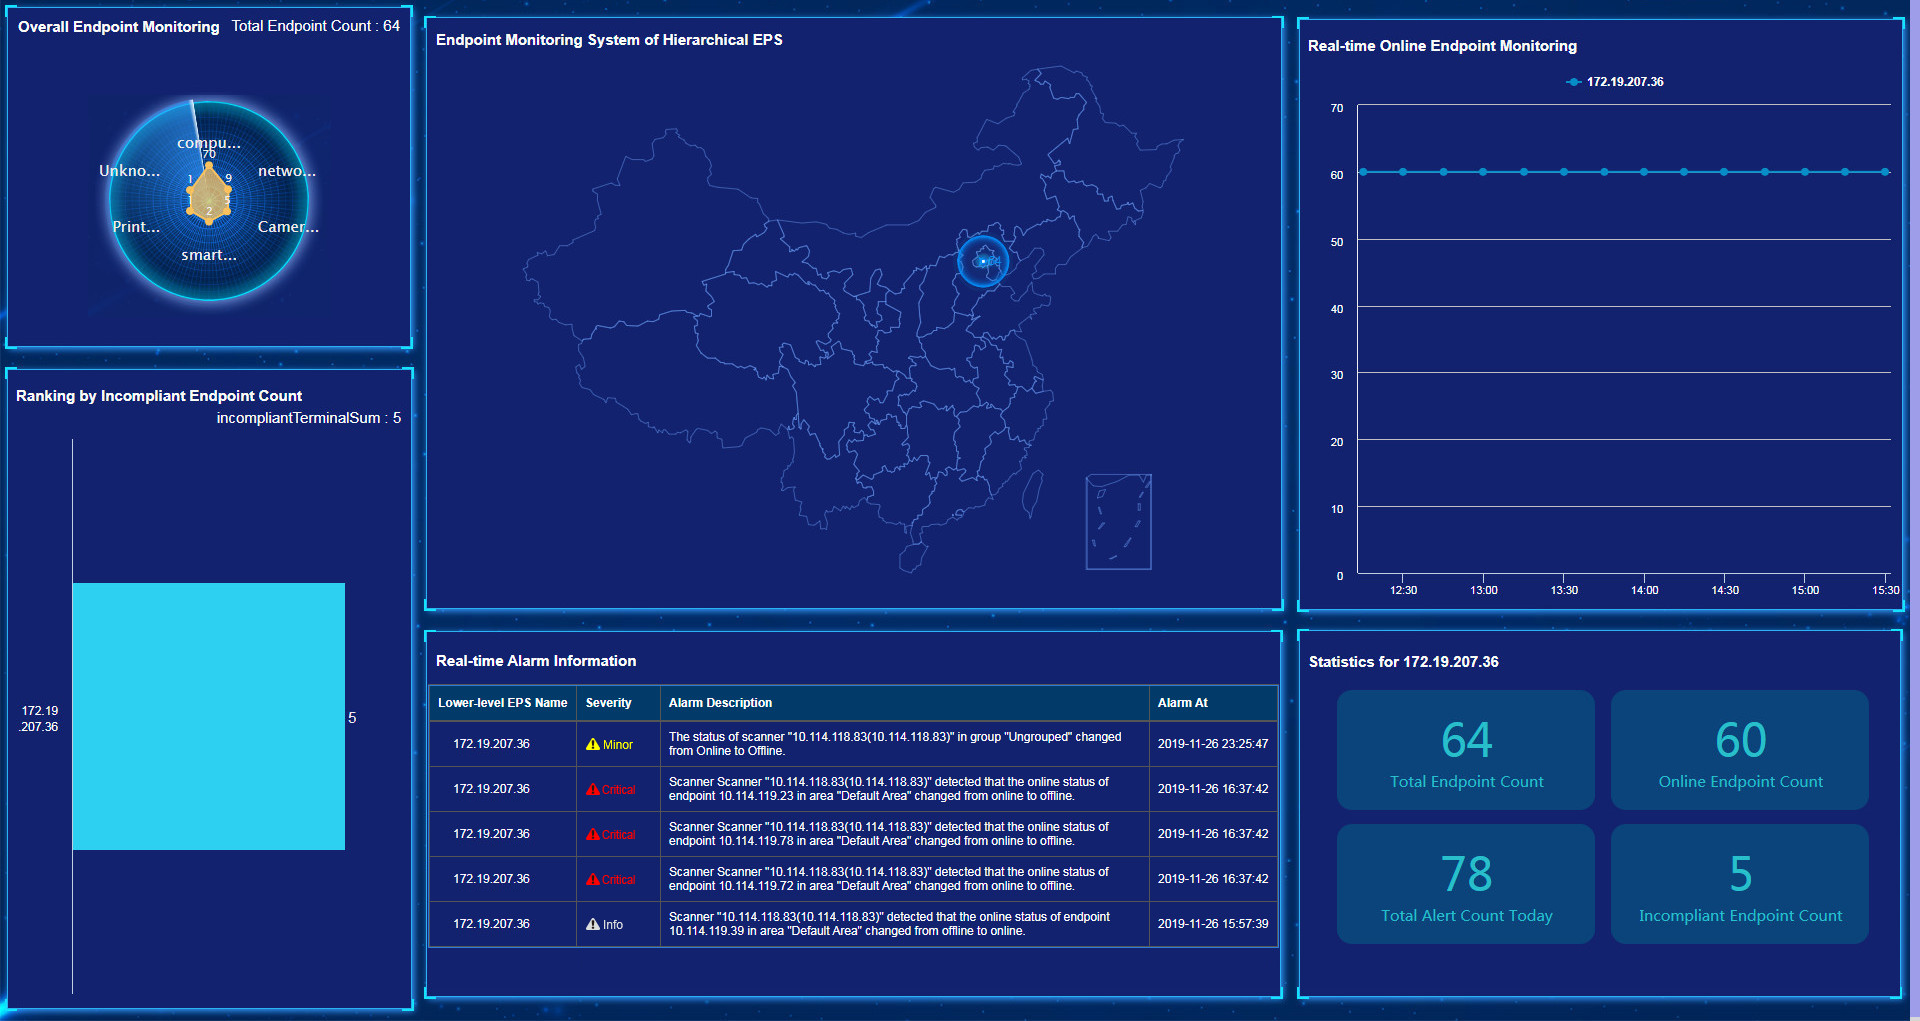
Viewing the statistical report of hierarchical EPS
1. From the navigation tree, select Endpoint Profiling Management > Reports.
2. On the report template list page, click Statistical Report of Hierarchical EPS.
The page that opens displays the report about all lower-level EPSs properly connected to the current EPS system, including lower-level EPS at 172.19.202.56
Figure 118 Statistical report of hierarchical EPS

|
|
IMPORTANT: The hierarchical EPS monitoring page and the statistical report do not display endpoint statistics of lower-level EPSs in Disconnected status because their endpoint statistics are inaccessible. |
Logging in to the lower-level EPS
To log in to the lower-level EPS, access the
Hierarchical EPS page, and then click the Hierarchical EPS icon ![]() for
the lower-level EPS.
for
the lower-level EPS.
|
|
IMPORTANT: You cannot log in to a lower-level EPS from the current EPS system if the lower-level EPS is in Disconnected status. |
Example: Configuring collaboration with EIA to add endpoint users to the EIA blacklist
Network configuration
Configure collaboration between EPS and EIA to add endpoint users to the EIA blacklist to control network access.
Restrictions and guidelines
When collaboration between EPS and EIA is enabled, EPS supports the following blacklisting methods:
· Automatic blacklisting—EPS automatically adds endpoint users to the blacklist during the scan progress if the endpoint users meet the blacklist criteria.
· Manual blacklisting—The administrator manually adds endpoint users to the blacklist.
You can view blacklisted endpoint users only on the EIA server.
Prerequisites
Configure the access device to log out users by using session-control packets or CoA messages.
Disable the Control User Authentication parameter in the EIA system parameter settings.
Procedure
1. From the navigation tree, select Endpoint Profiling Management > System Mgmt > System Parameters.
2. In the Associated Server Settings area, enable the associated server, set server parameters, and enable collaboration with the EIA component, as shown in Figure 96.
Figure 120 Configuring collaboration with EIA
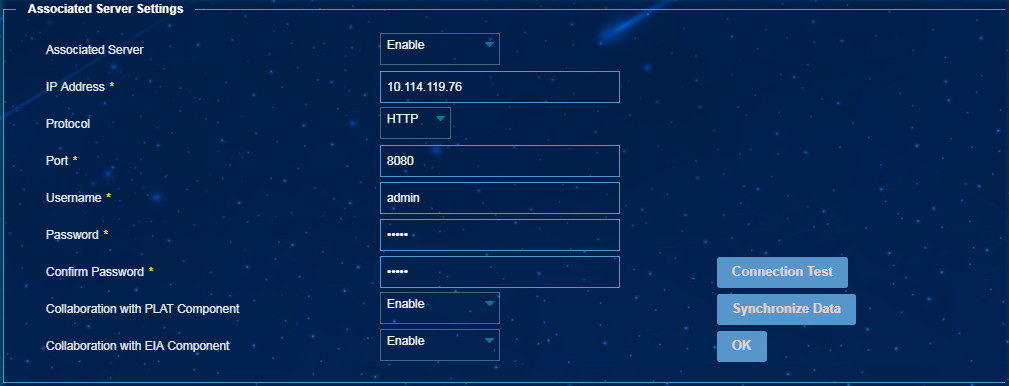
3. Click OK.
4. Click Connection Test.
The Connection succeeded message is displayed, as shown in Figure 97.
Figure 121 Connection test result
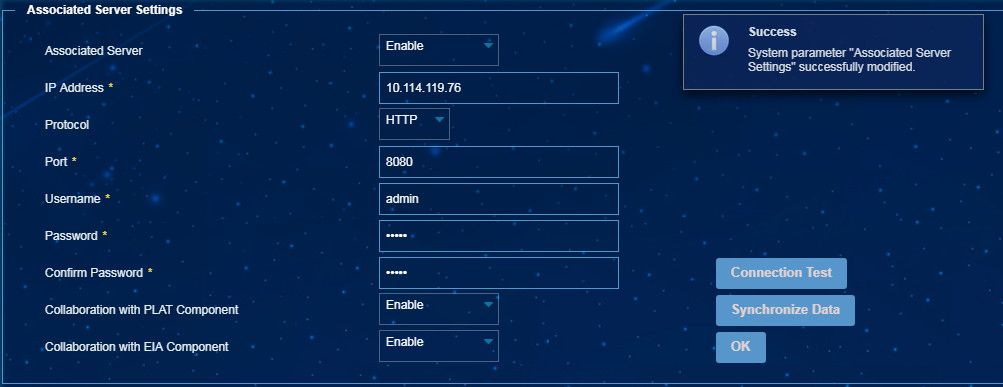
5. Configure blacklist parameters, as shown in Figure 98.
¡ Add to Blacklist Through—Select a blacklisting method. Options include Scanner and EIA.
- Scanner—The scanner blocks access ports of endpoints based on the port information assigned by EPS.
- EIA—EIA logs out endpoint users and adds them to the EIA blacklist. To use this feature, you must enable the associated server and enable the collaboration with EIA. This option is selected in this example.
- Security Gateway—EPS works with security gateways to remove incompliant endpoints from authentication whitelists. If these endpoints are approved to be compliant, they will be added to the authentication whitelists again.
¡ Service Scenario—Select a scenario for adding endpoint users to the EIA blacklist. Options include Service First and Security First.
- Service First—Only supports manually adding endpoint users to the EIA blacklist.
- Security First—Supports specifying criteria for automatically adding endpoint users to the EIA blacklist. This option is selected in this example.
¡ Add Indirectly Connected Ports to Blacklist—This option takes effect if the collaboration with scanners for blacklisting is enabled. In this example, this option is not available.
¡ Automatically Add Incompliant Endpoints to Blacklist—Enable this option to allow the system to immediately log out users on the scanned incompliant endpoints and add the endpoint users to the EIA blacklist.
¡ Automatically Add New Endpoints to Blacklist—Enable this option allow the system to log out the user on the scanned new endpoint if the endpoint is rediscovered after a time longer than the New Endpoint Retention Period setting. The endpoint user is also added to the EIA blacklist.
|
|
CAUTION: If you enable the Automatically Add New Endpoints to Blacklist feature in a version earlier than iMC EPS 7.3 (E0602P06), numerous new endpoints might be blocked. Online users on these endpoints will be forced to go offline and added to the blacklist. Make sure you are fully aware of the impacts of this feature when you enable it on a live network. |
¡ Automatically Add Offline Endpoints to Blacklist—Enable this option to allow the system to log out the user on the offline endpoint if the offline duration of the endpoint exceeds the Offline Endpoint Retention Period setting. The endpoint user is also added to the EIA blacklist.
¡ New Endpoint Retention Period—Set the new endpoint retention period. This parameter takes effects only when Automatically Add New Endpoints to Blacklist is enabled. EPS executes a task at 3 a.m. after the new endpoint retention period and adds users on the newly discovered endpoints to the EIA blacklist. In this example, the period is set to 3 days.
¡ Offline Endpoint Retention Period—Set the offline endpoint retention period. The system checks all offline endpoints every day. If the offline duration of an endpoint exceeds the retention period, the system automatically adds the endpoint user to the EIA blacklist. In this example, the period is set to 7 days.
¡ Threshold Alarm Interval—Set an interval for EPS to count the number of the endpoints on which users are added to the EIA blacklist. If the number of the endpoints within the interval exceeds the threshold, EPS removes the endpoint users from the EIA blacklist and generates an alarm. In this example, the interval is set to 30 minutes.
Figure 122 Configuring blacklist parameters
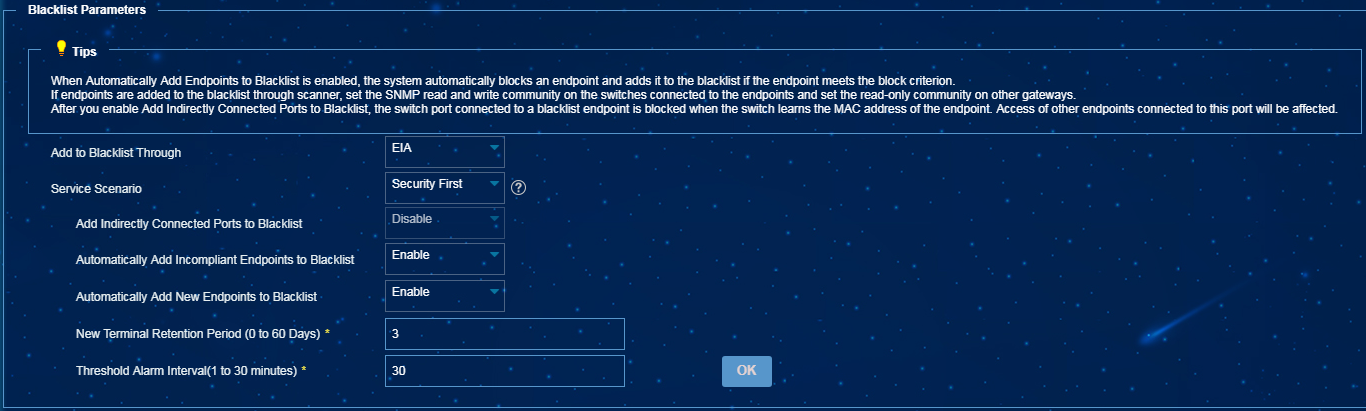
6. In the Basic Parameters area, set the scanning interval as shown in Figure 99. The Scanning Interval specifies the interval at which a scanner scans endpoints. The scanner reports all information about endpoints after the scan.
Figure 123 Setting the scanning interval
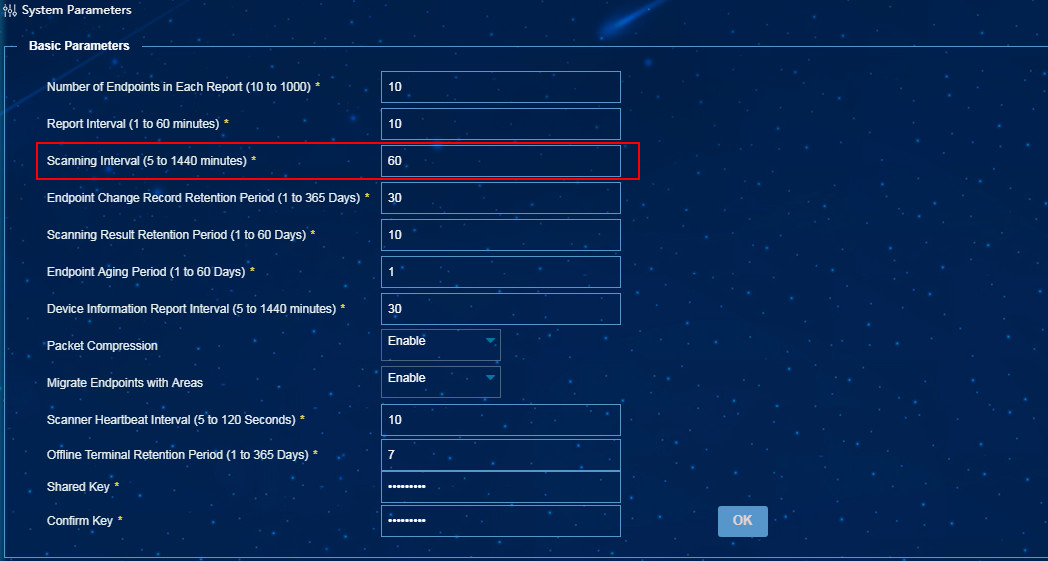
If an endpoint is automatically approved to be incompliant during the scan process, EPS calculates the online duration of the endpoint and determines whether to blacklist the endpoint user:
¡ If the online duration of the endpoint is longer than the scanning interval, EPS approves the endpoint to be compliant.
¡ If the online duration of the endpoint is equal to or shorter than the scanning interval, the endpoint user is added to the EIA blacklist.
Verifying the configuration
1. Log in to EIA, and click the User tab.
2. From the left navigation tree, select Access User > Blacklisted User.
The Blacklisted User page shows that endpoint users are added to the EIA blacklist, as shown in Figure 100.
Figure 124 Blacklisted endpoint users