- Table of Contents
-
- 01-Fundamentals Configuration Guide
- 00-Preface
- 01-CLI configuration
- 02-RBAC configuration
- 03-Login management configuration
- 04-FTP and TFTP configuration
- 05-File system management configuration
- 06-Configuration file management configuration
- 07-Software upgrade configuration
- 08-ISSU configuration
- 09-Emergency Shell configuration
- 10-Automatic configuration
- 11-Preprovisioning feature configuration
- 12-Device management configuration
- 13-Tcl configuration
- 14-Management with BootWare
- 15-Python configuration
- 16-License management
- Related Documents
-
| Title | Size | Download |
|---|---|---|
| 12-Device management configuration | 365.88 KB |
Device management restrictions and guidelines
Configuration restrictions and guidelines
Enabling displaying the copyright statement
Setting the system operating mode
Rebooting devices immediately at the CLI
Schedule configuration example
Disabling password recovery capability·
Setting the port status detection timer
Setting memory alarm thresholds
Configuration restrictions and guidelines
Configuring resource monitoring
Configuration restrictions and guidelines
Configuring the temperature alarm thresholds
Specifying load sharing modes for a card
Specifying an operating mode and a proxy mode for a service module
About operating modes for service modules·
About proxy modes for service modules
Configuration restrictions and guidelines
Specifying a forwarding mode for service module slots
About forwarding modes for service module slots
Enabling the port down feature globally
Configuring an asset profile for a physical component
Isolating a switching fabric module
Isolation restrictions and guidelines
Suppressing switching fabric module removal interrupt signals
Configuring hardware failure detection and protection
Specifying the actions to be taken for hardware failures
Enabling hardware failure protection for interfaces
Enabling hardware failure protection for aggregation groups
Enabling data forwarding path failure detection
Enabling power supply management
Specifying the number of redundant power supplies
Setting power supply priorities for service modules
Verifying and diagnosing transceiver modules
Diagnosing transceiver modules·
Manually triggering an active/standby switchover
Restoring the factory-default configuration
Managing the device
This chapter describes how to configure basic device parameters and manage the device.
You can perform the configuration tasks in this chapter in any order.
Device management task list
Device management restrictions and guidelines
After you power on the device, the device takes some time to start up and complete configuration and data restoration and synchronization. Before configuring the device, perform the following tasks:
· Use the display device command to verify that the device is in Normal state.
· Use the display system stable state command to verify that the system status is Stable.
Failing to follow this rule might cause configuration failures and event device exceptions.
Configuring the device name
A device name (also called hostname) identifies a device in a network and is used in CLI view prompts. For example, if the device name is Sysname, the user view prompt is <Sysname>.
Configuration restrictions and guidelines
On an underlay network, the device uses the device name that you have configured for it. If you do not configure a device name for the device but automated underlay network deployment is enabled, the device uses the device name assigned by the VCF fabric feature. For more information about VCF fabric, see VCF fabric configuration in Network Management and Monitoring Configuration Guide.
Configuration procedure
To configure the device name:
|
Step |
Command |
Remarks |
|
1. Enter system view. |
system-view |
N/A |
|
2. Configure the device name. |
sysname sysname |
The default device name is H3C. |
Configuring the system time
This feature is supported only on the default MDC.
Correct system time is essential to network management and communication. Configure the system time correctly before you run the device on the network.
The system time is determined by the UTC time, the time zone, and the daylight saving time. You can use the display clock command to view the system time.
The device can obtain the UTC time from one of the following time sources:
· None—Local UTC time, set by using the clock datetime command.
· NTP—NTP time source. You must configure NTP correctly. For more information about NTP and NTP configuration, see Network Management and Monitoring Configuration Guide.
The UTC time obtained from an NTP time source is more precise.
To configure the system time:
|
Step |
Command |
Remarks |
|
1. Enter system view. |
system-view |
N/A |
|
2. Specify the UTC time source. |
clock protocol { none | ntp mdc mdc-id } |
By default, the device uses the NTP time source specified on the default MDC. If you execute this command multiple times, the most recent configuration takes effect. |
|
3. (Optional.) Set the local UTC time. |
a
Return to user view: b
Specify a UTC time for the device: c Enter system view again: |
Required when the local UTC time source is used. |
|
4. Set the time zone. |
clock timezone zone-name { add | minus } zone-offset |
By default, the system uses Greenwich Mean Time time zone. After a time zone change, the device recalculates the system time. To view the system time, use the display clock command. This setting must be consistent with the time zone of the place where the device resides. |
|
5. Set the daylight saving time. |
clock summer-time name start-time start-date end-time end-date add-time |
By default, the daylight saving time is not set. After you set the daylight saving time, the device recalculates the system time. To view the system time, use the display clock command. The settings must be consistent with the daylight saving time parameters of the place where the device resides. |
Enabling displaying the copyright statement
When displaying the copyright statement is enabled, the device displays the copyright statement in the following situations:
· When a Telnet or SSH user logs in.
· When a console user quits user view. This is because the device automatically tries to restart the user session.
The following is a sample copyright statement:
******************************************************************************
* Copyright (c) 2004-2017 New H3C Technologies Co., Ltd. All rights reserved.*
* Without the owner's prior written consent, *
* no decompiling or reverse-engineering shall be allowed. *
******************************************************************************
To enable displaying the copyright statement:
|
Step |
Command |
Remarks |
|
6. Enter system view. |
system-view |
N/A |
|
7. Enable displaying the copyright statement. |
copyright-info enable |
By default, this feature is enabled. |
Configuring banners
Banners are messages that the system displays when a user logs in.
Banner types
The system supports the following banners:
· Legal banner—Appears after the copyright or license statement. To continue login, the user must enter Y or press Enter. To quit the process, the user must enter N. Y and N are case insensitive.
· Message of the Day (MOTD) banner—Appears after the legal banner and before the login banner.
· Login banner—Appears only when password or scheme authentication is configured.
· Incoming banner—The device does not support this banner.
· Shell banner—Appears for all login users.
Banner input methods
You can configure a single-line banner or a multiline banner.
· Single-line banner.
A single-line banner must be input in the same line as the command. The start and end delimiters for the banner can be any printable character. However, they must be the same and must not be included in the banner. The input text, including the command keywords and the delimiters, cannot exceed 511 characters. Do not press Enter before you input the end delimiter.
For example, you can configure the shell banner "Have a nice day." as follows:
<System> system-view
[System] header shell %Have a nice day.%
· Multiline banner.
A multiline banner can contain carriage returns. A carriage return is counted as two characters.
To input a multiline banner, use one of the following methods:
¡ Method 1—Press Enter after the final command keyword, enter the banner as prompted, and end the final line with the delimiter character %. The banner plus the end delimiter cannot exceed 1999 characters. For example, you can configure the banner "Have a nice day. Please input the password." as follows:
<System> system-view
[System] header shell
Please input banner content, and quit with the character '%'.
Have a nice day.
Please input the password.%
¡ Method 2—After you type the final command keyword, type any single printable character as the start delimiter for the banner and press Enter. Then, type the banner as prompted and end the final line with the same delimiter. The banner plus the end delimiter cannot exceed 1999 characters. For example, you can configure the banner "Have a nice day. Please input the password." as follows:
<System> system-view
[System] header shell A
Please input banner content, and quit with the character 'A'.
Have a nice day.
Please input the password.A
¡ Method 3—After you type the final command keyword, type the start delimiter and part of the banner and press Enter. Then, enter the rest of the banner as prompted and end the final line with the same delimiter. The banner plus the start and end delimiters cannot exceed 2002 characters. For example, you can configure the banner "Have a nice day. Please input the password." as follows:
<System> system-view
[System] header shell AHave a nice day.
Please input banner content, and quit with the character 'A'.
Please input the password.
A
Configuration procedure
To configure banners:
|
Step |
Command |
Remarks |
|
1. Enter system view. |
system-view |
N/A |
|
2. Configure the legal banner. |
header legal text |
By default, the device does not have a legal banner. |
|
3. Configure the MOTD banner. |
header motd text |
By default, the device does not have an MOTD banner. |
|
4. Configure the login banner. |
header login text |
By default, the device does not have a login banner. |
|
5. Configure the incoming banner. |
header incoming text |
By default, the device does not have an incoming banner. |
|
6. Configure the shell banner. |
header shell text |
By default, the device does not have a shell banner. |
Setting the system operating mode
This feature is supported only on the default MDC.
The device can operate in one of the following modes:
· advance—Advanced mode.
· standard—Standard mode.
In different operating modes, the device supports different features, and might have different specifications for the supported features. For example, the FCoE feature is supported only in advanced mode.
To change the operating mode to advance, make sure the device has enough IFP ACL resources. To display the current IFP ACL resource information, use the display qos-acl resource command. For more information about this command, see ACL and QoS Command Reference.
To set the system operating mode:
|
Step |
Command |
Remarks |
|
1. Enter system view. |
system-view |
N/A |
|
2. Set the system operating mode. |
system-working-mode { advance | standard } |
By default, the device operates in standard mode. The advance keyword is supported on the following interface modules: · EC interface modules. · FE interface modules. · SA interface modules. · SF interface modules. · SG interface modules. Change to the operating mode takes effect after a reboot. |
Rebooting the device
|
|
CAUTION: · A device reboot might interrupt network services. · To avoid configuration loss, use the save command to save the running configuration before a reboot. For more information about the save command, see Fundamentals Command Reference. · Before a reboot, use the display startup and display boot-loader commands to verify that the startup configuration file and startup software images are correctly specified. If a startup configuration file or software image problem exists, the device cannot start up correctly. For more information about the two display commands, see Fundamentals Command Reference. |
The following device reboot methods are available:
· Immediately reboot the device at the CLI.
· Schedule a reboot at the CLI, so the device automatically reboots at the specified time or after the specified period of time.
· Power off and then power on the device. This method might cause data loss, and is the least-preferred method.
Using the CLI, you can reboot the device from a remote host.
Configuration guidelines
When you schedule a reboot, follow these guidelines:
· In standalone mode, the automatic reboot configuration is canceled if an active/standby switchover occurs.
· In IRF mode, the automatic reboot configuration is effective on all member devices. It will be canceled if a switchover between the global active MPU and a global standby MPU occurs.
· For data security, the device does not reboot while it is performing file operations.
Rebooting devices immediately at the CLI
Execute one of the following commands as appropriate in user view:
|
Task |
Command |
Remarks |
|
Reboot a card or the entire device. (In standalone mode.) |
reboot [ slot slot-number ] [ force ] |
The subslot subslot-number option is not supported in the current software version. |
|
Reboot an IRF member device or all IRF member devices. (In IRF mode.) |
reboot [ chassis chassis-number [ slot slot-number ] ] [ force ] |
The subslot subslot-number option is not supported in the current software version. |
Scheduling a device reboot
The device supports only one device reboot schedule. If you configure the scheduler reboot at or scheduler reboot delay command multiple times or configure both commands, the most recent configuration takes effect.
To schedule a reboot, execute one of the following commands in user view:
|
Task |
Command |
Remarks |
|
Specify the reboot date and time. |
scheduler reboot at time [ date ] |
By default, no reboot date or time is specified. |
|
Specify the reboot delay time. |
scheduler reboot delay time |
By default, no reboot delay time is specified. |
Scheduling a task
You can schedule the device to automatically execute a command or a set of commands without administrative interference.
You can configure a non-periodic schedule or a periodic schedule. A non-periodic schedule is not saved to the configuration file and is lost when the device reboots. A periodic schedule is saved to the startup configuration file and is automatically executed periodically.
Configuration guidelines
When you schedule a task, follow these guidelines:
· Make sure all commands in a schedule are compliant to the command syntax. The system does not check the syntax when you assign a command to a job.
· A schedule cannot contain any of these commands: telnet, ftp, ssh2, and monitor process.
· A schedule does not support user interaction. If a command requires a yes or no answer, the system always assumes that a Y or Yes is entered. If a command requires a character string input, the system assumes that either the default character string (if any) or a null string is entered.
· A schedule is executed in the background, and no output (except for logs, traps, and debug information) is displayed for the schedule.
Configuration procedure
To configure a schedule for the device:
|
Step |
Command |
Remarks |
|
1. Enter system view. |
system-view |
N/A |
|
2. Create a job. |
scheduler job job-name |
By default, no job exists. |
|
3. Assign a command to the job. |
command id command |
By default, no command is assigned to a job. You can assign multiple commands to a job. A command with a smaller ID will be executed first. To assign a command (command A) to a job, you must first assign the job the command or commands for entering the view of command A. |
|
4. Exit to system view. |
quit |
N/A |
|
5. Create a schedule. |
scheduler schedule schedule-name |
By default, no schedule exists. |
|
6. Assign a job to a schedule. |
job job-name |
By default, no job is assigned to a schedule. You can assign multiple jobs to a schedule. The jobs will be executed concurrently. |
|
7. Assign user roles to the schedule. |
user-role role-name |
By default, a schedule has the user role of the schedule creator. You can assign up to 64 user roles to a schedule. A command in a schedule can be executed if it is permitted by one or more user roles of the schedule. |
|
8. Specify an execution time table for the schedule. |
·
Specify the execution date
and time: ·
Specify the execution days
and time: ·
Specify the execution delay time: ·
Specify the periodic execution points of time: ·
Specify the start time and execution
interval: |
By default, no execution time is specified for a schedule. Executing the clock datetime, clock summer-time, or clock timezone commands does not change the execution time table that is already configured for a schedule. |
Schedule configuration example
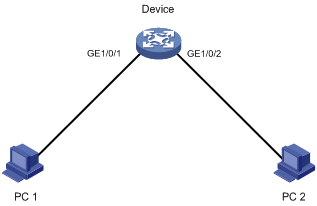
Network requirements
As shown in Figure 1, two interfaces of the device are connected to users.
To save energy, configure the device to perform the following operations:
· Enable the interfaces at 8:00 a.m. every Monday through Friday.
· Disable the interfaces at 18:00 every Monday through Friday.
Scheduling procedure
# Enter system view.
<Sysname> system-view
# Configure a job for disabling interface GigabitEthernet 1/0/1.
[Sysname] scheduler job shutdown-GigabitEthernet1/0/1
[Sysname-job-shutdown-GigabitEthernet1/0/1] command 1 system-view
[Sysname-job-shutdown-GigabitEthernet1/0/1] command 2 interface gigabitethernet 1/0/1
[Sysname-job-shutdown-GigabitEthernet1/0/1] command 3 shutdown
[Sysname-job-shutdown-GigabitEthernet1/0/1] quit
# Configure a job for enabling interface GigabitEthernet 1/0/1.
[Sysname] scheduler job start-GigabitEthernet1/0/1
[Sysname-job-start-GigabitEthernet1/0/1] command 1 system-view
[Sysname-job-start-GigabitEthernet1/0/1] command 2 interface gigabitethernet 1/0/1
[Sysname-job-start-GigabitEthernet1/0/1] command 3 undo shutdown
[Sysname-job-start-GigabitEthernet1/0/1] quit
# Configure a job for disabling interface GigabitEthernet 1/0/2.
[Sysname] scheduler job shutdown-GigabitEthernet1/0/2
[Sysname-job-shutdown-GigabitEthernet1/0/2] command 1 system-view
[Sysname-job-shutdown-GigabitEthernet1/0/2] command 2 interface gigabitethernet 1/0/2
[Sysname-job-shutdown-GigabitEthernet1/0/2] command 3 shutdown
[Sysname-job-shutdown-GigabitEthernet1/0/2] quit
# Configure a job for enabling interface GigabitEthernet 1/0/2.
[Sysname] scheduler job start-GigabitEthernet1/0/2
[Sysname-job-start-GigabitEthernet1/0/2] command 1 system-view
[Sysname-job-start-GigabitEthernet1/0/2] command 2 interface gigabitethernet 1/0/2
[Sysname-job-start-GigabitEthernet1/0/2] command 3 undo shutdown
[Sysname-job-start-GigabitEthernet1/0/2] quit
# Configure a periodic schedule for enabling the interfaces at 8:00 a.m. every Monday through Friday.
[Sysname] scheduler schedule START-pc1/pc2
[Sysname-schedule-START-pc1/pc2] job start-GigabitEthernet1/0/1
[Sysname-schedule-START-pc1/pc2] job start-GigabitEthernet1/0/2
[Sysname-schedule-START-pc1/pc2] time repeating at 8:00 week-day mon tue wed thu fri
[Sysname-schedule-START-pc1/pc2] quit
# Configure a periodic schedule for disabling the interfaces at 18:00 every Monday through Friday.
[Sysname] scheduler schedule STOP-pc1/pc2
[Sysname-schedule-STOP-pc1/pc2] job shutdown-GigabitEthernet1/0/1
[Sysname-schedule-STOP-pc1/pc2] job shutdown-GigabitEthernet1/0/2
[Sysname-schedule-STOP-pc1/pc2] time repeating at 18:00 week-day mon tue wed thu fri
[Sysname-schedule-STOP-pc1/pc2] quit
Verifying the scheduling
# Display the configuration information of all jobs.
[Sysname] display scheduler job
Job name: shutdown-GigabitEthernet1/0/1
system-view
interface GigabitEthernet 1/0/1
shutdown
Job name: shutdown-GigabitEthernet1/0/2
system-view
interface GigabitEthernet 1/0/2
shutdown
Job name: start-GigabitEthernet1/0/1
system-view
interface GigabitEthernet 1/0/1
undo shutdown
Job name: start-GigabitEthernet1/0/2
system-view
interface GigabitEthernet 1/0/2
undo shutdown
# Display the schedule information.
[Sysname] display scheduler schedule
Schedule name : START-pc1/pc2
Schedule type : Run on every Mon Tue Wed Thu Fri at 08:00:00
Start time : Wed Sep 28 08:00:00 2011
Last execution time : Wed Sep 28 08:00:00 2011
Last completion time : Wed Sep 28 08:00:03 2011
Execution counts : 1
-----------------------------------------------------------------------
Job name Last execution status
start-GigabitEthernet1/0/1 Successful
start-GigabitEthernet1/0/2 Successful
Schedule name : STOP-pc1/pc2
Schedule type : Run on every Mon Tue Wed Thu Fri at 18:00:00
Start time : Wed Sep 28 18:00:00 2011
Last execution time : Wed Sep 28 18:00:00 2011
Last completion time : Wed Sep 28 18:00:01 2011
Execution counts : 1
-----------------------------------------------------------------------
Job name Last execution status
shutdown-GigabitEthernet1/0/1 Successful
shutdown-GigabitEthernet1/0/2 Successful
# Display schedule log information.
[Sysname] display scheduler logfile
Job name : start-GigabitEthernet1/0/1
Schedule name : START-pc1/pc2
Execution time : Wed Sep 28 08:00:00 2011
Completion time : Wed Sep 28 08:00:02 2011
--------------------------------- Job output -----------------------------------
<Sysname>system-view
System View: return to User View with Ctrl+Z.
[Sysname]interface GigabitEthernet 1/0/1
[Sysname-GigabitEthernet1/0/1]undo shutdown
Job name : start-GigabitEthernet1/0/2
Schedule name : START-pc1/pc2
Execution time : Wed Sep 28 08:00:00 2011
Completion time : Wed Sep 28 08:00:02 2011
--------------------------------- Job output -----------------------------------
<Sysname>system-view
System View: return to User View with Ctrl+Z.
[Sysname]interface GigabitEthernet 1/0/2.
[Sysname-GigabitEthernet1/0/2]undo shutdown
Job name : shutdown-GigabitEthernet1/0/1
Schedule name : STOP-pc1/pc2
Execution time : Wed Sep 28 18:00:00 2011
Completion time : Wed Sep 28 18:00:01 2011
--------------------------------- Job output -----------------------------------
<Sysname>system-view
System View: return to User View with Ctrl+Z.
[Sysname]interface GigabitEthernet 1/0/1
[Sysname-GigabitEthernet1/0/1]shutdown
Job name : shutdown-GigabitEthernet1/0/2
Schedule name : STOP-pc1/pc2
Execution time : Wed Sep 28 18:00:00 2011
Completion time : Wed Sep 28 18:00:01 2011
--------------------------------- Job output -----------------------------------
<Sysname>system-view
System View: return to User View with Ctrl+Z.
[Sysname]interface GigabitEthernet 1/0/2
[Sysname-GigabitEthernet1/0/2]shutdown
Disabling password recovery capability
This feature is supported only on the default MDC.
To access the device configuration without authentication, you must connect to the active MPU and access the BootWare menu while the MPU is starting up.
Password recovery capability controls console user access to the device configuration and SDRAM from BootWare menus. This feature also decides the method for handling console login password loss (see Figure 2).
If password recovery capability is enabled, a console user can access the device configuration without authentication to configure new passwords.
If password recovery capability is disabled, console users must restore the factory-default configuration before they can configure new passwords. Restoring the factory-default configuration deletes the next-startup configuration files.
To enhance system security, disable password recovery capability.
Figure 2 Handling console login password loss
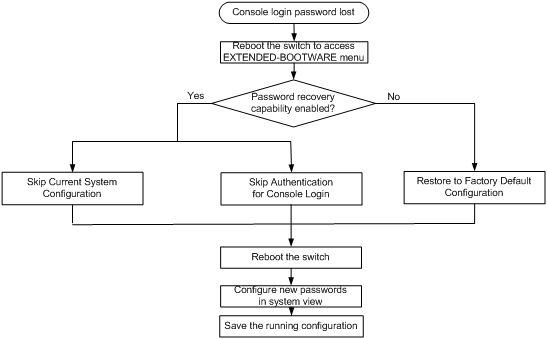
Table 1 summarizes options whose availability depends on the password recovery capability setting.
Table 1 BootWare options and password recovery capability compatibility matrix
|
BootWare menu option |
Password recovery enabled |
Password recovery disabled |
Tasks that can be performed |
|
Download Image Program To SDRAM And Run |
Yes |
No |
Load and run Comware software images in SDRAM. |
|
Download Files(*.*) |
Yes |
No |
Download a file to the current storage medium. |
|
Skip Authentication for Console Login |
Yes |
No |
Enable console login without authentication. This is a one-time operation and takes effect only for the first system boot or reboot after you choose this option. |
|
Skip Current System Configuration |
Yes |
No |
Skip the configuration file at the next startup. This is a one-time operation. It takes effect only for the first system boot or reboot after you choose this option. This option does not delete the configuration file. |
|
Restore to Factory Default Configuration |
No |
Yes |
Delete the next-startup configuration file and load the factory-default configuration. |
To disable password recovery capability:
|
Step |
Command |
Remarks |
|
1. Enter system view. |
system-view |
N/A |
|
2. Disable password recovery capability. |
undo password-recovery enable |
By default, password recovery capability is enabled. |
When password recovery capability is disabled, you cannot downgrade the software configuration of the device to a version that does not support the capability through the BootWare menus. You can do so at the CLI, but the configured BootWare menu password becomes effective again.
Setting the port status detection timer
To set the port status detection timer:
|
Step |
Command |
Remarks |
|
1. Enter system view. |
system-view |
N/A |
|
2. Set the port status detection timer. |
shutdown-interval time |
The default setting is 30 seconds. |
Monitoring CPU usage
To monitor CPU usage, the device performs the following operations:
· Samples CPU usage at 1-minute intervals, and compares the samples with CPU usage thresholds to identify the CPU usage status and send alarms or notifications accordingly.
· Samples CPU core usage at 1-minute intervals, and compares the samples with CPU core usage thresholds to identify the CPU core usage status. If a sample is greater than the threshold, the device sends a log message.
· Samples and saves CPU usage at a configurable interval if CPU usage tracking is enabled. You can use the display cpu-usage history command to display the historical CPU usage statistics in a coordinate system.
The device supports the following CPU usage thresholds:
· Minor threshold—When the CPU usage increases to or above the minor threshold but is less than the severe threshold, the CPU usage enters minor alarm state. The device sends minor alarms periodically until the CPU usage increases above the severe threshold or the minor alarm is removed.
· Severe threshold—When the CPU usage increases above the severe threshold, the CPU usage enters severe alarm state. The device sends severe alarms periodically until the severe alarm is removed.
· Recovery threshold—When the CPU usage decreases below the recovery threshold, the CPU usage enters recovered state. The device sends a recovery notification.
CPU usage alarms and notifications can be sent to NETCONF, SNMP, and the information center to be encapsulated as NETCONF events, SNMP traps and informs, and log messages. For more information, see NETCONF, SNMP, and information center in Network Management and Monitoring Configuration Guide.
To monitor CPU usage in standalone mode:
|
Step |
Command |
Remarks |
|
1. Enter system view. |
system-view |
N/A |
|
2. Set the CPU usage thresholds. |
monitor cpu-usage threshold severe-threshold minor-threshold minor-threshold recovery-threshold recovery-threshold [ slot slot-number [ cpu cpu-number ] ] |
The defaults are as follows: · Severe alarm threshold—99%. · Minor alarm threshold—80%. · Recovery threshold—60%. |
|
3. Enable CPU usage tracking. |
monitor cpu-usage enable [ slot slot-number [ cpu cpu-number ] ] |
By default, CPU usage tracking is enabled. |
|
4. Set the sampling interval for CPU usage tracking. |
monitor cpu-usage interval interval-value [ slot slot-number [ cpu cpu-number ] ] |
By default, the sampling interval for CPU usage tracking is 1 minute. |
|
5. Set CPU usage alarm resending intervals. |
monitor resend cpu-usage { minor-interval minor-interval | severe-interval severe-interval } * [ slot slot-number [ cpu cpu-number ] ] |
By default, the minor alarm resending interval is 300 seconds and the severe alarm resending interval is 60 seconds. |
|
6. Exit to user view. |
quit |
N/A |
|
7. Display CPU usage statistics. |
display cpu-usage [ summary ] [ slot slot-number [ cpu cpu-number [ core { core-number | all } ] ] ] |
This command is available in any view. |
|
8. Display CPU usage monitoring settings. |
display cpu-usage configuration [ slot slot-number [ cpu cpu-number ] ] |
This command is available in any view. |
|
9. Display the historical CPU usage statistics in a coordinate system. |
display cpu-usage history [ job job-id ] [ slot slot-number [ cpu cpu-number ] ] |
This command is available in any view. |
To monitor CPU usage in IRF mode:
|
Command |
Remarks |
|
|
1. Enter system view. |
N/A |
|
|
2. Set the CPU usage thresholds. |
monitor cpu-usage threshold severe-threshold minor-threshold minor-threshold recovery-threshold recovery-threshold [ chassis chassis-number slot slot-number [ cpu cpu-number ] ] |
The defaults are as follows: · Severe alarm threshold—99%. · Minor alarm threshold—80%. · Recovery threshold—60%. |
|
3. Enable CPU usage tracking. |
monitor cpu-usage enable [ chassis chassis-number slot slot-number [ cpu cpu-number ] ] |
By default, CPU usage tracking is enabled. |
|
4. Set the sampling interval for CPU usage tracking. |
By default, the sampling interval for CPU usage tracking is 1 minute. |
|
|
5. Set CPU usage alarm resending intervals. |
monitor resend cpu-usage { minor-interval minor-interval | severe-interval severe-interval } * [ chassis chassis-number slot slot-number [ cpu cpu-number ] ] |
By default, the minor alarm resending interval is 300 seconds and the severe alarm resending interval is 60 seconds. |
|
6. Exit to user view. |
N/A |
|
|
7. Display CPU usage statistics. |
display cpu-usage [ summary ] [ chassis chassis-number slot slot-number [ cpu cpu-number [ core { core-number | all } ] ] ] |
This command is available in any view. |
|
8. Display CPU usage monitoring settings. |
display cpu-usage configuration [ chassis chassis-number slot slot-number [ cpu cpu-number ] ] |
This command is available in any view. |
|
9. Display the historical CPU usage statistics in a coordinate system. |
This command is available in any view. |
Setting memory alarm thresholds
About memory alarm thresholds
To monitor memory usage, the device performs the following operations:
· Samples memory usage at 1-minute intervals, and compares the sample with the memory usage threshold. If the sample is greater, the device sends a trap.
· Monitors the amount of free memory space in real time. If a free-memory threshold is exceeded, the system generates an alarm notification or an alarm-removed notification and sends it to affected service modules or processes.
On devices that support low memory, the system monitors only the amount of free low-memory space. On devices with slots that support low memory, the system monitors only the amount of free low-memory space for slots that support low memory. You can use the display memory command to display memory usage information. If the LowMem field is displayed for a slot, the slot supports low memory.
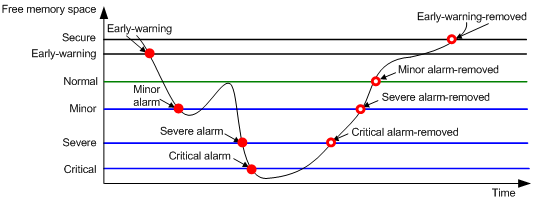
As shown in Table 2 and Figure 3, the system supports the following free-memory thresholds:
· Sufficient-memory threshold.
· Early-warning threshold.
· Normal state threshold.
· Minor alarm threshold.
· Severe alarm threshold.
· Critical alarm threshold.
Table 2 Memory alarm notifications and memory alarm-removed notifications
|
Notification |
Triggering condition |
Remarks |
|
Early-warning notification |
The amount of free memory space decreases below the early-warning threshold. |
After generating and sending an early-warning notification, the system does not generate and send any additional early-warning notifications until the early warning is removed. |
|
Minor alarm notification |
The amount of free memory space decreases below the minor alarm threshold. |
After generating and sending a minor alarm notification, the system does not generate and send any additional minor alarm notifications until the minor alarm is removed. |
|
Severe alarm notification |
The amount of free memory space decreases below the severe alarm threshold. |
After generating and sending a severe alarm notification, the system does not generate and send any additional severe alarm notifications until the severe alarm is removed. |
|
Critical alarm notification |
The amount of free memory space decreases below the critical alarm threshold. |
After generating and sending a critical alarm notification, the system does not generate and send any additional critical alarm notifications until the critical alarm is removed. |
|
Critical alarm-removed notification |
The amount of free memory space increases above the severe alarm threshold. |
N/A |
|
Severe alarm-removed notification |
The amount of free memory space increases above the minor alarm threshold. |
N/A |
|
Minor alarm-removed notification |
The amount of free memory space increases above the normal state threshold. |
N/A |
|
Early-warning-removed notification |
The amount of free memory space increases above the sufficient-memory threshold. |
N/A |
Figure 3 Memory alarm notifications and alarm-removed notifications
Configuration restrictions and guidelines
This feature is supported only on the default MDC.
If a memory alarm occurs, delete unused configuration items or disable some features to increase the free memory space. Because the memory space is insufficient, some configuration items might not be able to be deleted.
Configuration procedure
To set memory alarm thresholds:
|
Step |
Command |
Remarks |
|
1. Enter system view. |
system-view |
N/A |
|
2. Set the memory usage threshold. |
·
In standalone
mode: ·
In IRF mode: |
The default memory usage threshold is 100%. |
|
3. Set the free-memory thresholds. |
·
In standalone mode: ·
In IRF mode: |
The defaults are as follows: · Minor alarm threshold—10% of the memory space on the slot. · Severe alarm threshold—7% of the memory space on the slot. · Critical alarm threshold—4% of the memory space on the slot. · Normal state threshold—13% of the memory space on the slot. · Early-warning threshold—16% of the memory space on the slot. · Sufficient-memory threshold—18% of the memory space on the slot. |
|
4. Set memory depletion alarm resending intervals. |
·
In standalone
mode: ·
In IRF mode: |
The following are the default settings: · Early warning resending interval—1 hour. · Minor alarm resending interval—12 hours. · Severe alarm resending interval—3 hours. · Critical alarm resending interval—1 hour. |
Configuring resource monitoring
About resource monitoring
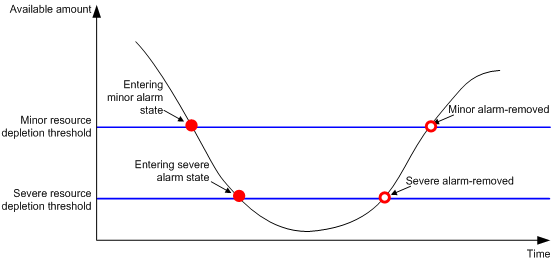
The resource monitoring feature enables the device to monitor the available amounts of types of resources, for example, the space for ARP entries. The device samples the available amounts at intervals and compares the samples with resource depletion thresholds to identify the resource depletion status.
The device supports a minor resource depletion threshold and a severe resource depletion threshold for each supported resource type.
· If the available amount is equal to or less than the minor resource depletion threshold but greater than the severe resource depletion threshold, the resource type is in minor alarm state.
· If the available amount is equal to or less than the severe resource depletion threshold, the resource type is in severe alarm state.
· If the available amount increases above the minor resource depletion threshold, the resource type is in recovered state.
When a resource type enters severe alarm state, the device issues a severe alarm. If the resource type stays in severe alarm state, the device resends severe alarms periodically.
When a resource type enters minor alarm state, the device issues a minor alarm. If the resource type stays in minor alarm state or changes from severe alarm state to minor alarm state, the device identifies whether resending of minor resource depletion alarms is enabled. If the feature is disabled, the device does not issue additional minor alarms. If the feature is enabled, the device resends minor alarms periodically.
Resource depletion alarms can be sent to NETCONF, SNMP, and the information center to be encapsulated as NETCONF events, SNMP traps and informs, and log messages. For more information, see NETCONF, SNMP, and information center in Network Management and Monitoring Configuration Guide.
Figure 4 Resource depletion alarms and alarm-removed notifications
Configuration restrictions and guidelines
Follow these restrictions and guidelines when you configure this feature:
· This feature is not supported when uRPF is configured on the device. For more information about uRPF, see Security Configuration Guide.
· This feature is not supported when the arp mode uni command is configured on the device. For more information, see ARP in Layer 3–IP Services Configuration Guide.
· This feature is not supported when the ipv6 nd mode uni command is configured on the device. For more information about the ipv6 nd mode uni command, see IPv6 basics configuration in Layer 3–IP Services Configuration Guide.
· This feature is not supported on the following interface modules:
¡ LSQ1QGS4SC0.
¡ EC, SA, and SF interface modules.
· This feature is not supported on the following interface modules when the service module operating mode is bridging or enhance-bridge: FD interface modules, FE interface modules, and SG interface modules except for LSUM1QGS12SG0 and LSUM1TGS48SG0 except for LSQM1QGS12SG0 and LSQM1TGS48SG0.
Configuration procedure
To configure resource monitoring:
|
Step |
Command |
Remarks |
|
1. Enter system view. |
system-view |
N/A |
|
2. Set resource depletion thresholds. |
·
In standalone
mode: ·
In IRF mode: |
The default settings vary by device model. Use the display resource-monitor command to display the default resource depletion thresholds. |
|
3. Specify destinations for resource depletion alarms |
resource-monitor output { netconf-event | snmp-notification | syslog } * |
By default, resource depletion alarms are sent to NETCONF, SNMP, and the information center. |
|
4. Enable resending of minor resource depletion alarms. |
resource-monitor minor resend enable |
By default, resending of minor resource depletion alarms is enabled. |
Configuring the temperature alarm thresholds
The device monitors its temperature based on the following thresholds:
· Low-temperature threshold.
· High-temperature warning threshold.
· High-temperature alarming threshold.
When the temperature drops below the low-temperature threshold or reaches the high-temperature warning threshold, the device sends a log message and trap, and sets the LEDs on the device panel.
When the temperature reaches the high-temperature alarming threshold, the device repeatedly sends log messages and traps, and sets the LEDs on the device panel.
This feature is supported only on the default MDC.
To configure the temperature alarm thresholds:
Specifying load sharing modes for a card
错误!未找到引用源。错误!未找到引用源。错误!未找到引用源。错误!未找到引用源。Table 3 shows the default load sharing modes for cards. You can specify load sharing modes as required.
Table 3 Default load sharing modes for cards
|
Cards |
Default load sharing mode |
|
OAA modules except for LSUM1FWCEAB0 |
source-ip |
|
· FE interface module LSQM1CGS2XFE0 · SG interface module LSQM2CQGS12XSG0 in one of the following situations: ¡ Operates in non100G forwarding mode. ¡ Operates in 100G forwarding mode and resides in any slot except for slots 0 to 3. |
flexible |
|
· EC interface modules · FD interface modules · FE interface modules except for LSQM1CGS2XFE0 · SA interface modules · SC interface modules · SF interface modules · SG interface module LSQM2CQGS12XSG0 that operates in 100G forwarding mode and resides in slots 0 to 3 · SG interface modules except for LSQM2CQGS12XSG0 · OAA module LSUM1FWCEAB0 |
ingress-port |
To specify load sharing modes for a card:
|
Step |
Command |
Remarks |
|
1. Enter system view. |
system-view |
N/A |
|
2. Specify load sharing modes for a card. |
·
In standalone mode: ·
In IRF mode: |
If you execute the command multiple times, the most recent configuration takes effect. If you specify an unsupported load sharing mode, an error message is displayed. When IRF links use the default load sharing modes, the load sharing mode set by the fabric load-sharing mode flexible command takes precedence. For more information about IRF link load sharing modes, see Virtual Technologies Configuration Guide. |
Specifying an operating mode and a proxy mode for a service module
About operating modes for service modules
The MAC address table size and routing table size of a service module vary depending on the operating mode. Table 4 lists the feature highlights and application scenarios of operating modes.
Table 5 shows the service module and operating mode compatibility.
Table 4 Service module operating modes
|
Operating mode |
Feature highlights |
Recommended application scenario |
|
normal |
Uses the default MAC address table and routing table. |
Common networks. |
|
bridging |
Increases the MAC address table size to provide higher Layer 2 packet forwarding performance. |
A large MAC address table is required. |
|
routing |
Increases the IPv4 routing table size to provide higher Layer 3 packet forwarding performance. |
A large IPv4 routing table is required. |
|
mix-bridging-routing |
Increases both the MAC address table size and routing table size. |
Both a large MAC address table and a large routing table are required. |
|
standard-ipv6 |
Optimizes resource sharing for ND and ARP entries to provide optimal forwarding performance in an IPv4/IPv6 dual-stack environment. |
The IPv4/IPv6 dual-stack is used. |
|
ipv6 |
Increases the IPv6 routing table size to provide higher Layer 3 packet forwarding performance. |
A large IPv6 routing table is required. |
|
balance |
Increases the MAC address table size, ARP table size, and routing table size to provide more balanced Layer 2 and Layer 3 packet forwarding performance than the mix-bridging-routing mode. |
Requirements for the MAC address table, ARP table, and routing table are balanced. |
|
enhance-bridge |
Increases the MAC address table size to provide higher Layer 2 packet forwarding performance. Has a smaller ARP table size than the bridging mode. |
A large MAC address table is required. This mode is typically used on a service provider network. |
Table 5 Service module and operating mode compatibility
|
bridging |
ipv6 |
mix-bridging-routing |
normal |
routing |
standard-ipv6 |
balance |
enhance-bridge |
|
EC interface modules |
|||||||
|
Yes |
Yes |
Yes |
Yes |
Yes |
No |
No |
No |
|
FD interface modules FE interface modules |
|||||||
|
Yes |
No |
Yes |
No |
Yes |
No |
Yes |
Yes |
|
SC interface modules LSQM2GP44TSSC0, LSQM2GP24TSSC0, LSQM2GT24PTSSC0, LSQM2GT24TSSC0, LSQM2GT48SC0, LSQM4GV48SC0, and LSQM3GP44TSSC0 |
|||||||
|
Yes |
No |
Yes |
No |
No |
No |
No |
No |
|
SF interface modules SC interface module LSQ1QGS4SC0 |
|||||||
|
No |
No |
No |
Yes |
No |
Yes |
No |
No |
|
SG interface modules |
|||||||
|
Yes |
No |
Yes |
No |
Yes |
No |
No |
No |
|
|
NOTE: SA interface modules do not support specifying an operating mode. They can operate only in mix-bridging-routing mode. |
About proxy modes for service modules
Proxy modes apply to scenarios where the capacity of the routing table, ARP table, or ND table of a service module cannot meet the requirement. You can configure the service module as a principal and configure a second service module that has sufficient table resources as the proxy. Then, when the principal receives a packet to be forwarded, it redirects the packet to the proxy. The proxy looks up its table for a forwarding entry. Table 6 shows the hardware and proxy mode compatibility.
Table 6 Service module and proxy mode compatibility
|
Proxy mode |
Compatibility |
|
route-proxy-high adj-proxy-high l3-proxy-high |
Supported on EC, FD, FE, and SG interface modules. |
|
route-proxy-low |
Not supported on FD, FE, and SG interface modules that are operating in balance or routing mode. |
|
adj-proxy-low |
Supported on all modules. |
Configuration restrictions and guidelines
Follow these restrictions and guidelines when you specify an operating mode and a proxy mode for a service module:
· You can specify an operating mode and a proxy mode for an installed service module. The settings take effect after you save the running configuration and reboot the service module.
· If you replace a service module after setting its operating mode and proxy mode, the operating mode and proxy mode of the new module vary by support for the settings:
|
Mode |
If the new module supports the specified mode |
If the new module does not support the specified mode |
|
Operating mode |
Uses the specified operating mode |
Uses the default operating mode |
|
Proxy mode |
Uses the specified proxy mode |
Does not operate in any proxy mode. |
Table 7 Default operating modes for service modules
|
Service modules |
Default operating mode |
|
EC interface modules FD and FE interface modules SG interface modules SC interface modules LSQM2GP44TSSC0, LSQM2GP24TSSC0, LSQM2GT24PTSSC0, LSQM2GT24TSSC0, LSQM2GT48SC0, and LSQM4GV48SC0 |
mix-bridging-routing |
|
SF interface modules SC interface module LSQ1QGS4SC0 |
normal |
To view the current modes and the mode settings, execute the display switch-mode status command.
Also follow these restrictions and guidelines when you specify a proxy mode for a service module:
· If you configure a service module as a principal or proxy, you must configure another service module on the device as the proxy or principal. If you fail to do so, the proxy function might not operate. For example, if you set the proxy mode to route-proxy-low for a service module, you must set the proxy mode to route-proxy-high or l3-proxy-high for another service module on the device.
· Do not terminate tunneled packets or MPLS packets on a service module that is operating in route-proxy-low mode. For more information about tunneling and MPLS, see tunneling configuration in Layer 3—IP Services Configuration Guide and basic MPLS configuration in MPLS Configuration Guide.
· The apply default-next-hop command in a routing policy does not take effect if the policy is applied to a service module operating in route-proxy-low mode. For more information about policy-based routing, see Layer 3—IP Routing Configuration Guide.
· Routing interfaces on a service module that is operating in route-proxy-low mode do not support forwarding VPN packets. For more information about VPN, see MPLS L3VPN in MPLS Configuration Guide.
· Routing interfaces on a service module that is operating in route-proxy-low or adj-proxy-low mode do not support ICMP redirect or ICMPv6 redirect. For more information about ICMP redirect and ICMPv6 redirect, see IP performance optimization configuration and IPv6 basics configuration in Layer 3—IP Services Configuration Guide.
· The proxy mode does not affect multicast packet forwarding. For more information about multicast, see multicast routing and forwarding configuration in IP Multicast Configuration Guide.
· The following service modules operating in route-proxy-low mode do not support forwarding Layer 3 VXLAN traffic:
¡ FD interface modules.
¡ FE interface modules.
¡ SG interface modules LSQM2CQGS12XSG0, LSQM2QGS24RXSG0, LSQM1TGS48RSG0, LSQM2QGS12XSG0, LSQM2TGS32QSXSG0, and LSQM2TGS48XSG0.
For more information about VXLAN, see VXLAN Configuration Guide.
Configuration procedure
To specify an operating mode and a proxy mode for a service module:
|
Step |
Command |
Remarks |
|
1. Enter system view. |
system-view |
N/A |
|
2. Specify an operating mode and a proxy mode for a service module. |
·
In standalone mode: ·
In IRF mode: |
By default, a service module does not operate in any proxy mode. For information about default operating modes for service modules, see Table 7. |
Specifying a forwarding mode for service module slots
About forwarding modes for service module slots
About forwarding modes for service module slots on an S7506E-X
Service module slots on an S7506E-X switch support the following forwarding modes:
· Compatible.
· Standard.
· High-speed.
In different forwarding modes, service module slots support different types of service modules and provide different amounts of bandwidth, as shown in Table 8.
Table 8 Service module forwarding modes
|
Forwarding mode |
Restrictions |
|
Compatible |
This mode is not supported on the following service modules in slot 4 or slot 5: · EC interface module LSQM1TGS12EC0. · FD interface modules LSQM1TGS16FD0, LSQM1GT48FD0, LSQM1GP48FD0, and LSQM1GP40TS8FD0. · FE interface module LSQM1TGS48RFE0. · SA interface modules. · SC interface modules. · SF interface module LSQM2TGS16SF0. · SG interface module LSQM1TGS48RSG0. · OAP modules except LSUM1FWDEC0, LSUM1NSDEC0, LSUM1ACGDEC0, LSUM1WCMX20RT, and LSUM1WCMX40RT. |
|
Standard |
This mode is not supported on the following service modules: · EC interface module LSQM1TGS12EC0. · FD interface modules LSQM1TGS16FD0, LSQM1GT48FD0, LSQM1GP48FD0, and LSQM1GP40TS8FD0. · FE interface module LSQM1TGS48RFE0. · SA interface modules. · SC interface modules. · SF interface module LSQM2TGS16SF0. · SG interface module LSQM1TGS48RSG0. · OAP modules except LSUM1FWDEC0, LSUM1NSDEC0, LSUM1ACGDEC0, LSUM1WCMX20RT, and LSUM1WCMX40RT. |
|
High-speed |
This mode is not supported on the following service modules in slot 0 or slot 1: · EC interface modules except LSQM1TGS12EC0. · FD interface modules except LSQM1TGS16FD0, LSQM1GT48FD0, LSQM1GP48FD0, and LSQM1GP40TS8FD0. · FE interface modules except LSQM1TGS48RFE0. · SF interface modules. · SG interface modules except LSQM1TGS48RSG0. · OAP modules listed below: ¡ LSUM1FWDEC0. ¡ LSUM1ACGDEC0. ¡ LSUM1NSDEC0. ¡ LSUM1WCMX20RT. ¡ LSUM1WCMX40RT. This mode is not supported on the following service modules in slot 2, slot 3, slot 4, or slot 5: · EC interface module LSQM1TGS12EC0. · FD interface modules LSQM1TGS16FD0, LSQM1GT48FD0, LSQM1GP48FD0, and LSQM1GP40TS8FD0. · FE interface module LSQM1TGS48RFE0. · SA interface modules. · SC interface modules. · SF interface module LSQM2TGS16SF0. · SG interface module LSQM1TGS48RSG0. · OAP modules except LSUM1FWDEC0, LSUM1NSDEC0, LSUM1ACGDEC0, LSUM1WCMX20RT, and LSUM1WCMX40RT. |
For more information about OAP modules, see OAA Configuration Guide.
About forwarding modes for service module slots on an S7510E-X
Service module slots on an S7510E-X switch support the following forwarding modes:
· 100G—This mode takes effect only for the LSUM2CQGS12SG0 service module. As a best practice, use this mode on the LSUM2CQGS12SG0 service module if a data flow on a 100Gbps-port of the module exceeds 40 Gbps. A data flow is identified by its source IP address and port, destination IP address and port, and the protocol.
· non100G—As a best practice, use this mode on other types of service modules.
This feature is supported only on an S7510E-X switch that uses LSQM2MPU10C0 MPUs. The maximum bandwidth on service module slots varies by forwarding mode.
Configuration procedure
Configuration procedure on an S7506E-X
To specify a forwarding mode for service module slots on an S7506E-X switch:
|
Step |
Command |
Remarks |
|
1. Enter system view. |
system-view |
N/A |
|
2. Specify a forwarding mode for service module slots. |
·
In standalone mode: ·
In IRF mode: |
By default, service module slots operate in compatible mode. A forwarding mode change takes effect after a device reboot. |
Configuration procedure on an S7510E-X
To specify a forwarding mode for service module slots on an S7510E-X:
|
Step |
Command |
Remarks |
|
1. Enter system view. |
system-view |
N/A |
|
2. Specify a forwarding mode for service module slots. |
·
In standalone mode: ·
In IRF mode: |
By default, service module slots operate in non100G mode. A forwarding mode change takes effect after a device reboot. |
Enabling the port down feature globally
The port down feature applies to scenarios where two devices (one active and one standby) are used for high availability, for example, a network deployed with VRRP. This feature shuts down all service ports on the active device immediately after both MPUs on the active device are removed or reboot abnormally. The shutdown operation ensures quick service switchover to the standby device.
To enable the port down feature globally:
|
Step |
Command |
Remarks |
|
1. Enter system view. |
system-view |
N/A |
|
2. Enable the port down feature globally. |
monitor handshake-timeout disable-port |
By default, this feature is enabled. |
Configuring an asset profile for a physical component
For management convenience, you can configure an asset profile for physical components, including chassis, cards, fan trays, and power modules.
For power modules, you can configure only asset IDs.
To configure an asset profile for a physical component:
|
Step |
Command |
|
1. Enter system view. |
system-view |
|
2. Configure an asset profile for a physical component. |
·
In standalone mode: ·
In IRF mode: |
Isolating a switching fabric module
Isolating a switching fabric module isolate the module from the data plane. An isolated switching fabric module continues to communicate with the MPU, and can forward traffic immediately after the isolation is canceled. The isolation does not affect protocol packet parsing and protocol calculation on the control plane.
You can isolate switching fabric modules to identify whether switching fabric modules can forward traffic correctly.
Before replacing a switching fabric module, you can isolate the module to prevent packet loss.
Isolation restrictions and guidelines
|
|
CAUTION: · Isolating the only switching fabric module of the switch disables the forwarding feature. · Do not reboot the device while a switching fabric module is being isolated. |
If the switch has multiple switching fabric modules, isolating a switching fabric module decreases the forwarding bandwidth and reduces the forwarding performance.
If you do not want to use a switching fabric module, remove the module after you isolate the module.
To use an isolated switching fabric module:
1. Use the undo switch-fabric isolate command to cancel the isolation.
2. Reboot the switching fabric module.
Isolation procedure
To isolate a switching fabric module:
|
Step |
Command |
Remarks |
|
1. Enter system view. |
system-view |
N/A |
|
2. Isolate a switching fabric module. |
·
In standalone mode: ·
In IRF mode: |
By default, a switching fabric module is not isolated from the forwarding plane and forwards traffic. |
Suppressing switching fabric module removal interrupt signals
About suppressing removal interrupt signals from switching fabric modules
Typically, removing a switching fabric module triggers one removal interrupt signal. Upon receiving the signal, the system switches traffic on the switching fabric module to other switching fabric modules to ensure service continuity. Upon hardware failure or signal interference, however, removal interrupt signals might be frequently triggered. To prevent the interrupt signals from affecting system operation, use this feature to suppress the interrupt signals.
Restrictions and guidelines
Suppressing removal interrupt signals from switching fabric modules might result in packet loss and service outage.
Procedure
To suppress switching fabric module removal interrupt signals:
|
Step |
Command |
Remarks |
|
1. Enter system view. |
system-view |
N/A |
|
2. Suppress switching fabric module removal interrupt signals. |
switch-fabric removal-signal-suppression |
By default, removal interrupt signals from switching fabric modules are not suppressed. |
Configuring hardware failure detection and protection
The device can automatically detect hardware failures on components, cards, and the forwarding plane, and take actions in response.
To view hardware failure detection and protection information, use the display hardware-failure-detection command.
Specifying the actions to be taken for hardware failures
This feature is supported only on the default MDC.
The device can take the following actions in response to hardware failures:
· isolate—Performs the following tasks as appropriate to reduce impact from the failures:
¡ Shuts down the relevant ports.
¡ Prohibits loading software for the relevant cards.
¡ Isolates the relevant cards.
¡ Powers off the relevant cards.
· reset—Restarts the relevant components or cards to recover from failures.
· warning—Sends traps to report the failures.
For a card that is isolated or forbidden to load software, you can remove it and then reinstall it to restore it to operating state.
To specify the actions to be taken in response to hardware failures:
|
Step |
Command |
Remarks |
|
1. Enter system view. |
system-view |
N/A |
|
2. Specify the action to be taken in response to a type of hardware failures. |
hardware-failure-detection { board | chip | forwarding } { off | isolate | reset | warning } |
By default, the system takes the action of warning in response to hardware failures. |
Enabling hardware failure protection for interfaces
|
|
IMPORTANT: Before enabling hardware failure protection on an interface, make sure a backup link is available for service continuity. |
This feature is supported only on the default MDC.
After you enable hardware failure protection on an interface, the system automatically shuts down the interface when it detects a hardware failure on the interface. An interface shut down this way is in Protect Down state. After the failure on an interface is removed, bring the interface up by using the undo shutdown command.
This feature does not take effect on an interface in the following situations:
· Loopback testing is enabled (using the loopback { external | internal } command).
· The interface is forcibly brought up (using the port up-mode command).
· The interface is a physical IRF port.
To enable hardware failure protection for an interface:
|
Step |
Command |
Remarks |
|
1. Enter system view. |
system-view |
N/A |
|
2. Set the action to be taken in response to failures on the forwarding plane to isolate. |
hardware-failure-detection forwarding isolate |
By default, the system takes the action of warning (sending traps) in response to forwarding-plane failures. |
|
3. Enter Ethernet interface view. |
interface interface-type interface-number |
N/A |
|
4. Enable hardware failure protection for the interface. |
hardware-failure-protection auto-down |
By default, hardware failure protection is enabled. |
Enabling hardware failure protection for aggregation groups
This feature is supported only on the default MDC.
Hardware failure protection for aggregation groups uses the following rules upon detecting a hardware failure on an aggregation group member interface:
· Does not shut down the interface if the member interface is the only member in up state in the group.
· Shuts down the interface if the member interface is not the only member in up state in the group.
This feature does not take effect on an interface in the following situations:
· Loopback testing is enabled (by using the loopback { external | internal } command).
· The interface is forcibly brought up (by using the port up-mode command).
· The interface is a physical IRF port. For more information about physical IRF ports, see Virtual Technologies Configuration Guide.
To enable hardware failure protection for aggregation groups:
|
Step |
Command |
Remarks |
|
1. Enter system view. |
system-view |
N/A |
|
2. Set the action to be taken in response to failures on the forwarding plane to isolate. |
hardware-failure-detection forwarding isolate |
By default, the system takes the action of warning (sending traps) in response to forwarding-plane failures. |
|
3. Enter Ethernet interface view. |
interface interface-type interface-number |
N/A |
|
4. Disable hardware failure protection for the interface. |
undo hardware-failure-protection auto-down |
By default, hardware failure protection is enabled. Configure this command on every member interface in the aggregation group. |
|
5. Exit to system view. |
Quit |
N/A |
|
6. Enable hardware failure protection for aggregation groups. |
hardware-failure-protection aggregation |
By default, hardware failure protection is disabled for aggregation groups. |
Enabling data forwarding path failure detection
This feature is supported only on the default MDC.
You can enable the device to automatically detect data forwarding path failures and output log information for notification.
To enable data forwarding path failure detection:
|
Step |
Command |
Remarks |
|
1. Enter system view. |
system-view |
N/A |
|
2. Enable data forwarding path failure detection. |
forward-path-detection enable |
By default, data forwarding path failure detection is enabled. This command is supported only on the default MDC. |
Managing power supply
Power supplies might have problems such as overload overcurrent, overvoltage, overtemperature, and short circuit. Some power supplies use a hardware protection measure, for example, powering off the device, to protect the entire device from being damaged. The hardware protection measure helps protect the device but causes service outage. The power supply management feature can minimize service outage while protecting the device against overload problems.
The power supply management feature constantly monitors the available power and the system loads. If a potential power supply overload problem is found, this feature takes protective measures immediately to remove requirements for power supply hardware protection. Examples of protective measures include sending a notification, starting redundant power supplies, and powering off certain interface modules.
You can perform the following tasks for the power supply management feature:
· Specifying the number of redundant power supplies
· Setting power supply priorities for service modules
You can also manually power on or off cards.
Enabling power supply management
|
Step |
Command |
Remarks |
|
1. Enter system view. |
system-view |
N/A |
|
2. Enable power supply management. |
·
In standalone mode: ·
In IRF mode: |
By default, power supply management is disabled. |
Specifying the number of redundant power supplies
About specifying the number of redundant power supplies
To avoid overload problems, you can install redundant power supplies. For example, if the device requires a minimum of N power supplies to operate correctly, you can install M power supplies (M > N). The M power supplies operate in load balance mode. When a power supply fails, the load is rebalanced among the other power supplies.
After you specify the number of redundant power supplies, the device compares the power of a newly added service module or switching fabric module with the remaining power.
· If the remaining power of the N power supplies is sufficient for the module, the device powers on the module.
· If the remaining power N power supplies is insufficient, the device restores the default number of redundant power supplies and powers on the module.
Configuration restrictions and guidelines
This feature takes effect only if power supply management is enabled.
Configuration procedure
To specify the number of redundant power supplies:
|
Step |
Command |
Remarks |
|
1. Enter system view. |
system-view |
N/A |
|
2. Specify the number of redundant power supplies. |
·
In standalone mode: ·
In IRF mode: |
By default, the number of redundant power supplies is 0. |
Setting power supply priorities for service modules
After you set power supply priorities for service modules, the power supply management feature automatically powers on the service modules of the highest priorities when power becomes sufficient. If two service modules have the same priority, the service module that has a smaller slot number has a higher priority.
Configuration restrictions and guidelines
This feature takes effect only if power supply management is enabled.
Specify higher power supply priorities for critical-service cards so they are preferentially powered.
The system automatically guarantees an interface module that holds IRF physical interfaces a higher priority.
· After you bind interfaces on an interface module to IRF ports, the system automatically guarantees the interface module a higher priority. You cannot use this command to change the power supply priority for the card anymore.
· If you specify a power supply priority for an interface module and then bind its interfaces to IRF ports, the priority setting is retained but does not take effect.
Configuration procedure
To specify a power supply priority for a service module:
|
Step |
Command |
Remarks |
|
1. Enter system view. |
system-view |
N/A |
|
2. Specify a power supply priority for a service module. |
·
In standalone mode: ·
In IRF mode: |
By default, the power supply priority is 5 for a service module. A smaller priority value represents a higher priority. |
Powering on/off a card
About powering on/off a card
You can manually power on or off cards. To view the power supply status, use the display power verbose command.
Configuration restrictions and guidelines
To power on or off a card, you must enable power supply management first.
Do not power off an interface module that contains IRF physical interfaces. (In IRF mode.)
Configuration procedure
To power on or off a card, execute one of the following commands in user view as appropriate:
|
Task |
Command |
|
Power on a card. |
·
In standalone mode: ·
In IRF mode: |
|
Power off a card. |
·
In standalone mode: ·
In IRF mode: |
Verifying and diagnosing transceiver modules
Verifying transceiver modules
You can use one of the following methods to verify the genuineness of a transceiver module:
· Display the key parameters of a transceiver module, including its transceiver type, connector type, central wavelength of the transmit laser, transfer distance, and vendor name.
· Display its electronic label. The electronic label is a profile of the transceiver module and contains the permanent configuration, including the serial number, manufacturing date, and vendor name. The data is written to the storage component during debugging or testing.
Install only transceiver modules that are from H3C. If you install a transceiver module that is not from H3C, the device will generate a log message to ask you to replace the module. For more information about log messages, see information center configuration in Network Management and Monitoring Configuration Guide.
To verify transceiver modules, execute the following commands in any view:
|
Task |
Command |
Remarks |
|
Display the key parameters of transceiver modules. |
display transceiver interface [ interface-type interface-number ] |
N/A |
|
Display the electrical label information of transceiver modules. |
display transceiver manuinfo interface [ interface-type interface-number ] |
This command cannot display information for some transceiver modules. |
Diagnosing transceiver modules
The device provides the alarm and digital diagnosis features for transceiver modules. When a transceiver module fails or is not operating correctly, you can perform the following tasks:
· Check the alarms that exist on the transceiver module to identify the fault source.
· Examine the key parameters monitored by the digital diagnosis feature, including the temperature, voltage, laser bias current, TX power, and RX power.
To diagnose transceiver modules, execute the following commands in any view:
|
Task |
Command |
Remarks |
|
Display transceiver alarms. |
display transceiver alarm interface [ interface-type interface-number ] |
N/A |
|
Display the current values of the digital diagnosis parameters on transceiver modules. |
display transceiver diagnosis interface [ interface-type interface-number ] |
This command cannot display information about some transceiver modules. |
Locating devices
This feature is supported only in IRF mode. You can use this feature to locate PEXs.
The device provides LEDs for device locating. The locator blink blink-time command flashes the LEDs quickly for a specified period of time unless you execute the locator blink stop command. You can observe the LEDs to locate PEXs.
Execute the following commands in user view:
|
Task |
Command |
|
Flash LEDs to locate devices. |
locator [ chassis { chassis-number | virtual-chassis-number [ slot slot-number ] } ] blink blink-time |
|
Stop LED flashing. |
locator [ chassis { chassis-number | virtual-chassis-number [ slot slot-number ] } ] blink stop |
Manually triggering an active/standby switchover
If the device has two MPUs, one MPU is in active state and the other one is in standby state. Typically, the device uses the MPU that has a smaller slot number as the active MPU.
The standby MPU automatically synchronizes the running configuration of the active MPU. If the active MPU fails or is removed, the standby MPU immediately takes over to ensure device operation continuity. You can also manually trigger an active/standby switchover.
As a best practice, save the running configuration before triggering an active/standby switchover. The current active MPU will reboot if you trigger an active/standby switchover.
To manually trigger an active/standby switchover:
|
Step |
Command |
Remarks |
|
1. Enter system view. |
system-view |
N/A |
|
2. Manually trigger an active/standby switchover. |
system switchover |
This command is supported only on the default MDC. This command is available only in standalone mode. |
Restoring the factory-default configuration
|
|
CAUTION: This task is disruptive. Use this task only when you cannot troubleshoot the device by using other methods, or you want to use the device in a different scenario. |
This feature is supported only on the default MDC.
To restore the factory-default configuration for the device, execute the following command in user view:
|
Command |
Remarks |
|
|
Restore the factory-default configuration for the device. |
This command takes effect after a device reboot. |
Displaying and maintaining device management configuration
Execute display commands in any view. Execute the reset scheduler logfile command in user view. Execute the reset version-update-record command in system view.
Standalone mode
|
Task |
Command |
|
Display device alarm information. |
display alarm [ slot slot-number ] |
|
Display asset information. |
display asset-info { chassis | fan fan-id | power power-id | slot slot-number } [ csn | custom| department | description | location | service-date | state ] |
|
Display the system time, date, local time zone, and daylight saving time. |
display clock |
|
Display the copyright statement. |
display copyright |
|
Display CPU usage statistics. |
display cpu-usage [ summary ] [ slot slot-number [ cpu cpu-number [ core { core-number | all } ] ] ] |
|
Display CPU usage monitoring settings. |
display cpu-usage configuration [ slot slot-number [ cpu cpu-number ] ] |
|
Display historical CPU usage statistics in a chart. |
display cpu-usage history [ job job-id ] [ slot slot-number [ cpu cpu-number ] ] |
|
Display hardware information. |
display device [ flash ] [ slot slot-number | verbose ] |
|
Display the electronic label information of the device. |
display device manuinfo [ slot slot-number ] |
|
Display the electronic label information of the specified chassis backplane. |
display device manuinfo chassis-only |
|
Display the electronic label information of a fan tray. |
display device manuinfo fan fan-id |
|
Display the electronic label information of a power module. |
display device manuinfo power power-id |
|
Display device uptime. |
display device uptime |
|
Display or save device diagnostic information. |
display diagnostic-information [ hardware | infrastructure | l2 | l3 | service ] [ key-info ] [ filename ] |
|
Display device temperature statistics. |
display environment [ slot slot-number ] |
|
Display the operating states of fans. |
display fan [ fan-id ] |
|
Display hardware failure detection and fix information. |
display hardware-failure-detection |
|
Display hardware failure protection information. |
display hardware-failure-protection [ aggregation | port { auto-down | interface-type interface-number } ] |
|
Display memory usage statistics. |
display memory [ summary ] [ slot slot-number [ cpu cpu-number ] ] |
|
Display memory alarm thresholds and statistics. |
display memory-threshold [ slot slot-number [ cpu cpu-number ] ] |
|
Display power supply management information. |
display power-supply [ verbose ] |
|
Display resource monitoring information. |
display resource-monitor [ resource resource-name ] [ slot slot-number [ cpu cpu-number ] ] |
|
Display job configuration information. |
display scheduler job [ job-name ] |
|
Display job execution log information. |
display scheduler logfile |
|
Display the automatic reboot schedule. |
display scheduler reboot |
|
Display schedule information. |
display scheduler schedule [ schedule-name ] |
|
Display operating mode and proxy mode information about all service modules on the device. |
display switch-mode status |
|
Display system heath status information. |
display system health |
|
Display historical system heath status change information. |
display system health history |
|
Display system stability and status information. |
display system stable state [ mdc { id | all } ] |
|
Display the current system working mode. |
display system-working-mode |
|
Display system version information. |
display version |
|
Display the startup software image upgrade history records of the active MPU. |
display version-update-record |
|
Clear asset information. |
reset asset-info { chassis | fan fan-id | power power-id | slot slot-number } [ csn | custom | department | description | location | service-date | state ] |
|
Clear the startup software image upgrade history records of the active MPU. |
reset version-update-record |
|
Clear job execution log information. |
reset scheduler logfile |
IRF mode
|
Task |
Command |
|
Display device alarm information. |
display alarm [ chassis chassis-number slot slot-number ] |
|
Display asset information. |
display asset-info chassis chassis-number { chassis | fan fan-id | power power-id | slot slot-number } [ csn | custom| department | description | location | service-date | state ] |
|
Display the system time, date, local time zone, and daylight saving time. |
display clock |
|
Display the copyright statement. |
display copyright |
|
Display CPU usage statistics. |
display cpu-usage [ summary ] [ chassis chassis-number slot slot-number [ cpu cpu-number [ core { core-number | all } ] ] ] |
|
Display CPU usage monitoring settings. |
display cpu-usage configuration [ chassis chassis-number slot slot-number [ cpu cpu-number ] ] |
|
Display historical CPU usage statistics in a chart. |
display cpu-usage history [ job job-id ] [ chassis chassis-number slot slot-number [ cpu cpu-number ] ] |
|
Display hardware information. |
display device [ flash ] [ chassis chassis-number [ slot slot-number ] | verbose ] |
|
Display electronic label information for the device. |
display device manuinfo [ chassis chassis-number [ slot slot-number ] ] |
|
Display electronic label information for the specified chassis backplane. |
display device manuinfo chassis chassis-number chassis-only |
|
Display electronic label information for a fan tray. |
display device manuinfo chassis { chassis-number | virtual-chassis-number slot slot-number } fan fan-id |
|
Display electronic label information for a power module. |
display device manuinfo chassis { chassis-number | virtual-chassis-number slot slot-number } power power-id |
|
Display device uptime. |
display device uptime |
|
Display or save device diagnostic information. |
display diagnostic-information [ hardware | infrastructure | l2 | l3 | service ] [ key-info ] [ filename ] |
|
Display device temperature statistics. |
display environment [ chassis chassis-number [ slot slot-number ] ] |
|
Display the operating states of fans. |
display fan [ chassis chassis-number [ fan-id ] ] |
|
Display hardware failure detection and fix information. |
display hardware-failure-detection |
|
Display hardware failure protection information. |
display hardware-failure-protection [ aggregation | port { auto-down | interface-type interface-number } ] |
|
Display memory usage statistics. |
display memory [ summary ] [ chassis chassis-number slot slot-number [ cpu cpu-number ] ] |
|
Display memory alarm thresholds and statistics. |
display memory-threshold [ chassis chassis-number slot slot-number [ cpu cpu-number ] ] |
|
Display power supply management information. |
display power-supply [ chassis chassis-number ] [ verbose ] |
|
Display resource monitoring information. |
display resource-monitor [ resource resource-name ] [ chassis chassis-number slot slot-number [ cpu cpu-number ] ] |
|
Display job configuration information. |
display scheduler job [ job-name ] |
|
Display job execution log information. |
display scheduler logfile |
|
Display the automatic reboot schedule. |
display scheduler reboot |
|
Display schedule information. |
display scheduler schedule [ schedule-name ] |
|
Display operating mode and proxy mode information about all service modules on an IRF member device. |
display switch-mode status chassis chassis-number |
|
Display system heath status information. |
display system health [ chassis chassis-number ] |
|
Display historical system heath status change information. |
display system health history [ chassis chassis-number ] |
|
Display system stability and status information. |
display system stable state [ mdc { id | all } ] |
|
Display the current system working mode. |
display system-working-mode |
|
Display system version information. |
display version |
|
Display the startup software image upgrade history records of the global active MPU. |
display version-update-record |
|
Clear asset information. |
reset asset-info chassis chassis-number { chassis | fan fan-id | power power-id | slot slot-number } [ csn | custom | department | description | location | service-date | state ] |
|
Clear the startup software image upgrade history records of the global active MPU. |
reset version-update-record |
|
Clear job execution log information. |
reset scheduler logfile |
|
|
NOTE: · The display device command displays device information about the physical device, whether you execute the command on the default MDC or on a non-default MDC. · Executing one of the following commands on an MDC displays CPU or memory information for the MDC: ¡ display cpu-usage ¡ display cpu-usage configuration ¡ display memory · Executing the display cpu-usage history command on an MDC displays the historical CPU usage statistics for the MDC. To display the historical CPU usage statistics for a process on a PEX in an IRF 3.1 system, log in to the PEX, specify the process ID for the command, and execute the command. To display the historical CPU usage statistics for a PEX, use one of the following methods: ¡ Log in to the PEX and execute the command without specifying a process ID. ¡ (MDC-capable devices.) Log in to the MDC to which the PEX belongs and execute the command without specifying a process ID. ¡ (MDC-incapable devices.) Execute the command on the parent without specifying a process ID. · The following commands are supported only on the default MDC: ¡ display alarm ¡ display device manuinfo ¡ display device manuinfo chassis-only ¡ display device manuinfo fan ¡ display device manuinfo power ¡ display environment ¡ display fan ¡ display hardware-failure-detection ¡ display memory-threshold ¡ display power-supply ¡ display system-working-mode ¡ display version-update-record ¡ reset scheduler logfile ¡ reset version-update-record |