| Title | Size | Downloads |
|---|---|---|
| 04-Unified Platform Alarm Aggregation Configuration Examples-book.pdf | 2.36 MB |
- Table of Contents
- Related Documents
-
| Title | Size | Download |
|---|---|---|
| book | 2.36 MB |
|
|
|
Unified Platform |
|
Alarm Aggregation Configuration Examples |
|
|
|
|
Document version: 5W105-20230608
Product version: PLAT 2.0 (E0706)
Copyright © 2023 New H3C Technologies Co., Ltd. All rights reserved.
No part of this manual may be reproduced or transmitted in any form or by any means without prior written consent of New H3C Technologies Co., Ltd.
Except for the trademarks of New H3C Technologies Co., Ltd., any trademarks that may be mentioned in this document are the property of their respective owners.
The information in this document is subject to change without notice.
Introduction
Unified Platform (PLAT 2.0) supports alarm aggregation to minimize the number of displayed and forwarded alarms. You can configure aggregation rules for the system to automatically display alarms of interest and implement alarm correlation analysis. This document describes how to configure alarm aggregation in PLAT 2.0.
Table 1 describes the product version history and feature changes for support of alarm aggregation.
Table 1 Product version history and feature changes for support of alarm aggregation
|
Product version |
Remarks |
|
iMC PLAT 2.0 (C0703) |
First release. |
|
iMC PLAT 2.0 (E0704) |
Added the time window modification REST interface. |
|
iMC PLAT 2.0 (E0704P01) |
Added the match type of No for an aggregation condition. If this match type is selected, alarms not matching the aggregation condition will be aggregated. |
|
iMC PLAT 2.0 (C0705) |
Added permission support. |
|
iMC PLAT 2.0 (E0706) |
None. |
Usage guidelines
Application scenario
You can configure alarm aggregation in the scenario where alarm compression is needed when a large number of alarms are received. Alarms can be aggregated as follows:
· Aggregating alarms from the same source but with different contents to achieve alarm aggregation by source.
· Aggregating alarms from different sources with different contents to achieve service alarm compression or carry out preliminary root cause analysis for service alarms (requiring manual data analysis).
· Aggregating alarms from different sources with the same content to achieve compression for the same type of alarms or to carry out simple correlated root cause analysis.
· Purely compressing alarms to display alarm data within a specific time period.
Prerequisites
The monitored network devices have been incorporated into PLAT 2.0 and PLAT 2.0 can receive alarms sent from the devices.
Example: Configuring alarm aggregation
Network configuration
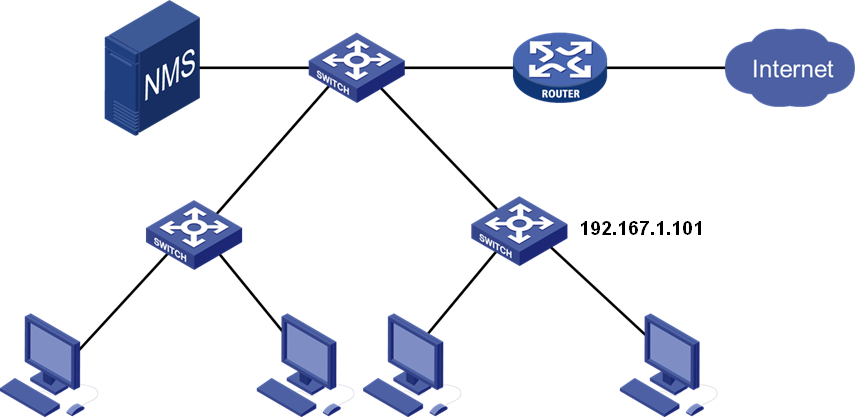
A company uses PLAT 2.0 to manage its network, and part of the company's network topology is as shown in Figure 1. Alarm aggregation is needed on this network.
Figure 1 Part of the internal network topology
Procedure
Configuring an alarm aggregation rule
1. Log in to PLAT 2.0.
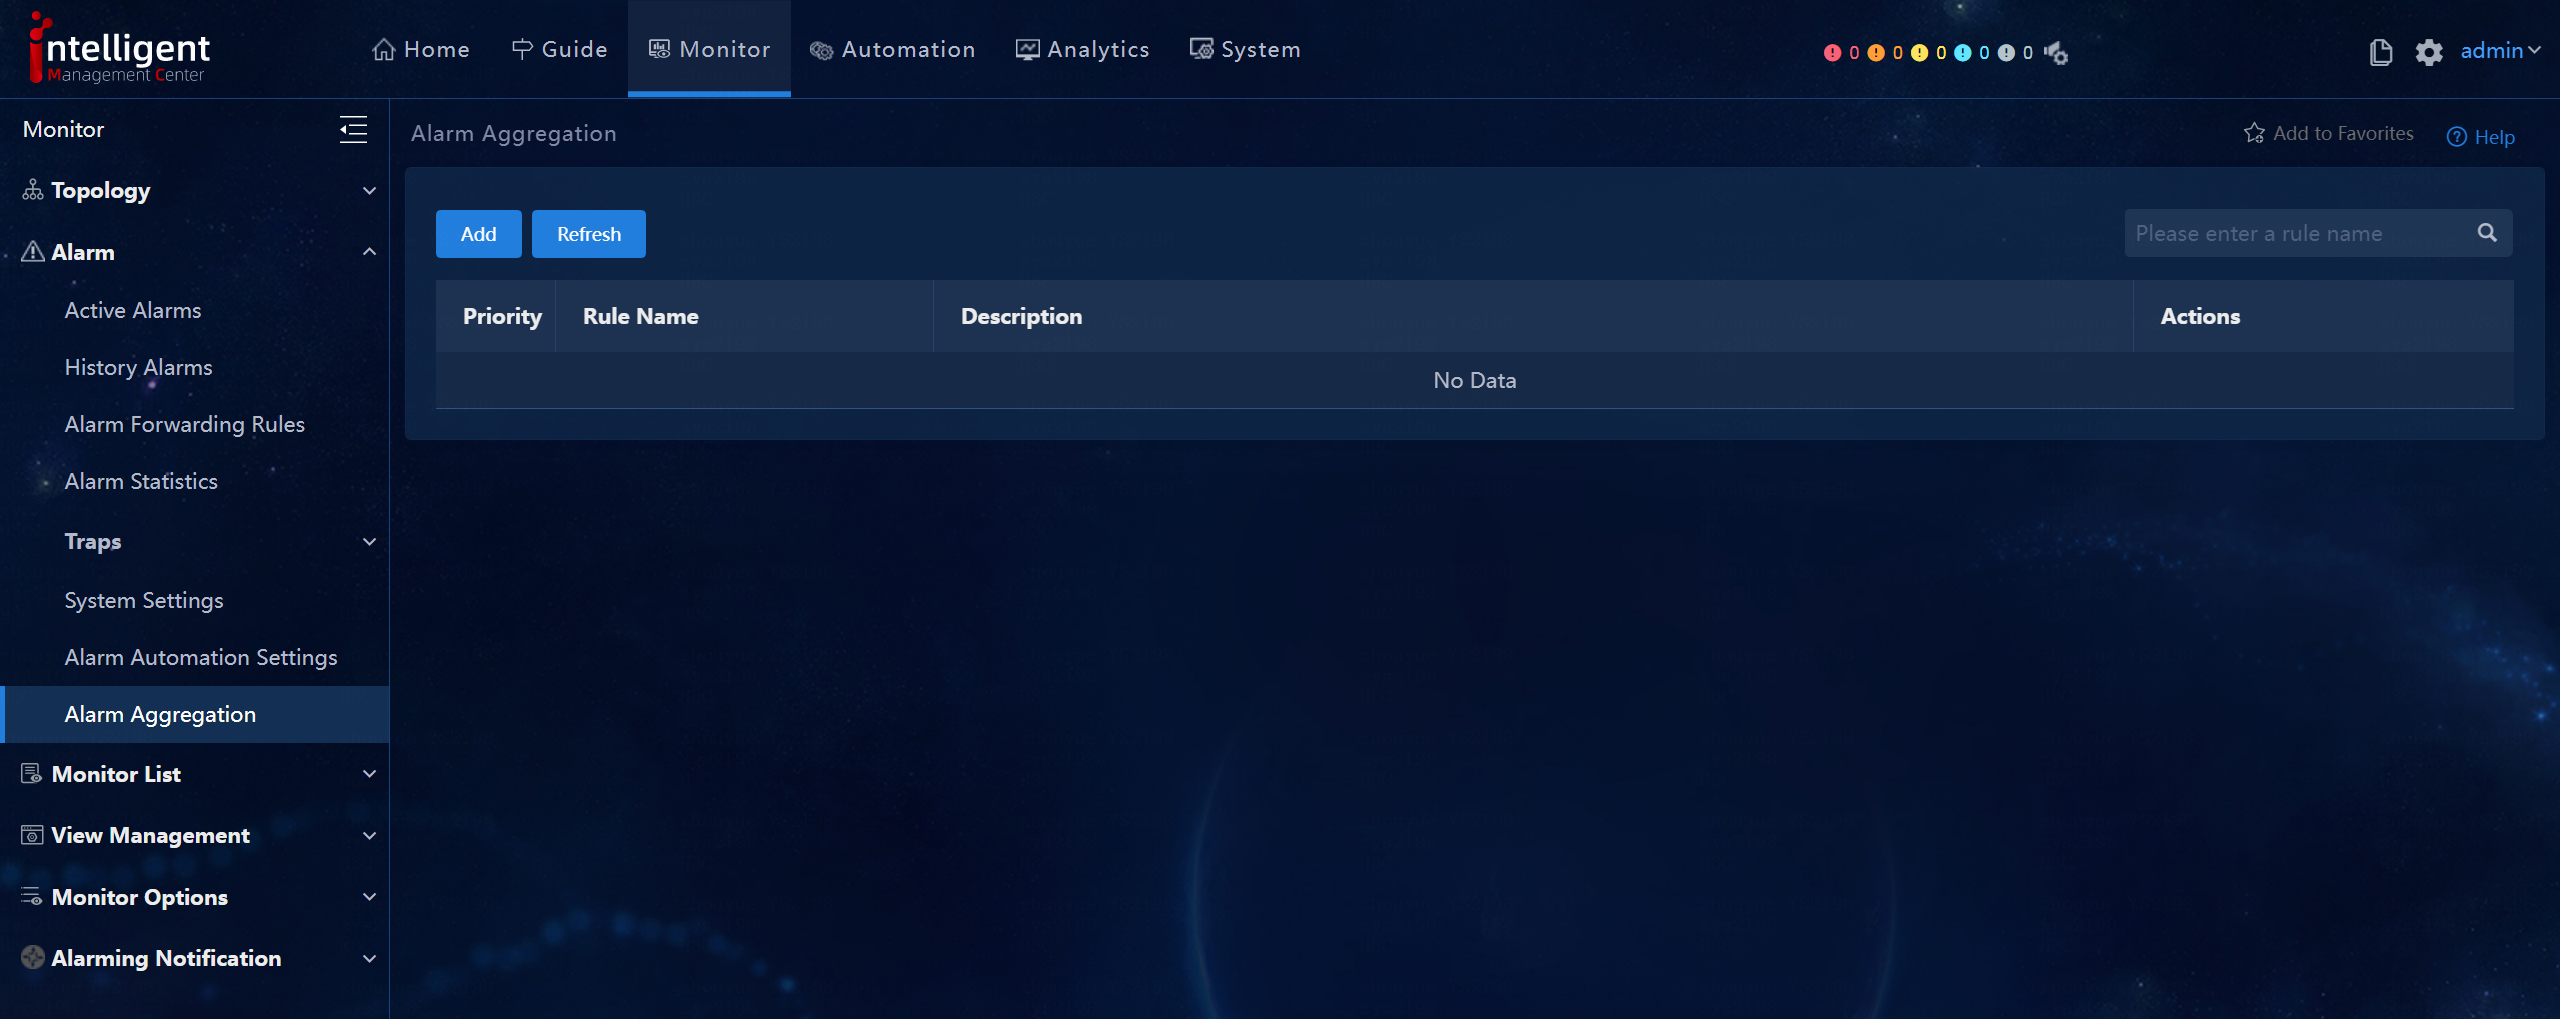
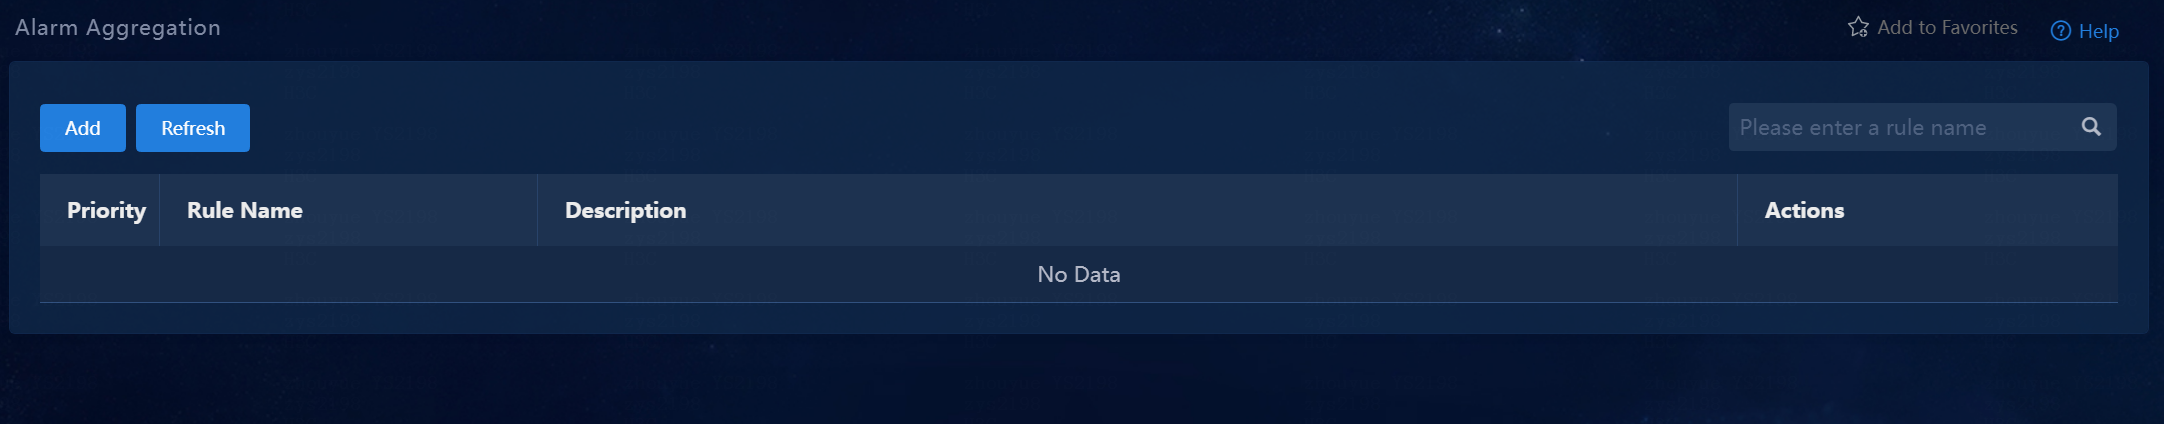
2. Navigate to the Monitor > Alarm > Alarm Aggregation page. All alarm aggregation rules existing in the system are displayed in the aggregate alarm list.
Figure 2 Alarm aggregation rule configuration page
3. Click Add. The Add Aggregation Rule page opens.
Figure 3 Adding an alarm aggregation rule
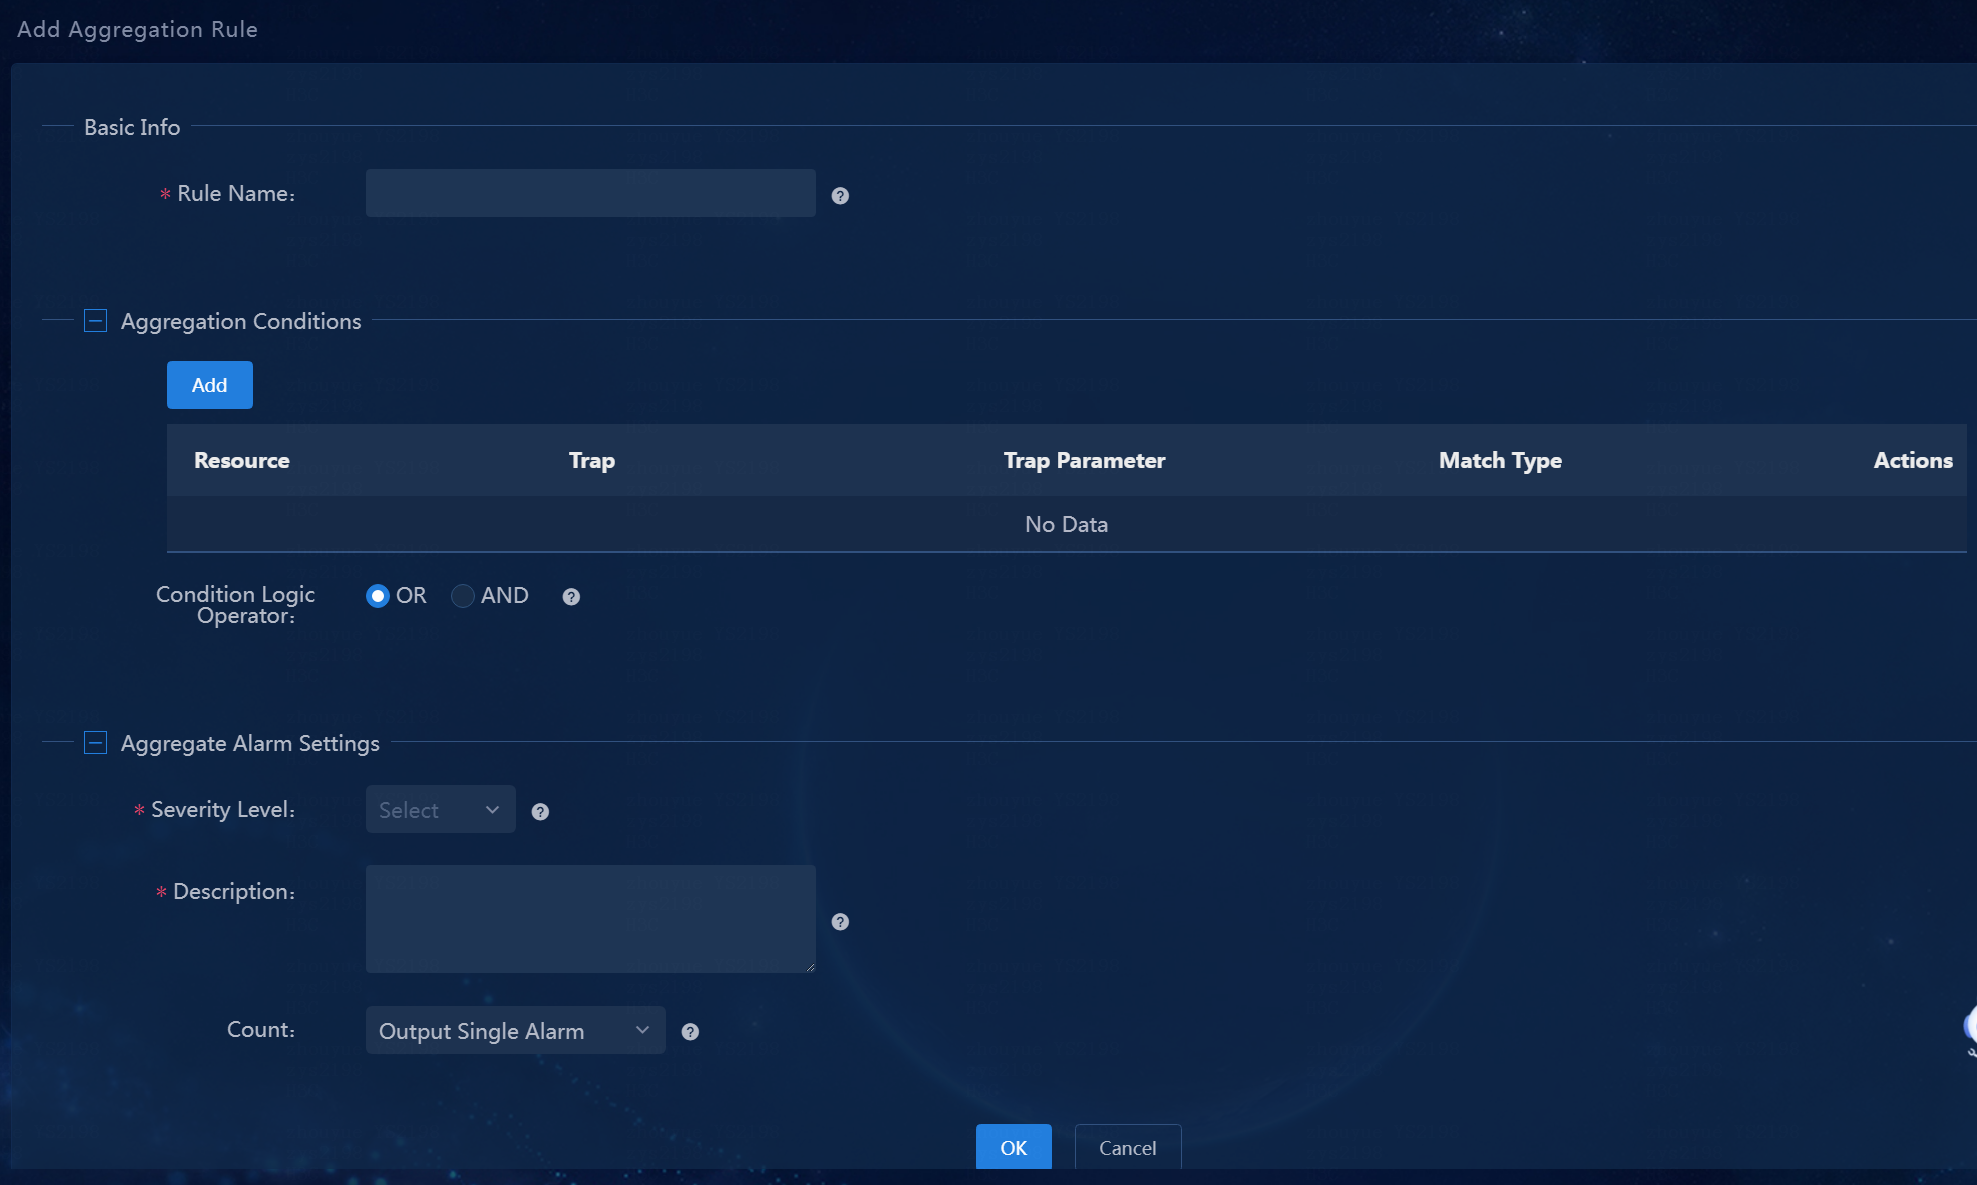
4. Enter the aggregation rule name, which is a string of a maximum of 32 characters.
5. Click Add in the Aggregation Conditions area. In the window that opens, configure the alarm aggregation conditions. Only alarms that meet the aggregation conditions can be aggregated.
Figure 4 Adding aggregation conditions
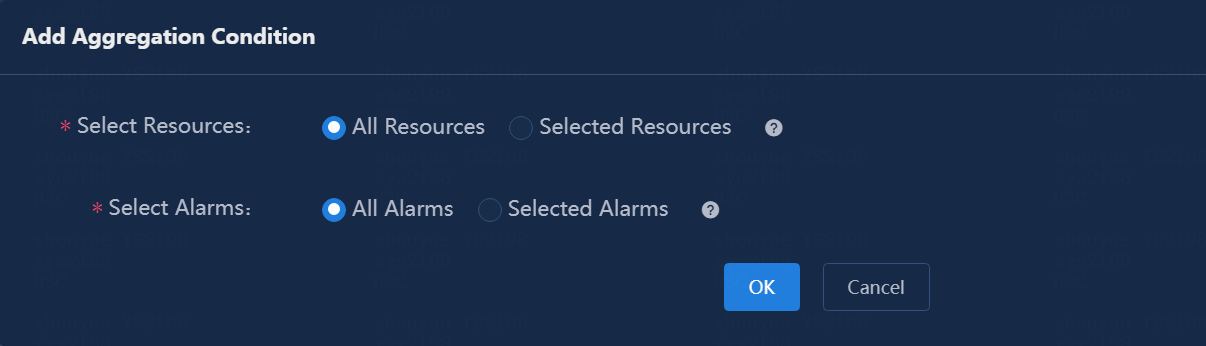
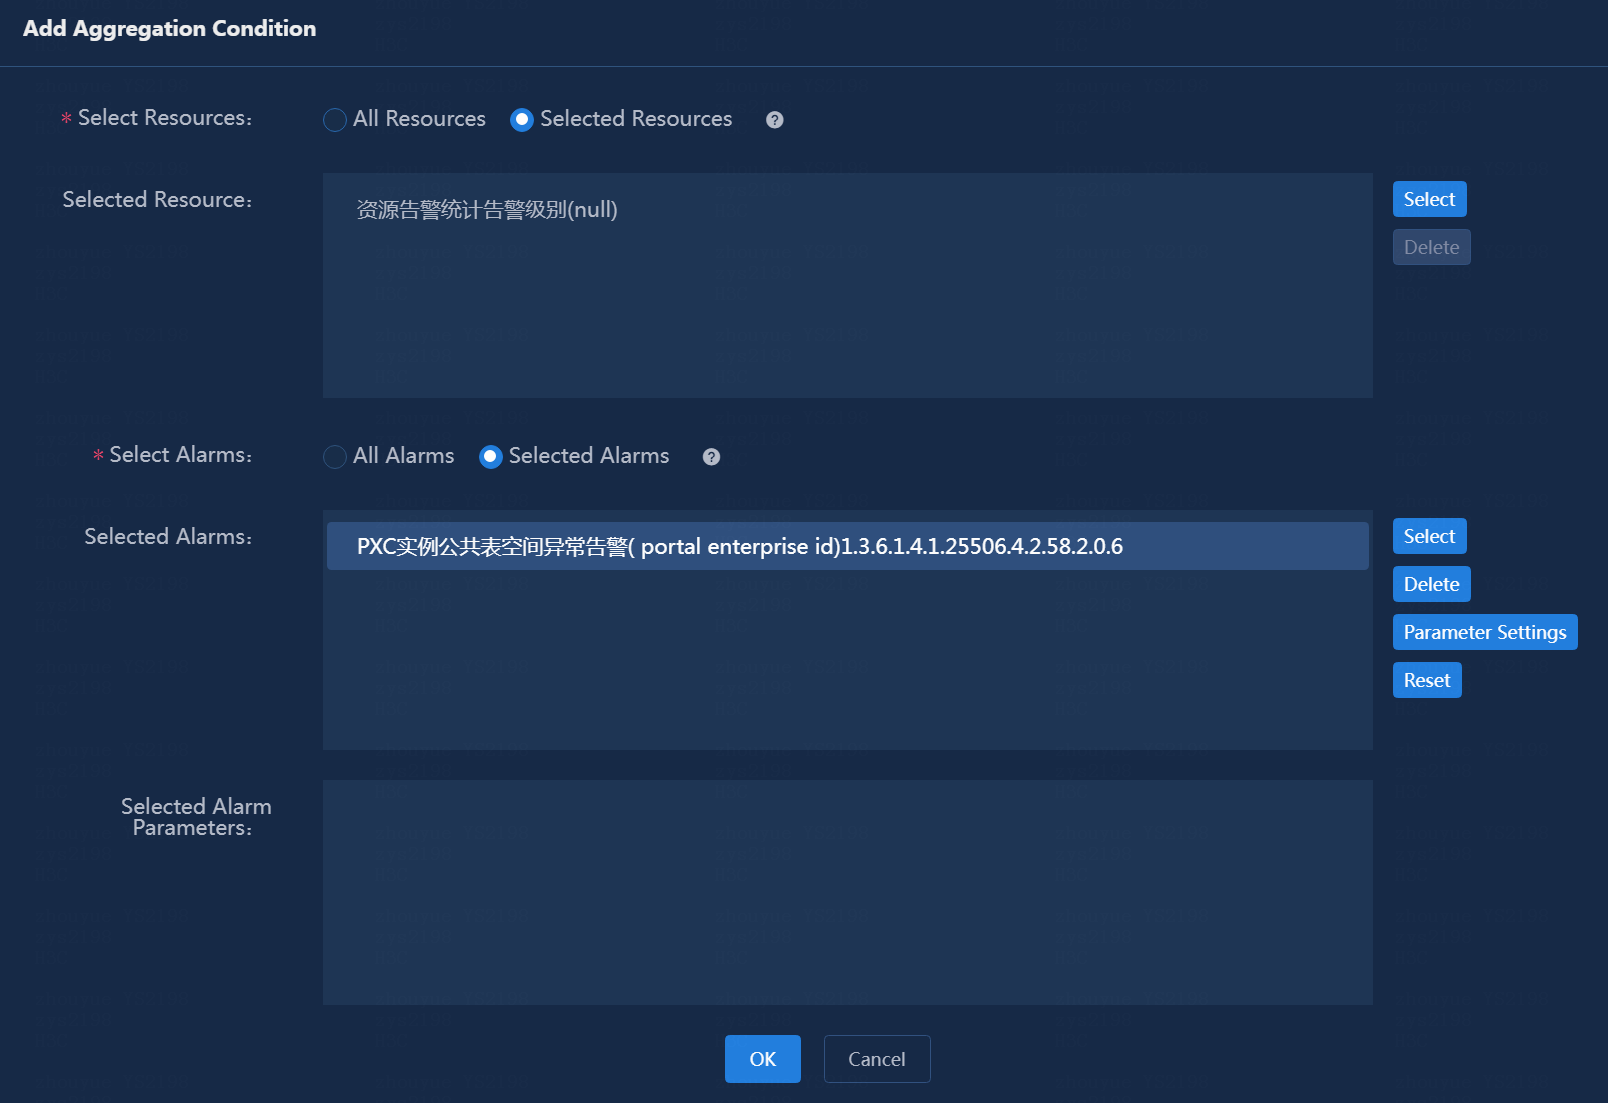
6. Select the resources alarms for which will be aggregated.
¡ All Resources: If you select this option, alarms for all resources will be aggregated.
¡ Selected Resources: If you select this option, alarms for specified resources will be aggregated.
In this example, All Resources are selected to aggregate alarms for all resources.
7. Select alarms to be aggregated.
¡ All alarms: If you select this option, all alarms will be aggregated.
¡ Selected alarms: If you select this option, selected alarms will be aggregated.
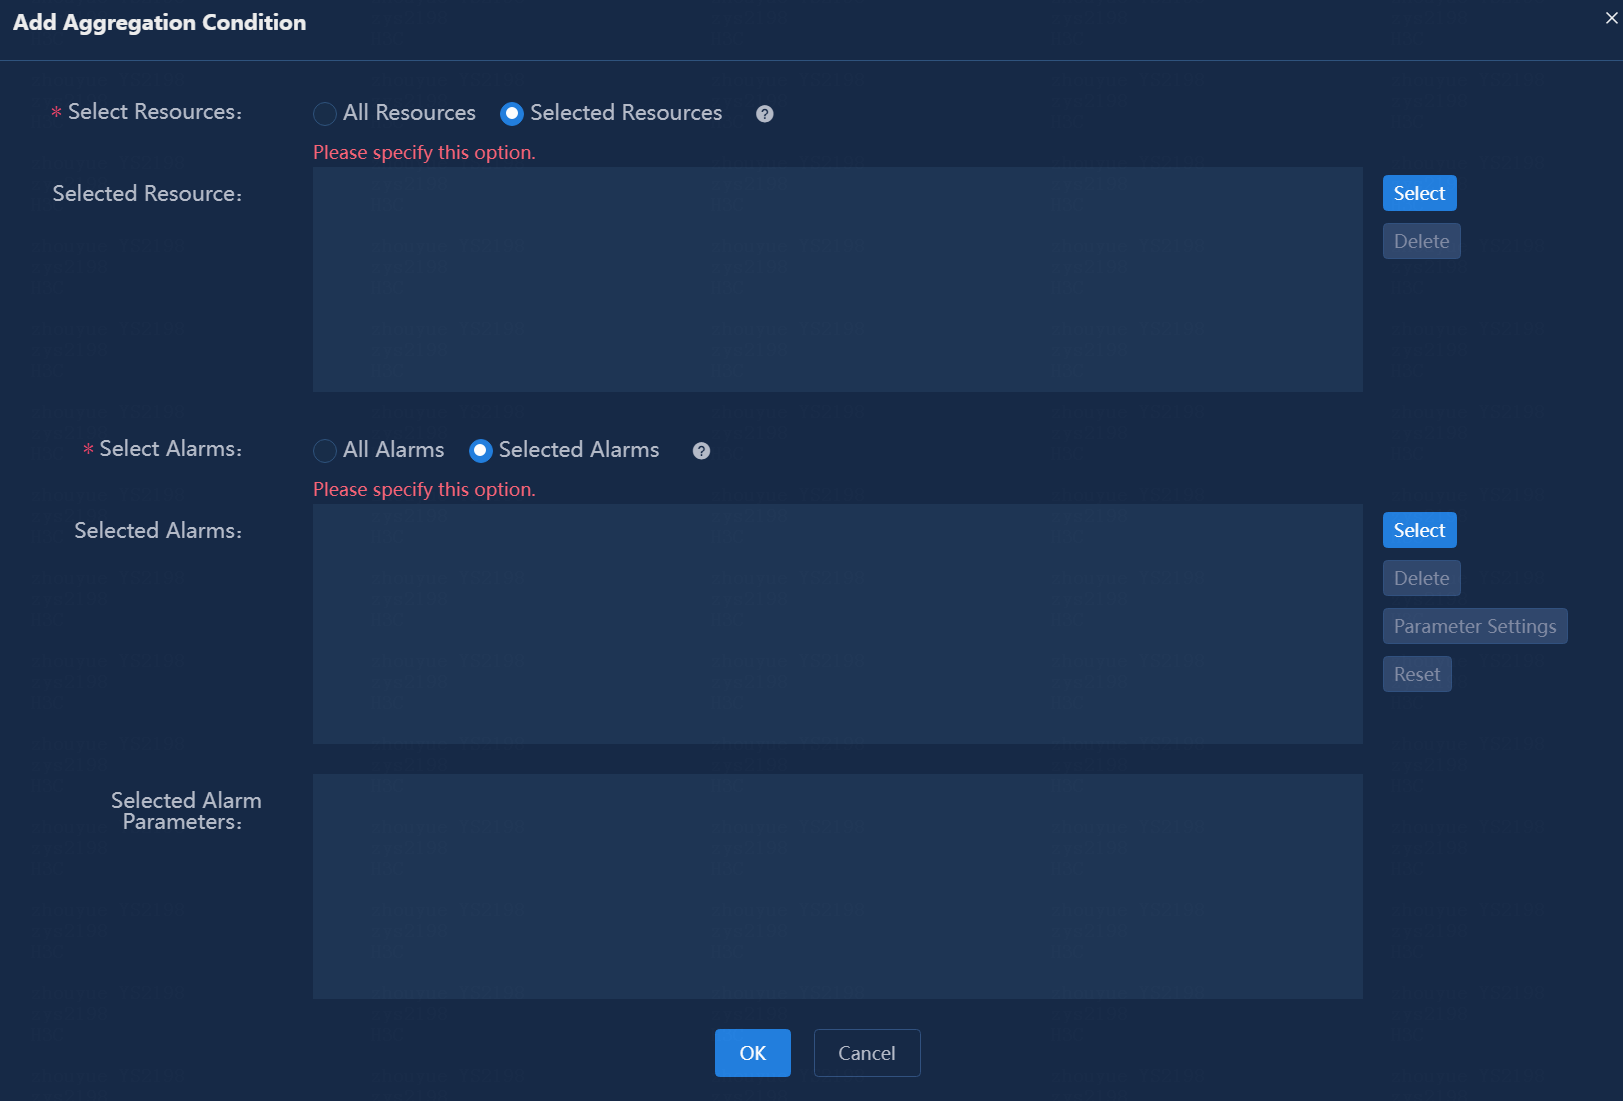
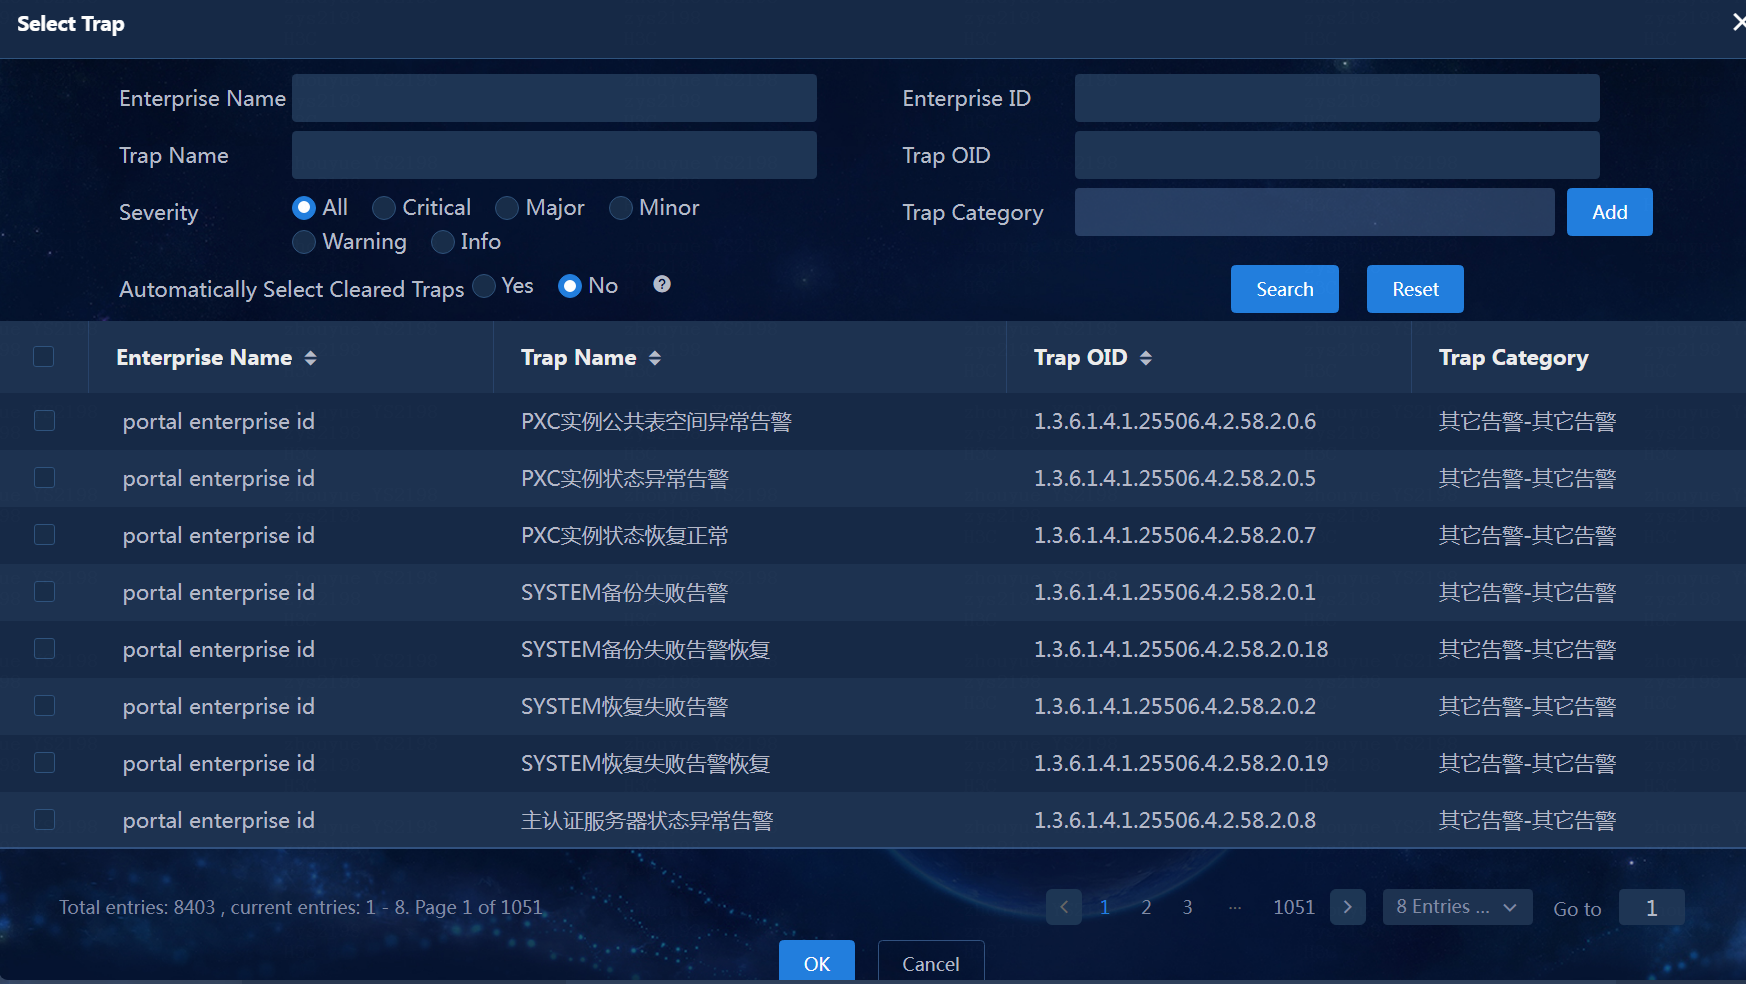
If you select Selected Alarms, follow these steps to select alarms to be aggregated:
a. Click Select in the extended area. The Select Trap page opens.
b. Enter the trap name in the Trap Name field and then click Search.
c. Select the desired alarm and then click OK.
Figure 5 Selecting traps
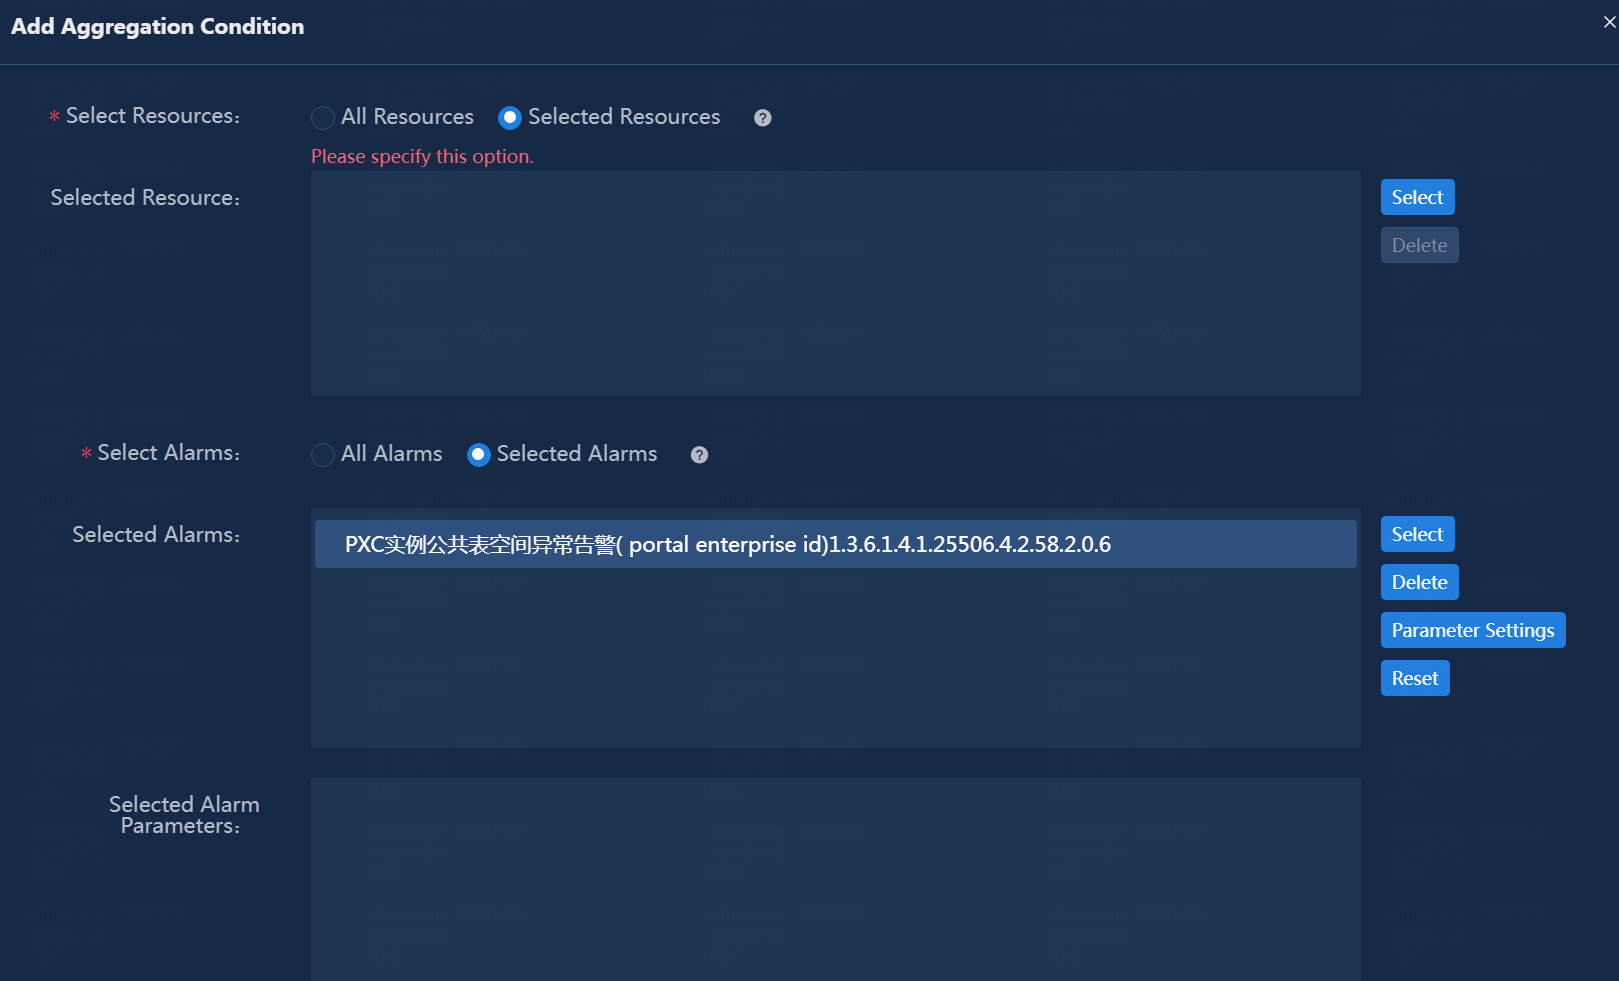
d. On the Add Aggregation Condition page, select the selected alarm and then click Parameter Settings. The parameter configuration page is in key-value format, where the value is an exact match. When configuring the parameters, you need to know the parameter values of the alarm.
e. Enter a task name. Then, alarm information with this task name in the selected alarm will be aggregated
Figure 6 Configuring trap parameters
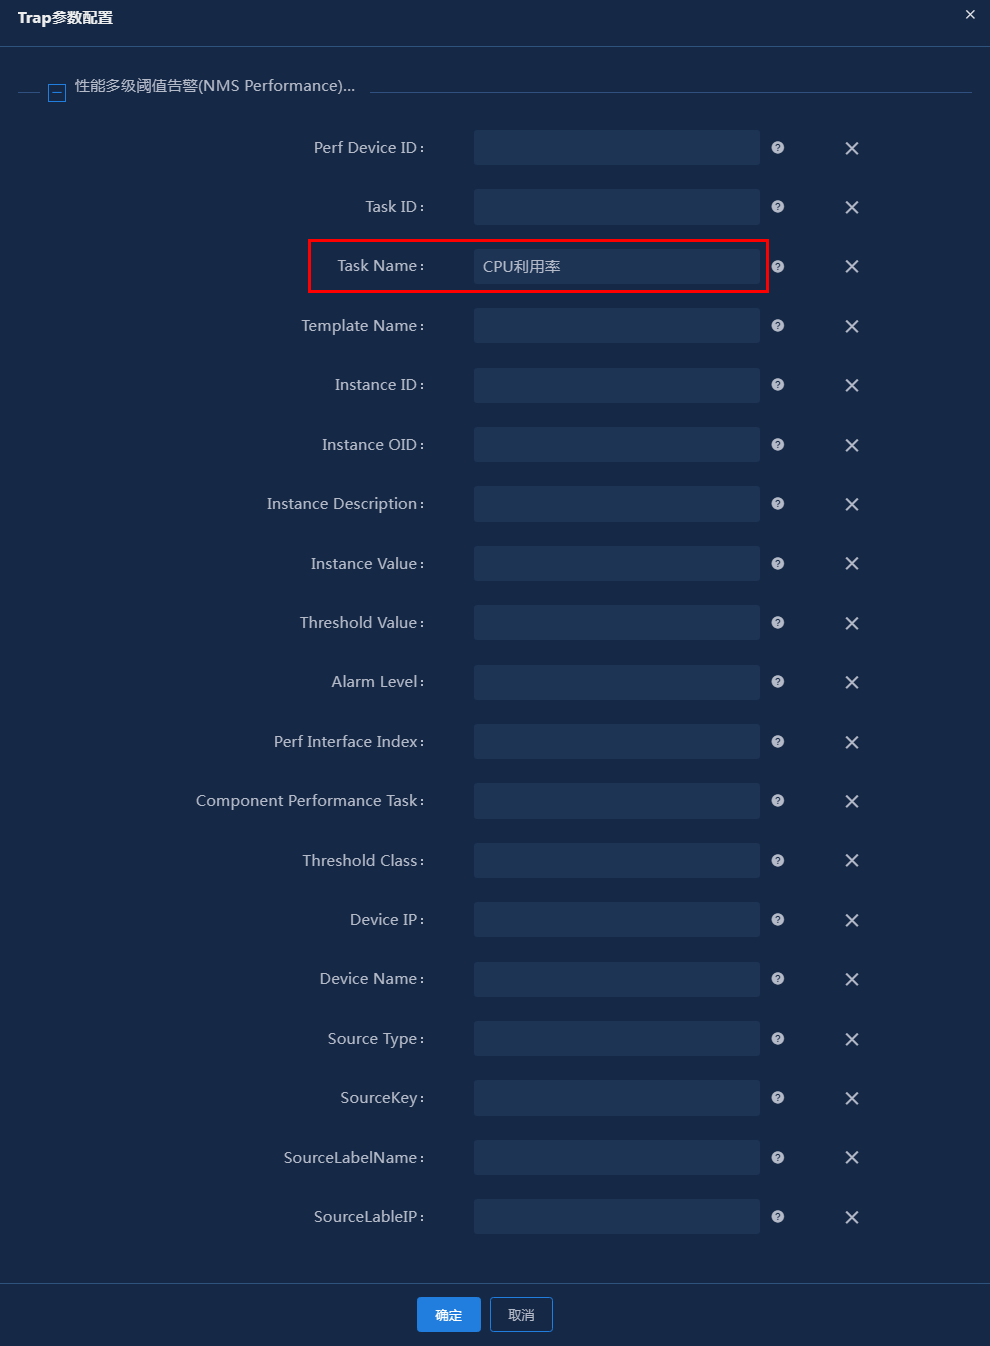
f. Click OK to save the alarm parameters for the task name.
Figure 7 Selecting alarm parameters
g. Click OK to save the aggregation conditions.
h. Repeat steps from a to h to add another aggregation condition.
8. Configure the aggregation conditions.
The default is Yes. To switch the match type to No, click Yes in the Match Type column. To switch the match type to Yes, click No in the Match Type column.
¡ When the match type is Yes for an aggregation condition, alarms matching the aggregation condition will be aggregated.
¡ When the match type is No for an aggregation condition, alarms not matching the aggregation condition will be aggregated.
In this example, the match type is Yes.
9. Configure the logic relationship between the aggregation conditions above. Options are AND and OR.
¡ AND: An aggregation rule is matched when each of its aggregation conditions is matched.
¡ OR: An aggregation rule is matched when any of its aggregation conditions is matched.
AND is selected in this example.
Figure 8 Configuring aggregation conditions
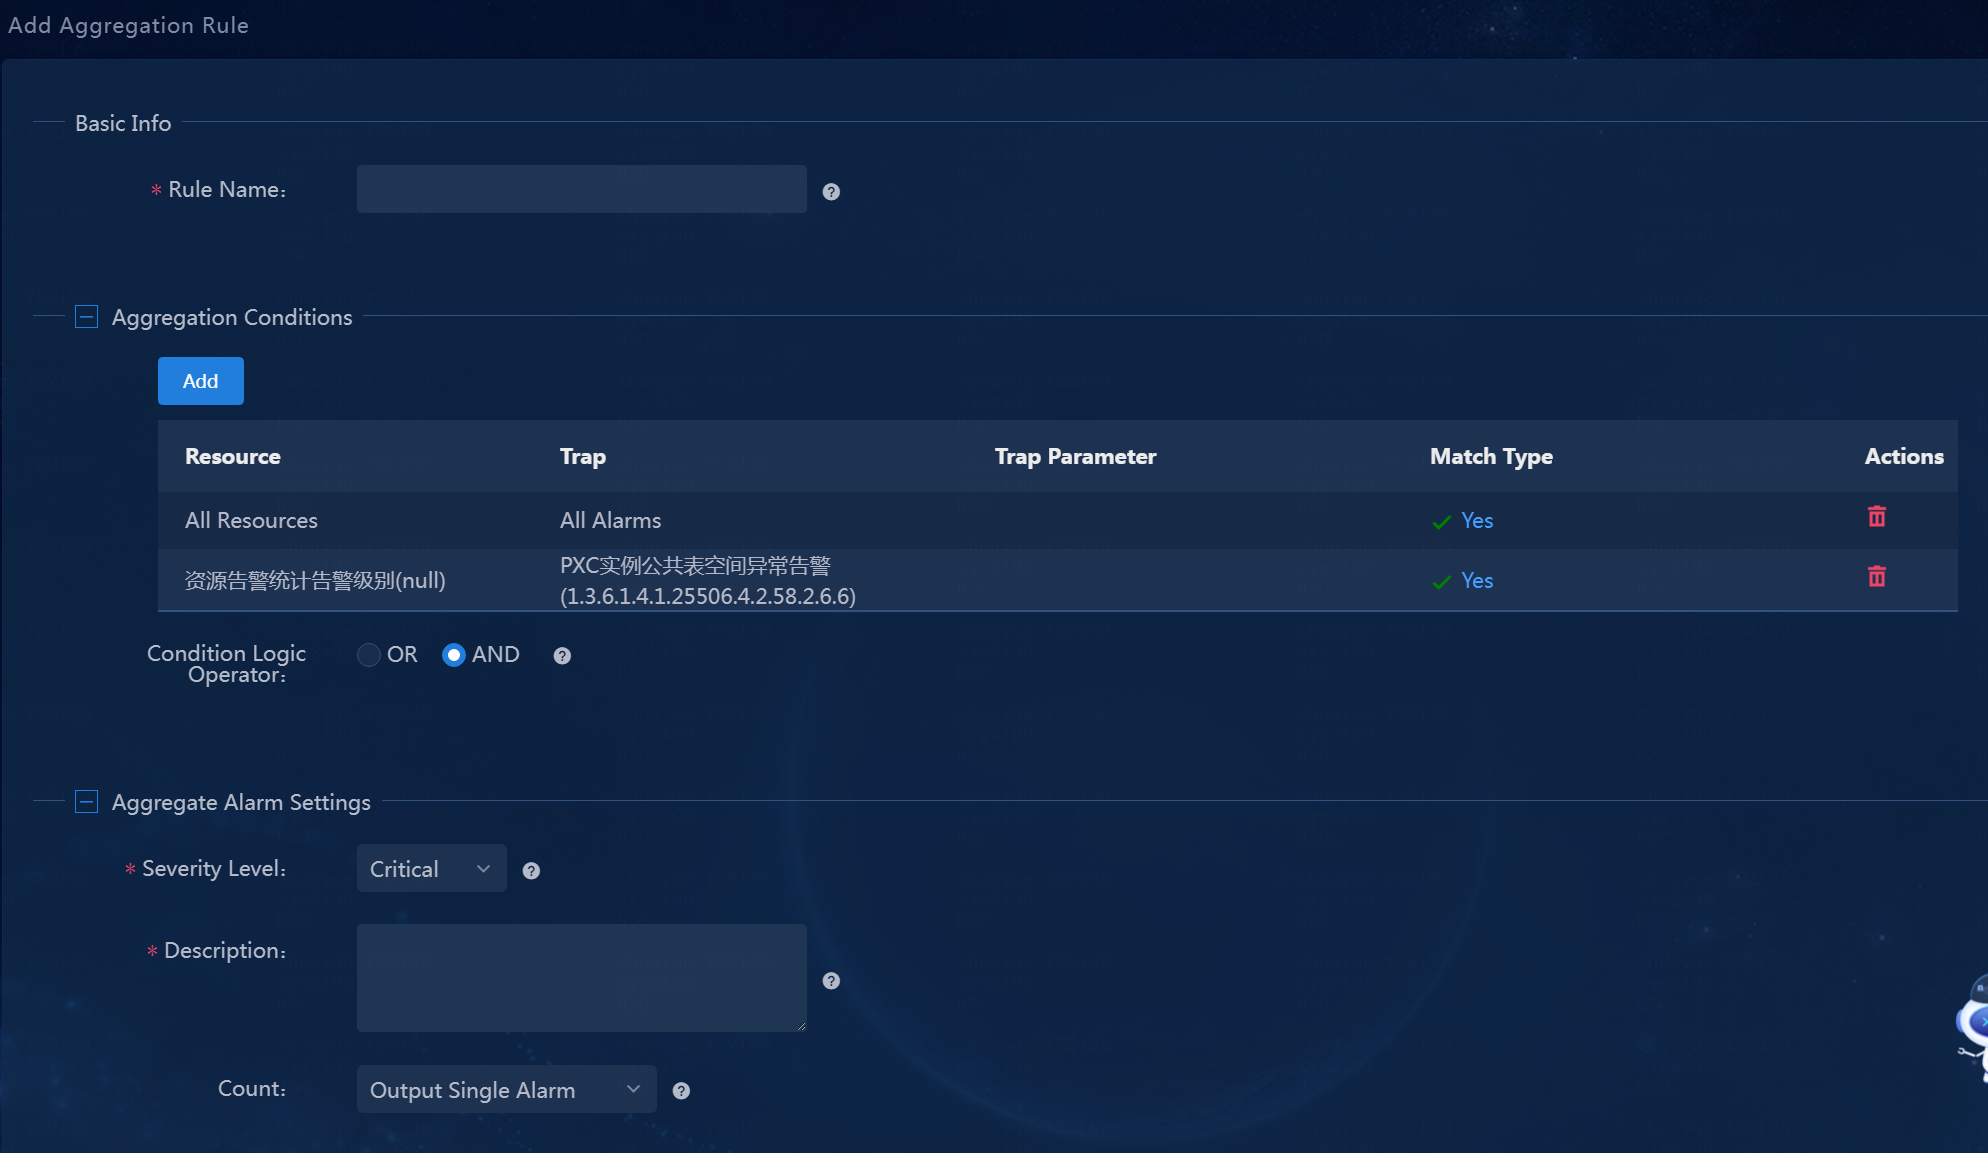
10. Configure the aggregate alarm settings.
¡ Severity Level: Set the severity level of the aggregate alarms. Options are Critical, Major, Minor, Warning, and Info.
¡ Description: Set the description for the alarms output by the alarm aggregation rule. The description can be a pure text or contain variables. In a description that contains variables, a variable corresponds to the matching resource or trap in each aggregation condition. You can use {condition(0).resource} to represent the resource value matched by the first condition, and {condition(0).trap} to represent the trap name matched by the first condition, and so on. {count} represents the number of original alarms in the aggregate alarm matched by the aggregation rule. {aggregationTime} represents the aggregation time window of the aggregate alarm.
¡ Count: Specify the number of alarms output by the aggregation rule.
- If you select Output Single Alarm and more than one original alarms meet the aggregation conditions within the aggregation period, the original alarms will be aggregated into one aggregate alarm and output.
- If you select Aggregate By IP, the original alarms that meet the aggregation conditions within the aggregation period will be aggregated by IP. If more than one original alarms from one IP meet the aggregation conditions, they will be aggregated into one aggregate alarm and output.
In an IPv6 environment, alarms cannot be aggregated by IP. Only one single aggregate alarm will be output.
11. Click OK to save the alarm aggregation rule.
Verifying the configuration
Viewing alarm information
1. Navigate to the Monitor > Alarm > Active Alarms page.
2. Select On for the Show Aggregated Alarms option. The active alarm list displays information about aggregate alarms.
Figure 9 Viewing active alarms
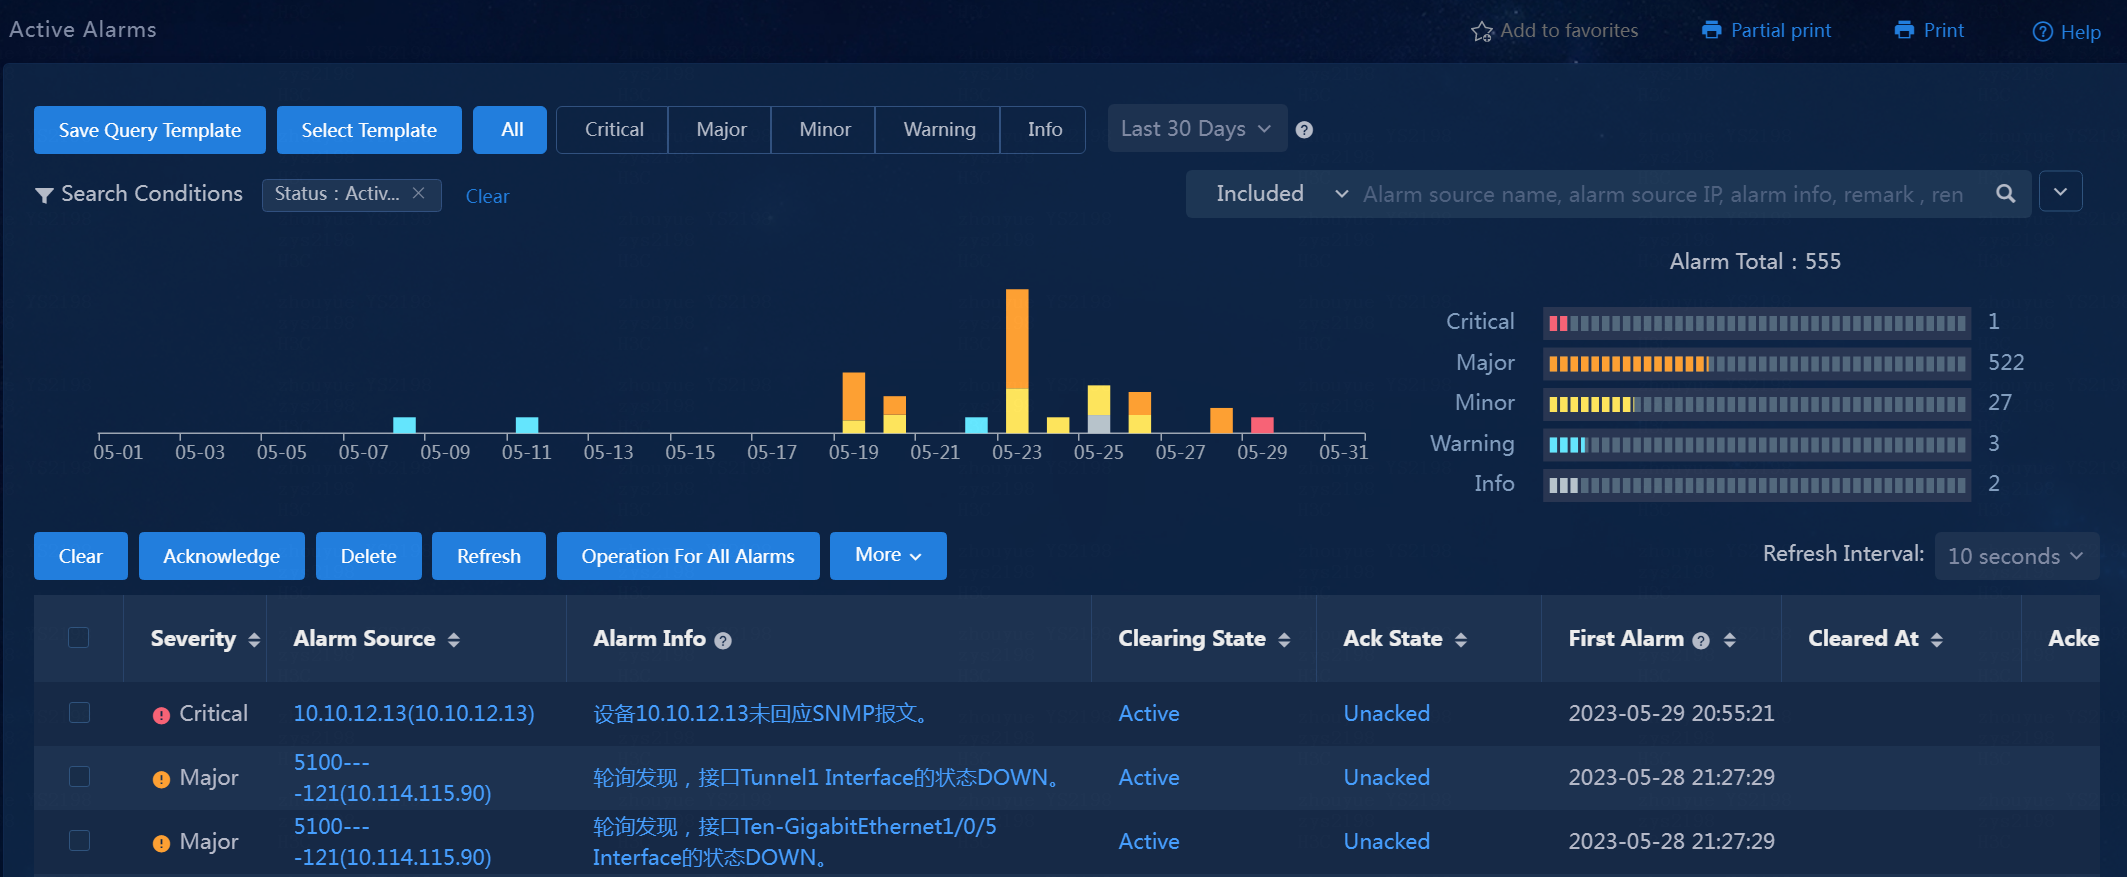
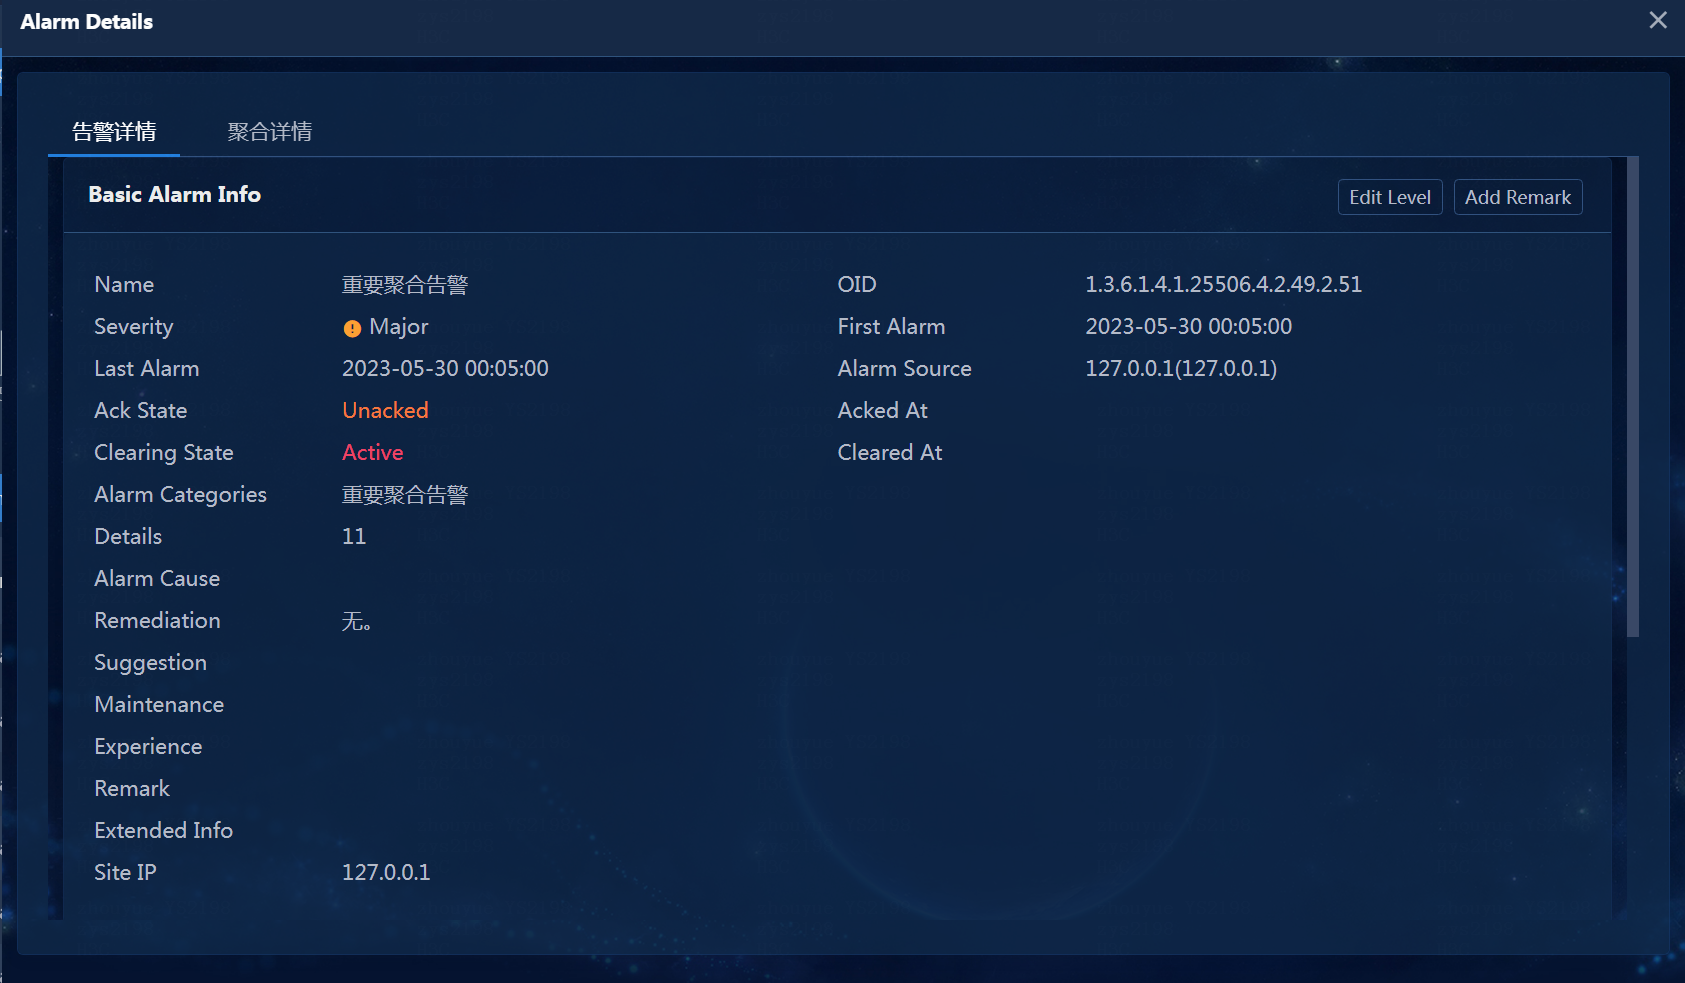
3. Click the link in the Alarm Info column for an aggregate alarm to view the alarm details, including basic information about the alarm and the alarm parameters.
Figure 10 Alarm details
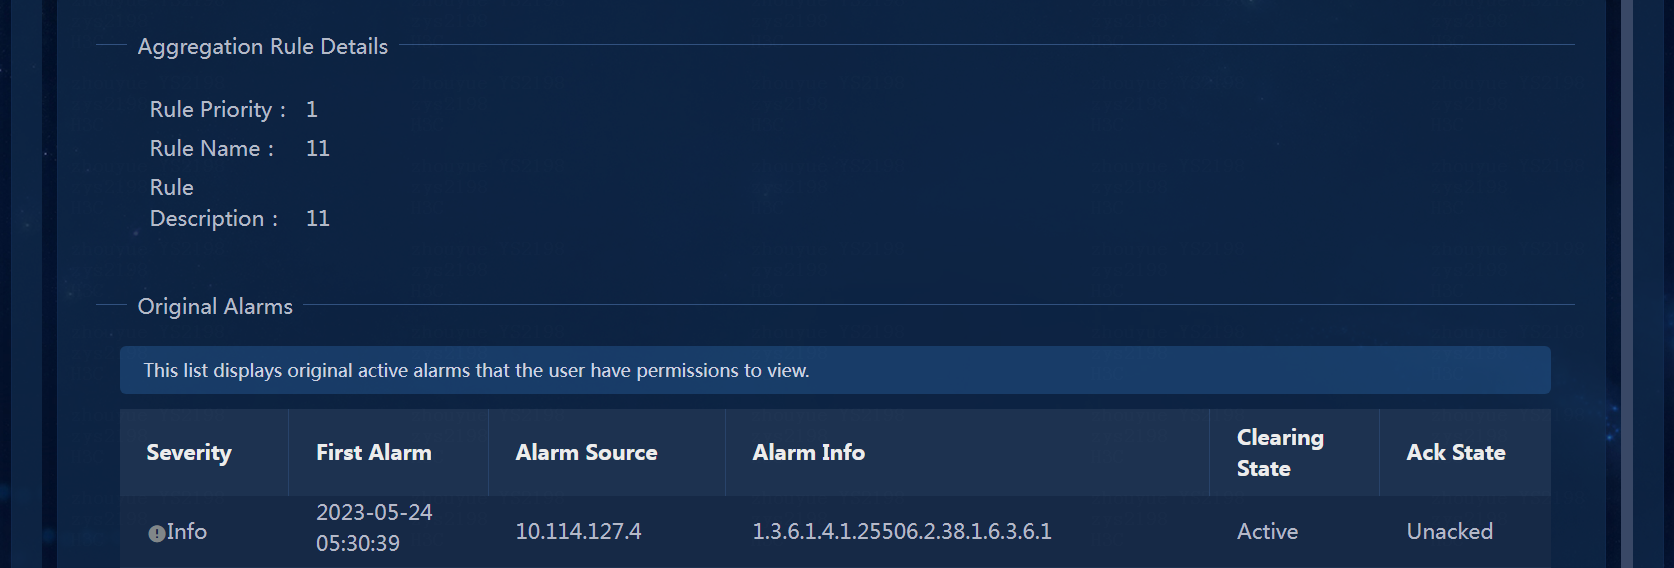
4. Select the Aggregate Details tab. You can view the original alarms of the aggregate alarm. The Aggregate Details tab is available only for aggregate alarms.
Figure 11 Aggregate Details
Alarm clearance and acknowledgement
If an alarm can be ignored, or that the failure represented by the alarm has been resolved, you can manually clear the alarm. Clearing an alarm changes the alarm state from Active to Cleared. Additionally, you can acknowledge an alarm to change the Ack Status of the alarm from Unacked to Acked. The Ack Status tells you whether the alarm has been processed by the system or the operator. You can view the ack status for each alarm in the Ack Status column.
1. Navigate to the Monitor > Alarm > Active Alarms page. Active alarms include all active alarms and alarms that have been cleared on the current day.
2. To clear an alarm, click the Active link in the Clearance State column for that alarm. The clearance state of the alarm will be changed to Cleared. To view correlated alarms, navigate to the Alarm Details > Aggregation Details page and view the alarm details as described in "Viewing alarm information"
3. Click OK to confirm clearance of the aggregate alarm.
4. Click the Clear link to the right of the Search Conditions box to clear the Status: Active search filtering criterion to display cleared alarms.
Figure 12 Aggregate alarm cleared

5. Click the Unacked link in the Ack State column for that alarm to acknowledge the alarm.
6. Select the "You have selected 1 aggregated alarm for acknowledgement. Do you want to acknowledge its correlated unacknowledged original alarms as well?" option, and then click OK to acknowledge the correlated alarms simultaneously.
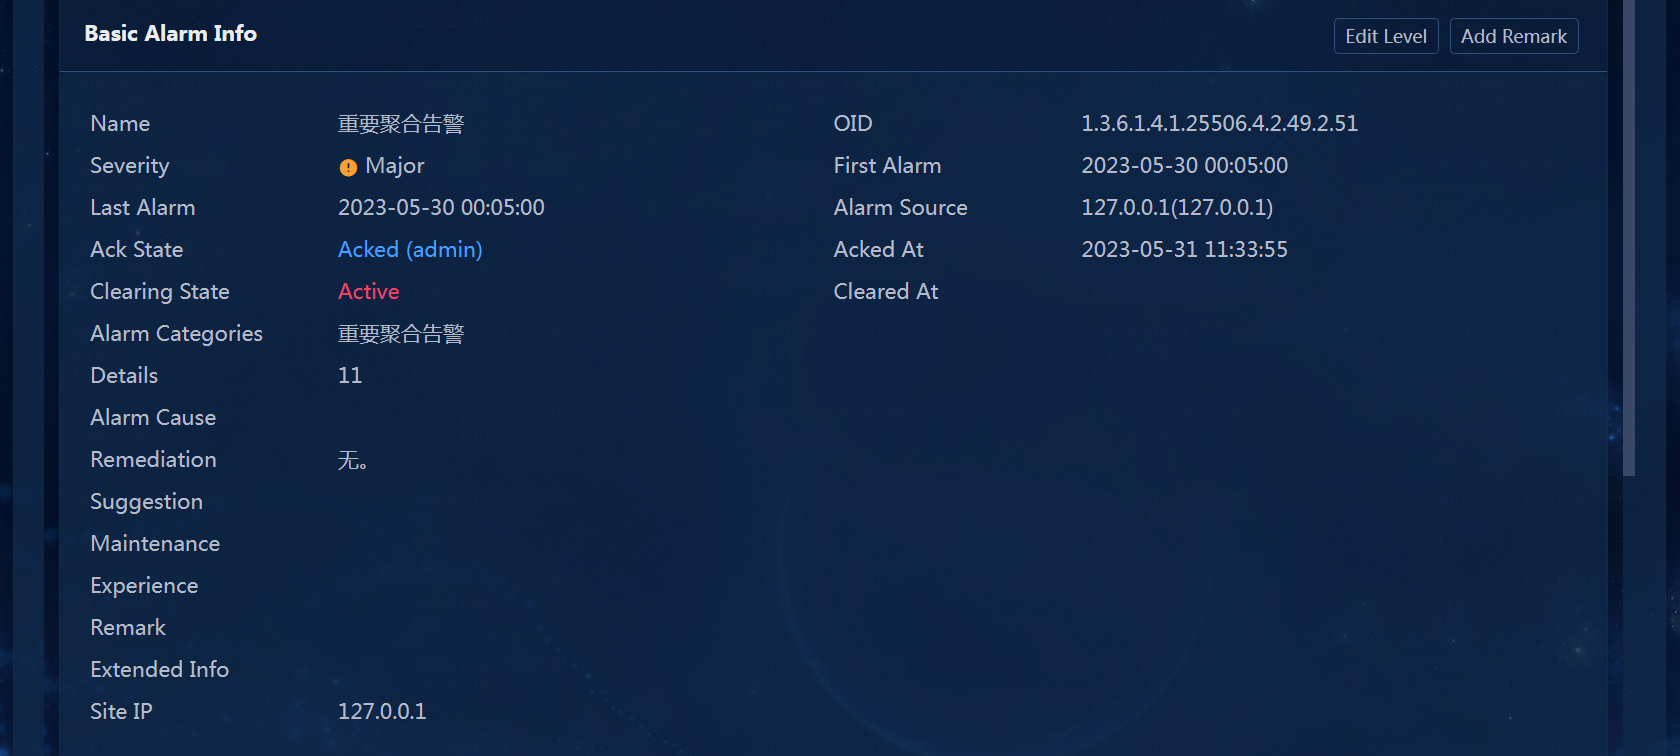
7. Click the Alarm Info link for the aggregation alarm. The alarm detailed information page opens.
Figure 13 Alarm detailed information page
8. Click the Aggregation Details tab to view the status of the original alarms of the aggregate alarm..
