- Table of Contents
- Related Documents
-
| Title | Size | Download |
|---|---|---|
| 03-Hardware resource management configuration | 131.49 KB |
Hardware resource management tasks at a glance
Configuring CPU usage tracking
Configuring CPU diagnostic troubleshooting
Displaying CPU usage monitoring information
Setting memory alarm thresholds
Configuring memory diagnostic troubleshooting
Displaying memory usage monitoring information
Setting the temperature alarm thresholds
Displaying device temperature information
Setting the port status detection timer
Verifying and diagnosing transceiver modules
Diagnosing transceiver modules
Managing hardware resources
This chapter describes routine device hardware resource management tasks, including monitoring CPU and memory usage, displaying power supply and fan operating status, and configuring basic device operating parameters.
Hardware resource management tasks at a glance
All hardware resource management tasks are optional. You can perform any of the tasks in any order.
¡ Configuring CPU usage tracking
¡ Configuring CPU diagnostic troubleshooting
¡ Displaying CPU usage monitoring information
¡ Setting memory alarm thresholds
¡ Configuring memory diagnostic troubleshooting
¡ Displaying memory usage monitoring information
· Monitoring device temperature
¡ Setting the temperature alarm thresholds
¡ Displaying device temperature information
· Setting the port status detection timer
· Verifying and diagnosing transceiver modules
¡ Verifying transceiver modules
¡ Diagnosing transceiver modules
· Displaying device hardware information
Monitoring CPU usage
Configuring CPU usage alarm
About this task
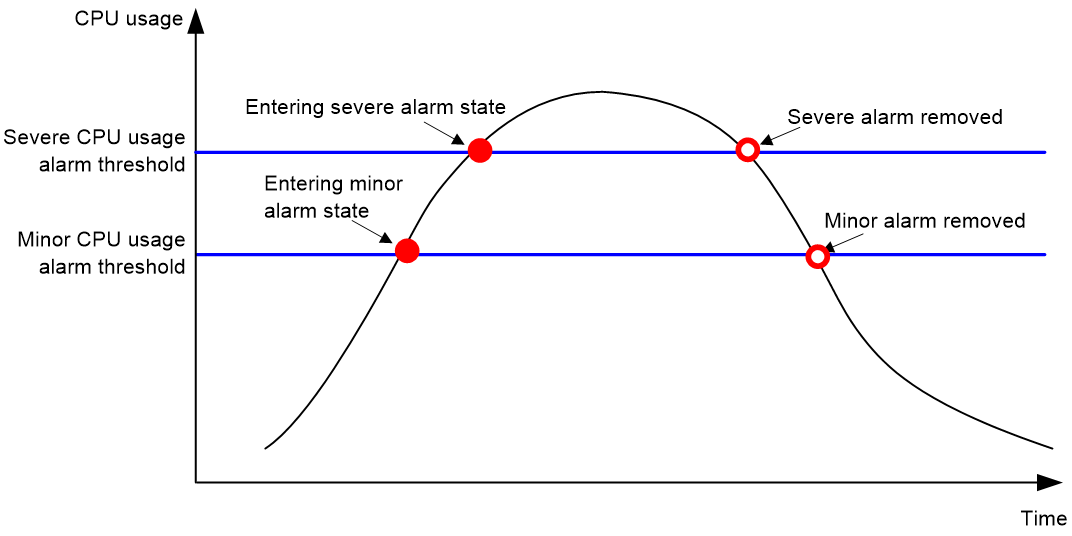
The device samples CPU usage at 1-minute intervals, and compares the samples with CPU usage thresholds to identify the CPU usage status and send alarms or notifications accordingly.
The device supports the following CPU usage thresholds:
· Minor threshold—If the CPU usage increases to or above the minor threshold but is less than the severe threshold, the CPU usage enters minor alarm state. The device sends minor alarms periodically until the CPU usage increases above the severe threshold or the minor alarm is removed.
· Severe threshold—If the CPU usage increases above the severe threshold, the CPU usage enters severe alarm state. The device sends severe alarms periodically until the severe alarm is removed.
CPU usage alarms and notifications can be sent to NETCONF, SNMP, and the information center to be encapsulated as NETCONF events, SNMP traps and informs, and log messages. For more information about NETCONF and SNMP, see Network Management and Monitoring Configuration Guide. For more information about information center, see "Configuring the information center."
Figure 1 CPU alarms and alarm-removed notifications
Procedure
1. Enter system view.
system-view
2. Set the CPU usage alarm thresholds.
monitor cpu-usage threshold severe-threshold [ minor-threshold minor-threshold ] [ slot slot-number [ cpu cpu-number ] ]
By default, the CPU usage alarm threshold is 99%.
|
|
CAUTION: If you set the severe CPU usage alarm threshold to a too low value, the device will reach the threshold easily. Normal service processing will be affected. |
3. Set the CPU usage alarm resending intervals.
monitor resend cpu-usage { minor-interval minor-interval | severe-interval severe-interval } * [ slot slot-number [ cpu cpu-number ] ]
By default, the minor CPU usage alarm resending interval and severe CPU usage alarm resending interval are 300 seconds and 60 seconds, respectively.
Configuring CPU usage tracking
About this task
After you enable CPU usage tracking, the system samples CPU usage at intervals and saves the samples to a buffer. You can use the display cpu-usage history command to view the recent CPU usage.
Procedure
1. Enter system view.
system-view
2. Set the sampling interval for CPU usage tracking.
monitor cpu-usage interval interval [ slot slot-number [ cpu cpu-number ] ]
By defau
lt, the sampling interval for CPU usage tracking is 1 minute.
3. Enable CPU usage tracking.
monitor cpu-usage enable [ slot slot-number [ cpu cpu-number ] ]
By default, CPU usage tracking is enabled.
Configuring CPU diagnostic troubleshooting
CPU diagnostic troubleshooting detects whether CPU usage is normal. If CPU usage exceeds alarm thresholds or suddenly increases, this feature helps you to locate CPU usage issues. For more information about CPU diagnostic troubleshooting, see diagnostic troubleshooting in Intelligent O&M Configuration Guide.
Displaying CPU usage monitoring information
Perform display tasks in any view.
· Display CPU usage monitoring settings.
display cpu-usage configuration [ slot slot-number [ cpu cpu-number ] ]
· Display the current CPU usage statistics.
display cpu-usage [ control-plane | data-plane ] [ summary ] [ slot slot-number ]
· Display the historical CPU usage statistics in a coordinate system.
display cpu-usage history [ job job-id ] [ slot slot-number [ cpu cpu-number ] ]
Monitoring CPU core usage
About this task
The device samples CPU core usage at 5-second intervals and calculates the average value during each CPU core usage statistics interval. If the value during an interval is greater than a CPU core usage threshold, the device issues an alarm and logs the event.
Restrictions and guidelines
As a best practice, set the CPU core usage statistics interval to an integer multiple of 5. If you set the interval to a non-integer multiple of 5, the effective statistics interval is the integer multiple of 5 that is close to and smaller than the value you set. For example, if you set this argument to 18 seconds, the effective statistics interval is 15 seconds.
Procedure
1. Enter system view.
system-view
2. Set CPU core alarm resending intervals.
monitor resend cpu-usage core-interval { minor-interval minor-interval | severe-interval severe-interval } * [ slot slot-number [ cpu cpu-number ] ]
The default CPU core alarm resending interval is 300 seconds.
Monitoring memory usage
Setting memory alarm thresholds
About this task
To ensure correct operation and improve memory efficiency, the system monitors the amount of free memory space in real time. If the amount of free memory space reaches the minor, severe, or critical alarm threshold, the system issues an alarm to affected service modules and processes.
The system can also issue an early warning to warn you of an approaching insufficient-memory condition.
(On devices that do not support low memory.) You can use the display memory command to display memory usage information.
(On devices that support low memory.) The system monitors only the amount of free low-memory space. You can use the display memory command to display memory usage information.
(On devices with slots that support low memory.) For slots that support low memory, the system monitors only the amount of free low-memory space. You can use the display memory command to display memory usage information. If the LowMem field is displayed for a slot, the slot supports low memory.
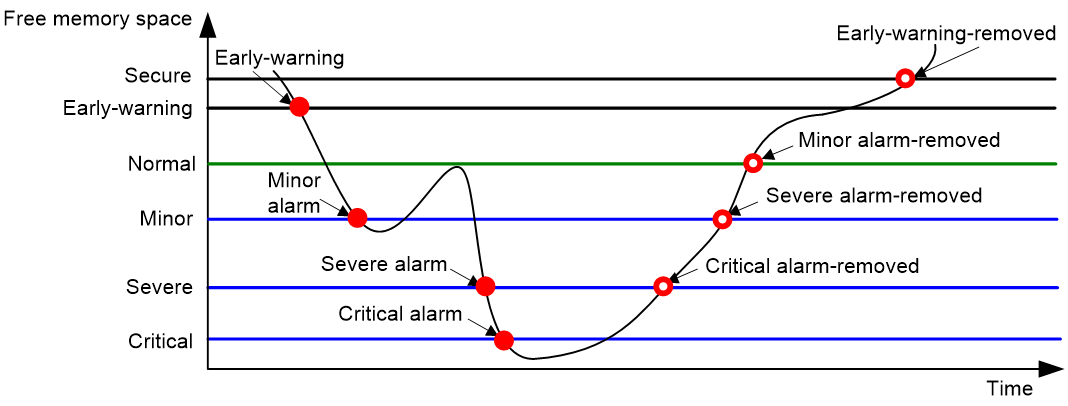
As shown in the following table and figure, the system supports these free-memory thresholds:
· Sufficient-memory threshold.
· Early-warning threshold.
· Normal state threshold.
· Minor alarm threshold.
· Severe alarm threshold.
· Critical alarm threshold.
Table 1 Memory alarm notifications and memory alarm-removed notifications
|
Notification |
Triggering condition |
Remarks |
|
Early-warning notification |
The amount of free memory space decreases to or below the early-warning threshold. |
After generating and sending an early-warning notification, the system does not generate and send any additional early-warning notifications until the early warning is removed. |
|
Minor alarm notification |
The amount of free memory space decreases to or below the minor alarm threshold. |
After generating and sending a minor alarm notification, the system does not generate and send any additional minor alarm notifications until the minor alarm is removed. |
|
Severe alarm notification |
The amount of free memory space decreases to or below the severe alarm threshold. |
After generating and sending a severe alarm notification, the system does not generate and send any additional severe alarm notifications until the severe alarm is removed. |
|
Critical alarm notification |
The amount of free memory space decreases to or below the critical alarm threshold. |
After generating and sending a critical alarm notification, the system does not generate and send any additional critical alarm notifications until the critical alarm is removed. |
|
Critical alarm-removed notification |
The amount of free memory space increases above the severe alarm threshold. |
N/A |
|
Severe alarm-removed notification |
The amount of free memory space increases above the minor alarm threshold. |
N/A |
|
Minor alarm-removed notification |
The amount of free memory space increases above the normal state threshold. |
N/A |
|
Early-warning-removed notification |
The amount of free memory space increases above the sufficient-memory threshold. |
N/A |
Figure 2 Memory alarm notifications and alarm-removed notifications
The sending intervals for memory alarms are as follows:
· If the amount of the free memory space have been over the early-warning alarm threshold for 1 hour, an early-warning alarm notification is sent.
· If the amount of the free memory space have been over the minor alarm threshold for 12 hour, a minor alarm notification is sent.
· If the amount of the free memory space have been over the severe alarm threshold for 3 hour, a severe alarm notification is sent.
· If the amount of the free memory space have been over the critical alarm threshold for 1 hour, a critical alarm notification is sent.
Restrictions and guidelines
If a memory alarm occurs, delete unused configuration items or disable some features to increase the free memory space. Because the memory space is insufficient, some configuration items might not be able to be deleted.
The device will restart if one of the following conditions is met:
· After a critical alarm occurs, the remaining free-memory value has been smaller than the critical alarm threshold for 30 seconds.
· The interval between two consecutive critical alarms is shorter than 30 seconds.
· The critical alarm has occurred three times within three minutes.
· After a critical alarm occurs, the system will periodically sample free memory space and predict if the free memory space will be exhausted within 30 seconds. If the prediction result indicates that the free memory space will be exhausted within 30 seconds, the device will restart.
Procedure
1. Enter system view.
system-view
2. Set the memory usage threshold.
memory-threshold [ slot slot-number [ cpu cpu-number ] ] usage memory-threshold
By default, the memory usage threshold is 100%.
3. Set the free-memory thresholds.
memory-threshold [ slot slot-number [ cpu cpu-number ] ] [ ratio ] minor minor-value severe severe-value critical critical-value normal normal-value [ early-warning early-warning-value secure secure-value ]
The default settings are as follows:
¡ Minor alarm threshold—512 MB.
¡ Severe alarm threshold—448 MB.
¡ Critical alarm threshold—384 MB.
¡ Normal state threshold—576 MB.
¡ Early-warning threshold—640 MB.
¡ Sufficient-memory threshold—704 MB.
Configuring memory diagnostic troubleshooting
Memory diagnostic troubleshooting detects whether free memory space is normal. If free memory space exceeds alarm thresholds or suddenly decreases, this feature helps you to locate memory space issues. For more information about memory diagnostic troubleshooting, see diagnostic troubleshooting in Intelligent O&M Configuration Guide.
Displaying memory usage monitoring information
Perform display tasks in any view.
· Display memory usage information.
display memory [ summary ] [ slot slot-number [ cpu cpu-number ] ]
· Display memory alarm thresholds and statistics.
display memory-threshold [ slot slot-number [ cpu cpu-number ] ]
Monitoring device temperature
Setting the temperature alarm thresholds
About this task
The device monitors its temperature based on the following thresholds:
· Low-temperature threshold.
· High-temperature warning threshold.
· High-temperature alarming threshold.
When the device temperature drops below the low-temperature threshold or reaches the high-temperature warning or alarming threshold, the device performs the following operations:
· Sends log messages and traps.
· Sets LEDs on the device panel.
Procedure
1. Enter system view.
system-view
2. Configure the temperature alarm thresholds.
temperature-limit slot slot-number { hotspot | inflow | outflow } sensor-number lowlimit warninglimit [ alarmlimit ]
The defaults vary by temperature sensor model. To view the defaults, execute the undo temperature-limit and display environment commands in turn.
The high-temperature alarming threshold must be higher than the high-temperature warning threshold, and the high-temperature warning threshold must be higher than the low-temperature threshold.
Displaying device temperature information
To display device temperature information, execute the following command in any view:
display environment [ slot slot-number ]
Monitoring fans
Displaying fan information
Perform display tasks in any view.
· Display fan tray operating status information.
display fan [ slot slot-number [ fan-id ] ]
Setting the port status detection timer
About this task
On a network enabled with loopback detection or STP, the device starts a port status detection timer when a port is shut down by a protocol. If the port has been in down state before the timer expires, the device will set the port status to the port's physical status.
Procedure
1. Enter system view.
system-view
2. Set the port status detection timer.
shutdown-interval time
The default is 30 seconds.
Verifying and diagnosing transceiver modules
Verifying transceiver modules
About this task
You can use one of the following methods to verify the genuineness of a transceiver module:
· Display the key parameters of a transceiver module, including its transceiver type, connector type, central wavelength of the transmit laser, transfer distance, and vendor name.
· Display its electronic label. The electronic label is a profile of the transceiver module and contains the permanent configuration, including the serial number, manufacturing date, and vendor name. The data was written to the transceiver module or the device's storage component during debugging or testing of the transceiver module or device.
The device regularly checks transceiver modules for their vendor names. If a transceiver module does not have a vendor name or the vendor name is not H3C, the device repeatedly outputs traps and log messages. For information about logging rules, see "Configuring the information center."
Procedure
To verify transceiver modules, execute the following commands in any view:
· Display the key parameters of transceiver modules.
display transceiver interface [ interface-type interface-number ]
· Display the electrical label information of transceiver modules.
display transceiver manuinfo interface [ interface-type interface-number ]
Diagnosing transceiver modules
About this task
The device provides the alarm and digital diagnosis functions for transceiver modules. When a transceiver module fails or is not operating correctly, you can perform the following tasks:
· Check the alarms that exist on the transceiver module to identify the fault source.
· Examine the key parameters monitored by the digital diagnosis function, including the temperature, voltage, laser bias current, TX power, and RX power.
Procedure
To diagnose transceiver modules, execute the following commands in any view:
· Display transceiver alarms.
display transceiver alarm interface [ interface-type interface-number ]
· Display the current values of the digital diagnosis parameters on transceiver modules.
display transceiver diagnosis interface [ interface-type interface-number ]
Displaying device hardware information
To display device hardware information, execute the following command in any view:
display device[ slot slot-number [ subslot subslot-number ] | verbose ]
Displaying device hardware electronic label information
To display hardware electronic label information for the device, execute the following command in any view:
display device manuinfo [ slot slot-number [ subslot subslot-number ] ]
