- Table of Contents
- Related Documents
-
| Title | Size | Download |
|---|---|---|
| 03-Hardware resource management configuration | 212.88 KB |
Hardware resource management tasks at a glance
Configuring CPU usage tracking
Displaying CPU usage monitoring information
Setting memory alarm thresholds
Displaying memory usage monitoring information
Configuring resource monitoring
Displaying resource monitoring information
Setting the temperature alarm thresholds
Displaying device temperature information
Setting the port status detection timer
Setting the hardware resource operating mode
Verifying and diagnosing transceiver modules
Diagnosing transceiver modules
Disabling transceiver module source alarm
Displaying power information for transceiver modules
Managing 400G transceiver modules
Enabling lanes on 400G transceiver modules
Setting a power mode for 400G transceiver modules
Configuring pre-cursor, post-cursor, and amplitude
Displaying 400G transceiver module information
Resetting 400G transceiver modules
Specifying a diagnostic selector for a transceiver module
Enabling loopback testing on a transceiver module lane
Specifying the signal mode and PRBS pattern for a transceiver module lane
Configuring transceiver monitoring
Configuring transceiver performance sampling
Displaying device hardware information
Managing hardware resources
This chapter describes routine device hardware resource management tasks, including monitoring CPU and memory usage, displaying power module and fan operating status, and configuring basic device operating parameters.
Hardware resource management tasks at a glance
All hardware resource management tasks are optional. You can perform any of the tasks in any order.
¡ Configuring CPU usage tracking
¡ Displaying CPU usage monitoring information
¡ Setting memory alarm thresholds
¡ Displaying memory usage monitoring information
¡ Configuring resource monitoring
¡ Displaying resource monitoring information
· Monitoring device temperature
¡ Setting the temperature alarm thresholds
¡ Displaying device temperature information
· Setting the port status detection timer
· Setting the hardware resource operating mode
· Verifying and diagnosing transceiver modules
¡ Verifying transceiver modules
¡ Diagnosing transceiver modules
¡ Disabling transceiver module source alarm
· Managing 400G transceiver modules
¡ Enabling lanes on 400G transceiver modules
¡ Setting a power mode for 400G transceiver modules
¡ Configuring pre-cursor, post-cursor, and amplitude
¡ Displaying 400G transceiver module information
¡ Resetting 400G transceiver modules
· Specifying a diagnostic selector for a transceiver module
· Enabling loopback testing on a transceiver module lane
· Specifying the signal mode and PRBS pattern for a transceiver module lane
· Configuring transceiver monitoring
· Configuring transceiver performance sampling
· Displaying device hardware information
· Displaying device hardware electronic label information
· Displaying device hardware alarm information
Monitoring CPU usage
Configuring CPU usage alarm
About this task
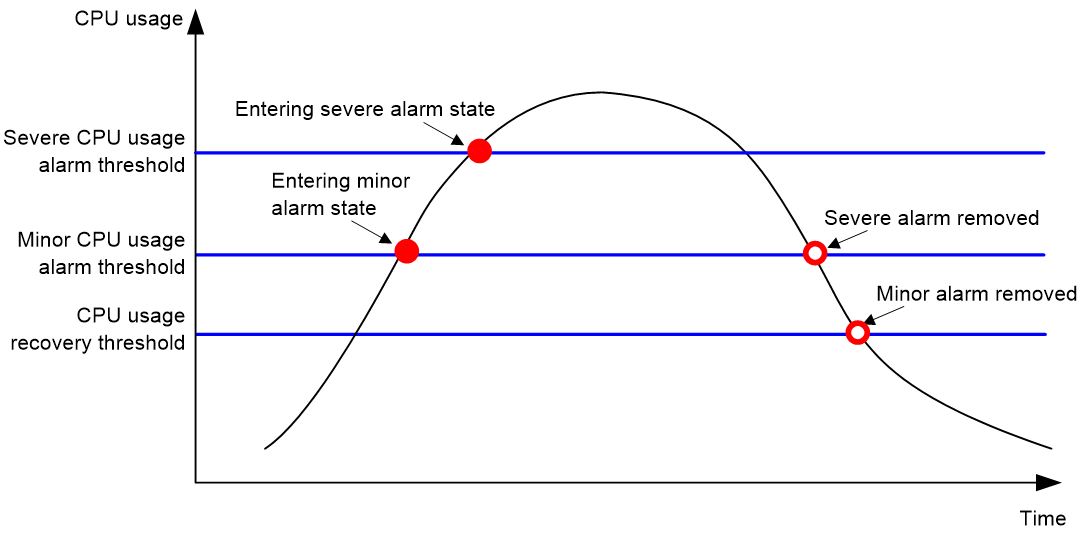
The device samples CPU usage at 1-minute intervals, and compares the samples with CPU usage thresholds to identify the CPU usage status and send alarms or notifications accordingly.
The device supports the following CPU usage thresholds:
· Minor threshold—If the CPU usage increases to or above the minor threshold but is less than the severe threshold, the CPU usage enters minor alarm state. The device sends minor alarms periodically until the CPU usage increases above the severe threshold or the minor alarm is removed.
· Severe threshold—If the CPU usage increases above the severe threshold, the CPU usage enters severe alarm state. The device sends severe alarms periodically until the severe alarm is removed.
· Recovery threshold—If the CPU usage decreases below the recovery threshold, the CPU usage enters recovered state. The device sends a recovery notification.
CPU usage alarms and notifications can be sent to NETCONF, SNMP, and the information center to be encapsulated as NETCONF events, SNMP traps and informs, and log messages. For more information about NETCONF and SNMP, see Network Management and Monitoring Configuration Guide. For more information about information center, see "Configuring the information center."
Figure 1 CPU alarms and alarm-removed notifications
Procedure
1. Enter system view.
system-view
2. Set the CPU usage alarm thresholds.
monitor cpu-usage threshold severe-threshold [ minor-threshold minor-threshold recovery-threshold recovery-threshold ] [ slot slot-number [ cpu cpu-number ] ]
By default, the CPU usage alarm threshold is 99%.
|
|
CAUTION: If you set the severe CPU usage alarm threshold to a too low value, the device will reach the threshold easily. Normal service processing will be affected. |
3. Set the CPU usage alarm resending intervals.
monitor resend cpu-usage { minor-interval minor-interval | severe-interval severe-interval } * [ slot slot-number [ cpu cpu-number ] ]
By default, the minor CPU usage alarm resending interval and severe CPU usage alarm resending interval are 300 seconds and 60 seconds, respectively.
Configuring CPU usage tracking
About this task
After you enable CPU usage tracking, the system samples CPU usage at intervals and saves the samples to a buffer. You can use the display cpu-usage history command to view the recent CPU usage.
Procedure
1. Enter system view.
system-view
2. Set the sampling interval for CPU usage tracking.
monitor cpu-usage interval interval [ slot slot-number [ cpu cpu-number ] ]
By default, the sampling interval for CPU usage tracking is 1 minute.
3. Enable CPU usage tracking.
monitor cpu-usage enable [ slot slot-number [ cpu cpu-number ] ]
By default, CPU usage tracking is enabled.
Displaying CPU usage monitoring information
Perform display tasks in any view.
· Display CPU usage monitoring settings.
display cpu-usage configuration [ slot slot-number [ cpu cpu-number ] ]
· Display the current CPU usage statistics.
display cpu-usage [ control-plane ] [ summary ] [ slot slot-number [ cpu cpu-number ] [ core { core-number | all } ] ]
· Display the historical CPU usage statistics in a coordinate system.
display cpu-usage history [ job job-id ] [ slot slot-number [ cpu cpu-number ] ]
Monitoring CPU core usage
About this task
The device samples CPU core usage at 5-second intervals and calculates the average value during each CPU core usage statistics interval. If the value during an interval is greater than a CPU core usage threshold, the device issues an alarm and logs the event.
Restrictions and guidelines
As a best practice, set the CPU core usage statistics interval to an integer multiple of 5. If you set the interval to a non-integer multiple of 5, the effective statistics interval is the integer multiple of 5 that is close to and smaller than the value you set. For example, if you set this argument to 18 seconds, the effective statistics interval is 15 seconds.
Procedure
1. Enter system view.
system-view
2. Set CPU core usage statistics intervals.
monitor cpu-usage statistics-interval interval slot slot-number cpu cpu-number core core-id-list
The default CPU core usage statistics intervals depend on the device model.
3. Set CPU core usage alarm thresholds.
monitor cpu-usage threshold severe-threshold [ minor-threshold minor-threshold recovery-threshold recovery-threshold ] slot slot-number cpu cpu-number core core-id-list
The default CPU core usage alarm thresholds depend on the device model.
4. Set CPU core alarm resending intervals.
monitor resend cpu-usage core-interval { minor-interval minor-interval | severe-interval severe-interval } * [ slot slot-number [ cpu cpu-number ] ]
The default CPU core alarm resending intervals depend on the device model.
Monitoring memory usage
Setting memory alarm thresholds
About this task
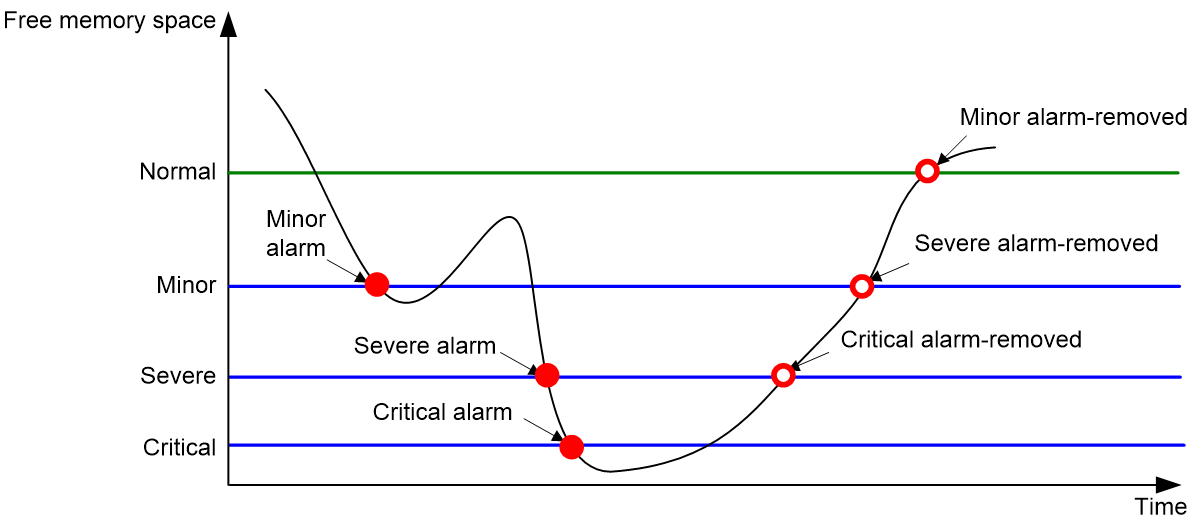
To ensure correct operation and improve memory efficiency, the system monitors the amount of free memory space in real time. If the amount of free memory space reaches the minor, severe, or critical alarm threshold, the system issues an alarm to affected service modules and processes.
You can use the display memory command to display memory usage information.
As shown in the following table and figure, the system supports these free-memory thresholds:
· Normal state threshold.
· Minor alarm threshold.
· Severe alarm threshold.
· Critical alarm threshold.
Table 1 Memory alarm notifications and memory alarm-removed notifications
|
Notification |
Triggering condition |
Remarks |
|
Minor alarm notification |
The amount of free memory space decreases to or below the minor alarm threshold. |
After generating and sending a minor alarm notification, the system does not generate and send any additional minor alarm notifications until the minor alarm is removed. |
|
Severe alarm notification |
The amount of free memory space decreases to or below the severe alarm threshold. |
After generating and sending a severe alarm notification, the system does not generate and send any additional severe alarm notifications until the severe alarm is removed. |
|
Critical alarm notification |
The amount of free memory space decreases to or below the critical alarm threshold. |
After generating and sending a critical alarm notification, the system does not generate and send any additional critical alarm notifications until the critical alarm is removed. |
|
Critical alarm-removed notification |
The amount of free memory space increases above the severe alarm threshold. |
N/A |
|
Severe alarm-removed notification |
The amount of free memory space increases above the minor alarm threshold. |
N/A |
|
Minor alarm-removed notification |
The amount of free memory space increases above the normal state threshold. |
N/A |
As shown in Table 2 and Figure 2, the system supports the following free-memory thresholds:
· Normal state threshold.
· Minor alarm threshold.
· Severe alarm threshold.
· Critical alarm threshold.
Table 2 Memory alarm notifications and memory alarm-removed notifications
|
Notification |
Triggering condition |
Remarks |
|
Early-warning notification |
The amount of free memory space decreases to or below the early-warning threshold. |
After generating and sending an early-warning notification, the system does not generate and send any additional early-warning notifications until the early warning is removed. |
|
Minor alarm notification |
The amount of free memory space decreases to or below the minor alarm threshold. |
After generating and sending a minor alarm notification, the system does not generate and send any additional minor alarm notifications until the minor alarm is removed. |
|
Severe alarm notification |
The amount of free memory space decreases to or below the severe alarm threshold. |
After generating and sending a severe alarm notification, the system does not generate and send any additional severe alarm notifications until the severe alarm is removed. |
|
Critical alarm notification |
The amount of free memory space decreases to or below the critical alarm threshold. |
After generating and sending a critical alarm notification, the system does not generate and send any additional critical alarm notifications until the critical alarm is removed. |
|
Critical alarm-removed notification |
The amount of free memory space increases above the severe alarm threshold. |
N/A |
|
Severe alarm-removed notification |
The amount of free memory space increases above the minor alarm threshold. |
N/A |
|
Minor alarm-removed notification |
The amount of free memory space increases above the normal state threshold. |
N/A |
|
Early-warning-removed notification |
The amount of free memory space increases above the sufficient-memory threshold. |
N/A |
Figure 2 Memory alarm notifications and alarm-removed notifications
Procedure
1. Enter system view.
system-view
2. Set the memory usage threshold.
memory-threshold [ slot slot-number [ cpu cpu-number ] ] usage memory-threshold
By default, the memory usage threshold is 100%.
3. Set the free-memory thresholds.
memory-threshold [ slot slot-number [ cpu cpu-number ] ] [ ratio ] minor minor-value severe severe-value critical critical-value normal normal-value
The default settings are as follows:
¡ Minor alarm threshold—256 MB.
¡ Severe alarm threshold—192 MB.
¡ Critical alarm threshold—128 MB.
¡ Normal state threshold—320 MB.
Displaying memory usage monitoring information
Perform display tasks in any view.
· Display memory usage information.
display memory [ summary ] [ slot slot-number [ cpu cpu-number ] ]
· Display memory alarm thresholds and statistics.
display memory-threshold [ slot slot-number [ cpu cpu-number ] ]
Monitoring resource usage
Configuring resource monitoring
About this task
The resource monitoring feature enables the device to monitor the available amounts of types of resources, for example, the space for ARP entries. The device samples the available amounts periodically and compares the samples with resource depletion thresholds to identify the resource depletion status.
The device supports a minor resource depletion threshold and a severe resource depletion threshold for each supported resource type.
· If the available amount is equal to or less than the minor resource depletion threshold but greater than the severe resource depletion threshold, the resource type is in minor alarm state.
· If the available amount is equal to or less than the severe resource depletion threshold, the resource type is in severe alarm state.
· If the available amount increases above the minor resource depletion threshold, the resource type is in recovered state.
When a resource type enters severe alarm state, the device issues a severe alarm. If the resource type stays in severe alarm state, the device resends severe alarms periodically.
When a resource type enters minor alarm state, the device issues a minor alarm. If the resource type stays in minor alarm state or changes from severe alarm state to minor alarm state, the device identifies whether resending of minor resource depletion alarms is enabled. If the feature is disabled, the device does not issue additional minor alarms. If the feature is enabled, the device resends minor alarms periodically.
Resource depletion alarms can be sent to NETCONF, SNMP, and the information center to be encapsulated as NETCONF events, SNMP traps and informs, and log messages. For more information about NETCONF and SNMP, see Network Management and Monitoring Configuration Guide. For more information about information center, see "Configuring the information center."
Figure 3 Resource depletion alarms and alarm-removed notifications

Procedure
1. Enter system view.
system-view
2. Set resource depletion thresholds.
resource-monitor resource resource-name slot slot-number cpu cpu-number by-percent minor-threshold minor-threshold severe-threshold severe-threshold
The default varies by resource type. Use the display resource-monitor command to display the resource depletion thresholds.
3. Specify destinations for resource depletion alarms.
resource-monitor output { netconf-event | snmp-notification | syslog } *
By default, resource depletion alarms are sent to NETCONF, SNMP, and the information center.
4. Enable resending of minor resource depletion alarms.
resource-monitor minor resend enable
By default, resending of minor resource depletion alarms is enabled.
Displaying resource monitoring information
To display resource monitoring information, execute the following command in any view:
display resource-monitor [ resource resource-name ] [ slot slot-number [ cpu cpu-number ] ]
Monitoring device temperature
Setting the temperature alarm thresholds
About this task
The device monitors its temperature based on the following thresholds:
· Low-temperature threshold.
· High-temperature warning threshold.
· High-temperature alarming threshold.
When the device temperature drops below the low-temperature threshold or reaches the high-temperature warning or alarming threshold, the device performs the following operations:
· Sends log messages and traps.
· Sets LEDs on the device panel.
Procedure
1. Enter system view.
system-view
2. Configure the temperature alarm thresholds.
temperature-limit slot slot-number hotspot sensor-number lowlimit warninglimit [ alarmlimit ]
The defaults vary by temperature sensor model. To view the defaults, execute the undo temperature-limit and display environment commands in turn.
The high-temperature alarming threshold must be higher than the high-temperature warning threshold, and the high-temperature warning threshold must be higher than the low-temperature threshold.
Displaying device temperature information
To display device temperature information, execute the following command in any view:
display environment [ slot slot-number ]
Monitoring fans
Setting the port status detection timer
About this task
The device starts a port status detection timer when a port is shut down by a protocol. If the port has been in down state before the timer expires, the device will set the port status to the port's physical status.
Procedure
1. Enter system view.
system-view
2. Set the port status detection timer.
shutdown-interval time
By default, the port status detection timer is 30 seconds.
Setting the hardware resource operating mode
About this task
The device supports multiple hardware resource operating modes. The capacities of the MAC address table, ARP and ND tables, and IPv4 and IPv6 routing tables vary by hardware resource operating mode, as shown in Table 3 and Table 4.
|
Mode |
MAC address table |
ARP/ND table |
Routing tables |
|
|
IPv4 |
IPv6 |
|||
|
MAC |
224K |
28K |
90000 |
90000 |
|
ROUTING |
32K |
28K |
980000 |
980000 |
|
Mode |
MAC address table |
ARP/ND table |
Routing tables |
|
|
IPv4 |
IPv6 |
|||
|
MAC |
128K |
16K |
90000 |
80000 |
|
ROUTING |
8K |
16K |
980000 |
980000 |
Restrictions and guidelines
A hardware resource operating mode change takes effect after you save the running configuration and reboot the device. Before rebooting the device, make sure you know the possible impact on the network.
The table capacities are the maximum sizes in theory. The actual capacities might be different.
The VXLAN feature is not supported when you specify the hardware resource operating mode is MAC.
Procedure
1. Enter system view.
system-view
2. Set the hardware resource operating mode.
hardware-resource switch-mode { MAC | ROUTING }
By default, the hardware resource operating mode is ROUTING.
Verifying and diagnosing transceiver modules
Verifying transceiver modules
About this task
You can use one of the following methods to verify the genuineness of a transceiver module:
· Display the key parameters of a transceiver module, including its transceiver type, connector type, central wavelength of the transmit laser, transfer distance, and vendor name.
· Display its electronic label. The electronic label is a profile of the transceiver module and contains the permanent configuration, including the serial number, manufacturing date, and vendor name. The data was written to the transceiver module or the device's storage component during debugging or testing of the transceiver module or device.
The device regularly checks transceiver modules for their vendor names. If a transceiver module does not have a vendor name or the vendor name is not H3C, the device repeatedly outputs traps and log messages. For information about logging rules, see "Configuring the information center."
Procedure
To verify transceiver modules, execute the following commands in any view:
· Display the key parameters of transceiver modules.
display transceiver interface [ interface-type interface-number ]
· Display the electrical label information of transceiver modules.
display transceiver manuinfo interface [ interface-type interface-number ]
Diagnosing transceiver modules
About this task
The device provides the alarm and digital diagnosis functions for transceiver modules. When a transceiver module fails or is not operating correctly, you can perform the following tasks:
· Check the alarms that exist on the transceiver module to identify the fault source.
· Examine the key parameters monitored by the digital diagnosis function, including the temperature, voltage, laser bias current, TX power, and RX power.
Procedure
To diagnose transceiver modules, execute the following commands in any view:
· Display transceiver alarms.
display transceiver alarm interface [ interface-type interface-number ]
· Display the current values of the digital diagnosis parameters on transceiver modules.
display transceiver diagnosis interface [ interface-type interface-number ]
· Display the versatile diagnostics monitoring (VDM) information of a transceiver module.
display transceiver vdm interface interface-type interface-number vdm-id vdm-id
This command is supported only on the 400G transceiver modules that support CMIS 4.0.
Disabling transceiver module source alarm
About this task
The device regularly checks transceiver modules for their vendor names. If a transceiver module does not have a vendor name or the vendor name is not HPE, the device repeatedly outputs traps and log messages. If the transceiver modules were manufactured or sold by HPE, you can disable transceiver module source alarm.
Restrictions and guidelines
To view the vendor information, use the display transceiver manuinfo command.
Procedure
1. Enter system view.
system-view
2. Disable transceiver module source alarm.
transceiver phony-alarm-disable
By default, transceiver module source alarm is enabled.
Displaying power information for transceiver modules
To display power information for transceiver modules, execute the following command in any view:
display transceiver power [ interface interface-type interface-number ]
Managing 400G transceiver modules
Enabling lanes on 400G transceiver modules
About this task
Use this task only to verify that a transceiver module is normal.
Restrictions and guidelines
Disabling a lane on a transceiver module will stop signal transmission on the lane.
The lane enablement setting is saved in a register on the transceiver module. It is not saved to the configuration file.
Procedure
1. Enter system view.
system-view
2. Enter Ethernet interface view.
interface interface-type interface-number
3. Enable a lane on the transceiver module.
transceiver lane lane-number enable
By default, the lanes on the transceiver module are enabled.
Setting a power mode for 400G transceiver modules
About this task
A transceiver module generally operates in high power mode. If the transceiver module does not work for a long time, you can switch the transceiver module to low power mode to reduce power consumption. In low power mode, the transceiver module does not transmit signals unless you switch the transceiver to high power mode.
Restrictions and guidelines
The power mode setting is saved in a register on the transceiver module. It is not saved to the configuration file.
Procedure
1. Enter system view.
system-view
2. Enter 400-GE Ethernet interface view and its breakout interface view.
interface interface-type interface-number
3. Set a power mode for the transceiver module.
transceiver power-mode { high | low }
The default settings vary by transceiver module model.
Configuring pre-cursor, post-cursor, and amplitude
About this task
Use this task for debugging and testing on high speed signals to achieve optimal link status. The default settings are generally applied. To change the default settings, contact professional engineers to avoid transceiver module exceptions.
Restrictions and guidelines
As a best practice, do not perform this task when the interface is transmitting traffic. This command enables the device to automatically disable and then enable the transceiver module, which affects traffic transmission.
The configuration is saved in a register on the transceiver module. It is not saved to the configuration file.
Procedure
1. Enter system view.
system-view
2. Enter 400-GE Ethernet interface view and its breakout interface view.
interface interface-type interface-number
3. Configure the pre-cursor and post-cursor equalizers, and amplitude for the transceiver module.
transceiver lane [ lane-number ] equalization { precursor precursor-value | postcursor postcursor-value | amplitude amplitude-value }
The default settings vary by transceiver module model.
Displaying 400G transceiver module information
Perform all display tasks in in any view.
· Display the active control information of 400G transceiver modules.
display transceiver active-control interface [ interface-type interface-number ]
· Display the advertising information of 400G transceiver modules.
display transceiver advertising interface [ interface-type interface-number ]
· Display application related information for 400G transceiver modules.
display transceiver application interface [ interface-type interface-number ]
· Display 400G transceiver module status information.
display transceiver status interface [ interface-type interface-number ]
Resetting 400G transceiver modules
About this task
Use this feature only when you cannot troubleshoot transceiver modules by using other methods.
Restrictions and guidelines
This feature will restart transceiver modules.
Procedure
To reset 400G transceiver modules, execute the following command in user view:
reset transceiver interface [ interface-type interface-number]
Specifying a diagnostic selector for a transceiver module
About this task
This task allows you to specify a diagnostic selector for a transceiver module and displays specified diagnostic information.
Restrictions and guidelines
This task is available only for 400G transceiver modules that support CMIS 4.0.
This task settings will be saved in a register of the transceiver module. If the transceiver module has a power loss, the task settings will be cleared. You must reconfigure the task after a power recovery.
Procedure
1. Enter system view.
system-view
2. Enter interface view.
interface interface-type interface-number
3. Specify a diagnostic selector for the transceiver module and display the specified diagnostic information.
transceiver diagnostic selector selector-id
By default, no diagnostic selector is specified for a transceiver module.
Enabling loopback testing on a transceiver module lane
About this task
This task allows you to enable loopback testing on a transceiver module lane and specify the loopback testing mode.
Restrictions and guidelines
This task is available only for 400G transceiver modules that support CMIS 4.0.
This task tests whether messages can be forwarded correctly between the designated transmitter and receiver and helps identify the point of failure when the transceiver module fails to forward messages.
This task settings will be saved in a register of the transceiver module. If the transceiver module has a power loss, the task settings will be cleared. You must reconfigure the task after a power recovery.
Procedure
1. Enter system view.
system-view
2. Enter interface view.
interface interface-type interface-number
3. Enable loopback testing on a transceiver module lane and specify a loopback testing mode.
transceiver lane [ lane-number ] loopback loopback-mode
By default, loopback testing is disabled for transceiver module lanes.
Specifying the signal mode and PRBS pattern for a transceiver module lane
About this task
Perform this task to specify the signal mode and PRBS pattern for a transceiver module lane.
Restrictions and guidelines
This task is available only for 400G transceiver modules that support CMIS 4.0.
This task settings will be saved in a register of the transceiver module. If the transceiver module has a power loss, the task settings will be cleared. You must reconfigure the task after a power recovery.
Procedure
1. Enter system view.
system-view
2. Enter interface view.
interface interface-type interface-number
3. Specify the signal mode and PRBS pattern for a transceiver module lane.
transceiver lane [ lane-number ] pattern [ host-checker | host-generator media-checker | media-generator ] prbs-pattern
The default setting varies by transceiver module model.
Configuring transceiver monitoring
About this task
After transceiver monitoring is enabled, the device samples the parameters of transceiver modules periodically, including the input power and output power of transceiver modules. If a sampled value reaches the alarm threshold, the device generates a log to notify users.
Procedure
1. Enter system view.
system-view
2. Enable transceiver monitoring.
transceiver monitor enable [ grey | tunable ]
By default, transceiver monitoring is disabled.
3. Set the transceiver monitoring interval.
transceiver monitor interval interval
By default, the transceiver monitoring interval is 600 seconds.
Configuring transceiver performance sampling
About this task
If you enable transceiver performance sampling, the device samples transceiver performance information at intervals and save the samples to a buffer. You can use the display transceiver history performance-collection command to view the recent transceiver performance information.
Restrictions and guidelines
This feature is supported only on the default MDC.
This feature is available only for the QSFPDD-400G-ZR transceiver module.
Procedure
1. Enter system view.
system-view
2. Enable transceiver performance sampling.
transceiver performance-collection enable
By default, transceiver performance sampling is disabled.
3. (Optional.) Set the transceiver performance sampling interval.
transceiver performance-collection interval interval
By default, the transceiver performance sampling interval is 15 minutes.
Verifying transceiver performance sampling
To display history performance sampling information of transceiver modules, execute the following command in any view:
display transceiver history performance-collection interface [ interface-type interface-number ]
Displaying device hardware information
To display device hardware information, execute the following command in any view:
display device [ flash | usb ] [ slot slot-number | verbose ]
Displaying device hardware electronic label information
To display hardware electronic label information for the device, execute the following command in any view:
display device manuinfo [ slot slot-number ]
Displaying device hardware alarm information
To display device hardware alarm information, execute the following command in any view:
display alarm [ slot slot-number ]
