- Table of Contents
-
- 13-Network Management and Monitoring Configuration Guide
- 00-Preface
- 01-System maintenance and debugging configuration
- 02-NQA configuration
- 03-iNQA configuration
- 04-Packet trace configuration
- 05-NTP configuration
- 06-PTP configuration
- 07-SNMP configuration
- 08-RMON configuration
- 09-Event MIB configuration
- 10-NETCONF configuration
- 11-Ansible configuration
- 12-SmartMC configuration
- 13-EPA configuration
- 14-CWMP configuration
- 15-EAA configuration
- 16-Process monitoring and maintenance configuration
- 17-Sampler configuration
- 18-Mirroring configuration
- 19-NetStream configuration
- 20-IPv6 NetStream configuration
- 21-sFlow configuration
- 22-Information center configuration
- 23-GOLD configuration
- 24-Packet capture configuration
- 25-VCF fabric configuration
- 26-Cloud connection configuration
- 27-EPS agent configuration
- 28-eMDI configuration
- 29-SQA configuration
- 30-Performance management configuration
- 31-KPI data collection configuration
- Related Documents
-
| Title | Size | Download |
|---|---|---|
| 31-KPI data collection configuration | 180.02 KB |
Configuring KPI data collection
Available data for KPI data collection
KPI data collection tasks at a glance
Copying the KPI data on the standby MPU to the active MPU
Disabling KPI data collection for service modules
Specifying the KPI data collection interval for service modules
Display and maintenance commands for KPI data collection
Display and maintenance commands for EAI
Configuring KPI data collection
About KPI data collection
The key performance indicators (KPIs) of the device are a set of performance values that indicate the device's running status at a certain moment. During operation, the device automatically collects KPI data and stores the KPI data in the flash.
The KPI data collection feature periodically collects various types of KPI data and records the KPI data in real time. Based on the collected KPI data, you can understand the device running status, service failure time, service failure type, and possible failure causes and quickly troubleshoot the issues.
Basic concepts
The KPI data collection feature can collect a vast quantity and variety of data. For example, the collected CPU usage for a card is a performance parameter belonging to the Device-resource class. The CPU usage is a card-specific parameter belonging to the DEV-RES module and its value 50%. To easily describe, categorize, and retrieve all types of data, KPI data is defined from the following dimensions:
· Indicator—Performance parameters and state collected by the KPI data collection feature, such as the CPU usage, memory usage, FIB table usage, ARP table usage, card failures, power supply failures, and abnormal card temperature.
· Object—Physical entities to which the indicators belong, such as devices, cards, and subcards. As the KPI data collection feature can collect more and more indicators, the object types will also become more diverse. The value for the object varies by object type. Available values include:
¡ device—Specifies a device. Indicators for this object describe the overall condition of the device.
¡ chassis.x/slot.y—Specifies a card. Indicators for this object describe the performance of the card. The value for x is 0, and y represents the slot number of the card. (In standalone mode.) x represents the member ID of the IRF member device, and y represents the slot number of the card. (In IRF mode.)
¡ chassis.x/slot.y/subslot.z—Specifies a subcard. Indicators for this object describe the performance of the subcard. The value for x is 0, y represents the slot number of the card, and z represents the subcard ID. (In standalone mode.) x represents the member ID of the IRF member device, y represents the slot number of the card, and z represents the subcard ID. (In IRF mode.)
¡ interface-typeinterface-number—Specifies an interface by its type and number. Indicators for this object describe the running status of the physical interface.
· Module—Service module to which an indicator belongs. For example, the CPU usage and memory usage belong to the device resource (DEV-RES) module. The FIB table usage and ARP table usage belong to the forwarding resource (FWD-RES) module.
· Class—A collection of a certain type of indicators. Some indicators can indicate the running status of a certain aspect of the device. Such indicators can be divided into a class. The system has predefined some classes, such as the network performance (Net-performance) class and port state (Port-state) class.
Operating mechanism
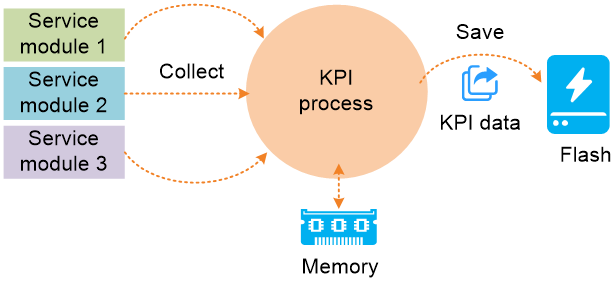
The device enabled with KPI data collection works as follows:
1. Collect KPI data. Enabled with KPI data collection for a service module, the KPI process collects KPI data for the module at intervals and temporarily saves the KPI data in the device memory. By default, the KPI data collection interval is 300 seconds and you can edit the KPI data collection interval as required.
2. Store KPI data. The KPI process stores the collected KPI data in the flash at intervals. When the remaining storage media space is insufficient or the total KPI file size exceeds the threshold, the KPI process automatically deletes the earliest KPI files to release some space.
Available data for KPI data collection
Table 1 Available data for KPI data collection
|
Class |
Module |
Object |
Indicator |
Indicator description |
|
Device-state |
DEV |
Card |
Device_restarts |
Number of device reboots. |
|
IRF |
Device |
IRF_splits |
Number of IRF splits. |
|
|
IRF |
Device |
IRF_dual-active_count |
Number of dual-master IRF fabrics. |
|
|
DEV |
Card |
LPU_failures |
Number of LPU failures. |
|
|
DEV |
Card |
MPU_state |
State of the MPU: · 0—The MPU is not present. · 1—The MPU is operating correctly. · 2—The MPU has failed. |
|
|
DEV |
Card |
MPU_failures |
Number of MPU failures. |
|
|
DEV |
Card |
SFU_state |
State of the SFU: · 0—The SFU is not present. · 1—The SFU is operating correctly. · 2—The SFU has failed. |
|
|
DEV |
Card |
SFU_failures |
Number of SFU failures. |
|
|
DEV |
Subcard |
Subslot_failure |
Number of subcard failures. |
|
|
FWD |
Device |
Inc_H_S_entries |
Inconsistent hardware and software entries. |
|
|
FAN |
Device |
Fan_state |
Fan tray state: · 0—Normal. · 1—Faulty. |
|
|
POWER |
Device |
Power_state |
Power supply state: · 0—Normal. · 1—Faulty. |
|
|
POE |
Device |
PoE_state |
PoE power supply state: · 0—Normal. · 1—Faulty. |
|
|
TEMP |
Device |
Card_temperature |
Card temperature: · 0—Normal. · 1—Faulty. |
|
|
FS |
Device |
File_exceptions |
Number of save operation failures due to file system error. |
|
|
DEV |
Device |
Process_abnormal_reboot |
Number of process reboot failures. |
|
|
DEV |
Device |
Process_normal_reboot |
Number of successful process reboots. |
|
|
Device-resource |
FWD-RES |
Card |
ARP_entry_usage |
Ratio of the real-time ARP entry count to the upper ARP entry count limit. |
|
FWD-RES |
Card |
ARP_threshold_ratio |
Ratio of the real-time ARP entry count to the ARP table usage threshold. |
|
|
FWD-RES |
Card |
MAC entry usage |
Ratio of the real-time MAC entry count to the upper MAC entry count limit. |
|
|
FWD-RES |
Card |
MAC_threshold_ratio |
Ratio of the real-time MAC entry count to the MAC table usage threshold. |
|
|
FWD-RES |
Card |
FIB_entry_usage |
Ratio of the real-time FIB entry count to the upper FIB entry count limit. |
|
|
FWD-RES |
Card |
FIB_threshold_ratio |
Ratio of the real-time FIB entry count to the FIB table usage threshold. |
|
|
FWD-RES |
Card |
ND entry usage |
Ratio of the real-time ND entry count to the upper ND entry count limit. |
|
|
FWD-RES |
Card |
ND_threshold_ratio |
Ratio of the real-time ND entry count to the ND table usage threshold. |
|
|
FWD-RES |
Card |
IPv4L2multicast_usage |
Ratio of the real-time IPv4 Layer 2 multicast entry count to the upper IPv4 Layer 2 multicast entry count limit. |
|
|
FWD-RES |
Card |
IPv4L2multicast_ratio |
Ratio of the real-time IPv4 Layer 2 multicast entry count to the IPv4 Layer 2 multicast entry count threshold. |
|
|
FWD-RES |
Card |
IPv6L2multicast_usage |
Ratio of the real-time IPv6 Layer 2 multicast entry count to the upper IPv6 Layer 2 multicast entry count limit. |
|
|
FWD-RES |
Card |
IPv6L2multicast_ratio |
Ratio of the real-time IPv6 Layer 2 multicast entry count to the IPv6 Layer 2 multicast entry count threshold. |
|
|
FWD-RES |
Card |
IPv4L3multicast_usage |
Ratio of the real-time IPv4 Layer 3 multicast entry count to the upper IPv4 Layer 3 multicast entry count limit. |
|
|
FWD-RES |
Card |
IPv4L3multicast_ratio |
Ratio of the real-time IPv4 Layer 3 multicast entry count to the IPv4 Layer 3 multicast entry count threshold. |
|
|
FWD-RES |
Card |
IPv6L3multicast_usage |
Ratio of the real-time IPv6 Layer 3 multicast entry count to the upper IPv6 Layer 3 multicast entry count limit. |
|
|
FWD-RES |
Card |
IPv6L3multicast_ratio |
Ratio of the real-time IPv6 Layer 3 multicast entry count to the IPv6 Layer 3 multicast entry count threshold. |
|
|
ACL-RES |
Card |
ACL_usage |
Ratio of the real-time ACL entry count to the upper ACL entry count limit. |
|
|
ACL-RES |
Card |
ACL_threshold_ratio |
Ratio of the real-time ACL entry count to the ACL entry count threshold. |
|
|
STOR-RES |
Card |
Storage_usage |
Ratio of the used storage space to the total storage space. |
|
|
STOR-RES |
Card |
Storage_threshold_ratio |
Ratio of the used storage space to the storage space usage threshold. |
|
|
DEV-RES |
Card |
CPU_usage |
Ratio of the used CPU capacity to the total CPU capacity. |
|
|
DEV-RES |
Card |
CPU_threshold_ratio |
Ratio of the used CPU capacity to the CPU usage threshold. |
|
|
DEV-RES |
Card |
Memory_usage |
Ratio of the used memory to the total memory. |
|
|
DEV-RES |
Card |
Memory_threshold_ratio |
Ratio of the used memory to the memory usage threshold. |
|
|
Net-performance |
LOOP-DCT |
Device |
L2 loop_state |
Layer 2 loop state: · 0—The Layer 2 loop is operating correctly. · 1—Layer 2 loop has failed. |
|
IF-CI |
Interface |
Port_congestion |
Number of packets dropped due to traffic congestion. |
|
|
IF-ERROR |
Interface |
Port_error |
Number of packets dropped due to error packets. |
|
|
CPCAR |
Device |
CPCAR_loss |
Number of dropped packets due to traffic policing configured on the control panel. |
|
|
STP-SWT |
Device |
STP_switchovers |
Number of STP switchovers. |
|
|
LACP-SWT |
Device |
LACP_switchovers |
Number of link aggregation switchovers. |
|
|
IRF-SWT |
Device |
IRF_switchovers |
Number of IRF switchovers. |
|
|
M-LAG-SWT |
Device |
M-LAG_switchovers |
Number of M-LAG switchovers. |
|
|
RRPP-SWT |
Device |
RRPP_switchovers |
Number of RRPP switchovers. |
|
|
VRRP-SWT |
Device |
VRRP_switchovers |
Number of VRRP switchovers. |
|
|
IF-USAGE |
Device |
Port_BW_usage |
Bandwidth usage for all ports. |
|
|
Port-state |
PORT-ST |
Device |
Down_ports |
Number of physical interfaces in down state. |
|
PORT-ST |
Device |
Port_flappings |
Number of port flappings. |
|
|
TRAN-ST |
Device |
Opti-module_health |
This indicator is not supported in the current software version. Transceiver module health. |
|
|
Net-connection |
RPNCS |
Device |
ISIS_peer_status |
IS-IS neighbor connection state: · 0—The IS-IS neighbor connection is operating correctly. · 1—The IS-IS neighbor connection has failed. |
|
RPNCS |
Device |
OSPF_peer_status |
OSPF neighbor connection state: · 0—The OSPF neighbor connection is operating correctly. · 1—The OSPF neighbor connection has failed. |
|
|
RPNCS |
Device |
OSPv3_peer_status |
OSPFv3 neighbor connection state: · 0—The OSPFv3 neighbor connection is operating correctly. · 1—The OSPFv3 neighbor connection has failed. |
|
|
RPNCS |
Device |
BGP_peer_status |
BGP neighbor connection state: · 0—The BGP neighbor connection is operating correctly. · 1—The BGP neighbor connection has failed. |
|
|
MCRCS |
Device |
Multicast_connection_status |
Multicast route connection state: · 0—The multicast route connection is operating correctly. · 1—The multicast route connection has failed. |
|
|
DHCPCS |
Device |
DHCPv4_server_state |
Statistics about DHCPv4 server address allocation failures. |
|
|
DHCPCS |
Device |
DHCPv6_server_state |
Statistics about DHCPv6 server address allocation failures. |
|
|
DHCPCS |
Device |
DHCPv4_server_switching |
Number of DHCPv4 server switchovers. |
|
|
DHCPCS |
Device |
DHCPv6_server switching |
Number of DHCPv6 server switchovers. |
|
|
DHCPCS |
Device |
DHCPv4_entry failures |
Number of DHCPv4 entry establishment failures. |
|
|
DHCPCS |
Device |
DHCPv6_entry failures |
Number of DHCPv6 entry establishment failures. |
|
|
Net-securit y |
AAA |
Device |
1X_AuthN_status |
State of 802.1X authentication: · 0—802.1X authentication succeeded. · 1—802.1X authentication failed. An attack might exist. |
|
AAA |
Device |
1X_Usr&Pwd_status |
State of the username and password for 802.1X authentication: · 0—The username and password are correct. · 1—The username and password are incorrect. |
|
|
AAA |
Device |
MAC_AuthN_status |
State of MAC authentication: · 0—MAC authentication succeeded. · 1—MAC authentication failed. An attack might exist. |
|
|
AAA |
Device |
MAC_Usr&Pwd_status |
State of the username and password for MAC authentication: · 0—The username and password are correct. · 1—The username and password are incorrect. |
|
|
AAA |
Device |
Portsec_AuthN_status |
State of the port security authentication: · 0—The authentication succeeded. · 1—The authentication failed. An attack might exist. |
|
|
AAA |
Device |
Portsec_Usr&Pwd_status |
State of the port security access username and password: · 0—The username and password are correct. · 1—The username and password are incorrect. |
|
|
AAA |
Device |
StaticUser_AuthN_status |
State of the static user authentication: · 0—The authentication succeeded. · 1—The authentication failed. An attack might exist. |
|
|
AAA |
Device |
StaticUser_Usr&Pwd_status |
State of the static username and password: · 0—The username and password are correct. · 1—The username and password are incorrect. |
|
|
ATTACK |
Device |
All-type_attacks |
Number of all types of attacks. |
|
|
TCP |
Device |
TCP_attacks |
Number of TCP attacks. |
|
|
ARP-ATK |
Device |
ARP_attacks |
Number of ARP attacks. |
|
|
ND-ATK |
Device |
ND_attacks |
Number of ND attacks. |
|
|
AAA |
Device |
Illegal_user_detections |
Number of illegal user detections. |
Restrictions and guidelines
By default, KPI data collection is enabled for all service modules that support this feature on the device.
To prevent data collection from affecting normal services due to a large amount of data, the KPI data collection feature is suppressed when the device memory or CPU usage reaches the alarm threshold. At the same time, the KPI process stops collecting data. As a best practice, disable KPI data collection for modules other than the DEV-RES module. For detailed information about the alarm thresholds for the device memory and CPU memory, see device management configuration in Fundamentals Configuration Guide.
KPI data collection tasks at a glance
To configure KPI data collection, perform the following tasks:
· (Optional.) Configuring KPI data storage
· (Optional.) Configuring KPI file aging
· (Optional.) Copying the KPI data on the standby MPU to the active MPU
· (Optional.) Disabling KPI data collection for service modules
· (Optional.) Specifying the KPI data collection interval for service modules
Configuring KPI data storage
About this task
The KPI files in the memory are saved to the storage media at intervals. Use this feature to edit the KPI file directory and the interval for saving KPI files to the storage media.
Procedure
1. Enter system view.
system-view
2. Specify the interval for saving KPI files to the storage media.
kpi file save-interval interval
By default, KPI files are saved to the storage media at an interval of 1440 minutes.
3. Specify the KPI file directory.
kpi file directory dir-name
By default, KPI files are saved in the flash:/kpi directory.
Configuring KPI file aging
About this task
When the free storage media space is insufficient or the total KPI file size exceeds the threshold, the KPI process automatically deletes the earliest KPI files to release some space. Use this feature to edit the free storage media capacity threshold and the KPI file size threshold for triggering KPI file aging.
Procedure
1. Enter system view.
system-view
2. Specify the free storage media capacity threshold for triggering KPI file aging.
kpi file aging threshold remain-disk-size size
By default, the free storage media capacity threshold for triggering KPI file aging is 128 MB.
3. Specify the KPI file size threshold for triggering KPI file aging.
kpi file aging threshold total-file-size size
By default, the KPI file size threshold for triggering KPI file aging is 128 MB.
Copying the KPI data on the standby MPU to the active MPU
About this task
After an MPU active/standby switchover on the device, the new active MPU cannot automatically obtain the KPI data from the old active MPU (current standby MPU). To ensure service continuity, you must use this feature to copy the KPI data on the old active MPU to the new active MPU.
|
|
IMPORTANT: If the administrator edits the KPI file directory by using the kpi file directory command before the active/standby switchover, the original active MPU will have two KPI file directories. After the switchover, this feature enables the system to copy only the KPI data stored in the new directory on the old MPU to the same directory on the new active MPU. The KPI data files in the old directory cannot be copied to the new active MPU. |
Procedure
1. Enter system view.
system-view
2. Copy the KPI data in the standby MPU to the active MPU.
kpi copy-file to active-mpu
Disabling KPI data collection for service modules
About this task
To prevent data collection from affecting normal services due to a large amount of data, use this feature to disable KPI data collection for some service modules when the device memory usage or CPU usage is high.
Procedure
1. Enter system view.
system-view
2. Enter probe view.
probe
3. Disable KPI data collection for service modules.
undo kpi system internal collect module [ module-name ] enable
By default, KPI data collection is enabled for all service modules that support this feature on the device.
Specifying the KPI data collection interval for service modules
About this task
You can use this feature to edit the KPI data collection interval for service modules.
Procedure
1. Enter system view.
system-view
2. Enter probe view.
probe
3. Specify the KPI data collection interval for service modules.
kpi system internal module module-name collect-interval collect-interval
By default, the KPI data collection interval is 300 seconds.
Display and maintenance commands for KPI data collection
Execute display commands in any view.
|
Task |
Command |
|
Display the KPI data of service modules and objects for the remote device. |
display external-kpi data [ device-ip ip-address [ module module-name [ object object-name ] ] ] |
|
Display KPI data collection information for service modules. |
display kpi module-info [ module-name ] [ verbose ] |
|
Display the KPI data for service modules and objects within a time range on the storage media. |
display kpi data module module-name object object-name from time1 date1 to time2 date2 [ file file-path ] |
Configuring EAI
About EAI
Embedded Artificial Intelligence (EAI) is a KPI monitoring and prediction technology based on intelligent algorithms. EAI can monitor and predict indicator values in real time based on the history indicator values collected by the KPI data collection feature. It helps the administrator analyze the trend of key indicators on the device and proactively prevent potential failures.
EAI monitoring
Based on the history indicator values collected by the KPI data collection feature, the device dynamically generates reasonable alarm thresholds and recovery thresholds for the indicators in Table 2.
· When an indicator value is out of the alarm threshold range, the device logs the threshold violation event and reports it to an NMS through SNMP.
· When the indicator value restores to be within the alarm threshold range, the device records the recovery event and reports it to an NMS through SNMP.
EAI prediction
Enabled with this feature, the device dynamically calculates and predicts the indicator values 30 days later based on the history KPI data.
· When the predicted indicator value is out of the alarm threshold range, the device logs the threshold violation event and reports it to an NMS through SNMP.
· When the predicted indicator value restores to be within the alarm threshold range, the device logs the recovery and reports it to an NMS through SNMP.
Available indicators for EAI
Table 2 Available indicators for EAI
|
Class |
Module |
Object |
Indicator |
Indicator description |
|
Device-resource |
FWD-RES |
Card |
ARP_entry_usage |
Ratio of the real-time ARP entry count to the upper ARP entry count limit. |
|
FWD-RES |
Card |
MAC_entry_usage |
Ratio of the real-time MAC entry count to the upper MAC entry count limit. |
|
|
FWD-RES |
Card |
FIB_entry_usage |
Ratio of the real-time FIB entry count to the upper FIB entry count limit. |
|
|
FWD-RES |
Card |
ND_entry_usage |
Ratio of the real-time ND entry count to the upper ND entry count limit. |
|
|
FWD-RES |
Card |
IPv4L2multicast_usage |
Ratio of the real-time IPv4 Layer 2 multicast entry count to the upper IPv4 Layer 2 multicast entry count limit. |
|
|
FWD-RES |
Card |
IPv6L2multicast_usage |
Ratio of the real-time IPv6 Layer 2 multicast entry count to the upper IPv6 Layer 2 multicast entry count limit. |
|
|
FWD-RES |
Card |
IPv4L3multicast_usage |
Ratio of the real-time IPv4 Layer 3 multicast entry count to the upper IPv4 Layer 3 multicast entry count limit. |
|
|
FWD-RES |
Card |
IPv6L3multicast_usage |
Ratio of the real-time IPv6 Layer 3 multicast entry count to the upper IPv6 Layer 3 multicast entry count limit. |
|
|
ACL-RES |
Card |
ACL_usage |
Ratio of the real-time ACL entry count to the upper ACL entry count limit. |
|
|
STOR-RES |
Card |
Storage_usage |
Ratio of the used storage space to the total storage space. |
|
|
DEV-RES |
Card |
CPU_usage |
Ratio of the used CPU capacity to the total CPU capacity. |
|
|
DEV-RES |
Card |
Memory_usage |
Ratio of the used memory to the total memory. |
Prerequisites for EAI
Make sure the KPI data collection feature is enabled for service modules in Table 2.
EAI tasks at a glance
To configure EAI, perform the following tasks:
Enabling EAI monitoring
1. Enter system view.
system-view
2. Enter EAI view.
eai artificial intelligence
3. Enable EAI monitoring.
eai monitoring enable
By default, EAI monitoring is disabled.
Enabling EAI prediction
1. Enter system view.
system-view
2. Enter EAI view.
eai artificial intelligence
3. Enable EAI prediction.
eai prediction enable
By default, EAI prediction is disabled.
Display and maintenance commands for EAI
Execute display commands in any view.
|
Task |
Command |
|
Display EAI monitoring information. |
display eai monitoring |
|
Display EAI predicted information and history KPI data. |
display eai prediction |
