- Table of Contents
- Related Documents
-
| Title | Size | Download |
|---|---|---|
| 01-Text | 1.45 MB |
Modify the default password of the admin account
Configure maintenance tag task settings
U-Center 2.0 overview
Product orientation
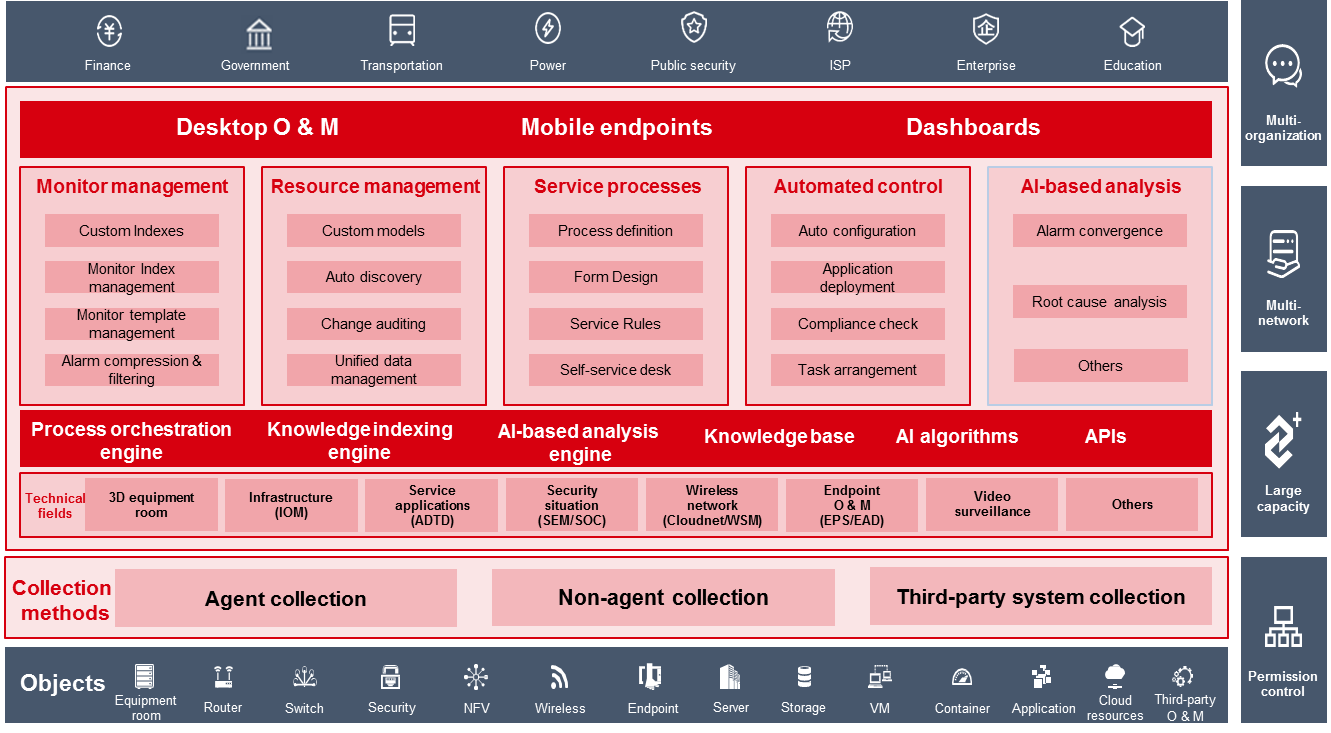
H3C U-Center orients toward the enterprise-level, comprehensive O & M solution in the aspects of monitoring, management, and control. It applies to the multi-organization, multi-network, large capacity, and permission control scenarios, implementing one-stop management for all resources of the cloud, networks, and endpoints. Figure 1 shows the overall framework of U-Center 2.0.
Figure 1 Overall framework of U-Center 2.0
Components
· Configuration Management Database (CMDB)
· Infrastructure Operation Management (IOM)
· IT Service Management (ITSM)
· Business Service Management (BSM)
· User Experience Management (UEM)
· Application Discovery Tracing and Diagnostics (ADTD)
· Network Traffic Analyzer (NTA)
· Automated Operations Management (AOM)
· Synthetic Transaction Monitor (STM)
Capabilities
U-Center 2.0 adopts the microservice infrastructure and containerized Unified Platform. Based on CMDB data, monitor templates, custom indexes, process orchestration engine, and service management, U-Center 2.0 provides the following capabilities:
· Aggregation—Aggregates the cloud, network, endpoint, and security technical fields through the microservice-integrated Unified Platform to implement unified O & M.
· Application—Based on CMDB data and OBASHI methodology (that describes relationships and data flows between services and IT resources), U-Center 2.0 generates topologies for service applications to implement unified resource management.
· AIOps—Adopts big data and machine learning to solve exceptions, predict capacity, and analyze root causes.
· Agility—Uses monitor templates, predefined resource models, custom indexes, and automation for agile product delivery.
Quick start
U-Center 2.0 provides users with an intuitive, interactive Web interface that can be accessed through a Web browser. The following information covers these topics:
· Explore the U-Center 2.0 GUI
Access U-Center 2.0
U-Center 2.0 is developed based on the browser/server model. Users can access U-Center 2.0 directly by entering the URL of the U-Center server in the Web browser.
Table 1 lists the Web browsers supported by U-Center 2.0.
Table 1 Recommended Web browsers
|
Browser |
Version |
|
Chrome |
Chrome 70 or later |
|
Firefox |
Firefox 78 or later |
U-Center 2.0 can be accessed through both HTTP and HTTPS, by using URLs in the following formats:
· http://<IP address>:<port>
· https://<IP address>:<port>
The IP address is the virtual IP address configured in Matrix for northbound services. By default, the port number is 30000, which is configurable during installation.
|
|
NOTE: When you access U-Center 2.0, follow these restrictions and guidelines: · You can use the predefined administrator account (with username admin and password Pwd@12345) for initial access to U-Center 2.0. After login, change the default account password as soon as possible for security purposes. · To view the northbound service virtual IP address, navigate to the DEPLOY > Clusters > Cluster Parameters page in Matrix. |
Explore the U-Center 2.0 GUI
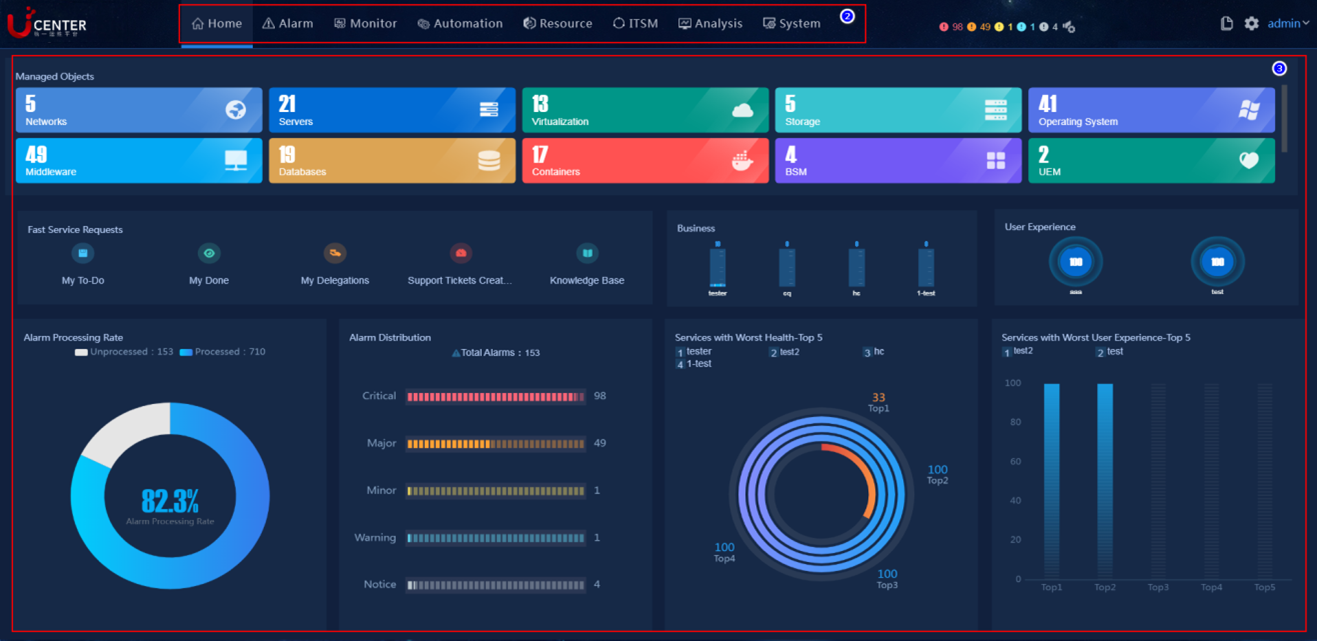
U-Center displays the overview page after you log in.
The U-Center 2.0 overview page contains the top navigation bar and O&M work pane, as shown in Figure 2.
Figure 2 U-Center 2.0 overview page
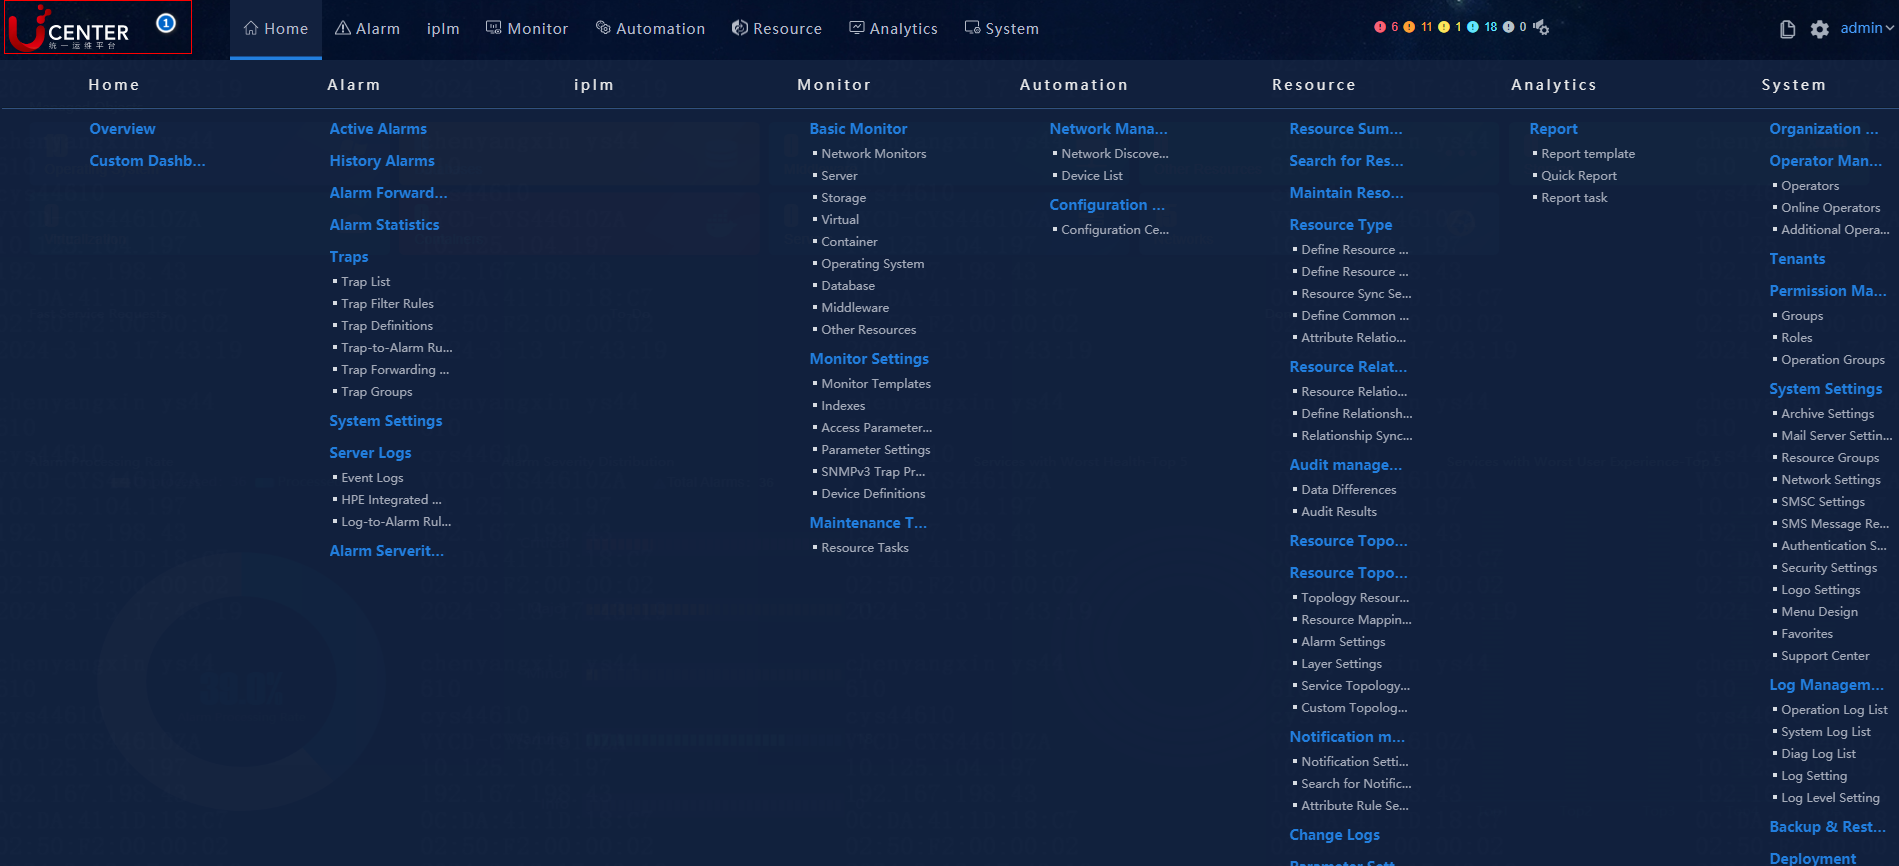
You can hover over the logo in the top left corner to display the U-Center 2.0 function modules, as shown in Figure 3.
Figure 3 U-Center 2.0 function menus
|
|
NOTE: When you configure the U-Center 2.0 function navigation menu, follow these restrictions and guidelines: · To access the dashboard page, click the Custom Dashboard button in the U-Center 2.0 function navigation menu. You can select the dashboard of the global or O&M domain to edit it, or click Create Dashboard to customize and edit the dashboard in the dashboard editor. · To add a new OS performance trend TOPN widget, select Service Widgets from the widget list in the dashboard editor, and then select the OS performance trend TOPN widget to add it to the dashboard. The widget displays information such as CPU usage and memory usage more intuitively on the dashboard for the operating systems monitored by U-Center IOM 2.0. |
|
Item |
Name |
Description |
|
1 |
Logo |
Provides access to all function modules of U-Center 2.0. |
|
2 |
Top navigation bar |
Provides one-key access to the function modules of U-Center. |
|
3 |
O&M work pane |
Displays the objects managed by the system, as well as the alarm information in the network. |
|
4 |
Left navigation pane |
Provides access to all resources and functions pertaining to the function module selected on the top navigation bar. |
|
5 |
Configuration page |
Allows you to configure the objects added to the system. |
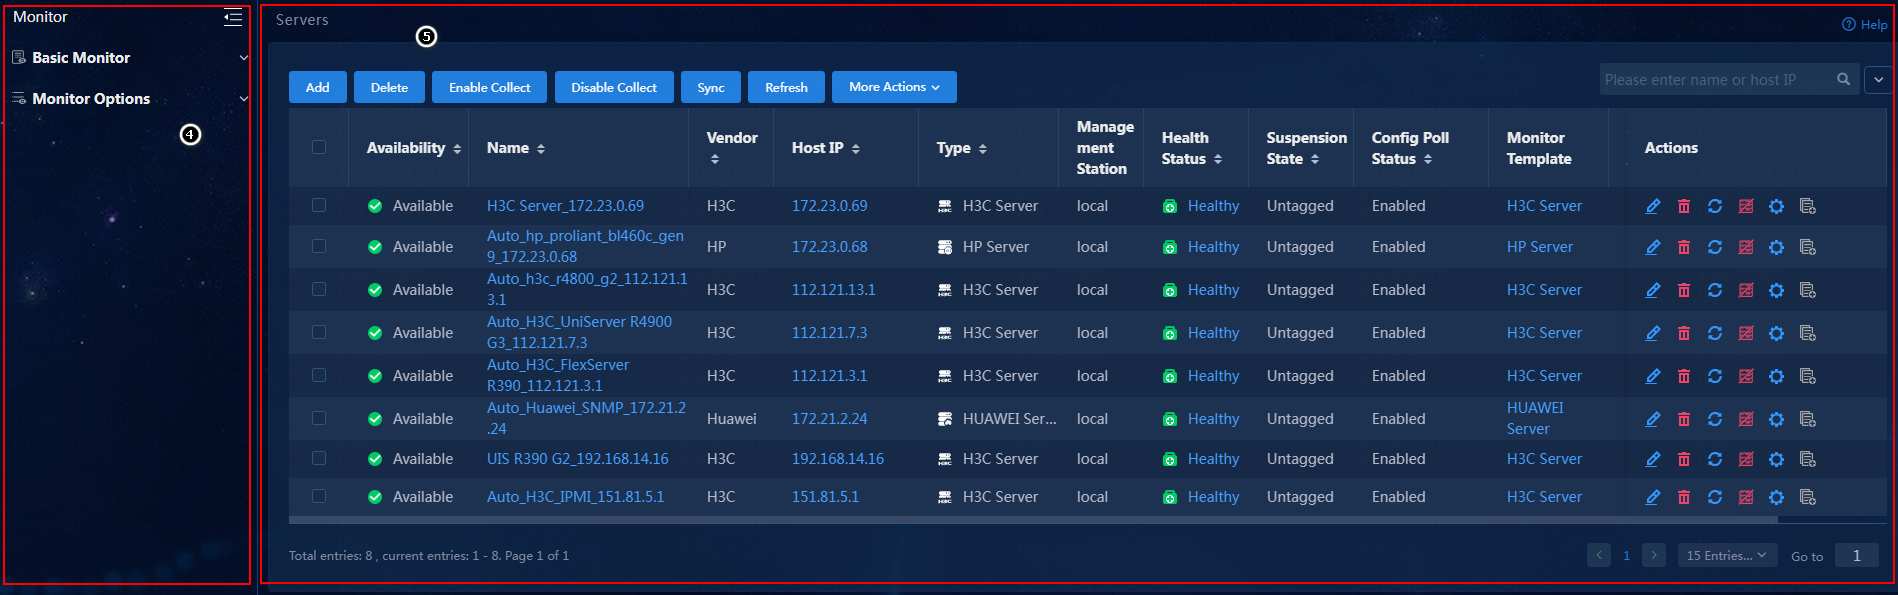
Click a tab on the top navigation bar to open the operation interface of the corresponding function module. For example, to open the Infrastructure Operation Management (IOM) page, click Monitor on the top navigation bar.
Figure 4 Infrastructure Operation Management (IOM) page
You can perform the following tasks on the IOM page:
· Add to favorites: Click ![]() . In the Add to Favorites window that
opens, set the name and folder, and then click OK
to add the menu item of the current page to the system favorites. You can quickly
and easily find commonly used pages from the system favorites. To do that:
. In the Add to Favorites window that
opens, set the name and folder, and then click OK
to add the menu item of the current page to the system favorites. You can quickly
and easily find commonly used pages from the system favorites. To do that:
a. On the top navigation bar, click System.
b. From the navigation pane, select System Settings > Favorites.
c. On this page, view the pages that have been added to favorites.
· Open online help: Click ![]() . In the Help Center window that opens,
you can access the online help for the current page.
. In the Help Center window that opens,
you can access the online help for the current page.
· Change the language between
Chinese and English: Hover over ![]() , and
select Change Language from the drop-down menu to
switch the language between Chinese and English online.
, and
select Change Language from the drop-down menu to
switch the language between Chinese and English online.
· Manage predefined quick reports: On the top navigation bar, click Analytics. From the navigation pane, select Report > Quick Report > Template Management. On this page, you can manage templates for the ticket statistics report and SLA metric achievement statistics report.
· Add alarm forwarding rules through person on duty: On the top navigation bar, click Alarm. From the navigation pane, select Alarm Forwarding Rules. Click Add to access the page for adding an alarm forwarding rule. In the Action Settings area, configure alarm forwarding through person on duty.
· Change view: Hover over ![]() , and select Change View from the
drop-down menu. You can switch the view between operation and universe.
, and select Change View from the
drop-down menu. You can switch the view between operation and universe.
· Enable/disable intelligent
wizard: In universe view, hover over ![]() and
select Intelligent Wizard Setting from the
drop-down menu. In the dialog box that opens, enable or disable the intelligent
wizard.
and
select Intelligent Wizard Setting from the
drop-down menu. In the dialog box that opens, enable or disable the intelligent
wizard.
· Wake up intelligent wizard: With the intelligent wizard enabled, you can click the intelligent wizard icon in the lower right corner of the page in universe view to wake up the intelligent wizard.
· Search in universe view: Search the online help and menus from the intelligent wizard.
Manage operators
U-Center 2.0 implements role-based permission control on operators. An operator with a role has the operation and data permissions on a specific resource type. A role is a collection of permissions. To implement operation and data permission control for an operator, assign permissions to a role, specify the role for a group, and then add the operator to the group.
U-Center 2.0 allows provides various groups for you to add operators and assign permissions to them for implementing secure O & M.
Modify the default password of the admin account
U-Center 2.0 provides a predefined account with login name admin and password Pwd@12345. You can use the account for initial access to U-Center 2.0.
Upon logging in to the system for the first time, you must first change the password for the operator account admin to ensure system security. Use any of the following methods to change the operator password:
· Follow the guide that opens upon login to change the password:
a. After you log in, the system will open the New Password dialog box.
b. Click Change Password Now.
c. In the New Password window that opens, change the password.
d. Click OK.
· Change the password of the current account:
e. Hover over the admin link in the upper right corner of the page.
f. Select New Password from the drop-down menu.
g. In the New Password window that opens, change the password.
h. Click OK.
· Manage the operator:
i. On the top navigation bar, click System.
j. From the navigation pane, select Operator Management > Operators.
k. Click ![]() in the Actions column for the admin operator.
in the Actions column for the admin operator.
l. Turn on the Change
Password option ![]() , and then enter the new password in the Login
Password and Confirm Password fields.
, and then enter the new password in the Login
Password and Confirm Password fields.
m. Click OK.
Add an operator
To manage a medium- or large-sized network, you can add multiple operators with associated permissions for secure O & M.
To add an operator:
1. On the top navigation bar, click System.
2. From the navigation pane, select Operator Management > Operators.
3. Click Add.
4. Configure the basic operator information:
¡ Operator Name: Enter the login account name, a case-insensitive string of at least two characters that can contain only letters, digits, underscores (_), hyphens (-), periods (.), and backslashes (\).
¡ Tenant: Specify a tenant for the operator.
¡ Organization: Specify an organization for the operator.
¡ Authentication Method: Select an authentication method. The system provides the following authentication methods:
- Simple Password Authentication: Requires specifying a password when adding the operator. The operator uses local password authentication for login.
- LDAP/RADIUS/TACACS Authentication: Requires the operator to perform authentication with the associated authentication server for login.
- Third-Party Authentication: Requires the operator to log in through third-party authentication and custom modules. To use this authentication method, you must navigate to the System > System Settings > Authentication Settings page to configure third-party authentication settings.
¡ Login Password: If the simple password authentication method is selected, the login password field will appear. Enter the login password of the operator in this field.
- Confirm Password: If the simple password authentication method is selected, the confirm password field will appear. Confirm the login password of the operator in this field.
¡ Tel: Enter the phone number of the operator. This field is optional.
¡ Email: Enter the Email account of the operator. This field is optional.
5. Configure the advanced operator information:
¡ Last Name: Enter the last name of the operator. This field is optional.
¡ First Name: Enter the first name of the operator. This field is optional.
¡ Full Name: Enter the full name of the operator. This field is optional.
¡ Permitted Login Time Span: Specify a login time range for the operator. The operator is not allowed to log in to the system at a time out of this range.
¡ Description: Enter a description of the operator. The description information facilitates maintenance.
¡ Enable Password Validity Period: When
the simple password authentication method is selected, the Password Validity Period switch will appear. Click ![]() to
limit the password validity period.
to
limit the password validity period.
- Password Validity Period: After the password expires, the operator will be disabled and cannot log in to the system.
- Password Expiration Notification Threshold (Days): When the remaining validity period of a password reaches the threshold, the system sends an alarm to notify the user to change the password each time the user logs in. The system automatically clears the alarm when the password is changed.
¡ Enable Account Validity Period: Click
![]() to limit the validity period of the account.
to limit the validity period of the account.
- Account Expiration Time: After the account expires, the operator will be disabled and cannot log in to the system.
- Account Expiration Notification Threshold (Days): When the remaining validity period for an account reaches the threshold, the system sends an alarm to notify the user to change the account validity period each time the user logs in. The system automatically clears the alarm when the account validity period is changed.
¡ Maximum Concurrent Logins: Set the maximum number of concurrent users that use this operator account. If the number of concurrent users has reached the upper limit, the system blocks the login request of a new user using this account.
6. Configure operator permissions.
¡ By Role Group: Specify role groups for the operator. The operator has the permissions of the specified role groups.
¡ By Role: Specify roles for the operator. The operator has the permissions of the specified roles.
¡ By Direct Assignment: Specify the maximum number of concurrent logins for the operator. If the number of concurrent logins has reached the upper limit, the system will block the login request of the operator.
7. Click OK.
|
|
NOTE: When you add an operator, follow these restrictions and guidelines: · The advanced operator information settings vary by authentication method. · To use the RADIUS, LDAP, or TACACS authentication type, you must configure the authentication server settings on the Authentication Server page. |
Monitor management
Monitor management provided by U-Center 2.0 is typically used to monitor, analyze, and optimize basic infrastructure for key services of enterprises. It helps enterprises enhance the reliability, availability, and continuity of the key services in order to reduce the total cost of ownership (TCO).
Monitor management provides a simple, highly efficient management tool for the increasingly complex IT infrastructures and service environments. It supports long-term monitoring and analysis for basic indexes of IT infrastructures such as server, storage, virtualization, container, operating system, database, and middleware, and can display the monitoring and analysis results as reports from various aspects. It helps administrators obtain the running status of IT infrastructures, fast locate service system faults, and make proper IT resource planning to ensure stable service operation.
Basic monitors
|
|
NOTE: When you configure basic monitors, follow these restrictions and guidelines: · The correct system operation requires permissions of operators on monitor templates and access parameter templates. · The operator must have relevant permissions to perform the add, delete, edit, immediately collect, enable collection, disable collection, import, and change template operations. |
Servers
U-Center 2.0 can monitor various types of servers in terms of CPU status, memory status, disk information, network, power information, fan status, and other indexes, and can send a notification through the alarm module when a monitor index exceeds an alarm threshold.
Table 3 shows the servers that can be monitored by U-Center 2.0.
Table 3 Supported servers
|
Vendor |
Model |
|
HP |
HP Blade Server, HP Integrity Server, HP Server |
|
H3C |
H3C Blade Server, H3C Server |
|
Huawei |
HUAWEI Blade Server, HUAWEI Server |
|
DELL |
Dell Blade Server, Dell Server |
|
Lenovo |
Lenovo Server |
|
IBM |
IBM Server |
|
Inspur |
INSPUR Server |
|
UNISINSIGHT |
Unisit Server |
|
UNIS |
UNIS Blade Server, UNIS Server |
|
ZTE |
ZTE Server |
|
CISCO |
CISCO Server |
|
Sugon |
Sugon Server |
|
Information2 |
i2Box Server |
|
Resolink |
Resolink Server |
|
ChinaTelecom |
ChinaTelecom Server |
|
Enflame |
Enflame Server |
Add a server monitor
This section takes a UniServer R4900 G3 server as an example to illustrate how to add server monitors.
To add a UniServer R4900 G3 server monitor:
1. On the top navigation bar, click Monitor.
2. From the navigation pane, select Basic Monitor > Server.
3. Click Add. In the dialog box that opens, click H3C Server and then click UniServer R4900 G3.
4. On the page that opens, specify the basic information, monitor parameters, access parameters, log access parameters, resource group, and other information for the server:
¡ In the Basic Info area, configure the following parameters:
- IP Address: Enter the IP address of the server.
- Name: Enter the name of the server.
- Description: Enter a description for the server. This field is optional.
¡ In the Monitor Parameters area, configure the following parameters:
- Add as Monitor Object: Specify whether to add a resource as a monitor object. You must add a resource either as a monitor object or a configuration poll object.
- Monitor Template: Specify a monitor template. The template defines monitor indexes and thresholds. You can use the default monitor template. Alternatively, you can click Settings. In the dialog box that opens, select an existing template or click Add to add a target template of the specified type.
- Submodel: Specify the model of the server to be monitored. Click Compute. In the Indexes Not Supported for Collection window that opens, view the details.
- Add as Config Poll Object: Select whether to add configuration polling settings when adding a monitor object. If you select Yes, a successfully added server will be available on both the Monitor and Resource tabs and periodic data collection will be enabled for the server.
- Management Station: Specify the management station for the monitor. The local environment applies by default.
|
|
NOTE: When you configure the monitor parameters, follow these restrictions and guidelines: · To use the Add as Config Poll Object function, you must purchase the corresponding license for the CMDB product to obtain the quantity-based authorization and functional authorization. Without the license, the page does not display the parameter. · Management Station: In the proxy scenario, you must use the proxy to incorporate applications (select proxy as the management station for the monitor). In the region scenario, you must use the region to incorporate applications (select region as the management station for the monitor). For the resources synchronized from the lower-level environment of the region, you can only view and export them in the upper-level environment of the region. The other operations will be skipped. |
¡ In the Access Parameters area, configure the following parameters:
- Monitoring Protocol: Select monitoring protocols. Options include IPMI and SNMP. The default monitoring protocol is IPMI.
- Access Parameter Template: Specify the access parameter template used by the monitor object. You can view or edit the connection parameters for the monitor object. Click Settings. In the dialog box that opens, select an access parameter template. Alternatively, click Add to add an access parameter template.
- Username: Specify the username of a user with permissions to log in to the server HDM.
- Password: Specify the password of the user with permissions to log in to the server HDM.
- Monitor Port: Specify the port number for the UniServer R4900 G3 server to use the IPMI service. The default is 623. You can view or manually edit this port from HDM.
|
|
NOTE: When you configure the access parameters, follow these restrictions and guidelines: · When the server password exceeds 20 characters, passwordless login is not supported. · Passwordless login for servers does not support versions HDM-1.30.xx, and it only supports versions HDM-2.0.xx (xx >= 01) and HDM-1.11.yy (yy >= 36). · When you select SNMP as the monitoring protocol, you can set the access parameter template accordingly and enter the parameter information. · Intelligent Platform Management Interface (IPMI) is a standard for server management systems that enables unified management of different types of server hardware systems. IPMI reads hardware information through a separately power-supplied Baseboard Management Controller (BMC) chip on the motherboard and its proprietary log system. To ensure comprehensive management of information, you might need to supplement IPMI through SNMP and REST APIs due to the proprietary properties of servers from different vendors. · The IPMI protocol mode can only monitor server CPU and memory usage, some system information, physical disk information, services, interfaces, processes, and system time indexes. IPMI cannot monitor other information such as event logs and I/O state. · The interface and process index data might be displayed as 0 because of data collection failure. The actual data might not be 0. · Remote server management relies on the IPMI protocol. To support powering on and off servers, configure the relevant IPMI parameters. · To change the monitor method for an added monitor resource, first click Reset, and then modify the monitor method. |
¡ In the Log Access Parameters area, configure the following parameters:
- Enable Log Monitoring: Specify whether to monitor and collect server logs. With this feature enabled, the server monitor starts monitoring server logs. By default, this feature is disabled.
- Collect All Logs: Specify whether to collect all logs from the server. By default, this feature is disabled, and the server monitor collects only logs generated after the monitor is added. When this feature disabled, see the log-to-alarm rules for the conditions that trigger server log alarms.
- Log Template: Specify a log template that saves log access parameters and enables operators to quickly configure server log-related access parameters. After you enable log monitoring, click Settings. In the dialog box that opens, select an existing template or click Add to add a target template.
- Polling Interval (Min): Specify the polling interval. After you enable log monitoring, you can set the polling interval in minutes. The default value is 30.
|
|
NOTE: When you configure the log access parameters, follow these restrictions and guidelines: · A log template is primarily used to obtain event logs. Only HP or OEM HP servers generate integrated management logs. Since UniServer R4900 G3 is an H3C server, it cannot collect these logs. · If you select to collect all logs after enabling log monitoring, all logs from the server will be collected, including the logs already generated. · If you do not select to collect all logs after enabling log monitoring, only newly generated logs after the monitor is added will be collected. · If you enable log monitoring and select to collect all logs, click the Alarm tab. Then, from the left navigation pane, select Server Logs > Event Logs or Server Logs > HPE Integrated Management Logs to view the collected event logs and HPE integrated management logs. · Access the Alarm > Server Logs > Log-to-Alarm Rules page. On this page, you can set alarm rules based on the event logs and HPE integrated management logs to generate alarms based on alarm rules. |
¡ In the Resource Group area, set the resource group information to facilitate resource management. Specify the resource group to which the current resource belongs. This field is configurable only for an add operation. Click Settings. Select an existing resource group in the dialog box that opens.
¡ In the Others area, select whether or not to enable detection. If you enable detection, the system checks whether it can connect to the monitor, which might slow down the monitor adding speed or cause adding failure.
5. Click Test Connectivity to test the server connectivity and identify whether the parameters are configured successfully.
6. After the test succeeds, click OK.
Edit a server monitor
1. On the top navigation bar, click Monitor.
2. From the navigation pane, select Basic Monitor > Server.
3. Click the Edit icon ![]() in the Actions column for the target sever
monitor.
in the Actions column for the target sever
monitor.
4. On the page that opens, edit the basic information, monitor parameters, access parameters, log access parameters, and other information for the server monitor.
5. Click Test Connectivity to test the server connectivity and identify whether the parameters are configured successfully.
6. Click OK.
Enable log monitoring
1. On the top navigation bar, click Monitor.
2. From the navigation pane, select Basic Monitor > Server.
3. Perform one of the following operations:
¡ To enable log monitoring for one or multiple server monitors, select the server monitors, and then click More Actions > Enable Log Monitoring.
¡ To enable log monitoring for one server monitor, click the Enable Log Monitoring icon ![]() in the Actions column
for the sever monitor.
in the Actions column
for the sever monitor.
Disable log monitoring
1. On the top navigation bar, click Monitor.
2. From the navigation pane, select Basic Monitor > Server.
3. Perform one of the following operations:
¡ To disable log monitoring for one or multiple server monitors, select the server monitors, and then click More Actions > Disable Log Monitoring.
¡ To disable log monitoring for one server monitor, click the Disable Log
Monitoring icon ![]() in
the Actions column for the sever monitor.
in
the Actions column for the sever monitor.
Perform remote operations
To reboot, power on, or power off one or multiple server monitors remotely:
1. On the top navigation bar, click Monitor.
2. From the navigation pane, select Basic Monitor > Server.
3. Classify servers according to the incorporation protocols, and select servers from the server list.
¡ When you use the IPMI protocol to manage server power, you do not need to separately configure IPMI parameters for servers incorporated by using IPMI.
¡ When servers are incorporated by using protocols other than IPMI, such as SNMP and REST, you must separately configure IPMI parameters.
4. Select the server monitors, click More Actions, and select Remote Operations. Select the remote action you want to execute to reboot, power on, or power off the selected monitor objects.
|
|
NOTE: When you perform remote operations, the Kunpeng server series does not support powering on/off or obtaining event logs. |
vKVM
For monitor objects, you can execute out-of-band login and management operations on a universal vKVM remote console.
1. On the top navigation bar, click Monitor.
2. From the navigation pane, select Basic Monitor > Server.
3. Classify servers according to the incorporation protocols, and select servers from the server list.
¡ After
you enable vKVM permission verification on servers incorporated by using IPMI
and REST protocols, click the vKVM ![]() icon to
open the vKVM Permission Verification dialog box.
icon to
open the vKVM Permission Verification dialog box.
- For servers incorporated by using the IPMI protocol, you must enter the username and password for the IPMI protocol.
- For servers incorporated by using the REST protocol, you must enter the username and password for the REST protocol.
- After successful username and password verification, the system automatically starts generating the vKVM file for downloading. When verification fails, the system prompt that the username or password is incorrect in the dialog box.
- With vKVM permission verification
disabled, when you click the vKVM ![]() icon,
the username and password in the server parameter template are directly used.
After verification succeeds, the system starts generating the vKVM file for
downloading. If verification fails, a prompt dialog box opens to prompt a
username or password error.
icon,
the username and password in the server parameter template are directly used.
After verification succeeds, the system starts generating the vKVM file for
downloading. If verification fails, a prompt dialog box opens to prompt a
username or password error.
¡ For
servers incorporated by using the SNMP protocol, regardless of whether vKVM
permission verification is enabled, the vKVM Permission
Verification dialog box will open when you click the vKVM ![]() icon. In the dialog box, you must enter the username and password
of the server management user.
icon. In the dialog box, you must enter the username and password
of the server management user.
|
|
NOTE: When you use the vKVM feature, you must pre-set the related configuration files. When specifying a patch version in the configuration file, use the major version number of the patch (for example, write 1.11.30P05 as 1.11.30).. |
Storage
U-Center 2.0 can monitor various types of storage devices in terms of storage pool/virtual disk, power, fan, disk, storage volume, controller, interface, and other information, and can send a notification through the alarm module when a monitor index exceeds an alarm threshold.
Table 4 shows the storage devices that can be monitored by U-Center 2.0.
Table 4 Supported storage devices
|
Vendor |
Model |
|
H3C |
H3C UniStor CB, H3C UniStor CF2000, H3C UniStor CX2000N, H3C UniStor CB7000, H3C UniStor CB7000_CDP, H3C UniStor CD, H3C UniStor CF22000, H3C UniStor CF5000, H3C UniStor CF6000, H3C UniStor CF8850H, H3C UniStor CH3800, H3C UniStor CP, H3C UniStor CX, H3C UniStor X10000, H3C UniStor X10000C/T/H, H3C ONEStor3.0, H3C ONEStor, H3C P5730, UNISINSGHT |
|
HP |
HPE 3PAR, HPE Nimble HF40, HPE MSA2050, HP Primera, HPE StoreOnce 5200, HP MSA P2000 |
|
Huawei |
HW OceanStor 18500 V3, HW UNIVERSAL, HW OceanStor 5300 V3, Huawei T Series, HW OceanStor 5800 V3, HW OceanStor 9000, HW OceanStor S3900 |
|
ZTE |
ZTE KS3200 |
|
DELL |
DELL Storage Center 2020, DELL EMC SC4020, DELL EMC SC5020, DELL EqualLogic, DELL SC 8000 |
|
EMC |
EMC CLARiiON, EMC VMAX 100K, EMC ISILON, EMC VPLEX, EMC VNX5300 |
|
NETAPP |
NetApp, NetApp AFF A7000 |
|
Quantum |
Quantum Scalar i500 |
|
IBM |
IBM DS series, IBM DS8800, IBM F900, IBM FlashSystem series, IBM SVC, IBM Storwize V series |
|
Hitachi |
HUS110, Hitachi VSP, VSP G200 |
|
VMware |
VMware VSAN |
|
Inspur |
Inspur AS5600 |
|
UNIS |
UNIS X10216, UNIS XC20000 |
|
Common Storage Equipment |
Common Storage Equipment |
|
MacroSAN |
MacroSAN M5520 |
|
Brocade |
Brocade |
Add a storage device monitor
This section takes a ONEStor3.0 storage as an example to illustrate how to add storage device monitors.
To add a ONEStor 3.0 storage monitor:
1. On the top navigation bar, click Monitor.
2. From the navigation pane, select Basic Monitor > Storage.
3. Click Add. In the dialog box that opens, select H3C ONEStor3.0 from the H3C category.
4. On the page that opens, specify the basic information, monitor parameters, access parameters, resource group, and other information for the storage device monitor:
¡ In the Basic Info area, configure the following parameters:
- IP Address: Enter the IP address of the storage device.
- Name: Enter the name of the storage device.
- Description: Enter a description for the storage device. This field is optional.
¡ In the Monitor Parameters area, configure the following parameters:
- Add as Monitor Object: Specify whether to add a resource as a monitor object. You must add a resource either as a monitor object or a configuration poll object.
- Monitor Template: Specify a monitor template. The template defines monitor indexes and thresholds. You can use the default monitor template. Alternatively, you can click Settings. In the dialog box that opens, select an existing template or click Add to add a target template of the specified type.
- Add as Config Poll Object: Select whether to add configuration polling settings when adding a monitor object. If you select Yes, a successfully added storage device will be available on both the Monitor and Resource tabs and periodic data collection will be enabled for the storage device.
- Management Station: Specify the management station for the monitor. The local environment applies by default.
|
|
NOTE: When you configure the monitor parameters, follow these restrictions and guidelines: · To use the Add as Config Poll Object function, you must purchase the corresponding license for the CMDB product to obtain the quantity-based authorization and functional authorization. Without the license, the page does not display the parameter. · Management Station: In the proxy scenario, you must use the proxy to incorporate applications (select proxy as the management station for the monitor). In the region scenario, you must use the region to incorporate applications (select region as the management station for the monitor). For the resources synchronized from the lower-level environment of the region, you can only view and export them in the upper-level environment of the region. The other operations will be skipped. |
¡ In the Access Parameters area, configure the following parameters:
- Monitoring Protocol: The default monitoring protocol is Rest General.
- Access Parameter Template: Specify the access parameter template used by the monitor object. You can view or edit the connection parameters for the monitor object. Click Settings. In the dialog box that opens, select an access parameter template. Alternatively, click Add to add an access parameter template.
- Username: Username used by the ONEStor3.0 storage device.
- Password: Password used by the ONEStor3.0 storage device.
- Protocol: Network protocol used by the ONEStor3.0 storage device. The default is HTTP.
- Monitor Port: Port number used by the ONEStor 3.0 storage device. The default is 80.
- Connection TimeOut (s): Set the connection timeout timer for establishing a connection to the monitored device. The default is 20 seconds.
- Query TimeOut (s): Set the query timeout timer for collecting data from the monitored device. The default is 60 seconds.
|
|
NOTE: When you configure the access parameters, follow these restrictions and guidelines: · The username and password of an operator are required to configure a storage monitor through REST. · Certain index data might be displayed as 0 because of data collection failure through REST. The actual data might not be 0. |
¡ In the Resource Group area, set the resource group information to facilitate resource management. Specify the resource group to which the current resource belongs. This field is configurable only for an add operation. Click Settings. Select an existing resource group in the dialog box that opens.
¡ In the Others area, select whether or not to enable detection. If you enable detection, the system tests connectivity to a monitor object when you add that object. This can cause the system to take more time to add the object.
5. Click Test Connectivity to test the storage device connectivity and identify whether the parameters are configured successfully.
6. After the test succeeds, click OK.
Edit a storage device monitor
1. On the top navigation bar, click Monitor.
2. From the navigation pane, select Basic Monitor > Storage.
3. Click the Edit icon ![]() in the Actions column for the target storage
device monitor.
in the Actions column for the target storage
device monitor.
4. On the page that opens, edit the basic information, monitor parameters, access parameters, and other information for the storage device monitor.
5. Click Test Connectivity to test the storage device connectivity and identify whether the parameters are configured successfully.
6. Click OK.
Virtualization
The monitor component can monitor virtualization devices such as VMware, HyperV, and KVM. This helps operators obtain virtualization device resource (CPU, memory, network, and storage, for example) usage information, and provides basis for fault location, usage efficiency evaluation, and infrastructure optimization for virtualization devices.
Table 5 shows the virtualization devices that can be monitored by U-Center 2.0.
Table 5 Virtualization device models that can be monitored
|
Virtualization monitoring method |
Virtualization device models |
|
Virtual device monitor |
CAS cluster, Citrix XenServer, CloudOS, CloudOS7, HW FusionComputer, Hyper-V, KVM, NEW CAS cluster, UIS, VMware vCenter, VMware ESX |
Add a virtualization monitor
This section takes CAS cluster as an example to illustrate how to add virtualization device monitors.
To add a CAS cluster monitor:
1. On the top navigation bar, click Monitor.
2. From the navigation pane, select Basic Monitor > Virtual.
3. Click Add and select the CAS Cluster type in the Virtual Device Monitor category.
4. On the page that opens, specify the basic information, monitor parameters, access parameters, resource group, and other information for the virtualization monitor:
¡ In the Basic Info area, configure the following parameters:
- IP Address: Enter the IP address of the CAS cluster.
- Name: Enter the name of the CAS cluster.
- Description: Enter a description for the CAS cluster. This field is optional.
¡ In the Monitor Parameters area, configure the following parameters:
- Add as Monitor Object: Specify whether to add a resource as a monitor object. You must add a resource either as a monitor object or a configuration poll object.
- Monitor Template: Specify a monitor template. The template defines monitor indexes and thresholds. You can use the default monitor template. Alternatively, you can click Settings. In the dialog box that opens, select an existing template or click Add to add a target template of the specified type.
- Add as Config Poll Object: Select whether to add configuration polling settings when adding a monitor object. If you select Yes, a successfully added virtualization device will be available on both the Monitor and Resource tabs and periodic data collection will be enabled for the virtualization device.
- Management Station: Specify the management station for the monitor. The local environment applies by default.
|
|
NOTE: When you configure the monitor parameters, follow these restrictions and guidelines: · To use the Add as Config Poll Object function, you must purchase the corresponding license for the CMDB product to obtain the quantity-based authorization and functional authorization. Without the license, the page does not display the parameter. · Management Station: In the proxy scenario, you must use the proxy to incorporate applications (select proxy as the management station for the monitor). In the region scenario, you must use the region to incorporate applications (select region as the management station for the monitor). For the resources synchronized from the lower-level environment of the region, you can only view and export them in the upper-level environment of the region. The other operations will be skipped. |
¡ In the Access Parameters area, configure the following parameters:
- Monitoring Protocol: Specify the monitoring protocol. The default protocol is CAS Cluster.
- Access Parameter Template: Specify the access parameter template used by the monitor object. You can view or edit the connection parameters for the monitor object. Click Settings. In the dialog box that opens, select an access parameter template. Alternatively, click Add to add an access parameter template.
- Username: Username used by the CAS cluster.
- Password: Password used by the CAS cluster.
- Monitor Port: Monitor port used by the CAS cluster. The default port number is 8080.
|
|
NOTE: When you configure the access parameters, follow these restrictions and guidelines: · U-Center 2.0 supports monitoring CAS clusters of version 3.0. · As a best practice, monitor a CAS Cluster running a version later than E0535 as a NEW CAS Cluster resource. · The field group of Host Overview is different from the field group of Host Basic on the resource report page. The former is attached directly to a host pool, but the latter is all physical hosts in a host pool. · To use U-Center 2.0 to collect VM IPs, install CAStools. |
¡ In the Resource Group area, set the resource group information to facilitate resource management. Specify the resource group to which the current resource belongs. This field is configurable only for an add operation. The operator group to which the account monitoring the CAS cluster belongs must have the privilege of resource authorization and management for host pools under cloud resources. You can configure privileges on the CAS management console page. Click Settings. Select a resource group in the Select Resource Group window that opens. Select an existing resource group in the dialog box that opens.
¡ In the Others area, select whether or not to enable detection. If you enable detection, the system identifies whether it can connect to the monitor object. The detection operation takes more time for the system to add a monitor.
5. Click Test Connectivity to test the virtualization device connectivity and identify whether the parameters are configured successfully.
6. After the test succeeds, click OK.
Edit a virtualization monitor
1. On the top navigation bar, click Monitor.
2. From the navigation pane, select Basic Monitor > Virtual.
3. Click the Edit icon ![]() in the Actions column for the target virtualization monitor.
in the Actions column for the target virtualization monitor.
4. On the page that opens, edit the basic information, monitor parameters, access parameters, and other information for the virtualization monitor.
5. Click Test Connectivity to test the virtualization device connectivity and identify whether the parameters are configured successfully.
6. Click OK.
Container
The monitor component can monitor various container resources, including Kubernetes and Docker. This helps operators obtain container resource (CPU, memory, and network, for example) usage information, and provides basis for container fault location, usage efficiency evaluation, and container orchestration optimization.
Table 6 shows the containers that can be monitored by U-Center 2.0.
Table 6 Container models that can be monitored
|
Container monitoring method |
Container models |
|
Container monitor |
Docker, Kubernetes cluster, Kubernetes container, Kubernetes master |
Add a container monitor
This section takes Kubernetes cluster as an example to illustrate how to add container monitors.
To add a Kubernetes cluster monitor:
1. On the top navigation bar, click Monitor.
2. From the navigation pane, select Basic Monitor > Container.
3. Click Add and select the Kubernetes Cluster type in the Container Monitor category.
4. On the page that opens, specify the basic information, monitor parameters, access parameters, resource group, and other information for the container monitor:
¡ In the Basic Info area, configure the following parameters:
- IP Address: Enter the IP address of the Kubernetes cluster.
- Name: Enter the name of the Kubernetes cluster.
- Description: Enter a description for the Kubernetes cluster. This field is optional.
¡ In the Monitor Parameters area, configure the following parameters:
- Add as Monitor Object: Specify whether to add a resource as a monitor object. You must add a resource either as a monitor object or a configuration poll object.
- Monitor Template: Specify a monitor template. The template defines monitor indexes and thresholds. You can use the default monitor template. Alternatively, you can click Settings. In the dialog box that opens, select an existing template or click Add to add a target template of the specified type.
- Add as Config Poll Object: Select whether to add configuration polling settings when adding a monitor object. If you select Yes, a successfully added container will be available on both the Monitor and Resource tabs and periodic data collection will be enabled for the container.
- Management Station: Specify the management station for the monitor. The local environment applies by default.
|
|
NOTE: When you configure the monitor parameters, follow these restrictions and guidelines: · To use the Add as Config Poll Object function, you must purchase the corresponding license for the CMDB product to obtain the quantity-based authorization and functional authorization. Without the license, the page does not display the parameter. · Management Station: In the proxy scenario, you must use the proxy to incorporate applications (select proxy as the management station for the monitor). In the region scenario, you must use the region to incorporate applications (select region as the management station for the monitor). For the resources synchronized from the lower-level environment of the region, you can only view and export them in the upper-level environment of the region. The other operations will be skipped. |
¡ In the Access Parameters area, configure the following parameters:
- Monitoring Protocol: Specify the monitoring protocol. The default protocol is Kubernetes Cluster.
- Access Parameter Template: Specify the access parameter template used by the monitor object. You can view or edit the connection parameters for the monitor object. Click Settings. In the dialog box that opens, select an access parameter template. Alternatively, click Add to add an access parameter template.
- Monitor Port: Enter the monitor port number of the Kubernetes cluster. Typically, the value is usually 8080 for HTTP and 6443 for HTTPS.
- Kube-apiserver Protocol: Specify a protocol used to access the Kubernetes cluster. Options are HTTP and HTTPS. The default is HTTP.
- Kube-apiserver AuthN Mode: Select an authentication mode. Options are None, Basic Authentication, and Token Authentication. The default authentication mode is None.
|
|
NOTE: To determine the authentication mode and port of a Kubernetes cluster in the actual environment, view the /etc/kubernetes/manifests/kube-apiserver.yaml file. When adding a Kubernetes cluster monitor, configure the access parameters according to the selected authentication mode as follows: · None for authentication mode: Select HTTP for the protocol. Typically, set the application monitor port to 8080, and you do not need to configure a username, password, or token. · Basic Authentication for authentication mode: Select HTTPS for the protocol. Typically, set the application monitor port to 6443, and you must configure the username and password. · Token Authentication for authentication mode: Select HTTPS for the protocol. Typically, set the application monitor port to 6443, and you must configure the token. |
¡ In the Resource Group area, set the resource group information to facilitate resource management. Specify the resource group to which the current resource belongs. This field is configurable only for an add operation. Click Settings. Select an existing resource group in the dialog box that opens.
¡ In the Others area, select whether or not to enable detection. If you enable detection, the system identifies whether it can connect to the monitor object. The detection operation takes more time for the system to add a monitor.
5. Click Test Connectivity to test the container connectivity and identify whether the parameters are configured successfully.
6. After the test succeeds, click OK.
Edit a container monitor
1. On the top navigation bar, click Monitor.
2. From the navigation pane, select Basic Monitor > Container.
3. Click the Edit icon ![]() in the Actions column for the target container monitor.
in the Actions column for the target container monitor.
4. On the page that opens, edit the basic information, monitor parameters, access parameters, and other information for the container monitor.
5. Click Test Connectivity to test the container connectivity and identify whether the parameters are configured successfully.
6. Click OK.
Operating system
The monitor component can monitor various types of operating systems in terms of their CPU usage, memory usage, disk usage, system load, network interfaces, and server processes, and can send a notification through the alarm module when a monitor index exceeds an alarm threshold.
Table 7 shows the operating systems that can be monitored by U-Center 2.0.
Table 7 Operating systems models that can be monitored
|
Operating system monitor method |
Operating system models |
|
Windows server monitor |
Windows |
|
Unix server monitor |
AIX, FreeBSD, HP-UX, Mac OS, OpenBSD, SCO UNIX, Solaris |
|
Linux server monitor |
NeoKylin, Kylin, Linux, Rocky, Suse |
Add an OS monitor
This section takes Windows OS monitor as an example to illustrate how to add OS monitors.
To add a Windows OS monitor:
1. On the top navigation bar, click Monitor.
2. From the navigation pane, select Basic Monitor > Operating System.
3. Click Add and select the Windows type in the Windows Server Monitor category.
4. On the page that opens, specify the basic information, monitor parameters, access parameters, resource group, and other information for the Windows OS monitor:
¡ In the Basic Info area, configure the following parameters:
- IP Address: Enter the IP address of the Windows OS.
- Name: Enter the name of the Windows OS.
- Description: Enter a description for the Windows OS. This field is optional.
¡ In the Monitor Parameters area, configure the following parameters:
- Add as Monitor Object: Specify whether to add a resource as a monitor object. You must add a resource either as a monitor object or a configuration poll object.
- Monitor Template: Specify a monitor template. The template defines monitor indexes and thresholds. You can use the default monitor template. Alternatively, you can click Settings. In the dialog box that opens, select an existing template or click Add to add a target template of the specified type.
- Add as Config Poll Object: Select whether to add configuration polling settings when adding a monitor object. If you select Yes, a successfully added operating system will be available on both the Monitor and Resource tabs and periodic data collection will be enabled for the operating system.
- Management Station: Specify the management station for the monitor. The local environment applies by default.
|
|
NOTE: When you configure the monitor parameters, follow these restrictions and guidelines: · To use the Add as Config Poll Object function, you must purchase the corresponding license for the CMDB product to obtain the quantity-based authorization and functional authorization. Without the license, the page does not display the parameter. · Management Station: In the proxy scenario, you must use the proxy to incorporate applications (select proxy as the management station for the monitor). In the region scenario, you must use the region to incorporate applications (select region as the management station for the monitor). For the resources synchronized from the lower-level environment of the region, you can only view and export them in the upper-level environment of the region. The other operations will be skipped. |
¡ In the Access Parameters area, configure the following parameters:
- Monitoring Protocol: Specify the monitoring protocol. Options include WMI and SNMP.
- Access Parameter Template: Specify the access parameter template used by the monitor object. You can view or edit the connection parameters for the monitor object. Click Settings. In the dialog box that opens, select an access parameter template. Alternatively, click Add to add an access parameter template.
- Username: Specify the name of the management user used for monitoring the operating system.
- Password: Specify the password of the management user used for monitoring the operating system.
|
|
NOTE: When you configure the access parameters, follow these restrictions and guidelines: · You can use the SNMP protocol method to monitor only the CPU and memory usage, partial system information, physical disk information, services, interfaces, processes, and system time. Other information, including event log and I/O state, cannot be monitored through SNMP. · The interface and process index data might be displayed as 0 because of data collection failure. The actual data might not be 0. · Through SNMP, the system can obtain only the running status of Windows operating systems. · The unit for the system operation duration index is second. · To monitor Windows server 2012, you must first enable Remote Registry on the servers. · To configure monitoring of servers of Windows Server 2008 or a later version, make sure your account has the Windows administrator role. · To change the monitor method for an added monitor resource, first click Reset, and then modify the monitor method. · If you monitor Windows Server 2003 or Windows Server 2008 by using the WMI protocol, you cannot monitor listening ports, remote ports, or connected ports. |
¡ In the Resource Group area, set the resource group information to facilitate resource management. Specify the resource group to which the current resource belongs. This field is configurable only for an add operation. Click Settings. Select an existing resource group in the dialog box that opens.
¡ In the Others area, select whether or not to enable detection. If you enable detection, the system identifies whether it can connect to the monitor object. The detection operation takes more time for the system to add a monitor.
5. Click Test Connectivity to test the operating system connectivity and identify whether the parameters are configured successfully.
6. After the test succeeds, click OK.
Edit an OS monitor
1. On the top navigation bar, click Monitor.
2. From the navigation pane, select Basic Monitor > Operating System.
3. Click the Edit icon ![]() in the Actions column for the target OS monitor.
in the Actions column for the target OS monitor.
4. On the page that opens, edit the basic information, monitor parameters, access parameters, and other information for the OS monitor.
5. Click Test Connectivity to test the operating system connectivity and identify whether the parameters are configured successfully.
6. Click OK.
Databases
The system can monitor various databases in terms of database, session, and cache details, and can send a notification through the alarm module when a monitor index exceeds an alarm threshold.
Table 8 shows the databases that can be monitored by U-Center 2.0.
Table 8 Supported database models
|
Monitor category |
Database models |
|
Database server monitor |
Cache, Cache 2010, H3C DataEngine, DBaaS, Cloudnet, DB2, DB2 DPF, DB2 v11, Dameng database, SeaSQL DRDS, Elastic Search, GBase, SAP HAHA, HBase, Informix, Kingbase, Kingbase V8, MemCached, MongoDB, SQL Server, MySQL, MySQL8, Oracle ASM, Oracle, Oracle PDB, PostgreSQL, Redis, SeaSQL MPP, Shentong, Sybase, and Xugu. |
Add a database monitor
This section takes H3C DataEngine as an example to illustrate how to add database monitors.
To add an H3C DataEngine monitor:
1. On the top network navigation bar, click Monitor. From the navigation pane, click Basic Monitor > Database.
2. Click Add to select the H3C DataEngine type in the Database Server Monitor category.
3. On the page that opens, specify the basic information, monitor parameters, access parameters, resource group, and other information for H3C DataEngine:
¡ In the Basic Info area, set the IP address, name, and description.
- IP Address: Enter an IP address of the database.
- Name: Enter the name of the database.
- Description: Enter a description for the database.
¡ In the Monitor Parameters area, configure whether to add as monitored object and add as config poll object, and set the monitor template and management station.
- Add as Monitor Object: Select whether to add resource objects as monitor objects. You must enable Add as Monitor Object, Add as Config Poll Object, or both.
- Monitor Template: Specify a monitor template. The template defines monitor indexes and thresholds. You can use the default monitor template. Alternatively, you can click Settings. In the dialog box that opens, select an existing template or click Add to add a target template of the specified type.
- Add as Config Poll Object: Select whether to add configuration polling settings when adding a monitor object. If you select Yes, a successfully added database will be available on both the Monitor and Resource tabs and periodic data collection will be enabled for the container.
- Management Station: Specify the management station for the monitor. The local environment applies by default.
|
|
NOTE: When you configure the monitor parameters, follow these restrictions and guidelines: · To use the Add as Config Poll Object function, you must purchase the corresponding license for the CMDB product to obtain the quantity-based authorization and functional authorization. Without the license, the page does not display the parameter. · Management Station: In the proxy scenario, you must use the proxy to incorporate applications (select proxy as the management station for the monitor). In the region scenario, you must use the region to incorporate applications (select region as the management station for the monitor). For the resources synchronized from the lower-level environment of the region, you can only view and export them in the upper-level environment of the region. The other operations will be skipped. |
¡ In the Access Parameters area, configure the monitoring protocol, access parameter template, username, password, and monitor port:
- Monitoring Protocol: Specify the monitoring protocol. The default protocol is H3C DataEngine.
- Access Parameter Template: Specify the access parameter template used by the monitor object. You can view or edit the connection parameters for the monitor object. Click Settings. In the dialog box that opens, select an access parameter template. Alternatively, click Add to add an access parameter template.
- Username: Username used by H3C DataEngine.
- Password: Password used by H3C DataEngine.
- Monitor Port: Monitor port used by H3C DataEngine. The default setting is 443.
¡ In the Resource Group area, set the resource group information to facilitate resource management. Specify the resource group to which the current resource belongs. This field is configurable only for an add operation. Click Settings. Select an existing resource group in the dialog box that opens.
4. In the Others area, select whether or not to enable detection. If you enable detection, the system identifies whether it can connect to the monitor object. The detection operation takes more time for the system to add a monitor.
5. Click Test Connectivity to test the database connectivity and identify whether the parameters are configured successfully.
6. After the test succeeds, click OK.
Edit a database monitor
Perform this task to edit an existing database monitor.
To edit a database monitor:
1. On the top network navigation bar, click Monitor. From the navigation pane, click Basic Monitor > Database.
2. Click the Edit ![]() icon in
the Actions column for a monitor object.
icon in
the Actions column for a monitor object.
3. On the page that opens, edit the basic information, monitor parameters, access parameters, and other information for the database monitor.
4. Click Test Connectivity to test the database connectivity and identify whether the parameters are configured successfully.
5. Click OK.
Middleware
The system supports proactively monitoring various types of middleware servers in terms of their CPU usage and memory usage, and can send a notification through the alarm module when a monitor index exceeds an alarm threshold.
Table 9 shows the middleware that can be monitored by U-Center 2.0.
Table 9 Supported middleware models
|
Monitor category |
Middleware models |
|
Middleware/Portal monitor |
ActiveMQ, Etcd, Flume, H3C SDN, Hadoop, Kafka, Oracle GoldenGate, RabbitMQ, TongLINK/Q, Tuxedo, WebSphere MQ, and Zookeeper. |
|
Application server monitor |
Apusic Server, .NET Server, GlassFish Server, JBoss Server, Jetty, Lotus Domino Server, Lync 2013 Server, Resin, Solr, Storm, Tomcat Server, Tongweb Server, Wildfly Server, WebLogic Server, and WebSphere Server. |
|
Web server monitor |
Apache Server, IIS Server, Nginx Server, and PHP. |
|
Mail server monitor |
Exchange 2010, Exchange 2016, POP3, and SMTP. |
Add a middleware monitor
This section takes an H3C SDN middleware monitor as an example to illustrate how to add middleware monitors.
To add an H3C SDN middleware monitor:
1. On the top network navigation bar, click Monitor. From the navigation pane, click Basic Monitor > Middleware.
2. Click Add. In the dialog box that opens, select H3C SDN from the Middleware/Portal Monitor category.
3. On the page that opens, specify the basic information, monitor parameters, access parameters, resource group, and other information for the H3C SDN middleware monitor:
¡ In the Basic Info area, set the IP address, name, and description.
- IP Address: Enter an IP address of the middleware.
- Name: Enter the name of the middleware.
- Description: Enter a description for the middleware.
¡ In the Monitor Parameters area, configure whether to add as monitor object and add as config poll object, and set the monitor template and management station.
- Add as Monitor Object: Select whether to add resource objects as monitor objects. You must enable Add as Monitor Object, Add as Config Poll Object, or both.
- Monitor Template: Specify a monitor template. The template defines monitor indexes and thresholds. You can use the default monitor template. Alternatively, you can click Settings. In the dialog box that opens, select an existing template or click Add to add a target template of the specified type.
- Add as Config Poll Object: Select whether to add configuration polling settings when adding a monitor object. If you select Yes, a successfully added middleware will be available on both the Monitor and Resource tabs and periodic data collection will be enabled for the middleware.
- Management Station: Specify the management station for the monitor. The local environment applies by default.
|
|
NOTE: When you configure the monitor parameters, follow these restrictions and guidelines: · To use the Add as Config Poll Object function, you must purchase the corresponding license for the CMDB product to obtain the quantity-based authorization and functional authorization. Without the license, the page does not display the parameter. · Management Station: In the proxy scenario, you must use the proxy to incorporate applications (select proxy as the management station for the monitor). In the region scenario, you must use the region to incorporate applications (select region as the management station for the monitor). For the resources synchronized from the lower-level environment of the region, you can only view and export them in the upper-level environment of the region. The other operations will be skipped. |
¡ In the Access Parameters area, configure the monitoring protocol, access parameter template, username, password, monitor port, protocol, installation method, and H3C SDN version.
- Monitoring Protocol: Specify the monitoring protocol. The default protocol is H3C SDN.
- Access Parameter Template: Specify the access parameter template used by the monitor object. You can view or edit the connection parameters for the monitor object. Click Settings. In the dialog box that opens, select an access parameter template. Alternatively, click Add to add an access parameter template.
- Username: Enter the H3C SDN username. Unified Platform requires the system management group permissions. The Rpm installation package requires the administrator permissions. SNA Center requires the system administrator permissions.
- Password: Enter the password for H3C SDN.
- Monitor Port: Enter the monitor port number of H3C SDN. The default setting is 8080.
- Protocol: Specify a protocol. Options are HTTP and HTTPS. The default is HTTP.
- Install Method: Select an installation method. Options are Rpm installation package, SNA Center, and Unified Platform. The default setting is Rpm installation package.
- H3C SDN Version: Select the version before E3201 or version E3201 and later. The default setting is the version before E3201.
|
|
NOTE: When you configure the access parameters, follow these restrictions and guidelines: · To avoid affecting SDN performance, set a collection of 10 or more minutes for the firewall, firewall policy, and firewall rule collection units. · To obtain controller-associated information, make sure the controller IP and is consistent with that of the server where the controller resides. · The system supports monitoring SDN versions E2507, E3106P12, E3106P16, E3106P22, E3216, and E6109. |
¡ In the Resource Group area, set the resource group information to facilitate resource management. Specify the resource group to which the current resource belongs. This field is configurable only for an add operation. Click Settings. Select an existing resource group in the dialog box that opens.
4. In the Others area, select whether or not to enable detection. If you enable detection, the system identifies whether it can connect to the monitor object. The detection operation takes more time for the system to add a monitor.
5. Click Test Connectivity to test the middleware connectivity and identify whether the parameters are configured successfully.
6. After the test succeeds, click OK.
Edit a middleware monitor
Perform this task to edit an existing middleware monitor.
To edit a middleware monitor:
1. On the top network navigation bar, click Monitor. From the navigation pane, click Basic Monitor > Middleware.
2. Click the Edit ![]() icon
in the Actions column for a monitor object.
icon
in the Actions column for a monitor object.
3. On the page that opens, edit the basic information, monitor parameters, access parameters, and other information for the middleware monitor.
4. Click Test Connectivity to test the middleware connectivity and identify whether the parameters are configured successfully.
5. Click OK.
Other resources
The system supports monitoring other resources such as HTTP services and LDAP services in terms of their availability, and supports sending a notification through the alarm module when a monitor index exceeds an alarm threshold.
Table 10 shows the other resources that can be monitored by U-Center 2.0.
Table 10 Supported other resources models
|
Monitor category |
Other resource models |
|
HTTP service monitor |
Linux Remote Curl and URL. |
|
LDAP service monitor |
Active Directory and LDAP. |
|
Service monitor |
Ceph, Comprehensive Log Auditing Platform, H3C Cloud AI, H3C CSAP-WEB Monitoring Center, Linux Custom, DNS Monitor, H3C DataX, H3C SecCenter ESM, Application Development Platform, H3C Oasis Data Platform, H3C Oasis Integration Platform, Oasis IoT Platform 2.0, H3C Workspace, IDGP, H3C SecPath ISG-IMW, H3C SecPath ISG-MGT, JavaRuntime, Linux Remote Netcat, Linux Remote Telnet, CloudOS MQS, NDR, H3C Oasis Digital Plat, Ping Test Monitor, Ping Command, H3C SecCloud OMP, Security Management Platform, H3C SecPath SSMS-Cloud, H3C SecPath SSMS, TAP8000-SDN, TCP Port, Threat Discovery and Security Operations Platform, and Zero Trust Network Access. |
|
File/Directory monitor |
Directory and file. |
Add other resource monitor
This section takes Application Development Platform as an example to illustrate how to add other resource monitors.
To add an Application Development Platform monitor:
1. On the top network navigation bar, click Monitor. From the navigation pane, select Basic Monitor > Other Resources.
2. Click Add to select the Application Development Platform type in the Server Monitor category.
3. On the page that opens, specify the basic information, monitor parameters, access parameters, resource group, and other information for the other resources monitor:
¡ In the Basic Info area, set the IP address, name, and description.
- IP Address: Enter an IP address of Application Development Platform.
- Name: Enter the name of Application Development Platform.
- Description: Enter a description for the monitor.
¡ In the Monitor Parameters area, configure whether to add as monitor object and add as config poll object, and set the monitor template and management station.
- Add as Monitor Object: Select whether to add resource objects as monitor objects. You must enable Add as Monitor Object, Add as Config Poll Object, or both.
- Monitor Template: Specify a monitor template. The template defines monitor indexes and thresholds. You can use the default monitor template. Alternatively, you can click Settings. In the dialog box that opens, select an existing template or click Add to add a target template of the specified type.
- Add as Config Poll Object: Select whether to add configuration polling settings when adding a monitor object. If you select Yes, a successfully added other resource device will be available on both the Monitor and Resource tabs and periodic data collection will be enabled for the device.
- Management Station: Specify the management station for the monitor. The local environment applies by default.
|
|
NOTE: When you configure the monitor parameters, follow these restrictions and guidelines: · To use the Add as Config Poll Object function, you must purchase the corresponding license for the CMDB product to obtain the quantity-based authorization and functional authorization. Without the license, the page does not display the parameter. · Management Station: In the proxy scenario, you must use the proxy to incorporate applications (select proxy as the management station for the monitor). In the region scenario, you must use the region to incorporate applications (select region as the management station for the monitor). For the resources synchronized from the lower-level environment of the region, you can only view and export them in the upper-level environment of the region. The other operations will be skipped. |
¡ In the Access Parameters area, configure the monitoring protocol, access parameter template, monitor port, protocol, domain name, relative path, and keyword:
- Monitoring Protocol: The default monitoring protocol is Application Development Platform.
- Access Parameter Template: Specify the access parameter template used by the monitor object. You can view or edit the connection parameters for the monitor object. Click Settings. In the dialog box that opens, select an access parameter template. Alternatively, click Add to add an access parameter template.
- Monitor Port: Monitor port used by Application Development Platform. The default setting is 11000.
- Username: Username used by Application Development Platform.
- Password: Password used by Application Development Platform.
- Connection TimeOut (s): Set the connection timeout timer for establishing a connection to the monitored device. The default is 20 seconds.
- Query TimeOut (s): Set the query timeout timer for collecting data from the monitored device. The default is 60 seconds.
¡ In the Resource Group area, set the resource group information to facilitate resource management. Specify the resource group to which the current resource belongs. This field is configurable only for an add operation. Click Settings. Select an existing resource group in the dialog box that opens.
4. In the Others area, select whether or not to enable detection. If you enable detection, the system identifies whether it can connect to the monitor object. The detection operation takes more time for the system to add a monitor.
5. Click Test Connectivity to test the other resource connectivity and identify whether the parameters are configured successfully.
6. After the test succeeds, click OK.
Edit other resource monitor
Perform this task to edit an existing other resource monitor.
To edit other resource monitor:
1. On the top network navigation bar, click Monitor. From the navigation pane, select Basic Monitor > Other Resources.
2. Click the Edit ![]() icon
in the Actions column for a resource.
icon
in the Actions column for a resource.
3. On the page that opens, edit the basic information, monitor parameters, access parameters, and other information for the resource monitor.
4. Click Test Connectivity to test the other resource connectivity and identify whether the parameters are configured successfully.
5. Click OK.
More operations
You can perform the following generic operations on resource monitors: The specific functions are as follows:
Search
Use this function to search existing resource object information.
To search resource object information:
1. On the top navigation bar, click Monitor. From the navigation pane, select Basic Monitor, and then select a resource type.
2. Perform simple or advanced search.
¡ Simple
search: Enter the name or IP address in the search
box at the top right corner of the page, and then click Search ![]() to
display resource object information matching search criteria. The search
criteria support fuzzy matching and are case insensitive.
to
display resource object information matching search criteria. The search
criteria support fuzzy matching and are case insensitive.
¡ Advanced
search: In the upper right corner of the page,
click Advanced Search ![]() to expand the advanced search area. Specify the name, type, host,
availability, alarm state, resource group, configuration polling state,
management station, or IP network, and then click Search to view
information about matching resource object information.
to expand the advanced search area. Specify the name, type, host,
availability, alarm state, resource group, configuration polling state,
management station, or IP network, and then click Search to view
information about matching resource object information.
Delete
Use this function to delete existing resource objects.
To delete existing resource objects:
1. On the top navigation bar, click Monitor. From the navigation pane, select Basic Monitor, and then select a resource type.
2. Delete one monitor object or multiple monitor objects in bulk.
¡ To delete monitor objects in bulk, select one or multiple objects in the list and click Delete. In the dialog box that opens, click OK.
¡ To
delete one monitor object, click Delete ![]() in the Actions
column of the object. In the dialog box that opens, click OK.
in the Actions
column of the object. In the dialog box that opens, click OK.
Enable collection
If data collection or configuration polling is disabled for certain resource objects, you can enable collection again. The system will start polling and collecting index data for the associated objects again.
To enable collection:
1. On the top navigation bar, click Monitor. From the navigation pane, select Basic Monitor, and then select a resource type.
2. Enable collection for one monitor object or enable collection for multiple monitor objects in bulk.
¡ To bulk enable collection, select one or more monitor objects, and then click Enable Collect. Specify whether to enable monitor data collection and configuration poll data collection. After enabling collection, click OK.
¡ To
enable collection for a single monitor object, click Enable Collect/Disable
Collect ![]() in the Actions column for the object. Specify whether to
enable monitor data collection and configuration poll data collection. After
enabling collection, click OK.
in the Actions column for the object. Specify whether to
enable monitor data collection and configuration poll data collection. After
enabling collection, click OK.
Disable collection
You can disable collection for certain resource objects. The system will stop monitoring the objects or collecting configuration polling data.
To disable collection:
1. On the top navigation bar, click Monitor. From the navigation pane, select Basic Monitor, and then select a resource type.
2. Disable collection for one monitor object or for multiple monitor objects in bulk.
¡ To bulk disable collection, select one or more monitor objects, and then click Disable Collect. Specify whether to disable collection for monitoring data and configuration polling data. After disabling collection, click OK.
¡ To
disable collection for a single monitor object, click Enable Collect/Disable
Collect ![]() in the Actions column for the object. Specify whether to
disable collection for monitoring data and configuration polling data. After
stopping collection, click OK.
in the Actions column for the object. Specify whether to
disable collection for monitoring data and configuration polling data. After
stopping collection, click OK.
Sync
The system periodically collects index data based on the monitor template settings. Operators can use the immediate collection function to immediately start data collection for monitor indexes without waiting for the data collection interval.
To sync monitor objects:
1. On the top navigation bar, click Monitor. From the navigation pane, select Basic Monitor, and then select a resource type.
2. Perform immediate collection for multiple monitor objects in bulk or for a single monitor object.
¡ To perform bulk collection immediately, select one or more monitors and then click Sync.
¡ To
perform immediate collection for one monitor object, click Sync ![]() in the
Actions column for the object in the list.
in the
Actions column for the object in the list.
Refresh
Use this function to refresh the list.
To refresh the list:
1. On the top navigation bar, click Monitor. From the navigation pane, select Basic Monitor, and then select a resource type.
2. Click Refresh to view the latest data in the list on the page.
Add monitor objects
You can add one or multiple monitor objects to the system.
To add monitors:
1. On the top navigation bar, click Monitor. From the navigation pane, select Basic Monitor, and then select a resource type.
2. Select one or multiple monitor objects in the list, and then click More Actions > Add as Monitor Object.
Add configuration polling objects
You can add one or multiple monitor objects to configuration polling.
To add monitor objects to configuration polling:
1. On the top navigation bar, click Monitor. From the navigation pane, select Basic Monitor, and then select a resource type.
2. Select one or multiple monitor objects in the list, and then click More Actions > Add as Config Poll Object.
|
|
NOTE: The system supports the following types of configuration polling states: · Collection disabled: Configuration polling is disabled for resource objects. The configuration polling data will not be updated in the resource information. · Enabled: Configuration polling is enabled for resource objects. The system can poll indexes for the objects. · Disabled: Configuration polling is not enabled for resource objects. The system does not poll indexes for the objects. |
Change the monitor template
You can specify a monitor template when adding a monitor. The system uses the specified monitor template to collect data of the specified index group. You can change the monitor template for a single resource or bulk change the monitor template for resources.
You can change the monitor template for only monitors of the same type in bulk.
To change the monitor template:
1. On the top navigation bar, click Monitor. From the navigation pane, select Basic Monitor, and then select a resource type.
2. Change the monitor template for a single resource or bulk change the monitor template for resources.
¡ To
change the monitor template for a single resource, click ![]() in the
Actions column for that resource.
in the
Actions column for that resource.
¡ To change the monitor template for multiple resources of the same type in bulk, select the resources, click More Actions > Change Monitor Template, and then click OK.
Change the access parameter template
You can specify an access parameter template when adding a monitor. The system uses the specified access parameter template to access the monitored object. You can change the access parameter template to edit access parameters for monitors in bulk.
To change the access parameter template:
1. On the top navigation bar, click Monitor. From the navigation pane, select Basic Monitor, and then select a resource type.
2. Select one or multiple monitored objects of the same type in the list, and then click More Actions > Change Access Parameter Template.
3. Then select a new access parameter template and click OK in the window that opens. You can view the result to verify whether the access parameter template has been successfully changed.
Add a maintenance tag task
The system schedules a maintenance tag task based on the task settings including data collection, trap generation, trap-to-alarm upgrade, and alarm forwarding.
To add a maintenance tag task:
1. On the top navigation bar, click Monitor. From the navigation pane, select Basic Monitor, and then select a resource type.
2. Select one or multiple monitor objects of the same type in the list, and then click More Actions > Add Maintenance Tag Task.
3. In the window that opens, specify the name, scheduling type, start time and end time, and description, and then click OK. For more information about maintenance tag task settings, navigate to the Monitor > Maintenance Tag Tasks > Resource Tasks page.
Import
You can bulk import monitors to the system by uploading a file.
Import resources
You can bulk add resources to the system by uploading a file.
To import resources:
1. On the top navigation bar, click Monitor. From the navigation pane, select Basic Monitor, and then select a resource type.
2. Click More Actions > Import > Import Resources.
3. In the window that opens, click Choose to select a file, and then click Upload. For file format information, see Download Template.
View operation results
Use this function to view the current or last resource import results.
To view operation results:
4. On the top navigation bar, click Monitor. From the navigation pane, select Basic Monitor, and then select a resource type.
5. After importing resources, click More Actions.
6. Then, click Import > View Operation Results. The system refreshes the import result page every 5 seconds for an ongoing import operation. By default, the last import result can be retained for a maximum of one hour.
Download template
You can download the template file for importing resources. You can specify parameters for the resources in the template and then upload the template to add resources in bulk.
To download a template:
7. On the top navigation bar, click Monitor. From the navigation pane, select Basic Monitor, and then select a resource type.
8. Click More Actions > Import > Download Template, and select a template type.
9. Then select a template and click Download in the window that opens.
10. Enter required parameters in the file, and then click Import Monitors to upload the file.
Export
This function allows you to export key access parameter information. The passwords in the exported information will be encrypted.
To export monitor objects:
1. On the top navigation bar, click Monitor. From the navigation pane, select Basic Monitor, and then select a resource type.
2. Export selected or all resources as needed.
¡ Export Selected: Select one or more monitors in the list, and then click More Actions > Export > Export Selected to export the monitors in an Excel or ZIP file. In a download operation, you can download the Excel template file for only one monitor type and ZIP template files for multiple monitor types.
¡ Export All: Export all resources filtered by the specified criteria. Click More Actions > Export > Export All. The system supports exporting the monitors in an Excel or ZIP file. In a download operation, you can download the Excel template file for only one monitor type and ZIP template files for multiple monitor types.
Cancel a maintenance tag task
You can cancel the maintenance tag task for a monitor object.
To cancel a maintenance tag task:
1. On the top navigation bar, click Monitor. From the navigation pane, select Basic Monitor, and then select a resource type.
2. Click Cancel Maintenance Tag Task ![]() in the
Actions column for the monitor object in the list.
in the
Actions column for the monitor object in the list.
3. In the window that opens, select a task, and then click OK. The task list is empty if no maintenance tag tasks exist for the monitor.
View detailed monitor task information
The detailed monitor task information typically provides specific data and threshold alarm information collected at different time intervals for the monitor objects, and dynamically displays monitor reports in graphs and tables.
To view detailed information about a monitor:
1. On the top navigation bar, click Monitor. From the navigation pane, select Basic Monitor, and then select a resource type.
2. Click the name link of the associated monitor object in the list. You can then view detailed monitor information on the page that opens.
3. Detailed resource information:
¡ Availability Today: Management status of the monitored object. Options include the following:
- Available: The monitored object can be correctly connected and the monitor data can be collected.
- Inaccessible: The monitored object cannot be reached, and an associated alarm will be generated.
- Unavailable: The resource object cannot be connected, and an alarm will be generated.
- Collect Disabled: The monitored object is not monitored, and its health status is unknown.
- Disabled: Configuration polling is not enabled for the monitored objects. The system does not poll indexes for the objects.
¡ History
information: Click ![]() to view history information for certain indexes in the monitor
report.
to view history information for certain indexes in the monitor
report.
¡ Select
index instances: Click ![]() to select instances for certain indexes with no data displayed. The
system will display data of the selected instances for the indexes after the
next collection interval.
to select instances for certain indexes with no data displayed. The
system will display data of the selected instances for the indexes after the
next collection interval.
¡ Threshold settings: Multiple levels (five levels, custom, and dynamic) of thresholds can be set for a specific index value. When the value exceeds the threshold, the index row will be highlighted, and the threshold information will also be displayed in charts such as trend graphs.
¡ Refresh: You can refresh all indexes or a single index for the monitor
report. The refresh all button ![]() is located after the report title. The button is hidden for a few
seconds after being clicked to prevent repeated refreshes. The refresh single
index button
is located after the report title. The button is hidden for a few
seconds after being clicked to prevent repeated refreshes. The refresh single
index button ![]() is located in the top right corner of each index box. It refreshes
only the content within that box, without affecting other index reports.
is located in the top right corner of each index box. It refreshes
only the content within that box, without affecting other index reports.
¡ Tabs: Monitor reports can be displayed in different pages. You can click tabs to switch between pages and refresh the report content.
|
|
NOTE: Description of detailed monitor information: · A bar chart supports displaying only 10 items. · If you set a threshold for processes with the same name, the threshold applies to all processes with that name. · When the monitor report contains many columns or a lot of content, the system automatically adjusts the page layout. You can drag the scroll bar to view the covered sections. · If you change the monitor name after opening the monitor report page, the name in the report will not change. You need to open the monitor report again. · For servers with data collected through the IPMI protocol, see the IPMI protocol collection results. · For H3C servers with data collected through the IPMI protocol, the storage status in the basic server information of the monitor overview is the physical disk status. · In the line chart, when the breakpoint display switch is turned on, the algorithm for breakpoint calculation will be performed only if more than four data points exists for the corresponding single instance. Breakpoint calculation inaccuracy might occur near the data for which the collection is manually triggered. The time at the breakpoint takes the median of the collection times before and after the breakpoint. · If the server response times out, the collection unit might have no data or missing data. |
View alarm information
View the alarm information based on the alarm state of the corresponding monitor object.
To view alarm information:
1. On the top navigation bar, click Monitor. From the navigation pane, select Basic Monitor, and then select a resource type.
2. Click the health status link of the associated monitor object in the list. You can then view detailed alarm information on the page that opens.
|
|
NOTE: The health statuses of monitored objects include the following options: · Healthy: The monitored object is available, index data can be obtained, and no threshold alarm is triggered. · Info: An info alarm is generated when the index data collected for a monitor object exceeds the info alarm threshold. · Warning: A warning alarm is generated when the index data collected for a monitor object exceeds the warning alarm threshold. · Minor: A minor alarm is generated when the index data collected for a monitor object exceeds the minor alarm threshold. · Major: A major alarm is generated when the index data collected for a monitor object exceeds the major alarm threshold. · Critical: A critical alarm is generated when the index data collected for a monitor object exceeds the critical alarm threshold. · Unknown: The monitor object is in an unmonitored state. |
View monitor template information
You can view monitor template information, and edit and configure the settings as needed.
To view monitor template information:
1. On the top navigation bar, click Monitor. From the navigation pane, select Basic Monitor, and then select a resource type.
2. Click the monitor template link of the associated monitor object in the list. You can then view monitor template information on the page that opens, and edit and configure the settings as needed.
View access parameter template information
You can view access parameter template information, and edit and configure the settings as needed.
To view access parameter template information:
1. On the top navigation bar, click Monitor. From the navigation pane, select Basic Monitor, and then select a resource type.
2. Hover over the view details link in the access parameter template column of the corresponding monitor object. Click the access parameter template link of the associated monitor object in the window that opens. You can then view access parameter template information on the page that opens, and edit and configure the settings as needed.
Monitor options
Agent management
This function allows you to manage agents, view agent installation instructions, download agent installation packages, view information about installed agents, remotely enable or disable agent monitor, delete installed agents, and view applications on agents.
View agents
1. On the top navigation bar, click the Monitor tab.
2. From the navigation pane, select Monitor Options > Agent Management.
Agent management list contents
¡ Agent Host IP: IP address of the controlled host where the agent is installed. This value is automatically obtained by the agent after it is installed on the host, but can also be customized during installation. If the agent obtains this value and the host has multiple IP addresses, the agent will obtain the first IP address that can connect to the U-Center 2.0 server/U-Center 2.0 proxy component.
¡ Agent Host Name: Host name of the controlled machine where the agent is installed. This value can be specified during Agent installation. If this value is not specified, the agent automatically obtains it after being installed.
¡ Agent Version: Version number of the agent. This version number is located in the agent installation file. Upon startup, the agent continuously verifies this version number with the associated server or U-Center 2.0 proxy. If it is inconsistent with the server's Agent version number, the agent automatically initiates the update process, downloading the latest Agent update package from the associated U-Center 2.0 server or U-Center 2.0 proxy component and updating the agent.
¡ Installation Time: Time when the agent was installed. The agent automatically obtains this value from the controlled host during installation.
¡ Version Updated Time: Time when the version of the agent was updated. This value is initially empty after Agent installation, but is updated with the current time by the agent after each update process is completed.
¡ Agent Status: Status of the agent. Options include Installing, Start failed, Starting, Started, and Network not connected.
- Installing: The agent is being installed.
- Start failed: The agent installation failed or the main process of the agent failed to start.
- Starting: The agent installation succeeded and the main process of the agent is not yet started.
- Started: The main process of the agent is running and the agent monitor function is enabled.
- Network not connected: The main process of the agent cannot access its associated U-Center 2.0 server or U-Center 2.0 proxy.
- Management Station: Name of the U-Center 2.0 proxy that manages the agent. If the agent is directly connected to the U-Center 2.0 server, this column will display local.
- Resources: All resources monitored by the agent.
Search for agents
1. On the top navigation bar, click Monitor.
2. From the navigation pane, select Monitor Options > Agent Management.
3. Perform basic search or advanced search for installed agents:
¡ Basic
search: In the upper right corner of the page, enter a host IP in the search
box and then click the Search icon ![]() to
filter agents with this IP address.
to
filter agents with this IP address.
¡ Advanced
search: In the upper right corner of the page, click the Advanced
Search icon ![]() next to the search box to expand the advanced search area. Specify
the filter criteria and then click Search to view
information about matching agents.
next to the search box to expand the advanced search area. Specify
the filter criteria and then click Search to view
information about matching agents.
Install an agent
1. On the top navigation bar, click Monitor.
2. From the navigation pane, select Monitor Options > Agent Management.
3. Click Install. On the page that opens, you can view the agent installation instructions, including procedures, necessary tools, and installation package download links for local installation and remote installation respectively.
4. Follow the installation procedures to install the agent.
|
|
NOTE: When you install an agent, follow these restrictions and guidelines: · After the agent component in the IOM component package is upgrade, the agent on a host will be automatically upgraded. To manually upgrade the agent, upload the installation package to the agent installation path and decompress it. In a Linux environment, execute the update.sh command. In a Windows environment, execute the update-tool.exe command. · For remote installation, the local directory cannot contain Chinese characters. · You cannot edit the IP address of the agent after installation. |
View agent details
1. On the top navigation bar, click Monitor.
2. From the navigation pane, select Monitor Options > Agent Management.
3. Click the IP address in the Host IP column for the target agent. On the page that opens, you can view the details about the agent, including host IP, host type, installation path, and log path.
View agent application details
To view details about an application running on an agent:
1. On the top navigation bar, click Monitor.
2. From the navigation pane, select Monitor Options > Agent Management.
3. Click the icon of the target application in the Applications column for the agent to view details about the application.
Synchronize an agent
To synchronize the process status information of an agent:
1. On the top navigation bar, click Monitor.
2. From the navigation pane, select Monitor Options > Agent Management.
3. Click the Synchronize icon
![]() in the Actions
column for the target agent.
in the Actions
column for the target agent.
Delete agents
· Delete a single agent:
a. On the top navigation bar, click Monitor.
b. From the navigation pane, select Monitor Options > Agent Management.
c. Click the ![]() icon in the Actions column for an agent, and then click OK in the confirmation dialog box that opens.
icon in the Actions column for an agent, and then click OK in the confirmation dialog box that opens.
This operation will remove the processes, registry entries, and installation packages of the agent from the monitored host. After deletion, the result is displayed on the page.
· Bulk delete agents:
a. On the top navigation bar, click Monitor.
b. From the navigation pane, select Monitor Options > Agent Management.
c. Select one or more agents from the list, and click Delete. In the dialog box that opens, click OK.
Export agents
· Export all agents:
a. On the top navigation bar, click Monitor.
b. From the navigation pane, select Monitor Options > Agent Management.
c. Click Export and select Export All to export all agent resources as an Excel file.
· Export the selected agents:
a. On the top navigation bar, click Monitor.
b. From the navigation pane, select Monitor Options > Agent Management.
c. Click Export and select Export Selected to export the selected agent resources on the list as an Excel file.
Add monitors/poll config
1. On the top navigation bar, click Monitor.
2. From the navigation pane, select Monitor Options > Agent Management.
3. Select the agents to be added to the system monitors.
4. Click Add Monitor/Poll Config to add the default operating system monitors automatically with the default operating system monitor template for the selected agents on this page.
Remove monitors/poll config
1. On the top navigation bar, click Monitor.
2. From the navigation pane, select Monitor Options > Agent Management.
3. Select the agents to be removed from the operating system monitor.
4. Click Remove Monitor/Poll Config to remove all monitors automatically for the selected agents on this page.
Monitor templates
This feature implements centralized, template-based monitor setting management. This feature also provides template-based monitor index selection, threshold settings, and collection interval settings. You can select monitor templates in the monitor and auto discovery components.
|
|
NOTE: The operations that an operator can perform for a monitor template depend on the operator permissions. For example, if an operator has the view permissions but not the edit permissions to a monitor template, the operator can view the monitor template but cannot edit the monitor template. |
View monitor templates
1. On the top navigation bar, click the Monitor tab.
2. From the left navigation pane, select Monitor Options > Monitor Templates.
Monitor template list contents
¡ Name: Name of the monitor template.
¡ Type: Type of the monitor template.
¡ Management Station: Name of the U-Center 2.0 proxy that manages the U-Center 2.0 proxy. If the monitor template is configured on the U-Center 2.0 server, this column will display local.
¡ User-Defined: Indicates whether the template is a user-defined template.
¡ Default: Indicates whether the default template of the template type. The default monitor template is used by default when you add monitors or during auto discovery. You can also set a user-defined template as the default template.
¡ Description: Description of the monitor template.
Add a monitor template
Perform this task to add monitor templates for different resources.
To add a monitor template:
1. On the top navigation bar, click Monitor.
2. From the left navigation pane, select Monitor Options > Monitor Templates.
3. Select a template type in sequence and then click Add or directly click Add.
The Add Monitor Template page opens.
4. Configure the following parameters in the Basic Info area:
¡ Template Name: Enter a name for the template. The template name must be unique among all templates of the same type.
¡ Template Type: Specify the template type to which the template belongs. This field is configurable only for an add operation.
¡ Template Description: Optional. Enter a description for the template as needed.
¡ Resource Group: Specify the resource groups to which the template belongs. This field is configurable only for an add operation. Click Select. On the window that opens, select resource groups.
5. Configure index groups for the template: On the Index Settings tab, configure index groups for the template.
¡ Add index groups: Click Add. In the dialog box that opens, select the desired index groups. Click OK.
¡ Delete index groups:
- Bulk delete index groups: Select the target index groups and then click Delete. Click OK in the confirmation dialog box that opens.
- Delete a single index group: Click the Delete
icon ![]() in the Actions column for the index
group to be deleted. Click OK in the confirmation
dialog box that opens.
in the Actions column for the index
group to be deleted. Click OK in the confirmation
dialog box that opens.
¡ Edit the data collection interval:
- Bulk edit the data collection interval for multiple index groups: Select the target index groups, and then click Edit Collection Interval. In the dialog box that opens, set the data collection interval for the selected index groups and click OK.
- Edit the data collection interval for a single index group: Click
the Edit Collection Interval icon ![]() in
the Actions column for the target index group. In
the dialog box that opens, set the data collection interval and click OK.
in
the Actions column for the target index group. In
the dialog box that opens, set the data collection interval and click OK.
6. Configure threshold settings on the Threshold Settings tab.
¡ Add threshold settings: Click Add. In the dialog box that opens, configure parameters as needed. Click OK.
- Threshold Type: Options are Common Threshold, Index-Based Rule, Instance Loss Threshold, and Composite Threshold.
- Common Threshold: You must specify the alarm level, occurrences, thresholds, operators, and applicable time.
- Index-Based Rule Threshold: If you select this threshold type, first configure entrance settings. If the monitored index matches the settings, the rule-based threshold settings will be applied. The common threshold settings for the index will no longer take effect.
- Instance Loss Threshold: You can select this threshold type only for an index of multiple instances. When the number of instances is decreased, an alarm is triggered.
- Composite Threshold: Allows you to specify a threshold for each index in the index group. When all the thresholds are crossed, the system sends an alarm.
- Applicable Time: Applicable time for the threshold. Options are All Time and Custom Time. To customize the applicable time, select the day of week and time range and then click Add. The applicable time ranges for the same index cannot overlap.
- Entrance Settings: If you select the index-based rule threshold type, you must configure entrance settings. If the index group of the monitor instance matches the entrance settings, the rule-based threshold settings will be applied. In this case, the common threshold settings for the index group will no longer take effect.
- Thresholds Settings: If you select the common threshold, index-based rule, or composite threshold type, perform the following tasks: Select the index group and index, select the operator, and select the alarm levels you want to enable and set the alarm threshold and required threshold-violation count (occurrences) for triggering an alarm of each level.
¡ Edit
a threshold: Click the Edit icon ![]() in
the Actions column for a threshold. In the dialog
box that opens, edit the threshold settings. Click OK.
in
the Actions column for a threshold. In the dialog
box that opens, edit the threshold settings. Click OK.
- Alarm Level: Options are Notification, Warning, Minor, Major, and Critical.
- Occurrences: Maximum number of consecutive threshold violations for triggering alarms.
¡ Set time: Click Set Time. In the dialog box that opens, select all time or select custom time and set the time, and click OK.
¡ Delete threshold settings: Click Delete to delete threshold settings for an existing non-availability index group.
When adding a monitor template, follow these restrictions and guidelines:
· An index group configured with thresholds cannot be deleted.
· Before configuring thresholds, first specify the indexes to be monitored.
· You can customize the applicable time for the server, storage, virtualization, container, operating system, database, middleware, and others monitor templates. By default, the applicable time for the others monitor templates is All Time.
· Collectors for configuration polling are not displayed for the server, storage, virtualization, container, operating system, database, middleware, and others monitor templates.
· If you select the instance loss threshold type, perform the following tasks:
a. Select the index group and index.
b. Set the maximum number of consecutive instance losses.
c. Select the alarm level you want to enable.
Only one level can be configured for the instance loss threshold.
Edit a monitor template
Perform this task to edit a monitor template for resources.
To edit a monitor template:
1. On the top navigation bar, click Monitor.
2. From the left navigation pane, select Monitor Options > Monitor Templates.
3. Click the Edit
icon ![]() in the Actions column for a monitor template.
in the Actions column for a monitor template.
4. Edit basic information: Edit the template name and description.
5. Edit index configuration: Delete index groups and edit the data collection interval.
¡ Delete index groups:
- Bulk delete index groups: Select the target index groups and then click Delete. Click OK in the confirmation dialog box that opens.
- Delete a single index group: Click the ![]() icon
in the Actions column for the index group you want
to delete, and then click OK in the confirmation
dialog box that opens.
icon
in the Actions column for the index group you want
to delete, and then click OK in the confirmation
dialog box that opens.
¡ Edit the data collection interval:
- Edit the data collection interval for multiple index groups in bulk: Select the target index groups, and then click Edit Collection Interval. In the dialog box that opens, set the data collection intervals for the selected index groups and click OK.
- Edit the data collection interval for a single index group: Click
the ![]() icon in the Actions column for the
target index group. In the dialog box that opens, set the data collection
interval and click OK.
icon in the Actions column for the
target index group. In the dialog box that opens, set the data collection
interval and click OK.
6. Edit the template threshold configuration, as shown in "Edit threshold settings.”
|
|
NOTE: When you edit a monitor template, follow these restrictions and guidelines: · You can click Expand All to view index information. · As a best practice to edit multiple parameters, first copy the monitor template, edit the parameters in the copied template, and then configure the edited monitor template for the application. · After a monitor template is successfully edited, the edited monitor template is automatically applied in the next collection interval. Make sure the access parameter template is correctly configured. Otherwise, monitoring might fail. |
Edit threshold settings
1. On the top navigation bar, click Monitor.
2. From the left navigation pane, select Monitor Options > Monitor Templates.
3. Click the Edit
Thresholds ![]() icon in the Actions column for a
monitor template. The Threshold Settings tab opens. Alternatively, click the
icon in the Actions column for a
monitor template. The Threshold Settings tab opens. Alternatively, click the ![]() icon
in the Actions column for a monitor template, and
click the Threshold Settings tab on the Edit Monitor Template page that opens.
icon
in the Actions column for a monitor template, and
click the Threshold Settings tab on the Edit Monitor Template page that opens.
4. Edit index thresholds: Click the ![]() icon
in the Actions column for the target index. In the
window that opens, edit the threshold configuration. Click OK. Threshold configuration parameters:
icon
in the Actions column for the target index. In the
window that opens, edit the threshold configuration. Click OK. Threshold configuration parameters:
¡ Severity: Severity level of the alarm. Available severity levels are Notification, Warning, Minor, Major, and Critical.
¡ Operator: You must specify the same operator for different severity levels.
- For an index of the Character type, the operator can be Equal to, Not Equal to, Contain, Do Not Contain, Rule-Based, or Change.
- For an index of the Number type, the operator can be Equal to, Greater than, Less than, Greater than or equal to, or Less than or equal to.
- A match rule can contain match conditions with these operators: != (not equal to), = (equal to), or ! (do not contain). Multiple conditions can be connected by logical operator | (OR) or & (AND).
¡ Triggering condition: Condition for triggering the threshold alarm.
¡ Occurrence: Maximum number of consecutive threshold violations.
5. Edit applicable time: Select one or more entries, and click Set Time. On the Set Time window, edit the applicable time, and click OK.
6. Delete threshold: You can select an entry and click Delete to delete threshold settings for a non-availability index group.
Delete monitor templates
· Bulk delete monitor templates:
a. On the top navigation bar, click Monitor.
b. From the left navigation pane, select Monitor Options > Monitor Templates.
c. Select one or multiple monitor templates, and click Delete.
d. In the confirmation dialog box that opens, click OK.
· Delete a single monitor template:
a. On the top navigation bar, click Monitor.
b. From the left navigation pane, select Monitor Options > Monitor Templates.
c. Click the Delete
icon ![]() in the Actions column for a monitor template.
in the Actions column for a monitor template.
d. In the confirmation dialog box that opens, click OK.
|
|
NOTE: You cannot delete monitor templates in use. To delete a monitor template in use, first remove the monitor template from applications using it. To view the applications using a monitor template, access the usage info tab on the monitor template details page. |
Copy a monitor template
Perform this task when the monitor template to be created is highly similar to an existing monitor template.
To copy a monitor template:
1. On the top navigation bar, click Monitor.
2. From the left navigation pane, select Monitor Options > Monitor Templates.
3. Click the Copy
icon ![]() in the Actions column for an existing monitor template.
in the Actions column for an existing monitor template.
The system automatically creates a new monitor template with settings (including the thresholds and collection interval) of the existing monitor template.
4. Then, edit few parameters of the monitor template as needed.
View a monitor template
1. On the top navigation bar, click Monitor.
2. From the left navigation pane, select Monitor Options > Monitor Templates.
3. Click the name of a monitor template on the monitor template list to open the details page for the monitor template.
On this page, you can view the basic information, usage information, and threshold information of the monitor template.
Set the default monitor template
Perform this task to set a monitor template as the default monitor template.
To set default monitor template:
1. On the top navigation bar, click the Monitor tab.
2. From the left navigation pane, select Monitor Options > Monitor Templates.
3. Click the ![]() icon in the Actions column for a monitor template to set it as the default
monitor template.
icon in the Actions column for a monitor template to set it as the default
monitor template.
|
|
NOTE: When you set the default monitor template, follow these restrictions and guidelines: · The default monitor template is used by default when you add monitors or during auto discovery. You can also set a user-defined template as the default template. · Except templates of the network type, each type of templates has one and only one default template. For a type of templates, if you set a template as the default template, the previous default template is canceled. · Templates of the network type need at least one default template. For templates of a subtype under the network type, up to one default template is allowed. |
Refresh the monitor template list
1. On the top navigation bar, click the Monitor tab. From the left navigation pane, select Monitor Options > Monitor Templates.
2. Click Refresh.
Indexes
From this menu, you can uniformly view and manage all monitor indexes in the system. On the index management page, you can configure level-2 classes, and customize index groups and indexes. On the left of the page, the resource type tree is displayed. On the right of the page, the index group information for the selected resource type is displayed.
When managing indexes, follow these restrictions and guidelines:
· If a custom resource type has a custom template, the custom resource type cannot be deleted.
· If the default template of a custom resource type is used by a monitor, the custom resource type cannot be deleted.
· If a custom level-2 class has a custom resource type, the custom level-2 class cannot be deleted.
· If a custom index group is used by a monitor template, the custom index group cannot be deleted.
· For level-1 classes server, storage, virtualization, container, operating system, database, middleware, and others, you can add level-2 classes, add index groups, configure availability settings, configure auto discovery settings, and edit the resource type templates. To perform an operation, make sure the current operator has the corresponding permissions.
· You can add indexes to level-1 class Network. After an index is added, if all indexes in the index group to which the index belongs have been configured in a monitor template, the index will be automatically added to the monitor template.
View indexes
1. On the top navigation bar, click the Monitor tab.
2. From the navigation pane, select Monitor Options > Indexes. Click Expand All/Collapse All to view index information.
Index management list contents:
¡ Level-1 Class: First level of the resource type tree on the left.
¡ Level-2 Class: Second level of the resource type tree on the left.
¡ Class: Level-2 class ID.
¡ Name: Level-2 class name, which must be unique under the level-1 class of the level-2 class.
¡ Index Group Name: Name of an index group.
¡ Type: Resource type to which an index group belongs.
¡ Index Value Type: Options include Character and Number.
¡ Unit List: Units of measurement for indexes. When the collected data is displayed, the units of measurement can be switched for the data to make the data readable. When configuring threshold settings for a monitor template, you can select a unit from the unit list.
¡ Index Description: Description on an index.
Add a level-2 class
Perform this task to add a level-2 class under an existing level-1 class.
To add a level-2 class:
1. On the top navigation bar, click Monitor.
2. From the navigation pane, select Monitor Options > Indexes.
3. Click the Add
icon ![]() next to a level-1
class, and enter the class identifier and name in the dialog box that opens.
next to a level-1
class, and enter the class identifier and name in the dialog box that opens.
The class identifier of a level-2 class cannot be edited after the level-2 class is added.
4. Click OK.
Add a resource type
Perform this task to add a resource type to an existing level-2 class.
To add a resource type:
1. On the top navigation bar, click Monitor.
2. From the navigation pane, select Monitor Options > Indexes.
3. Click the Add
icon ![]() next to a level-2 class.
next to a level-2 class.
The page for adding a resource type opens.
4. Configure the information, availability index group, and key parameters for the resource type.
5. Click OK.
After adding a resource type, you can monitor and manage applications of the resource type.
Add an index group
Perform this task to add an index group to an existing resource type.
To add an index group:
1. On the top navigation bar, click Monitor.
2. From the navigation pane, select Monitor Options > Indexes.
3. Click a specific resource type on the left tree.
4. Click Add on the right of the page to access the page for adding an index group.
5. Configure basic information, indexes, and collection protocols for the index group.
For more information, see the help for adding an index group.
6. Click OK.
For a monitor to use the added index group, configure the index group in the corresponding monitor template.
Configure availability settings
Perform this task to edit the index group of an existing resource type.
To configure availability settings:
1. On the top navigation bar, click Monitor.
2. From the navigation pane, select Monitor Options > Indexes.
3. Click a specific resource type on the left tree.
4. Click Availability Settings on the right.
5. On the page that opens, edit the availability index group for the resource type.
For more information, see the help for configuring availability settings.
6. Click OK.
Configure auto discovery settings
After you add a resource type that supports auto discovery, you can configure the auto discovery index group for the resource type.
To configure auto discovery settings:
1. On the top navigation bar, click Monitor.
2. From the navigation pane, select Monitor Options > Indexes.
3. Click a specific resource type on the left tree.
4. Click Auto Discovery Settings on the right.
5. On the page that opens, configure the auto discovery index group for the resource type.
6. Click OK.
Edit a resource type template
Perform this task to orchestrate the indexes for an existing resource type.
To edit a resource type template:
1. On the top navigation bar, click Monitor.
2. From the navigation pane, select Monitor Options > Indexes.
3. Click a specific resource type on the left tree.
4. Click Edit Resource Type Template on the right.
5. On the page that opens, orchestrate the indexes for the resource type.
Add an index
Perform this task to add an index of an existing resource type.
To add an index:
1. On the top navigation bar, click Monitor.
2. From the navigation pane, select Monitor Options > Indexes.
3. Click the Add
icon ![]() in the Actions column for an index group.
in the Actions column for an index group.
4. Configure the index parameters as needed.
5. Click OK.
Edit a level-2 class
1. On the top navigation bar, click Monitor.
2. From the navigation pane, select Monitor Options > Indexes.
3. Click the Edit
icon ![]() next to a level-2 class.
next to a level-2 class.
4. Edit the name of the level-2 class.
5. Click OK.
Edit a resource type
1. On the top navigation bar, click Monitor.
2. From the navigation pane, select Monitor Options > Indexes.
3. Click the Edit
icon ![]() next to a resource type.
next to a resource type.
The page for editing the resource type opens.
4. Configure the information, availability index group, and key parameters for the resource type.
5. Click OK.
Edit an index group
1. On the top navigation bar, click Monitor.
2. From the navigation pane, select Monitor Options > Indexes.
3. Click the Edit
icon ![]() in the Actions column for an index
group to access the page for editing the index group.
in the Actions column for an index
group to access the page for editing the index group.
4. Configure basic information, indexes, and collection protocols for the index group.
5. Click OK.
After an index group is edited, the edited index group will be automatically applied in the next collection interval.
Edit an index
Perform this task to edit an existing index in an index group.
To edit an index:
1. On the top navigation bar, click Monitor.
2. From the navigation pane, select Monitor Options > Indexes.
3. Click the Edit
icon ![]() in the Actions column for an index to
access the page for editing the index.
in the Actions column for an index to
access the page for editing the index.
4. Configure the index parameters as needed.
5. Click OK.
After an index is edited, the edited index will be automatically applied in the next collection interval.
Delete a level-2 class
1. On the top navigation bar, click Monitor.
2. From the navigation pane, select Monitor Options > Indexes.
3. When a level-2 class does not have resource
types, click the Delete icon ![]() for
the level-2 class on the list.
for
the level-2 class on the list.
4. In the confirmation dialog box that opens, click OK to delete the level-2 class.
Delete a resource type
1. On the top navigation bar, click Monitor.
2. From the navigation pane, select Monitor Options > Indexes.
3. Click the Delete
icon ![]() next to a resource type.
next to a resource type.
4. In the confirmation dialog box that opens, click OK to delete the resource type.
Delete an index group
1. On the top navigation bar, click Monitor.
2. From the navigation pane, select Monitor Options > Indexes.
3. Click the Delete
icon ![]() in the Actions column for an index
group.
in the Actions column for an index
group.
4. In the confirmation dialog box that opens, click OK to delete the index group.
Delete an index
1. On the top navigation bar, click Monitor.
2. From the navigation pane, select Monitor Options > Indexes.
3. Click the Delete
icon ![]() in the Actions column for an index.
in the Actions column for an index.
4. In the confirmation dialog box that opens, click OK to delete the index.
Access parameter templates
You can manage the parameters for accessing resources in the form of a template. The accessed resources can be networks, servers, storage, virtualization, containers, operating systems, databases, middleware, or other resources.
To automatically discover resources or monitor resources, you can directly reference an access parameter template of the corresponding type, which avoids repeated operations.
Add an access parameter template
1. On the top navigation bar, click the Monitor tab.
2. From the navigation pane, select Monitor Options > Access Parameter Templates.
3. Click Add. The window for adding an access parameter template opens.
4. Select a template type, and click Next.
5. Configure parameters as needed. An access parameter template name must be unique among templates of the same type.
6. Click OK.
Copy an access parameter template
Perform this task to quickly create an access parameter template by copying a similar one.
To copy an access parameter template:
1. On the top navigation bar, click the Monitor tab.
2. From the navigation pane, select Monitor Options > Access Parameter Templates.
3. Click the ![]() icon in the Actions column for the access parameter template to be
copied to copy information of the template. Then, you can quickly create a new
access parameter template through modifying few parameters.
icon in the Actions column for the access parameter template to be
copied to copy information of the template. Then, you can quickly create a new
access parameter template through modifying few parameters.
Edit an access parameter template
1. On the top navigation bar, click the Monitor tab.
2. From the navigation pane, select Monitor Options > Access Parameter Templates.
3. Click the ![]() icon in the
Actions column for the access parameter template to be edited.
icon in the
Actions column for the access parameter template to be edited.
4. Edit the parameters as needed. An access parameter template name must be unique among templates of the same type.
5. Click OK.
|
|
NOTE: When you edit an access parameter template, follow these restrictions and guidelines: · As a best practice to edit multiple parameters, first copy the monitor template, edit the parameters in the copied template, and then configure the edited template for the application. · In the next sampling interval and later, the edited access parameter template will be applied automatically. Make sure the access parameter template is correctly configured. Otherwise, monitoring might fail. |
Delete access parameter templates
Perform this task to bulk delete access parameter templates or delete a single access parameter template.
To delete access parameter templates:
1. On the top navigation bar, click the Monitor tab. From the navigation pane, select Monitor Options > Access Parameter Templates.
2. Bulk delete access parameter templates or delete a single access parameter template.
¡ Select multiple access parameter templates, and click Delete. In the dialog box that opens, click OK.
¡ To
delete a single access parameter template, click the ![]() icon
in the Actions column for the access parameter
template to be deleted. In the confirmation dialog box that opens, click OK.
icon
in the Actions column for the access parameter
template to be deleted. In the confirmation dialog box that opens, click OK.
|
|
NOTE: An access parameter template in use cannot be used. To see the resources that are using an access parameter template, access the template details page. |
View access parameter template details
1. On the top navigation bar, click the Monitor tab. From the navigation pane, select Monitor Options > Access Parameter Templates.
2. To view the details of an access parameter template, click its name. The access parameter template details window opens.
¡ Basic Info: Parameter configuration of the access parameter template.
¡ Usage Info: Resources that are using the access parameter template.
Import or export access parameter templates
1. On the top navigation bar, click the Monitor tab. From the navigation pane, select Monitor Options > Access Parameter Templates.
2. Click More Operations, click Import or Export, and then select an option as needed.
¡ To import access parameter templates, select one of the following options:
- Import Template: Select this option to select target parameter template files. You can import an EXCEL file or multiple ZIP files that meet the import file format requirements.
- View Operation Result: Select this option to view the results of the most recent import operation that is in progress or has been completed but not expired.
- Download Template Prototype: Select this option to download the prototype file of each template protocol to be imported. You can download an EXCEL prototype file or multiple ZIP prototype files.
¡ To export access parameter templates, select one of the following options:
- Export Selected: Select this option to download the selected parameter templates from the template list. You can download ZIP or EXCEL files.
- Export All: Select this option to download all parameter templates of the current template type. You can download ZIP or EXCEL files.
Refresh the access parameter template list
1. On the top navigation bar, click the Monitor tab. From the navigation pane, select Monitor Options > Access Parameter Templates.
2. Click Refresh.
Parameter settings
Perform this task to configure monitor parameters. This task applies to servers, storage, virtualization, containers, operating systems, databases, middleware, and other resources.
To configure monitor parameters:
1. On the top navigation bar, click the Monitor tab. From the navigation pane, select Monitor Options > Parameter Settings.
2. In the Data Retention Time Settings area, configure the related parameters. The history data is divided into raw data and hourly data. As a best practice, make sure the hourly data retention period is longer than the raw data retention period, and the daily data retention period is longer than the hourly data retention period. After configuration, click OK to save the configuration.
¡ Raw Data Retention Days: Enter an integer in the range of 1 to 60. The default is 30.
¡ Hourly Data Retention Months: Enter an integer in the range of 1 to 6. The default is 3. 30 days are counted as one month.
¡ Daily Data Retention Months: Enter an integer in the range of 1 to 24. The default is 6. 30 days are counted as one month.
3. In the vKVM Parameter Settings area, configure the related parameters. After configuration, click OK to save the configuration. vKVM parameter settings are displayed only when the vKVM component is installed.
¡ vKVM File Save Minutes: Enter an integer in the range of 1 to 10. The default is 5.
¡ vKVM Permission Authentication: Select whether to enable or disable vKVM permission authentication.
4. In the Ping Settings area, configure the related parameters. After configuration, click OK to save the configuration.
¡ Ping Retires: Enter an integer in the range of 1 to 20. The default is 2.
¡ Ping Timeout: Enter an integer in the range of 1 to 60 seconds. The default is 3 seconds.
5. In the Data Retention Time Settings area, set the retention days, and click OK to save the configuration.
¡ Retention Days: Enter an integer in the range of 1 to 60. The default is 30.
6. In the Others area, configure other parameters. After configuration, click OK to save the configuration.
¡ Trigger Alarms after Manual Recovery: Select whether to trigger alarms after manual recovery. The option is enabled by default.
- If you enable this option, after you recover the alarm for a monitor, the system can still generate alarms when the specified threshold conditions are met.
- If you disable this option, the system will not generate alarms for the monitor.
¡ Display Breakpoints on Trend Graphs: Display breakpoints where data is unavailable on a trend graph (curve graph). This option is disabled by default.
A monitor might fail to collect data for some reasons such as monitor stopped or failed.
SNMPv3 trap profiles
On the SNMPv3 trap profiles page, you can add, view, delete, and edit SNMPv3 trap access parameter templates.
|
|
NOTE: Follow these guidelines when you manage SNMPv3 trap profiles: · In the current software version, the SNMPv3 trap profile feature does not support the upper and lower levels. · When you add or edit an SNMPv3 trap profile, the SNMPv1, SNMPv2c, and SNMPv3 No-Priv No-Auth parameter are not supported. · In the current software version, H3C servers do not support sending traps by using the AES encryption protocol. |
Add
Perform this task to add an SNMPv3 trap profile.
To add an SNMPv3 trap profile:
1. On the top navigation bar, click Monitor.
2. From the navigation pane, select Monitor Options > SNMPv3 Trap Profiles.
3. On the SNMPv3 trap profile list page, click Add.
4. Configure the SNMPv3 trap parameter template and select server information.
¡ Set the SNMP access parameters template in the parameter template area. Click Settings, and add or select the correct SNMPv3 access parameter template in the window that opens.
¡ In the server selection area, add an application. Click Add and select the application that requires adding the SNMPv3 trap profile in the window that opens. Click OK to save your settings.
5. After completing the configuration, click OK to automatically return and refresh the monitoring list page, where you can view the newly added SNMPv3 trap application.
Edit
Perform this task to edit the SNMP access parameter template used by an application.
To edit an SNMPv3 trap profile:
1. On the top navigation bar, click Monitor.
2. From the navigation pane, select Monitor Options > SNMPv3 Trap Profiles.
3. Edit one SNMPv3 trap profile or edit multiple SNMPv3 trap profiles in bulk.
¡ To edit SNMPv3 trap profiles in bulk, select one or multiple objects in the list, and click Edit.
¡ To
edit one SNMPv3 trap profile, click Edit ![]() in the Actions column for the object in the list.
in the Actions column for the object in the list.
Search
Perform this task to search existing SNMPv3 trap profiles.
To search SNMPv3 trap profiles:
1. On the top navigation bar, click Monitor.
2. From the navigation pane, select Monitor Options > SNMPv3 Trap Profiles.
3. Perform simple search. Enter the name or IP
address in the search box at the top right corner of the page, and then click Search ![]() to display objects matching the search criteria.
to display objects matching the search criteria.
Delete
Perform this task to delete existing SNMPv3 trap profiles.
To delete SNMPv3 trap profiles:
1. On the top navigation bar, click Monitor.
2. From the navigation pane, select Monitor Options > SNMPv3 Trap Profiles.
3. Delete one SNMPv3 trap profile or delete multiple SNMPv3 trap profiles in bulk.
¡ To delete SNMPv3 trap profiles in bulk, select one or multiple objects in the list and click Delete. In the dialog box that opens, click OK.
¡ To
delete one SNMPv3 trap profile, click Delete ![]() in the
Actions column of the object. In the dialog box
that opens, click OK.
in the
Actions column of the object. In the dialog box
that opens, click OK.
Enable
Perform this task to enable SNMPv3 trap profiles for specific monitored objects that have not been enabled with SNMPv3 trap profiles. With this configuration, the system will detect the monitored objects through SNMP access parameters again.
To enable SNMPv3 trap profiles:
1. On the top navigation bar, click Monitor.
2. From the navigation pane, select Monitor Options > SNMPv3 Trap Profiles.
3. Select one or multiple monitored objects in the list, and then click Enable.
Disable
If you do not need to monitor specific objects through SNMP access parameters during a certain period of time, you can disable the SNMPv3 trap profiles. With this configuration, the system will stop monitoring the objects through SNMP access parameters.
To disable SNMPv3 trap profiles:
1. On the top navigation bar, click Monitor.
2. From the navigation pane, select Monitor Options > SNMPv3 Trap Profiles.
3. Select one or multiple monitored objects in the list, and then click Disable.
Refresh
Perform this task to refresh the SNMPv3 trap profile list.
To refresh the SNMPv3 trap profile list:
1. On the top navigation bar, click Monitor.
2. From the navigation pane, select Monitor Options > SNMPv3 Trap Profiles.
3. Click Refresh to view the latest data in the list on the page.
Maintenance tag tasks
You can create maintenance tag tasks for all resources such as network devices, servers, storage, virtualization, container, operating system, database, and middleware. In addition, you can configure parameters for the system to perform relevant actions on the resources.
When assigning permissions to operators, make sure they have the view permissions for both maintenance tag task information and maintenance tag task configuration.
Maintenance tag task list
To maintain or stop a service, you can configure a maintenance tag task. The operator can manage the maintenance tag task as needed.
Add a maintenance tag task
Perform this task to add a maintenance tag task.
To add a maintenance tag task:
1. On the top navigation bar, click Monitor.
2. From the navigation pane, select Maintenance Tag Tasks > Resource Tasks to enter the default Tasks page.
3. Click Add. In the Basic Info area, enter the basic information.
¡ Name: Enter a maintenance tag task name.
¡ Scheduling Type—Select a scheduling type. Options include Periodic and One-Off. The default type is One-Off.
- A one-off task is executed only once according to the start time and end time.
- A periodic task is executed periodically in the selected period according to the start time and end time.
¡ Start Time: Select the start time of the task.
¡ End Time: Select the end time of the task.
¡ Scheduling Interval: Select Every Day, Every Week, or Every Month. This parameter is available when the Scheduling Type is set to Periodic.
¡ Execution Time: Select a specific
day, start time, and end time within the selected scheduling interval. This
parameter is available when the Scheduling Type is
set to Periodic. You can click the Add icon ![]() or Delete icon
or Delete icon ![]() to configure the
execution time.
to configure the
execution time.
¡ Description: Enter the description of the task.
4. In the Resource List area, click Select to select resources on the page that opens.
a. Specify search criteria and then click Search to search resources.
- Resource Group: Search resources by group.
- Resource Type: Search resources by type.
- Resource IP: Search resources by IP address. Fuzzy search is supported.
- Resource Name: Search resources by name. Fuzzy search is supported.
b. Select one or multiple resources in the resource list.
5. Click OK.
6. In the Resource Group area, click Add.
7. In the window that opens, select the resource group to which you want to add the maintenance tag task. You can view resource groups by clicking Expand or Collapse.
8. Click OK.
9. On the page for adding the maintenance tag task, click OK to automatically return and refresh the maintenance tag task list page. You can view the newly added maintenance tag task.
|
|
NOTE: Follow these guidelines when you add maintenance tag tasks: · The time verification for maintenance tag tasks is based on server time. If the server time is between the start and end time of the task, the task will be executed immediately. If the server time is later than the end time, the task will not be created successfully. · Maintenance tag tasks do not support upper or lower levels. That is, you cannot add a maintenance tag task for lower-level resources at the upper level. · You can add a maintenance tag task for a maximum of 300 resources at a time. |
Edit a maintenance tag task
Perform this task to edit an existing maintenance tag task.
To edit a maintenance tag task:
1. On the top navigation bar, click Monitor.
2. From the navigation pane, select Maintenance Tag Tasks > Resource Tasks to enter the default Tasks page.
3. Click the Edit
icon ![]() in the Actions column for a maintenance
tag task.
in the Actions column for a maintenance
tag task.
4. On the page that opens, edit basic information in the Basic Info area.
5. In the Resource List area, edit the selected resources.
6. After modification, click OK to automatically return and refresh the maintenance tag task list page. You can view the edited maintenance tag task.
|
|
NOTE: Follow these guidelines when you edit maintenance tag tasks: · The completed maintenance tag tasks cannot be edited. · You cannot edit the start time for ongoing maintenance tag tasks. · For a periodic task, if the execution time is not between the current time and the end time, you cannot edit the task. |
Search maintenance tag tasks
Perform this task to search existing maintenance tag tasks.
To search maintenance tag tasks:
1. On the top navigation bar, click Monitor.
2. From the navigation pane, select Maintenance Tag Tasks > Resource Tasks to enter the default Tasks page.
3. Perform simple or advanced search.
¡ To
perform simple search, enter a name in the search box at the top right corner
of the page, and then click Search ![]() to
display maintenance tag tasks matching the search criteria. The search criteria
support fuzzy matching and are case insensitive.
to
display maintenance tag tasks matching the search criteria. The search criteria
support fuzzy matching and are case insensitive.
¡ To
perform advanced search, click ![]() to expand the
advanced search area. Set the name, scheduling type, result, state, or time,
and then click the Search to display maintenance
tag tasks matching the search criteria.
to expand the
advanced search area. Set the name, scheduling type, result, state, or time,
and then click the Search to display maintenance
tag tasks matching the search criteria.
Delete maintenance tag tasks
Perform this task to delete existing maintenance tag tasks. Deleting an ongoing task stops the maintenance tag task and deletes it.
To delete maintenance tag tasks:
1. On the top navigation bar, click Monitor.
2. From the navigation pane, select Maintenance Tag Tasks > Resource Tasks to enter the default Tasks page.
3. Delete one maintenance tag task or delete multiple maintenance tag tasks in bulk.
¡ To delete maintenance tag tasks in bulk, select one or multiple tasks in the list and click Delete. In the dialog box that opens, click OK.
¡ To
delete one maintenance tag task, click Delete ![]() in
the Actions column of the task. In the dialog box
that opens, click OK.
in
the Actions column of the task. In the dialog box
that opens, click OK.
Copy a maintenance tag task
Perform this task to copy an existing maintenance tag task.
To copy a maintenance tag task:
1. On the top navigation bar, click Monitor.
2. From the navigation pane, select Maintenance Tag Tasks > Resource Tasks to enter the default Tasks page.
3. Click Copy ![]() in
the Actions column of the task to copy the task and
enter the page for adding a maintenance tag task. This operation is applicable
for reducing duplicate input for the same task requirements.
in
the Actions column of the task to copy the task and
enter the page for adding a maintenance tag task. This operation is applicable
for reducing duplicate input for the same task requirements.
Pause a maintenance tag task
Perform this task to pause an existing maintenance tag task.
To pause a maintenance tag task:
1. On the top navigation bar, click Monitor.
2. From the navigation pane, select Maintenance Tag Tasks > Resource Tasks to enter the default Tasks page.
3. Click the Pause
icon ![]() in the Actions column of a maintenance
tag task in the list to pause it. The ongoing task will no longer take effect
after it is paused.
in the Actions column of a maintenance
tag task in the list to pause it. The ongoing task will no longer take effect
after it is paused.
Resume a maintenance tag task
Perform this task to resume an existing maintenance tag task.
To resume a maintenance tag task:
1. On the top navigation bar, click Monitor.
2. From the navigation pane, select Maintenance Tag Tasks > Resource Tasks to enter the default Tasks page.
3. Click Resume in the Actions column of a paused maintenance tag task in the list to resume it.
View maintenance tag task details
Perform this task to view detailed information about an existing maintenance tag task.
To view details about a maintenance tag task:
1. On the top navigation bar, click Monitor.
2. From the navigation pane, select Maintenance Tag Tasks > Resource Tasks to enter the default Tasks page.
3. Click a task name link in the list, and view details about the task in the window that opens.
Refresh the maintenance tag task list
Perform this task to refresh the maintenance tag task page.
To refresh the maintenance tag task list:
1. On the top navigation bar, click Monitor.
2. From the navigation pane, select Maintenance Tag Tasks > Resource Tasks to enter the default Tasks page.
3. Click Refresh to refresh the maintenance tag task list to view the latest data on the page.
Configure maintenance tag task settings
Perform this task to configure the global settings for resource maintenance tag tasks.
To configure maintenance tag task settings:
1. On the top navigation bar, click Monitor.
2. From the navigation pane, select Maintenance Tag Tasks > Resource Tasks.
3. Click the Settings tab.
4. On the page that opens, configure the following parameters:
¡ Data Collection: Enable or disable data collection of the monitored devices. By default, this option is turned off.
¡ Trap Generation: Enable or disable trap generation for data not in the threshold range, for example, data for various components, collection, configuration polling, and inspection. By default, this option is turned off.
¡ Trap-to-Alarm Upgrade: Enable or disable the upgrade of trap messages generated by the controller system and devices to alarm messages. By default, this option is turned off.
¡ Alarm Forwarding: Enable or disable the forwarding of alarm messages. By default, this option is turned off.
5. Click OK to save the settings.
Search maintenance tag tasks
Perform this task to search the resource-associated maintenance tag tasks.
To search maintenance tag tasks:
1. On the top navigation bar, click Monitor.
2. From the navigation pane, select Maintenance Tag Tasks > Resource Tasks.
3. Click the Resources tab.
4. On the page that opens, configure advanced search criteria.
¡ Resource Name: Search resources by name. Fuzzy search is supported.
¡ Resource Type: Search resources by type.
¡ Resource IP: Search resources by IP address. Fuzzy search is supported.
5. Click Search to display a list of resources that matching the search criteria.
6. Click Refresh to refresh the search result in the resource list in real time.
7. Click the name link of the associated task to view detailed task information.
Server logs
Server logs include event logs, HPE integrated management logs, and log-to-alarm rules. You can customize log settings and log upgrade rules as required.
Event logs
This feature displays the logs for various system events, such as the power supply, system startup, and system firmware operations. You can also upgrade these logs to alarms and define rules for the upgrade.
|
|
NOTE: The system obtains system events through IPMI. Server restart events can be obtained only when the server’s OS is Windows. |
View the event log list
To view event log entries:
1. On the top navigation bar, click the Alarm tab.
2. From the navigation pane, select Server Logs > Event Logs.
The event log list contains the following information:
· Server Name: Name of the current server.
· Event Type: Type of the system event. Options include System, OemTimestamped, and OemNonTimestamped.
· Sensor Type: Sensor that generated the event. A sensor is a module that monitors the sever indexes. It can be a logical module or a physical entity.
· Log Generation Time: Time when the event occurred.
· Log Collection Time: Time when the event log was collected.
· Event Declaration: Including declaring event and undeclaring event.
· Description: Description for the event.
· Log-to-Alarm Upgrade: Upgrade the event log to an alarm.
Perform log-to-alarm upgrade
Perform this task to specify the alarm severity, description, and upgrade rule for system event logs of the servers.
1. On the top navigation bar, click Alarm.
2. From the navigation pane, select Server Logs > Event Logs.
3. Click the Log-to-Alarm Upgrade icon ![]() in the Log-to-Alarm Upgrade column for a log
entry.
in the Log-to-Alarm Upgrade column for a log
entry.
4. In the dialog box that opens, set the alarm severity and description, and select On/Off to determine whether to generate an upgrade rule. Then, click OK.
¡ If you select Off, the system generates an alarm immediately after you finish the configuration.
¡ If you select On, the system opens the log-to-alarm rule configuration page for the event. The rule type is Event Logs. For more information about configuring other parameters, see "Add or edit a log-to-alarm rule." After you finish the rule configuration, the system displays the rule in the log-to-alarm rule list and generates an alarm for the event log.
Search for event logs
Perform this task to search for event logs.
1. On the top navigation bar, click Alarm.
2. From the navigation pane, select Server Logs > Event Logs.
3. Perform basic search or advanced search.
¡ Basic
search: In the upper right corner of the page, enter a server name in the
search field and then click the Search icon ![]() . The
matching server logs will be displayed.
. The
matching server logs will be displayed.
¡ Advanced
search: In the upper right corner of the page, click the Advanced
Search icon ![]() . In the expanded area, set the server name, sensor type,
description, event type, log generation time, and log collection time as
needed, and then click Search. The matching server
logs will be displayed.
. In the expanded area, set the server name, sensor type,
description, event type, log generation time, and log collection time as
needed, and then click Search. The matching server
logs will be displayed.
|
|
NOTE: Due to limitations of Elasticsearch, names containing special characters or Chinese characters might result in failed searches. As a best practice, to use IP addresses for searches. |
Refresh the event log list
Perform this task to refresh the event log list.
1. On the top navigation bar, click the Alarm tab.
2. From the navigation pane, select Server Logs > Event Logs.
3. Click Refresh to view the latest data on the event log list page.
HPE integrated management logs
This feature allows you to view logs for the history events (such as system ROM or iLO monitor events) on servers. You can upgrade such logs to alarms or add new log-to-alarm rules for such events.
View the HPE integrated management logs
To view HPE integrated management log entries:
1. Click the Alarm tab.
2. From the navigation pane, select Server Logs > HPE Integrated Management Logs.
The HPE integrated management log list contains the following information:
· Server Name: Name of the current server.
· Severity: Log severity, which can be Info, Major, Critical, or Repaired.
· Category: Log category, which varies by vendor.
· Log Generation Time: Time when the event occurred.
· Log Collection Time: Time when the log was collected.
· Description: Description for the event.
· Log-to-Alarm Upgrade: Upgrade the log to an alarm.
Perform log-to-alarm upgrade
1. On the top navigation bar, click Alarm.
2. From the navigation pane, select Server Logs > HPE Integrated Management Logs.
3. Click the Log-to-Alarm Upgrade icon ![]() in the Log-to-Alarm Upgrade column for a log
entry.
in the Log-to-Alarm Upgrade column for a log
entry.
4. In the dialog box that opens, set the alarm severity and description, and select On/Off to determine whether to generate an upgrade rule. Then, click OK.
¡ If you select Off, the system generates an alarm immediately after you finish the configuration.
¡ If you select On, the system opens the log-to-alarm rule configuration page for the event. The rule type is HPE Integrated Management Logs. For more information about configuring other parameters, see "Add or edit a log-to-alarm rule." After you finish the rule configuration, the system displays the rule in the log-to-alarm rule list and generates an alarm for the HPE integrated management log.
Search for HPE integrated management logs
Perform this task to search for HPE integrated management logs.
1. On the top navigation bar, click the Alarm tab. From the navigation pane, select Server Logs > HPE Integrated Management Logs.
2. Perform basic search or advanced search.
¡ Basic
search: In the upper right corner of the page, enter a server name in the
search field and then click the Search icon ![]() . The
matching HPE integrated management logs will be displayed.
. The
matching HPE integrated management logs will be displayed.
¡ Advanced
search: In the upper right corner of the page, click the Advanced
Search icon ![]() . In the expanded area, set the server name, category, description,
severity level, and time as needed, and then click Search.
The matching HPE integrated management logs will be displayed.
. In the expanded area, set the server name, category, description,
severity level, and time as needed, and then click Search.
The matching HPE integrated management logs will be displayed.
|
|
NOTE: Due to limitations of Elasticsearch, names containing special characters or Chinese characters might result in failed searches. As a best practice, to use IP addresses for searches. |
Refresh the HPE integrated management log list
Perform this task to refresh the HPE integrated management logs page.
1. On the top navigation bar, click the Alarm tab. From the navigation pane, select Server Logs > HPE Integrated Management Logs.
2. Click Refresh to view the latest data on the HPE integrated management logs page.
Log-to-alarm rules
You can customize rules as required by services to upgrade server event logs or HPE integrated management logs to alarms. The system automatically upgrades logs that match the rules to alarms.
|
|
NOTE: When all logs collection is not enabled, server log alarms are generated when the following conditions are met: · There are relevant alarms in the server's integrated management logs or event logs. · The server's system time must be consistent with (recommended) or later than the U-Center 2.0 server time. U-Center retrieves only the latest event logs and integrated management logs from the server at the time the server was added. · The generated logs match the log-to-alarm rules. |
Add or edit a log-to-alarm rule
You can delete or edit custom log-to-alarm rules. System predefined rules cannot be deleted or edited.
Perform this task to add or edit a custom log-to-alarm rule. The system automatically upgrades event logs or HPE integrated management logs that match the rule to alarms.
1. On the top navigation bar, click Monitors.
2. From the navigation pane, select Server Logs > Log-to-Alarm Rules.
3. Click Add or click the Edit icon ![]() in the Actions column for the rule.
in the Actions column for the rule.
4. On the page that opens, configure the following parameters:
¡ In the Basic Info area, set the rule name and enter a description for the rule.
¡ In the Rule Type Settings area, set the rule type and log severities.
- Options for rule types are HPE Integrated Management Logs (the default type) and Event Logs.
- Options for log severities are Major and Critical. By default, both options are selected.
¡ In the Match Rule Settings area, select a match method for keyword filtering and enter keywords for matching.
- Match Method: Select a match method. Options include fuzzyMatch, fuzzyUnmatch, exactMatch, and exactUnmatch.
- Match Content: Set the match content corresponding to the specified match method for the rule. The match content supports multiple keywords, separated by commas.
¡ In the Alarm Source Settings area, specify the alarm source servers.
Servers: Select the alarm source from the Servers list. Options include All Servers (the default setting) and User-defined Servers.
If you select User-Defined Servers, you must click Select to select servers. Besides, you must enable log monitoring for the selected servers in the corresponding server monitors.
¡ In the Alarm Settings area, set the alarm severity and alarm enabling status.
- Alarm Severity: Select an alarm severity. Options include Critical, Major, Minor, Warning, and Info. For example, in a log-to-alarm rule for HPE integrated management logs, if you set the Severity to Major and the Alarm Severity to Critical, the rule upgrades both Major and Critical levels of logs to Critical alarms. By default, the alarm severity is Major.
- Enable Alarms: If this option is turned on, the system automatically upgrades logs that match the rule to alarms. By default, this option is turned on.
5. Click OK.
Search for log-to-alarm rules
1. On the top navigation bar, click the Alarm tab. From the navigation pane, select Server Logs > Log-to-Alarm Rules.
2. Perform basic search or advanced search.
¡ Basic
search: In the upper right corner of the page, enter a rule name in the search
field and then click the Search icon ![]() . The
matching rules will be displayed.
. The
matching rules will be displayed.
¡ Advanced
search: In the upper right corner of the page, click the Advanced
Search icon ![]() . In the expanded area, set the rule name, match method, match
content, rule type, alarm severity, and status as needed, and then click Search. The matching rules will be displayed.
. In the expanded area, set the rule name, match method, match
content, rule type, alarm severity, and status as needed, and then click Search. The matching rules will be displayed.
Delete log-to-alarm rules
1. On the top navigation bar, click the Alarm tab. From the navigation pane, select Server Logs > Log-to-Alarm Rules.
2. Delete a single rule or delete multiple rules in bulk.
¡ To delete rules in bulk, select one or multiple rules from the rule list, and then click Delete. In the confirmation dialog box that opens, click OK.
¡ To
delete a single rule, click the Delete icon ![]() in
the Actions column for the rule. In the
confirmation dialog box that opens, click OK.
in
the Actions column for the rule. In the
confirmation dialog box that opens, click OK.
Refresh the log-to-alarm rule list
1. On the top navigation bar, click the Alarm tab. From the navigation pane, select Server Logs > Log-to-Alarm Rules.
2. Click Refresh to view the most recent data on the page.
View log-to-alarm rule details
1. On the top navigation bar, click Alarm.
2. From the navigation pane, select Server Logs > Log-to-Alarm Rules.
3. Click the rule name of the target rule.
4. On the page that opens, view the details of the log-to-alarm rule.
Enable a log-to-alarm rule
1. On the top navigation bar, click Monitors.
2. From the navigation pane, select Server Logs > Log-to-Alarm Rules.
3. Click Off in the Status column for the rule to switch the rule status to On.
Disable a log-to-alarm rule
1. On the top navigation bar, click Monitors.
2. From the navigation pane, select Server Logs > Log-to-Alarm Rules.
3. Click On in the Status column for the rule to switch the rule status to Off.
