- Table of Contents
- Related Documents
-
| Title | Size | Download |
|---|---|---|
| 03-Data buffer configuration | 154.42 KB |
Contents
Configuring data buffer alarms
Restrictions and guidelines for data buffer alarm configuration
Configuring per-interface alarm thresholds for the ingress or egress buffer
Configuring per-queue alarm thresholds for the ingress or egress buffer
Configuring per-interface alarm thresholds for the Headroom buffer
Configuring packet-drop alarms
Restrictions and guidelines: TCB configuration
Enabling and configuring TCB in system view
Enabling and configuring TCB in interface view
Display and maintenance commands for TCB
Example: Configuring TCB on an interface
Configuring data buffers
About data buffers
Data buffer types
Data buffers temporarily store packets to avoid packet loss.
The following data buffers are available:
· Ingress buffer—Stores incoming packets when the CPU is busy.
· Egress buffer—Stores outgoing packets when network congestion occurs.
· Headroom buffer—Stores packets when the ingress buffer or egress buffer is used up.
Figure 1 shows the structure of ingress and egress buffers.
Figure 1 Data buffer structure

Cell resources
A buffer uses cell resources to store packets based on packet sizes. Suppose a cell resource provides 208 bytes. The buffer allocates one cell resource to a 128-byte packet and two cell resources to a 300-byte packet.
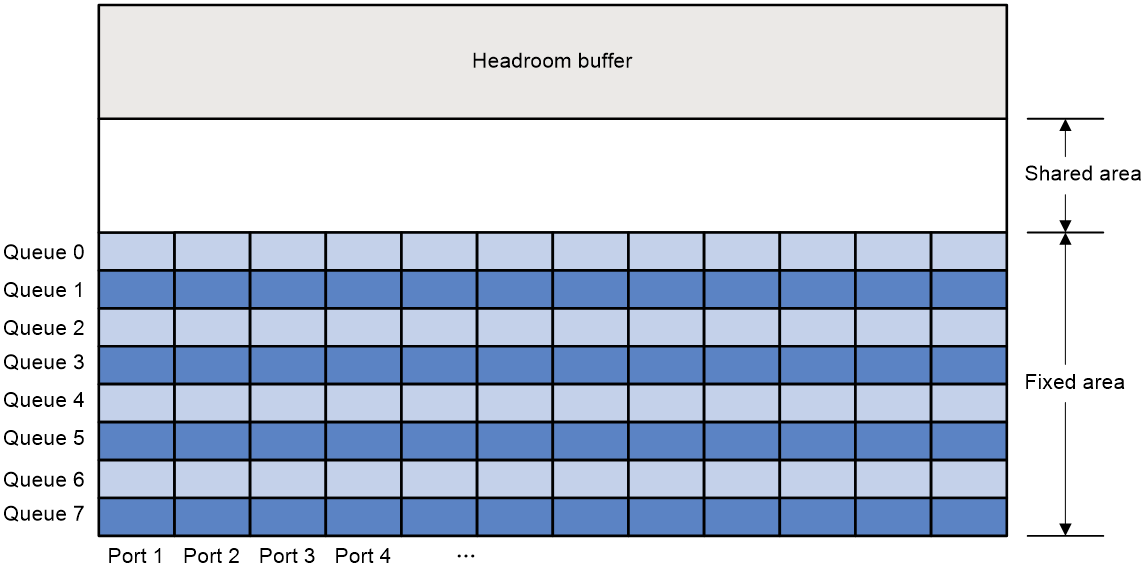
Fixed area and shared area
The cell resources have a fixed area and a shared area.
· Fixed area—Partitioned into queues, each of which is equally divided by all the interfaces on the switch, as shown in Figure 2. When congestion occurs or the CPU is busy, the following rules apply:
a. An interface first uses the relevant queues of the fixed area to store packets.
b. When a queue is full, the interface uses the corresponding queue of the shared area.
c. When the queue in the shared area is also full, the interface discards subsequent packets.
The system allocates the fixed area among queues as specified by the user. Even if a queue is not full, other queues cannot preempt its space. Similarly, the share of a queue for an interface cannot be preempted by other interfaces even if it is not full.
· Shared area—Partitioned into queues, each of which is not equally divided by the interfaces, as shown in Figure 2. The system determines the actual shared-area space for each queue according to user configuration and the number of packets actually received and sent. If a queue is not full, other queues can preempt its space.
The system puts packets received or sent on all interfaces into a queue in the order they arrive. When the queue is full, subsequent packets are dropped.
Figure 2 Fixed area and shared area
Data buffer tasks at a glance
To configure the data buffer, perform the following tasks:
· (Optional.) Configuring data buffer alarms
¡ Configuring per-interface alarm thresholds for the ingress or egress buffer
¡ Configuring per-queue alarm thresholds for the ingress or egress buffer
¡ Configuring per-interface alarm thresholds for the Headroom buffer
¡ Configuring packet-drop alarms
Enabling the Burst feature
About this task
The Burst feature enables the device to automatically allocate cell and packet resources. It is well suited to the following scenarios:
· Broadcast or multicast traffic is intensive, resulting in bursts of traffic.
· Traffic comes in and goes out in one of the following ways:
¡ Enters a device from a high-speed interface and goes out of a low-speed interface.
¡ Enters from multiple same-rate interfaces at the same time and goes out of an interface with the same rate.
Procedure
1. Enter system view.
system-view
2. Enable the Burst feature.
burst-mode enable
By default, the Burst feature is disabled.
Configuring data buffer alarms
About data buffer alarms
This feature works with a network management system (such as IMC). Data buffer alarms include threshold-crossing alarms and packet drop alarms. The device reports these alarms to the network management system for displaying the data buffer usage.
You can configure data buffer alarms on a per-interface basis or a per-queue basis.
Restrictions and guidelines for data buffer alarm configuration
Configuring per-queue alarm thresholds is supported for only the egress buffer.
Configuring per-interface alarm thresholds for the ingress or egress buffer
1. Enter system view.
system-view
2. Configure the alarm thresholds. Choose the options to configure as needed:
¡ Configure the global alarm threshold.
buffer { egress | ingress } usage threshold slot slot-number null-queue ratio ratio
The default setting is 100%.
¡ Execute the following commands in sequence to configure the alarm threshold on an interface:
interface interface-type interface-number
port buffer { egress | ingress } usage threshold null-queue ratio ratio
By default, an interface uses the global alarm threshold.
If you configure both the global alarm threshold and the alarm threshold on an interface, the latter takes effect.
3. Enable threshold-crossing alarms.
buffer threshold alarm { egress | ingress } enable
By default, threshold-crossing alarms are disabled.
4. (Optional.) Set the interval for sending threshold-crossing alarms.
buffer threshold alarm { egress | ingress } interval interval
The default setting is 5 seconds.
Configuring per-queue alarm thresholds for the ingress or egress buffer
1. Enter system view.
system-view
2. Configure the alarm thresholds.
¡ Execute the following commands in sequence to configure the alarm threshold for a queue on an interface:
interface interface-type interface-number
buffer egress usage threshold queue queue-id ratio ratio
The default setting is 100%.
3. Enable threshold-crossing alarms.
buffer threshold alarm { egress | ingress } enable
By default, threshold-crossing alarms are disabled.
4. (Optional.) Set the interval for sending threshold-crossing alarms.
buffer threshold alarm { egress | ingress } interval interval
The default setting is 5 seconds.
Configuring per-interface alarm thresholds for the Headroom buffer
1. Enter system view.
system-view
2. Configure the alarm thresholds. Choose the options to configure as needed:
¡ Configure the global alarm threshold.
buffer usage threshold headroom slot slot-number ratio ratio
The default setting is 100%.
¡ Execute the following commands in sequence to configure the alarm threshold on an interface:
interface interface-type interface-number
port buffer usage threshold headroom null-queue ratio ratio
By default, an interface uses the global alarm threshold.
If you configure both the global alarm threshold and the alarm threshold on an interface, the latter takes effect.
3. Enable threshold-crossing alarms.
buffer threshold alarm headroom enable
By default, threshold-crossing alarms are disabled.
4. (Optional.) Set the interval for sending threshold-crossing alarms.
buffer threshold alarm headroom interval interval
The default setting is 5 seconds.
Configuring packet-drop alarms
About this task
This feature allows the device to periodically send packet-drop information to the NMS.
Restrictions and guidelines
This feature does not take effect on the Headroom buffer.
Procedure
1. Enter system view.
system-view
2. Enable packet-drop alarms.
buffer packet-drop alarm enable
By default, packet-drop alarms are disabled.
3. (Optional.) Set the interval for sending packet-drop alarms.
buffer packet-drop alarm interval interval
The default setting is 5 seconds.
Configuring TCB
About TCB
Overview
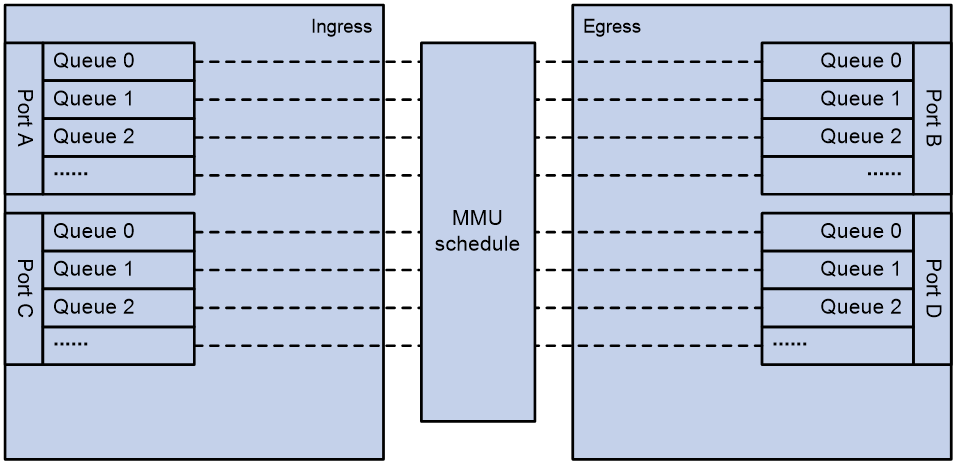
The Transient Capture Buffer (TCB) feature monitors packet drop events on a set of memory management unit (MMU) resources. When a packet is dropped on a queue, the system collects drop time, drop reason, packet metadata, and other information and reports them to an NMS through gRPC.
An MMU manages the allocation of the ingress buffer and egress buffer and flexibly schedules queues to deal with traffic bursts.
Figure 3 MMU queues
How TBC works
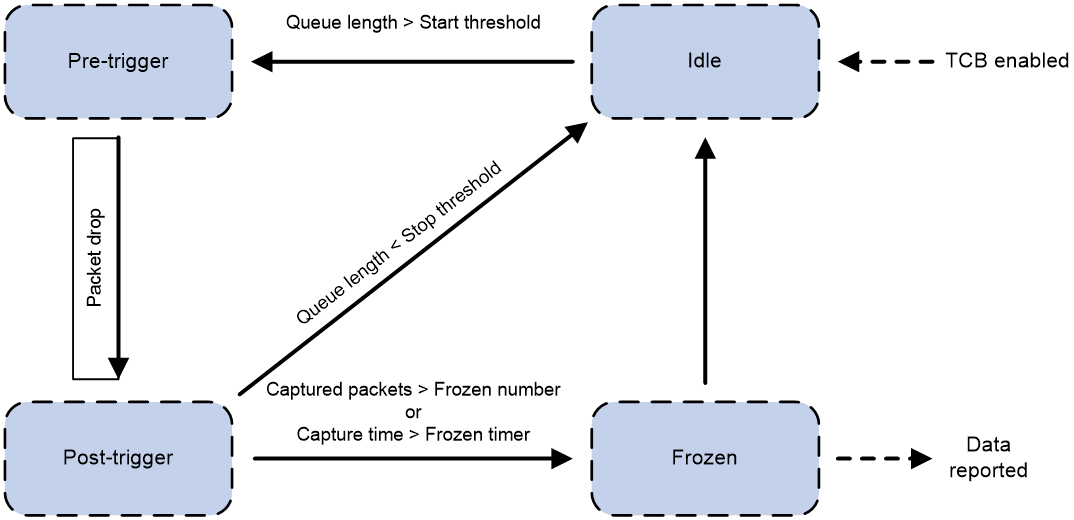
The TCB state machine works as follows:
1. The state machine enters the idle state when TCB is enabled.
2. When the queue length is greater than start-threshold-value, the state machine transitions from the idle state to the pre-trigger state. The system captures packets by using the pre-sample-rate.
3. When packet drops occur on the queue, the state machine transitions from the pre-trigger to the post-trigger state.
4. When the queue length is smaller than stop-threshold-value, the state machine transitions from the post-trigger to the idle state. The system stops capturing packets.
5. When the queue length is greater than start-threshold-value, step 2 is repeated.
6. When the number of captured packets reaches the frozen-number or the capture timer expires, the state machine transitions from the post-trigger to the frozen state.
7. The state machine analyzes the drop reason and dropped packet characteristics and sends the analysis results to the gRPC module, which reports them to an NMS.
8. The state machine transitions from the frozen to the idle state.
Figure 4 TCB state machine
Restrictions and guidelines: TCB configuration
You can configure TCB in system view or interface view, but not in both views at the same time. For example, if you have configured TCB in system view, to configure TCB in interface view, you must first delete the TCB configuration in system view.
The TCB configuration in system view takes effect on all TCB-capable interfaces. The TCB configuration in interface view takes effect only on the specified interface.
Only one interface on the device can be configured with TCB when you configure TCB in interface view.
TCB cannot identify tunnel-encapsulated TCP or UDP packets if local analysis is enabled or an ACL is referenced.
The gRPC sampling paths for TCB are tcb/tcbpacketinfoevent and tcb/tcbrawpacketinfoevent. For more information about gRPC, see "Configuring gRPC."
Packet drop information is displayed for only TCP or UDP packets when local analysis is performed.
Enabling and configuring TCB
Enabling and configuring TCB in system view
1. Enter system view.
system-view
2. Enable and configure TCB.
buffer transient-capture global [ slot slot-number ] egress enable [ no-local-analysis ] [ acl { ipv4-acl-number | name ipv4-acl-name } ] [ start-threshold start-threshold-value stop-threshold stop-threshold-value ] [ frozen-number frozen-number frozen-timer timer-value ] [ pre-sample-rate pre-sample-rate post-sample-rate post-sample-rate ] [ poll-frequency frequency-value ]
By default, TCB is disabled.
Enabling and configuring TCB in interface view
1. Enter system view.
system-view
2. Enter interface view.
interface interface-type interface-number
3. Enable and configure TCB.
buffer transient-capture { egress [ queue queue-id ] } enable [ no-local-analysis ] [ acl { ipv4-acl-number | name ipv4-acl-name } ] [ start-threshold start-threshold-value stop-threshold stop-threshold-value ] [ frozen-number frozen-number frozen-timer timer-value ] [ pre-sample-rate pre-sample-rate post-sample-rate post-sample-rate ] [ poll-frequency frequency-value ]
By default, TCB is disabled.
Display and maintenance commands for TCB
Execute display commands in any view.
|
Task |
Command |
|
Display packet drop information. |
display buffer transient-capture packet-drop slot slot-number { ethernet | ipv4 | ipv6 } |
TCB configuration examples
Example: Configuring TCB on an interface
Network configuration
As shown in Figure 5, configure TCB and gRPC on the device to monitor packet drops and report packet drop information to the collector through gRPC.

Procedure
1. Assign IP addresses to the device and the collector and configure routes. Make sure the network connections are available. (Details not shown.)
2. Configure TCB:
# Create an IPv4 advanced ACL numbered 3001, and configure a rule to match packets with source IP address 192.168.5.2.
<Device> system-view
[Device] acl advanced 3001
[Device-acl-ipv4-adv-3001] rule permit ip source 192.168.5.2 0
[Device-acl-ipv4-adv-3001] quit
# Configure TCB on Ten-GigabitEthernet 1/0/1.
[Device] interface ten-gigabitethernet 1/0/1
[Device-Ten-GigabitEthernet1/0/1] buffer transient-capture egress queue 1 enable no-local-analysis acl 3001 start-threshold 10000 stop-threshold 5000 frozen-number 1000 frozen-timer 400 pre-sample-rate 10 post-sample-rate 10 poll-frequency 600
[Device-Ten-GigabitEthernet1/0/1] quit
3. Configure gRPC:
# Enable the gRPC service.
[Device] grpc enable
# Create a sensor group named test, and add sensor paths tcb/tcbpacketinfoevent and tcb/tcbrawpacketinfoevent.
[Device] telemetry
[Device-telemetry] sensor-group test
[Device-telemetry-sensor-group-test] sensor path tcb/tcbpacketinfoevent
[Device-telemetry-sensor-group-test] sensor path tcb/tcbrawpacketinfoevent
[Device-telemetry-sensor-group-test] quit
# Create a destination group named collector1. Specify a collector that uses IPv4 address 192.168.2.1 and port number 50050.
[Device-telemetry] destination-group collector1
[Device-telemetry-destination-group-collector1] ipv4-address 192.168.2.1 port 50050
[Device-telemetry-destination-group-collector1] quit
# Configure a subscription named A to bind sensor group test with destination group collector1. Set the sampling interval to 10 seconds.
[Device-telemetry] subscription A
[Device-telemetry-subscription-A] sensor-group test sample-interval 10
[Device-telemetry-subscription-A] destination-group collector1
[Device-telemetry-subscription-A] quit
[Device-telemetry] quit
Verifying the configuration
# Verify that the collector receives packet drop information when packet drops occur on a queue enabled with TCB. (Details not shown.)
