- Table of Contents
- Related Documents
-
| Title | Size | Download |
|---|---|---|
| 03-Hardware resource management configuration | 110.02 KB |
Hardware resource management tasks at a glance
Configuring CPU usage tracking
Displaying CPU usage monitoring information
Setting memory alarm thresholds
Displaying memory usage monitoring information
Configuring resource monitoring
Displaying resource monitoring information
Setting the temperature alarm thresholds
Displaying device temperature information
Setting the port status detection timer
Specifying the hardware resource mode for MAC address entries, APR/ND entries, and routing entries
Verifying and diagnosing transceiver modules
Diagnosing transceiver modules
Managing hardware resources
This chapter describes routine device hardware resource management tasks, including monitoring CPU and memory usage, displaying power supply and fan operating status, and configuring basic device operating parameters.
Hardware resource management tasks at a glance
All hardware resource management tasks are optional. You can perform any of the tasks in any order.
¡ Configuring CPU usage tracking
¡ Displaying CPU usage monitoring information
¡ Setting memory alarm thresholds
¡ Displaying memory usage monitoring information
¡ Configuring resource monitoring
¡ Displaying resource monitoring information
· Monitoring device temperature
¡ Setting the temperature alarm thresholds
¡ Displaying device temperature information
· Setting the port status detection timer
· Verifying and diagnosing transceiver modules
¡ Verifying transceiver modules
¡ Diagnosing transceiver modules
· Displaying device hardware information
· Displaying device hardware electronic label information
Monitoring CPU usage
Configuring CPU usage alarm
About this task
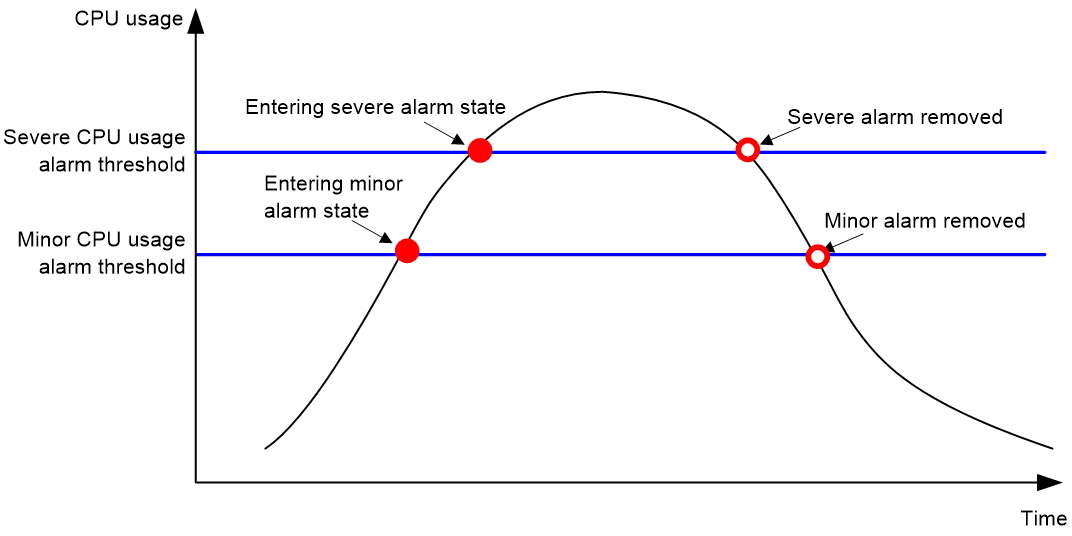
The device samples CPU usage at 1-minute intervals, and compares the samples with CPU usage thresholds to identify the CPU usage status and send alarms or notifications accordingly.
The device supports the following CPU usage thresholds:
· Minor threshold—If the CPU usage increases to or above the minor threshold but is less than the severe threshold, the CPU usage enters minor alarm state. The device sends minor alarms periodically until the CPU usage increases above the severe threshold or the minor alarm is removed.
· Severe threshold—If the CPU usage increases above the severe threshold, the CPU usage enters severe alarm state. The device sends severe alarms periodically until the severe alarm is removed.
CPU usage alarms and notifications can be sent to NETCONF, SNMP, and the information center to be encapsulated as NETCONF events, SNMP traps and informs, and log messages. For more information about NETCONF and SNMP, see Network Management and Monitoring Configuration Guide. For more information about information center, see "Configuring the information center."
Figure 1 CPU alarms and alarm-removed notifications
Procedure
1. Enter system view.
system-view
2. Set the CPU usage alarm thresholds.
monitor cpu-usage threshold severe-threshold [ minor-threshold minor-threshold ]
By default, the CPU usage alarm threshold is 99%.
|
|
CAUTION: If you set the severe CPU usage alarm threshold to a too low value, the device will reach the threshold easily. Normal service processing will be affected. |
3. Set the CPU usage alarm resending intervals.
monitor resend cpu-usage { minor-interval minor-interval | severe-interval severe-interval } *
By default, the minor CPU usage alarm resending interval and severe CPU usage alarm resending interval are 300 seconds and 60 seconds, respectively.
Configuring CPU usage tracking
About this task
After you enable CPU usage tracking, the system samples CPU usage at intervals and saves the samples to a buffer. You can use the display cpu-usage history command to view the recent CPU usage.
Procedure
1. Enter system view.
system-view
2. Set the sampling interval for CPU usage tracking.
monitor cpu-usage interval interval
By default, the sampling interval for CPU usage tracking is 1 minute.
3. Enable CPU usage tracking.
monitor cpu-usage enable
By default, CPU usage tracking is enabled.
Displaying CPU usage monitoring information
Perform display tasks in any view.
· Display CPU usage monitoring settings.
display cpu-usage configuration
· Display the current CPU usage statistics.
display cpu-usage [ control-plane ] [ summary ]
· Display the historical CPU usage statistics in a coordinate system.
display cpu-usage history [ job job-id ]
Monitoring memory usage
Setting memory alarm thresholds
About this task
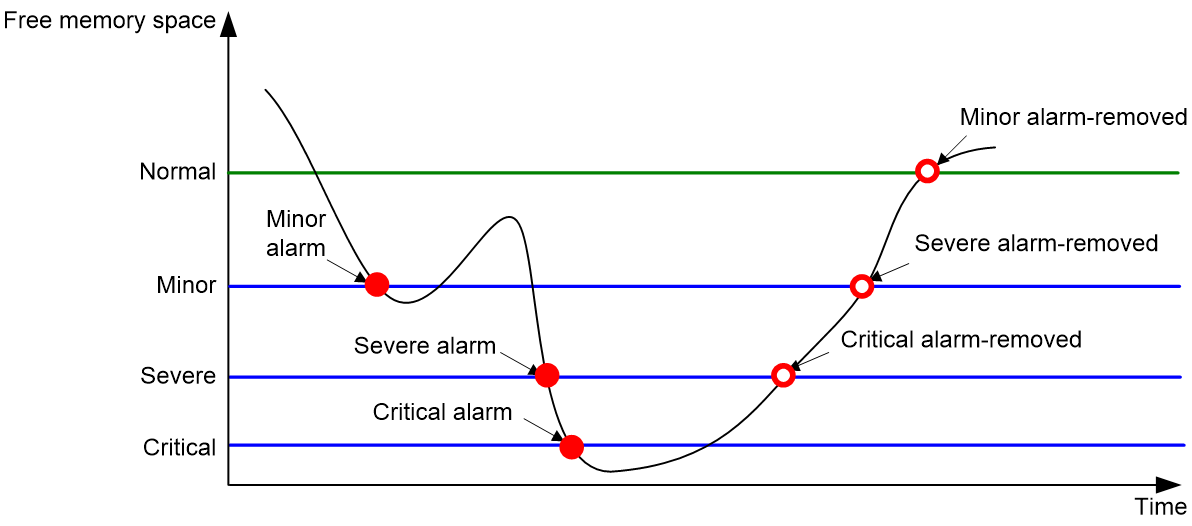
To ensure correct operation and improve memory efficiency, the system monitors the amount of free memory space in real time. If the amount of free memory space reaches the minor, severe, or critical alarm threshold, the system issues an alarm to affected service modules and processes.
You can use the display memory command to display memory usage information.
As shown in the following table and figure, the system supports the following free-memory thresholds:
As shown in Table 1 and Figure 2, the system supports the following free-memory thresholds:
· Normal state threshold.
· Minor alarm threshold.
· Severe alarm threshold.
· Critical alarm threshold.
Table 1 Memory alarm notifications and memory alarm-removed notifications
|
Notification |
Triggering condition |
Remarks |
|
Early-warning notification |
The amount of free memory space decreases to or below the early-warning threshold. |
After generating and sending an early-warning notification, the system does not generate and send any additional early-warning notifications until the early warning is removed. |
|
Minor alarm notification |
The amount of free memory space decreases to or below the minor alarm threshold. |
After generating and sending a minor alarm notification, the system does not generate and send any additional minor alarm notifications until the minor alarm is removed. |
|
Severe alarm notification |
The amount of free memory space decreases to or below the severe alarm threshold. |
After generating and sending a severe alarm notification, the system does not generate and send any additional severe alarm notifications until the severe alarm is removed. |
|
Critical alarm notification |
The amount of free memory space decreases to or below the critical alarm threshold. |
After generating and sending a critical alarm notification, the system does not generate and send any additional critical alarm notifications until the critical alarm is removed. |
|
Critical alarm-removed notification |
The amount of free memory space increases above the severe alarm threshold. |
N/A |
|
Severe alarm-removed notification |
The amount of free memory space increases above the minor alarm threshold. |
N/A |
|
Minor alarm-removed notification |
The amount of free memory space increases above the normal state threshold. |
N/A |
|
Early-warning-removed notification |
The amount of free memory space increases above the sufficient-memory threshold. |
N/A |
Figure 2 Memory alarm notifications and alarm-removed notifications
Procedure
1. Enter system view.
system-view
2. Set the memory usage threshold.
memory-threshold usage memory-threshold
By default, the memory usage threshold is 100%.
3. Set the free-memory thresholds.
memory-threshold [ ratio ] minor minor-value severe severe-value critical critical-value normal normal-value
The default settings are as follows:
¡ Minor alarm threshold—256 MB.
¡ Severe alarm threshold—192 MB.
¡ Critical alarm threshold—128 MB.
¡ Normal state threshold—320 MB.
Displaying memory usage monitoring information
Perform display tasks in any view.
· Display memory usage information.
display memory [ summary ]
· Display memory alarm thresholds and statistics.
display memory-threshold
Monitoring resource usage
Configuring resource monitoring
About this task
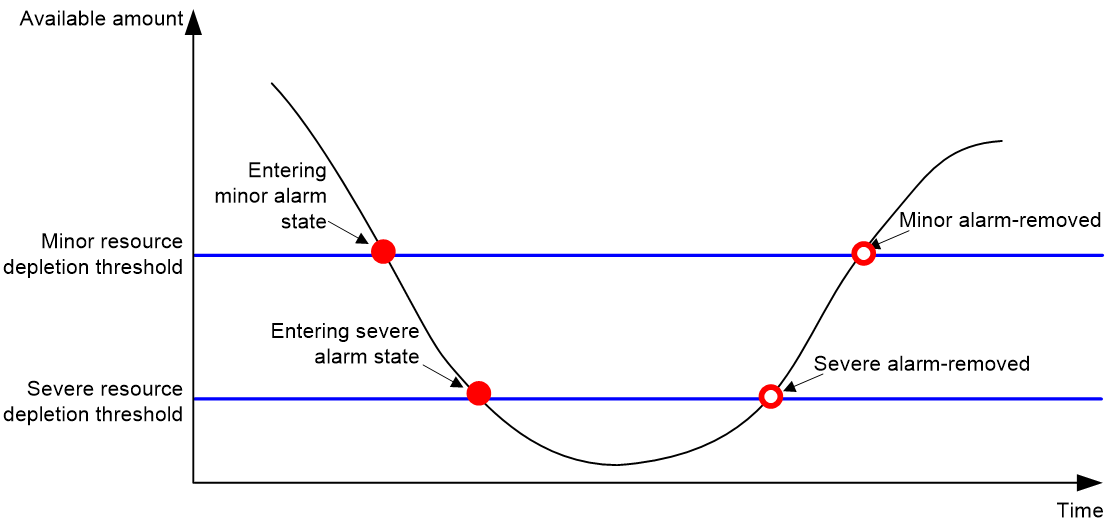
The resource monitoring feature enables the device to monitor the available amounts of types of resources, for example, the space for ARP entries. The device samples the available amounts periodically and compares the samples with resource depletion thresholds to identify the resource depletion status.
The device supports a minor resource depletion threshold and a severe resource depletion threshold for each supported resource type.
· If the available amount is equal to or less than the minor resource depletion threshold but greater than the severe resource depletion threshold, the resource type is in minor alarm state.
· If the available amount is equal to or less than the severe resource depletion threshold, the resource type is in severe alarm state.
· If the available amount increases above the minor resource depletion threshold, the resource type is in recovered state.
When a resource type enters severe alarm state, the device issues a severe alarm. If the resource type stays in severe alarm state, the device resends severe alarms periodically.
When a resource type enters minor alarm state, the device issues a minor alarm. If the resource type stays in minor alarm state or changes from severe alarm state to minor alarm state, the device identifies whether resending of minor resource depletion alarms is enabled. If the feature is disabled, the device does not issue additional minor alarms. If the feature is enabled, the device resends minor alarms periodically.
Resource depletion alarms can be sent to NETCONF, SNMP, and the information center to be encapsulated as NETCONF events, SNMP traps and informs, and log messages. For more information about NETCONF and SNMP, see Network Management and Monitoring Configuration Guide. For more information about information center, see "Configuring the information center."
Figure 3 Resource depletion alarms and alarm-removed notifications
Procedure
1. Enter system view.
system-view
2. Set resource depletion thresholds.
resource-monitor resource resource-name cpu cpu-number by-percent minor-threshold minor-threshold severe-threshold severe-threshold
The default varies by resource type. Use the display resource-monitor command to display the resource depletion thresholds.
3. Specify destinations for resource depletion alarms.
resource-monitor output { netconf-event | snmp-notification | syslog } *
By default, resource depletion alarms are sent to NETCONF, SNMP, and the information center.
4. Enable resending of minor resource depletion alarms.
resource-monitor minor resend enable
By default, resending of minor resource depletion alarms is enabled.
Displaying resource monitoring information
To display resource monitoring information, execute the following command in any view:
display resource-monitor [ resource resource-name ] [ slot slot-number [ cpu cpu-number ] ]
Monitoring device temperature
Setting the temperature alarm thresholds
About this task
The device monitors its temperature based on the following thresholds:
· Low-temperature threshold.
· High-temperature warning threshold.
· High-temperature alarming threshold.
When the device temperature drops below the low-temperature threshold or reaches the high-temperature warning or alarming threshold, the device performs the following operations:
· Sends log messages and traps.
· Sets LEDs on the device panel.
Procedure
1. Enter system view.
system-view
2. Configure the temperature alarm thresholds.
temperature-limit slot slot-number hotspot sensor-number lowlimit warninglimit [ alarmlimit ]
The defaults vary by temperature sensor model. To view the defaults, execute the undo temperature-limit and display environment commands in turn.
The high-temperature alarming threshold must be higher than the high-temperature warning threshold, and the high-temperature warning threshold must be higher than the low-temperature threshold.
Displaying device temperature information
To display device temperature information, execute the following command in any view:
display environment [ slot slot-number ]
Monitoring fans
Displaying fan information
Perform display tasks in any view.
· Display fan tray operating status information.
display fan [ slot slot-number [ fan-id ] ]
· Display electronic label information for a fan tray.
display device manuinfo slot slot-number fan fan-id
Setting the port status detection timer
About this task
The device starts a port status detection timer when a port is shut down by a protocol. If the port has been in down state before the timer expires, the device will set the port status to the port's physical status.
Procedure
1. Enter system view.
system-view
2. Set the port status detection timer.
shutdown-interval time
By default, the port status detection timer is 30 seconds.
Specifying the hardware resource mode for MAC address entries, APR/ND entries, and routing entries
About this task
The device supports multiple hardware resource modes. The quantities of MAC address entries, APR/ND entries, and routing entries supported by the device vary by hardware resource mode.
|
Hardware resource mode |
MAC address entries |
APR/ND entries |
IPv4 routing entries |
IPv6 routing entries |
|
0 NORMAL |
128K |
88K/66K |
216K |
108K |
|
1 ROUTING |
32K |
40K/34K |
504K |
252K |
|
2 MAC |
256K |
96K/96K |
16K |
8K |
Restrictions and guidelines
For this configuration to take effect, you must save the configuration and reboot the device. Before rebooting the device, evaluate the impact on the network and make preparations.
The quantities descried in Table 2 are the maximum theoretical values.
Procedure
1. Enter system view.
system-view
2. Specify the hardware resource mode for MAC address entries, APR/ND entries, and routing entries.
hardware-mode { 0 | 1 | 2 }
By default, the normal hardware resource mode applies.
Verifying and maintaining the hardware source mode
To display the hardware source mode, execute the following command in any view:
display hardware-mode status
Verifying and diagnosing transceiver modules
Verifying transceiver modules
About this task
You can use one of the following methods to verify the genuineness of a transceiver module:
· Display the key parameters of a transceiver module, including its transceiver type, connector type, central wavelength of the transmit laser, transfer distance, and vendor name.
· Display its electronic label. The electronic label is a profile of the transceiver module and contains the permanent configuration, including the serial number, manufacturing date, and vendor name. The data was written to the transceiver module or the device's storage component during debugging or testing of the transceiver module or device.
The device regularly checks transceiver modules for their vendor names. If a transceiver module does not have a vendor name or the vendor name is not H3C, the device repeatedly outputs traps and log messages. For information about logging rules, see "Configuring the information center."
Procedure
To verify transceiver modules, execute the following commands in any view:
· Display the key parameters of transceiver modules.
display transceiver interface [ interface-type interface-number ]
· Display the electrical label information of transceiver modules.
display transceiver manuinfo interface [ interface-type interface-number ]
Diagnosing transceiver modules
About this task
The device provides the alarm and digital diagnosis functions for transceiver modules. When a transceiver module fails or is not operating correctly, you can perform the following tasks:
· Check the alarms that exist on the transceiver module to identify the fault source.
· Examine the key parameters monitored by the digital diagnosis function, including the temperature, voltage, laser bias current, TX power, and RX power.
Procedure
To diagnose transceiver modules, execute the following commands in any view:
· Display transceiver alarms.
display transceiver alarm interface [ interface-type interface-number ]
· Display the current values of the digital diagnosis parameters on transceiver modules.
display transceiver diagnosis interface [ interface-type interface-number ]
Displaying device hardware information
To display device hardware information, execute the following command in any view:
display device [ flash | usb ] [ slot slot-number [ subslot subslot-number ] | verbose ]
Displaying device hardware electronic label information
To display hardware electronic label information for the device, execute the following command in any view:
display device manuinfo [ slot slot-number ]
