- Table of Contents
- Related Documents
-
| Title | Size | Download |
|---|---|---|
| 01-Text | 774.84 KB |
Contents
Modify the default password of the admin account
Viewing integrated management logs
View host monitors in host mode
View host monitors in list mode
View the application group list
Quick start
U-Center provides users with an intuitive, interactive Web interface that can be accessed through a Web browser.
The following information covers these topics:
· Access U-Center.
· Explore the U-Center GUI.
· Design the U-Center overview page.
· Use the operator management functions.
Access U-Center
U-Center is developed based on the browser/server model. Users can access U-Center directly by entering the URL of the U-Center server in the Web browser.
Table 1 lists the Web browsers supported by U-Center.
Table 1 Recommended Web browsers
|
Browser |
Version |
|
Internet Explorer |
IE 10.0/IE 11.0 or later |
|
Firefox |
Firefox 50 or later |
|
Chrome |
Chrome 35 or later |
U-Center can be accessed through both HTTP and HTTPS, by using URLs in the following formats:
· http://<IP address>:<port>
· https://<IP address>:<port>
By default, U-Center uses HTTP service port 8080 and HTTPS service port 8443.
|
|
NOTE: You can use the predefined administrator account (with username admin and password admin) for initial access to U-Center. After login, change the default account password as soon as possible to improve security. |
Explore the U-Center GUI
About the U-Center GUI
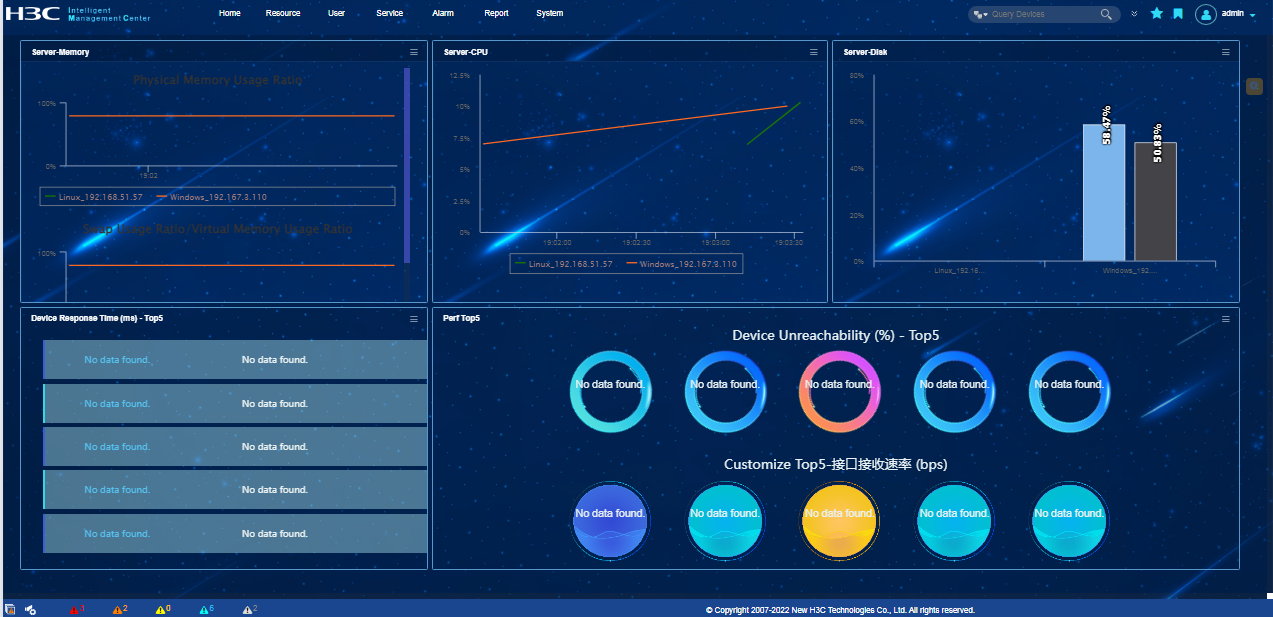
U-Center displays the O&M overview page by default after a user logs in. As shown in Figure 1, the overview page contains these areas:
· (1) Top navigation bar
· (2) Search box
· (3) O&M work pane
· (4) Alarm statistics
· (5) Left navigation pane
See Figure 1 for descriptions of these areas.
Figure 1 U-Center Overview page
Click a tab on the top navigation bar to open the operation interface of the corresponding function module. For example, clicking Resource opens the resource management module interface, as shown in Figure 2.
Figure 2 Resource management interface
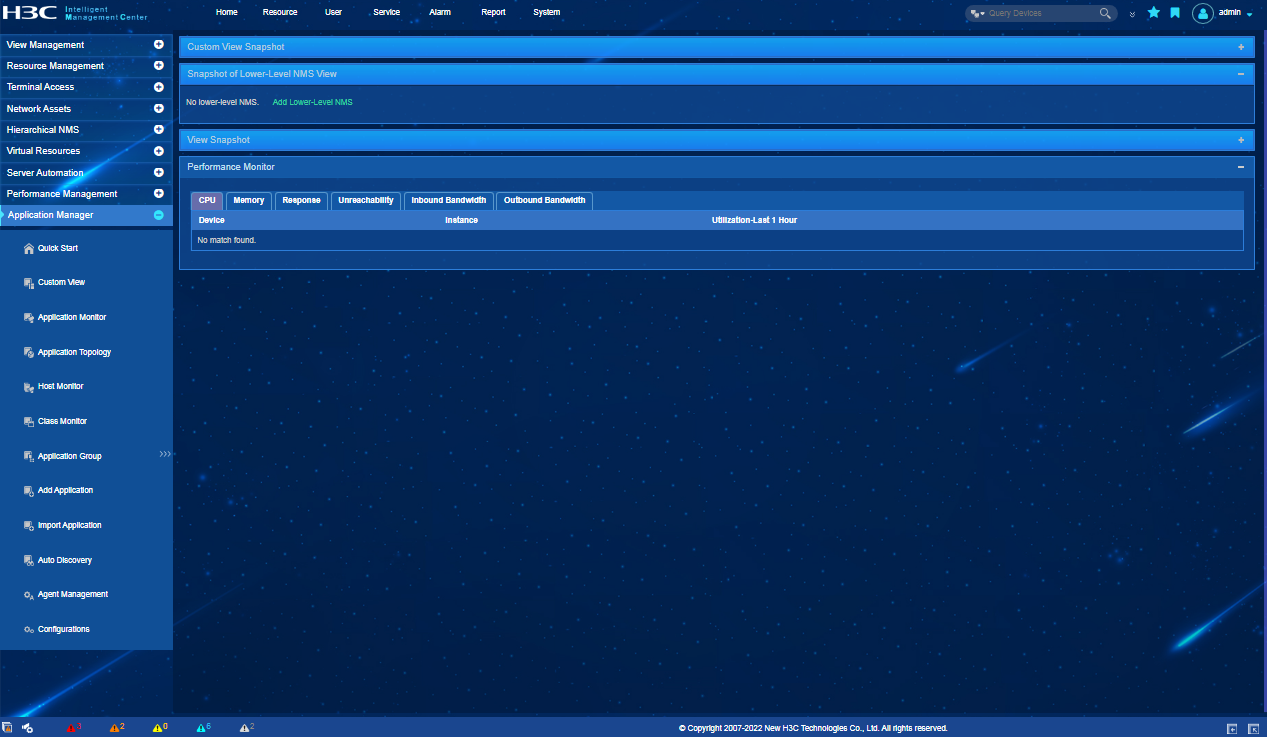
Table 2 U-Center GUI areas
|
Item |
Name |
Description |
|
1 |
Top navigation bar |
Provides one-key access to the function modules of U-Center. |
|
2 |
Search box |
Allows you to filter the objects (such as users, devices, and interfaces) displayed on the current screen. You can switch to the advanced search mode, which provides more search criteria. |
|
3 |
O&M work pane |
Comprises two layers, space and widget. If you log in to U-Center for the first time, you can see the default space, which comprises widgets displaying the process, task, and other resource summary information. You can customize a space and add system-defined widgets to your space. You can also specify a space as the default space. |
|
4 |
Alarm statistics |
Displays the alarm statistics by severity level in the system, accompanied by user-defined voice alerts for reporting alarms of specific levels. |
|
5 |
Left navigation pane |
Provides access to all resources and functions pertaining to the function module selected on the top navigation bar. |
Design the overview page
The U-Center overview page displays information in a hierarchical way. It comprises two layers, space and widget. If you log in to U-Center for the first time, you can see the default space, which comprises widgets displaying the alarm, resource, and performance summary information of the network.
U-Center modules also offer a variety of widgets in order to meet your viewing and monitoring needs.
You can customize a space and add system-defined alarm, resource, performance, and other modules' widgets to your space.
Add a space
1. Click the Settings icon
![]() to the right of the O&M work pane to enter the editing mode.
to the right of the O&M work pane to enter the editing mode.
2. Click the Add new space icon ![]() below
the top navigation bar.
below
the top navigation bar.
3. Enter a name for the new space, and then click any blank part of the page to complete naming the space.
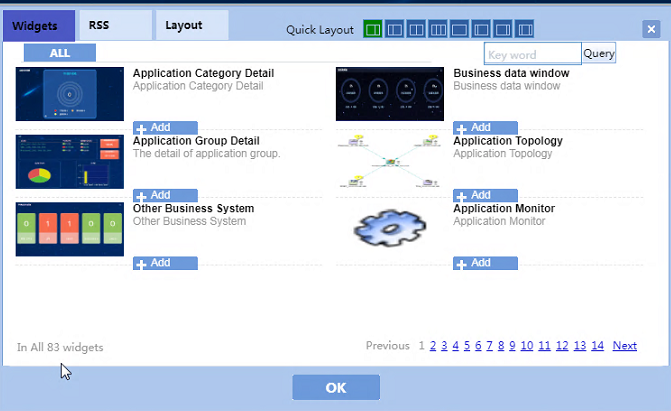
Add widgets to a space
2. Select Edit from the shortcut menu.
The dialog box for designing the space opens. By default, the Widgets tab is displayed.
The Widgets tab displays all the system-defined widgets.
3. Locate a widget by using one of the following methods:
¡ Click a tab to display the widgets of a specific category. s
¡ Query a widget by entering a keyword in the search box.
4. Click ![]() for a widget to add it to the space.
for a widget to add it to the space.
Repeat steps 3 and 4 to add more widgets to the space.
5. Click OK.
Figure 3 Designing a space
Operator management
The operator management module allows you to manage operators and control their privileges based on a set of features to secure management of the network through U-Center.
You can define the access and management rights and restrictions for each operator through various features, such as by assigning a role to the operator through operator group assignment. For each operator, you can specify the user groups, device groups, views, and processes the operator can manage, and configure login control rules for the operator.
U-Center provides a predefined account with login name admin and password admin. You can use the account for initial access to U-Center. After login, change the default password of the admin account as soon as possible to improve security.
Modify the default password of the admin account
1. Log in to U-Center by using the default admin account.
2. On the top navigation bar, click System.
3. From the navigation pane, select Operator Management > Modify Password.
4. Enter the old password and the new password, and confirm the new password.
5. Click OK.
Add an operator
1. On the top navigation bar, click System.
2. From the navigation pane, select Operator Management > Operator.
3. Click Add.
The Add Operator page opens.
4. Configure the following parameters:
¡ Login Name: Enter a valid login name.
¡ Full Name: Enter the operator's full name. This field is optional.
¡ Authentication Type: Select an authentication type from the list. Supported authentication types are Password, RADIUS, LDAP, and TACACS. To use the RADIUS, LDAP, or TACACS authentication type, you must configure the authentication server settings on the Authentication Server page.
¡ Password: Enter the operator's password. This parameter is available only when Password is selected from the Authentication Type list.
¡ Confirm Password: Re-enter the operator's password. This parameter is available only when Password is selected from the Authentication Type list.
¡ Idle Timeout: Configure the session idle timeout time for the operator.
- Select Same as System Settings if you want to apply system-wide settings to this operator account.
- Select Configure Individually if you want to configure the idle timeout for this operator manually. Enter the idle timeout time in minutes for this operator in the field next to the Idle Timeout list.
¡ Operator Group: Select the Viewer Group, Maintainer Group or Administrator Group from the list. Each group corresponds to a different set of privileges.
5. Configure the permissions access control rules for the operator account as needed.
6. Click OK.
Server management
U-Center provides integrated management for servers, including automatic bare-metal server deployment and server resource management. It simplifies server management and reduces operation costs.
a. Add server parameters.
b. Add servers manually or add servers through automatic discovery based on the specified server parameters.
Server resource
This module allows you to centrally manage servers including bare-metal servers automatically deployed by U-Center or servers manually added to U-Center. You can view the server status, hardware status, performance data, logs, deployment history, and server topology, and perform basic server management functions.
View the dashboard
Perform this task to view the statistic of server resources, including VM creation information, server inspection, and information about each server. Server information include fan speed, power status, temperature, CPU usage, memory usage, IOPS, and network rate.
To view the dashboard:
1. On the top navigation bar, click Resource.
2. From the navigation pane, select Server Automation > Server Resource.
The Dashboard tab opens by default.
When you view the dashboard, follow these restrictions and guidelines:
· The Dashboard page displays only statistics for monitors that have been added in Performance Management.
· The summary data from Performance Management are the average values in the most recent hour.
View the server topology
1. On the top navigation bar, click Resource.
2. From the navigation pane, select Server Automation > Server Resource.
3. Click the Server Topology tab.
The Server Topology page displays the topology of all servers. The server topology contains only servers and devices directly connected to each server.
Manage server resources
Perform this task to view detailed information for a server and manage the server.
To view detailed information for a server and manage the server:
1. On the top navigation bar, click Resource.
2. From the navigation pane, select Server Automation > Server Resource.
3. Click the Server Resource tab.
The Server Resource page displays the server resource list.
4. Click the link for a server. The detailed information page displays detailed information about the server and provides management actions.
5. View detailed information about the server or manage the server.
The detailed information page includes the following information:
· Basic information—Includes the IP address, hardware model, UUID, serial number, system health, power status, and UID LED status of the server.
· Hardware information—Includes information about fans, temperature, power, processors, memory, NICs, storage, and firmware of the server.
· Performance monitor information—Includes monitored power, fan speed, and temperature of the server. You can add monitor indexes in Performance.
· Management actions—Includes actions for managing the server, such as viewing topology, Web manager access, graceful poweroff, graceful restart, and turning on the UID LED.
View blade enclosures
Perform this task to centrally manage servers. You can view the server status, hardware status, and performance data, and perform basic server management functions.
To view blade enclosures:
1. On the top navigation bar, click Resource.
2. From the navigation pane, select Server Automation > Blade Enclosures..
3. To view detailed information about a blade enclosure, click the link for the blade enclosure.
Server events
This module allows you to view integrated management and system event logs. You can also define a rule to upgrade specific integrated management or system event logs to alarms so that the system can inform administrators of the events in time.
Viewing integrated management logs
Perform this task to view events that have occurred on servers, for example, events generated by the system ROM or by services such as the iLO health driver.
To view integrated management logs:
1. On the top navigation bar, click Resource.
2. From the navigation pane, select Server Automation > Server Events.
3. Click the Integrated Management Log tab.
View system events
Perform this task to view system events that have occurred on servers, such as power on/off, system startup/shutdown, and firmware operations.
To view system events:
1. On the top navigation bar, click Resource.
2. From the navigation pane, select Server Automation > Server Events.
3. Click the System Event tab.
U-Center obtains server system events through IPMI. The server restart events can be obtained only when servers run a Windows OS.
A system event includes the following parameters:
· Server Name—Name of the server.
· Event Type—Options are System, OemTimestamped, and OemNonTimestamped.
· Initial Update—Time when the event was created.
· Sensor Type—Sensor that created the event. A sensor is a logical module or physical entity used to monitor server indexes.
· Event Dir—Information about the event.
· Description—Description of the event.
Create a log escalation rule
Perform this task to configure a rule to upgrade integrated management or system event logs to alarms.
To create a log escalation rule:
1. On the top navigation bar, click Resource.
2. From the navigation pane, select Server Automation > Server Events.
3. Click the Log Escalation Rule tab.
The Log Escalation Rule page displays the list of log escalation rules.
4. Click Add.
The window opens for adding a log escalation rule.
5. Configure the parameters for the rule as needed.
6. Click OK.
Application Manager
As a resource management module of U-Center, application management monitors applications in a network. During the monitoring process, application management collects monitor index data and then generates application monitor reports. You can use the monitor reports to locate application performance bottlenecks and ensure available, reliable, and continuous services. The collected monitor data can also be used for further analysis of relevant services.
Application management provides a simple, highly efficient management tool for the increasingly complex IT infrastructures and service environments. It simplifies the way administrators obtain the running status of various IT applications, including health status of applications and the services affected by unhealthy applications. Application management implements comprehensive management of operation, planning, and analysis for IT infrastructures.
Table 3 lists applications that can be monitored.
Table 3 Available applications
|
Category |
Application type |
|
Windows Server |
Windows and Windows Performance Counter |
|
Unix Server |
AIX, FreeBSD, OpenBSD, HP-UX, SCO UNIX, Solaris, Mac OS, and AS400 |
|
Linux server |
Linux, Kylin, Rocky, and Suse |
|
Database server |
SQL Server, MySQL, Oracle, Cache 2010, Cache, DB2 v11, DB2, Database Query, DM, SAP HANA, HBase, Informix, Kingbase, MemCached, MongoDB, Oracle ASM, PostgreSQL, Redis, Sybase, and Xugu |
|
Application server |
.NET, JBoss, Tomcat, Lync 2010, Lync 2013, GlassFish, HMC, Jetty, Domino Server Authentication, Lotus Domino, Oracle AS, Resin, Tongweb, Wildfly, WebLogic, and WebShpere |
|
Web server |
Apache, IIS, Nginx, and PHP |
|
Mail server |
Exchange 2003, Exchange 2007, Exchange 2010, Exchange 2013, POP3, and SMTP |
|
Middleware |
Office Share Point 2007, Office Share Point 2010, Office Share Point 2013, Active MQ, Hadoop, Oracle GoldenGate, RabbitMQ, Storm, TongLINK/Q, Tuxedo, and WebSphere MQ |
|
WEB service |
REST and SOAP |
|
HTTP service |
URL and URL sequence |
|
LDAP service |
Active Directory and LDAP |
|
File system |
File and directory |
|
Common Services |
SNMP, FTP, SFTP, Ceph, Dell CMC, Common Application, DNS, IPMI, JavaRuntime, Linux Custom, Ping Command, Ping Test, TCP Port |
|
SAP |
SAP |
|
Virtual machine |
CAS, Citrix XenServer, HW FusionCompute, HW FusionManager, Hyper-V, Kubernetes, Kubernetes, Kubernetes Master, KVM, ManageOne OC, PowerCenter, VMware vCenter Server, CAS, VMware ESX |
|
Storage |
Inspur AS5600, Common Storage Device, EMC CLARiiON, EMC VMX 100K, EMC ISILON, DELL EqualLogic, HPE 3PAR, HPE MSA P2000, HUS110, Huawei Common Storage Device,, HW OceanStor 18500 V3, HW OceanStor 9000, HW OceanStor S3900, IBM DS8800, IBM DS family, IBM F900, IBM SVC, IBM Storwize V5000, IBM Storwize V7000, Quantum Scalar i500, NetApp, H3C ONEStor, H3C P5730, DELL SC 8000, EMC VPLEX, VMWare VSAN, VSP G200, Hitachi VSP |
Applications monitored by application manager include operating systems, databases, application servers, services, and middleware. These applications provide key services for enterprises and organizations.
After an operator adds applications to application management, application management collects monitor data and evaluates the availability and health status of the applications.
Application monitor includes common monitor and specific monitor based on the application scope. Application management can monitor most mainstream network applications by using common monitor and specific monitor.
Custom View
Application manager allows operators to combine concerned indexes of different applications into one custom page for analysis of the whole service performance and health status.
View the custom view list
1. On the top navigation bar, click Resource.
2. From the navigation pane, select Application Manager > Custom View.
The Custom View List page displays all custom views.
Custom view list contents
¡ Name—Name of the custom view.
¡ Description—Details of the custom view.
¡ Monitor Report—Click the Monitor Report
icon ![]() to view the custom report.
to view the custom report.
¡ Modify—Click the Modify icon ![]() to modify the custom view.
to modify the custom view.
¡ Delete—Click the Delete icon ![]() to delete the custom
view.
to delete the custom
view.
Add a custom view
1. On the top navigation bar, click Resource.
2. From the navigation pane, select Application Manager > Custom View.
The Custom View List page displays all custom views.
3. Click Add.
The Add Custom View page opens.
4. Enter the name and description of the custom view. Description is helpful for managing and maintaining the custom view.
5. Click Add in the application index list.
a. Click the Unfold
icon ![]() or Fold icon
or Fold icon ![]() to expand or collapse an application type/application monitor index. One application type can contain one or more applications under the selected type.
to expand or collapse an application type/application monitor index. One application type can contain one or more applications under the selected type.
b. Select the application indexes for the custom view.
c. Click OK.
6. Click the Move Up
icon ![]() or Move Down icon
or Move Down icon ![]() to
change the arrangement of the monitor indexes that display in the custom
report.
to
change the arrangement of the monitor indexes that display in the custom
report.
7. Click OK.
Application monitor
View the application list
1. On the top navigation bar, click Resource.
2. From the navigation pane, select Application Manager > Application Monitor.
The application list page displays all application monitors. Information on the list was obtained when application manager last polled the monitored applications.
Application list contents
¡ Name—Name of the application monitor. Click the name to view the monitoring report for the monitored application.
¡ Application Type—Type of the monitored application. Click the link for the application type to filter out other types of monitored applications.
¡ Host—IP address of the host on which the monitored application resides. This field is not displayed by default.
¡ Agent Collection—Use the agent to collect application index data. This field is not displayed by default.
¡ Speed (bps)—Total receiving and sending rate of the application, in bps. Point to the icon to view the historical records of Rx (bps) and Tx (bps). This field is displayed only when probes are configured for application manager.
¡ Rx (bps)—Receiving rate of the application, in bps. This field is not displayed by default.
¡ Tx (bps)—Sending rate of the application, in bps. This field is not displayed by default.
¡ Traffic (H)—Total traffic received and sent by the application in the last hour. This field is not displayed by default.
¡ In Traffic (H)—Traffic received by the application in the last hour. This field is not displayed by default.
¡ Out Traffic (H)—Traffic sent by the application in the last hour. This field is not displayed by default.
¡ Traffic (D)—Total traffic received and sent by the application today. This field is not displayed by default.
¡ In Traffic (D)—Traffic received by the application today. This field is not displayed by default.
¡ Out Traffic (D)—Traffic sent by the application today. This field is not displayed by default.
¡ Description—Description about the application monitor.
¡ Availability—Availability of the
application. The availability can be ![]() (Available),
(Available), ![]() (Unavailable),
(Unavailable),
![]() (Inaccessible),
or
(Inaccessible),
or ![]() (Unmanaged).
Point to the icon to view the
application availability represented by different colors for the last hour.
(Unmanaged).
Point to the icon to view the
application availability represented by different colors for the last hour.
¡ Health—Health status of the
application. The health status can be ![]() (Healthy),
(Healthy), ![]() (Minor),
(Minor), ![]() (Major),
(Major), ![]() (Critical), or
(Critical), or ![]() (Unknown). Point to the icon to view the application
health status represented by different colors in the last hour.
(Unknown). Point to the icon to view the application
health status represented by different colors in the last hour.
¡ Dependency Topology—Click the Dependency Topology icon ![]() to view dependencies
between the application and other applications in a topology view. This field
is not displayed by default.
to view dependencies
between the application and other applications in a topology view. This field
is not displayed by default.
¡ Status—Management status of the application, which can be Managed or Unmanaged.
¡ Related Business—Click the Association icon
![]() to view the service monitors that monitor the application that has been added to the
BSM component.
to view the service monitors that monitor the application that has been added to the
BSM component.
¡ Associate—Click the Association icon
![]() to view
applications associated with the application monitor. This field is displayed
only when the application is a Windows operating system that is monitored
through WMI.
to view
applications associated with the application monitor. This field is displayed
only when the application is a Windows operating system that is monitored
through WMI.
¡ Analyze—Click
the Analyze icon ![]() to view the causes for the unhealthy status of an application.
to view the causes for the unhealthy status of an application.
¡ Contact—Contact information of the application administrator. This field is not displayed by default.
¡ Restart Server—Click the Restart Server icon ![]() to restart the server where the monitored application resides.
to restart the server where the monitored application resides.
¡ Alarm—If the application has unrecovered alarms, this field displays the alarm icon that represents the highest severity level of the alarms. Click the alarm icon to view the alarm list for the application.
Add an application monitor
Application management detects most applications through auto-discovery, except file and directory applications and those using different listening ports than most applications of the same type. To monitor undetected applications, you can manually add application monitors for them.
To add an application monitor manually:
1. On the top navigation bar, click Resource.
2. From the navigation pane, select Application manager > Application monitor.
The application list page displays all application monitors.
3. Click Add, and then select the type of the application you want to monitor.
4. Set the parameters of the application monitor, which vary with application types.
5. Click OK.
Host monitor
Host monitoring focuses on the availability and the health status of applications on each host. You can view a host monitor in either Host mode or in List mode.
View host monitors in host mode
1. On the top navigation bar, click Resource.
2. From the navigation pane, select Application manager > Host Monitor.
The Host Monitor page displays all host monitors in the default Host mode. The Host mode organizes application monitors based on hosts. The background color of each monitored application stands for the health status of that application. The availability icon of each application monitor name stands for the availability status of that application.
3. For a host managed by U-Center, click the device label of the host to view its details.
4. Click an application monitor name to view the monitor report for that application.
View host monitors in list mode
1. On the top navigation bar, click Resource.
2. From the navigation pane, select Application manager > Host Monitor.
The Host Monitor page displays all host monitors in the default Host mode.
3. Click the List tab.
The Host Monitor List page opens.
Host monitor list contents
¡ Host—Device label of the host. For a host managed by U-Center, click the device label to view its details.
¡ OS—Operation system running on the host.
¡ CPU(%)—CPU usage of the operating system. Click the History Record icon ![]() to view the history CPU usage trend graph. Options are Last 1 Hour icon
to view the history CPU usage trend graph. Options are Last 1 Hour icon ![]() ,
Last 6 Hours icon
,
Last 6 Hours icon ![]() ,
Today icon
,
Today icon ![]() , Yesterday icon
, Yesterday icon ![]() , This Week icon
, This Week icon ![]() , This Month icon
, This Month icon ![]() ,
and This Year icon
,
and This Year icon ![]() .
.
¡ Memory(%)—Memory usage of the operating system. Click the History Record icon ![]() to view the history memory usage trend graph. Options are Last 1 Hour icon
to view the history memory usage trend graph. Options are Last 1 Hour icon ![]() , Last 6 Hours icon
, Last 6 Hours icon ![]() , Today icon
, Today icon ![]() , Yesterday icon
, Yesterday icon ![]() , This Week icon
, This Week icon ![]() , This Month icon
, This Month icon ![]() ,
and This Year icon
,
and This Year icon ![]() .
.
¡ System Running Time—Duration from the operating system startup time to the most recent polling time.
¡ Status—Availability status of the operating system. Point to the icon to view the availability represented by different colors for the last hour.
¡ Health—Health status of the operating system. Point to the icon to view the health status represented by different colors in the last hour.
¡ Host Topology—Click the Host Topology icon to view the host and related monitored applications in a topology view.
¡ Analyze—Click the Analyze icon to view the root cause analysis for the application.
¡ Application—Monitored applications on the host, except the operating system. Click an application icon to view the monitor report for the application.
Class monitor
Class monitoring focuses on the health status of applications. Application categories are defined in U-Center. Every application category can have multiple applications and the health status of an application depends on the worst health status.
To view application monitors by category:
1. On the top navigation bar, click Resource.
2. From the navigation pane, select Application manager >Class Monitor.
The Class Monitor page displays all application monitors based on their categories and types. The leftmost column displays the monitor categories and other columns are application types sorted by category. The background colors stand for the health status of the application types. The overall health status depends on the worst health status.
3. Click an application category name to view the list of all application types in that category.
The numbers next to the application category name represents the number of applications in healthy state out of the total number of applications for that category.
4. Click an application type name to view the list of all applications for that type.
The numbers next to the application category name represents the number of applications in healthy state out of the total number of applications for that type.
5. Point to an application type name to view the details of the health status. For example, Healthy: 1, Critical: 0, Major: 0, Minor: 0, --: 0.
Application group
U-Center allows you to manage monitored applications in groups. By default, all monitored applications belong to the system default group named ungrouped that can be managed by all operators. Once a monitored application is assigned to an application group, the application can be managed only by the operators who are granted privileges to manage that application group.
You can add a maximum of five hierarchical subgroups under a parent group and no inheritance relationship exists between them. You can view, add, modify, and delete application groups.
View the application group list
You can view all application groups in the Application Group List.
The predefined application group ungrouped cannot be modified or deleted. It does not allow you to add subgroups. A newly added application automatically joins the application group ungrouped. All operators have the privilege to view monitor reports for applications in this group.
To view the application group list:
1. On the top navigation bar, click Resource.
2. From the navigation pane, select Application manager > Application Group.
The application group list page displays all application groups.
Application group list contents
¡ Name—Name of the application group. Click the name to view all monitored applications in the group.
¡ Status—Availability status of the application group. It is determined by the application with the worst availability in the group or its subgroup. The field value is Available when the application group does not include any applications.
¡ Health Status—Health status of the application group. It is determined by the application with the worst health status in the group or its subgroup. The field value is Healthy when the application group does not include any applications.
¡ Application Group Topology—Click the Application Group Topology icon ![]() to view the logical
group topology.
to view the logical
group topology.
¡ Physical Topology—Click the Physical Topology icon ![]() to view the physical
group topology.
to view the physical
group topology.
¡ Analyze—Click the Analyze icon ![]() to analyze the root cause for the alarms generated by applications
in the group or subgroups.
to analyze the root cause for the alarms generated by applications
in the group or subgroups.
¡ Details—Click the Details icon ![]() to view
detailed information about the application group.
to view
detailed information about the application group.
¡ Modify—Click
the Modify icon ![]() to modify the application group.
to modify the application group.
¡ Delete—Click
the Delete icon ![]() to delete the
application group.
to delete the
application group.
Add an application group
1. On the top navigation bar, click Resource.
2. From the navigation pane, select Application manager > Application Group.
3. Click Add.
4. Specify a unique application group name.
5. Enter a description in the Description field.
6. Select groups of operators who are permitted to manage the application group and its member applications:
a. Click Add. The Select Operator Group window opens.
b. Select one or more operator groups as needed.
c. Click OK.
All selected operator groups are displayed in the Operator Group box.
7. Add applications to the application group:
a. Click Add. The Select Application window opens.
b. Select one or more applications as needed.
c. Click OK.
All selected applications are displayed in the Application box.
8. Select a parent group for the application group from the Parent Group list. If no parent relationship exists, leave this field empty.
9. To send alarm notifications for monitored applications:
a. Select Enable from the Alarm Notification list.
b. On the Mail Setting tab, enter an IP address in the Destination Mail Address field, and then click Add.
The mail address format is username@server domain name. For the formats of the username and server domain name, see the requirements of the relevant mail server.
c. On the SMS Setting tab, enter a phone number in the Mobile Phone Number field, and then click Add.
The mobile phone number can contain only digits, parenthesis ( ), plus sign (+), minus sign (-), and space, for example, +86-13812341234, (86)-13812341234, and 86-13812341234. Include country/region code in the phone number if necessary.
d. Select alarm levels in the Concerned Alarm Levels field.
e. Select All Alarms or Selected Alarms from the Concerned Alarms list.
If Selected Alarms is selected, click Select, select alarm types to be included, and then click OK.
f. Set the time range for alarm notifications in the Time Ranges field. The time range is in hh:mm-hh:mm format.
10. To distribute alarms to IT Service Management for monitored applications:
a. Select Enable from the Alarm Distribute list.
b. Specify the alarm process in the Process field. Alarm Process is displayed by default.
c. Select an account from the Processor list as the processor to distribute alarms.
d. Enter a suggestion in the Suggestion field.
e. Select alarm levels in the Concerned Alarm Levels field.
f. Select All Alarms or Selected Alarms from the Concerned Alarms list.
If Selected Alarms is selected, click Select, select alarm types to be included, and then click OK.
g. Set the time range for alarm notifications in the Time Ranges field. The time range is set in hh:mm-hh:mm format.
11. Click OK.
Delete an application group
Deleting an application group also deletes the subgroups associated with it. When an application group is deleted, applications in the deleted group are moved to ungrouped if they do not belong to any other application groups.
To delete an application group:
1. On the top navigation bar, click Resource.
2. From the navigation pane, select Application manager > Application Group.
The application group list page displays all application groups.
3. Click the Delete
icon ![]() for the
application group you want to delete.
for the
application group you want to delete.
4. Click OK.
Import Application
U-Center supports batch importing applications of the same type for further monitoring. The following applications do not support batch import:
· Windows Performance Counter of Linux
· URL Sequence
· Lync 2010 Server
· Lync 2013 Server
· Exchange 2003
· Exchange 2007
· Exchange 2010
· Exchange 2013
To batch import applications:
1. On the top navigation bar, click Resource.
2. From the navigation pane, select Application manager > Import Application.
3. Click Select for Application Type.
4. Select an application and click OK.
The Application Category and Application Type fields are automatically populated with the selected application information.
5. Click Export to save the template of the selected application type.
6. Open the saved template file, and configure the application information to be imported. Each line represents an application monitor. Table 4 contains information about the configuration items in an import template.
|
Configuration item |
Remarks |
|
Use Template |
Not available in the import template. Disabled by default. |
|
Related Applications |
Not available in the import template. Configurable on the application monitor page after the application is successfully imported. |
|
Application Group |
|
|
Detect Application |
Not available in the import template. Enabled by default. |
|
Monitor type template |
Only supports manual configuration of monitor types in the template. |
|
Monitor types of SNMP, Telnet, and SSH |
To set the monitor type of SNMP, Telnet, or SSH in the import template: 1. Configure the access parameters in the SNMP, Telnet, or SSH sheet. 2. Copy the SNMP_ID, Telnet_ID, or SSH_ID to the corresponding column of the appConfig sheet. |
|
Monitoring type of SSH |
The public key authentication mode is not supported in the import template. Configurable on the application monitor page after the application is successfully imported. |
|
Use IPMI |
Not available in the import template. Disabled by default. |
|
Windows application |
When the monitor type is set to VMI, the import template does not support enabling event logging. Configurable on the application monitor page after the application is successfully imported. |
|
FTP service application |
Set to No for the Whether to Download File and Whether to Upload File options by default. Configurable on the application monitor page after the application is successfully imported. |
|
SFTP service application |
Set to No for the Whether to Download File and Whether to Upload File options by default. Configurable on the application monitor page after the application is successfully imported. |
|
Windows performance counter applications |
APM does not support batch importing Windows performance counter applications when it is deployed on Linux. |
7. On the import application page, click Browser to select the template file you edited.
8. Click Upload. The applications to be imported are displayed in a list.
9. Click Import All.
If you click Stop All during the batch import progress, the application being imported will not be interrupted. To view the import status for the application, refresh the page.
When the batch import is complete, each imported application corresponds to an application monitor in application management.
Agent management
An agent collects application index data from a target host in local monitor mode. Using an agent to collect data can secure the OS privileges and obtain data that cannot be obtained in remote monitor mode.
Install an agent
Make sure the agent has the same version as application management. You can install and upgrade an agent locally and remotely.
Install an agent locally
To install an agent locally, operators must download the installation package (for Windows or Linux) to the local directory by using agent management.
To install an agent locally:
1. On the top navigation bar, click Resource.
2. From the navigation pane, select Application manager > Agent Management.
3. Click Download.
4. Select Agent Package (Windows) or Agent Package (Linux) as needed.
The installation package is saved to the local directory.
5. Copy the installation package to the destination host by using FTP, file sharing, or SCP, and decompress it.
6. Double-click the install.bat script and enter the IP address of the U-Center as prompted.
If U-Center is deployed in distributed mode, enter the IP address of the master server.
7. Click OK.
Install an agent remotely
This function uses WMI (Windows) or SSH (Linux) on the destination host. To install an agent remotely, you must obtain the IP address of the destination host and administrator username and password.
To install an agent remotely:
1. On the top navigation bar, click Resource.
2. From the navigation pane, select Application manager > Agent Management.
3. Click Install.
4. Configure the following parameters:
¡ Destination Host IP—Enter the IP address of the destination host, and then click Add. The IP address is added to the Host List area.
¡ Host Discover—Displays the hosts on which the agent is remotely installed. To remove an IP address from the Host List area, select the IP address, and then click Delete.
¡ Host Type—Select a host type, Windows or Linux. If you click Select Template, this field is automatically populated.
¡ Installation Path—Enter the absolute agent installation path. In this example, enter D:\agent for Windows and /home/agent for Linux. If you click Select Template, this field is automatically populated.
¡ Username/Password—Enter the username and the password used for connecting to the destination host. If you click Select Template, this field is automatically populated.
- For Windows, the username must have the administrator rights.
- For Linux, the username must have the root rights and the rights to execute the installation file.
¡ Description—Enter a description of the installation task.
5. Click Install.
View the agent list
1. On the top navigation bar, click Resource.
2. From the navigation pane, select Application manager > Agent Management.
The agent list is displayed.
Agent list contents
¡ Destination Host IP—IP address of the host where the agent is deployed. Click the IP address to view agent details.
¡ Host—IP address of the host where the agent is deployed.
¡ Version—Version of the agent.
¡ Installation Time—Time when the agent was installed.
¡ Upgrade Time—Time when the agent was most recently upgraded.
¡ Description—Descriptive information about the agent.
¡ Status—Current state of the agent.
- Existing Agent
- Unlimited
- Unknown
- Network Unreachable
- To be copied
- Copying
- Copy Success
- Copy Failure
- Start Installation
- Installation Failure
- Installation Success
- Started
- Starting
- Stopped
- Stopping
- Upgrading
- Connection Failure
- Available
- Unavailable
- Incorrect
- Upgrade Success
- Upgrade Failure
- File Transfer Success
- File Transfer Failure
- Connection Timeout
- Auth Failed
¡ Operation—Operations that can be performed on the agent.
¡ Auto Discovery—The agent automatically detects all applications running on the destination host after installation completion. Click Result to view the auto discovery result.
¡ Managed Application—Applications monitored by the agent on the destination host.
¡ Delete—Click the Delete icon ![]() to
delete agents in incorrect status due to authentication error or connection
failure.
to
delete agents in incorrect status due to authentication error or connection
failure.
Start an agent
1. On the top navigation bar, click Resource.
2. From the navigation pane, select Application manager > Agent Management.
The agent list is displayed.
3. Click the Start icon ![]() for an
agent.
for an
agent.
The agent status becomes Starting. The Start icon is displayed only for agents in Stopped state.
4. Click Refresh.
Stop an agent
1. On the top navigation bar, click Resource.
2. From the navigation pane, select Application manager > Agent Management.
The agent list is displayed.
3. Click the Stop icon ![]() for an
agent.
for an
agent.
The agent status becomes Stopping. The Stop icon is displayed only for agents in Started state.
4. Click Refresh.
View the auto discovery result
1. On the top navigation bar, click Resource.
2. From the navigation pane, select Application manager > Agent Management.
The agent list is displayed.
3. Click Result in the Auto Discovery column for an agent.
The Auto Discovery Result page opens.
¡ Device—IP address of the host where the agent is deployed.
¡ Application Type—Type of the application.
¡ Application Monitor Port—Port used to monitor the application.
¡ Add to Monitor—Click Add to Monitor for an unmonitored application to add monitor for the application. Click Add the same type of application for a monitored application to add monitor for the same type of applications.
Add an application monitor
You can click Add to Monitor or Add the same type of application on the Auto Discovery Result page to add an application monitor.
1. On the top navigation bar, click Resource.
2. From the navigation pane, select Application manager > Agent Management.
The agent list is displayed.
3. Click Result in the Auto Discovery column for an agent.
The auto discovery result page opens.
4. Click Add to Monitor or Add the same type of application.
5. On the page that opens, configure the application monitor parameters.
The Enable Agent Collection parameter is displayed only for application that can be monitored by an agent.
6. Click OK.
Configurations
Application management provides the following additional configuration management functions:
· Threshold configuration—Sets threshold alarm conditions for the monitoring application indexes. If the collected indexes meet the threshold alarm conditions, application management sends a corresponding alarm through the alarm function of the U-Center. If the alarm notification and forwarding configuration is set correctly, operators can receive alarm information sent by application management through emails or SMS messages.
· Baseline Configuration—Enables or disables the baseline function for application indexes. When you enable the baseline function for an application index, application management performs the following operations:
¡ Collects the index data.
¡ Generates initial baseline data after 7 days.
¡ Generates stable baseline data after 5 weeks.
Application management determines the index state according to the baseline data. Alarms are generated when the baseline data is in an abnormal state. If the alarm notification and forwarding configuration is set correctly, operators can receive alarm information sent by application management through emails or SMS messages.
· Port configuration—Sets default application monitor and traffic collection ports for applications. Through ports, APM can identify different applications in Auto Discovery and traffic collection.
· Probe configuration—Manages a list of probes. A probe is a server where the probe application is installed. Operators can collect the network traffic of applications by mirroring network traffic to the probe.
· Parameter configuration—Sets application management system parameters, including the monitor data retention periods and data background colors.
· Template Configuration—Provides application templates for application monitors and agent templates for remotely installed agents. Using templates simplifies the configuration and reduces the chances of making mistakes.
· Pollinterval Configuration—Sets the polling intervals for different collection units. You can set different polling intervals for the collection units of different applications in the U-Center system.
Threshold configuration
View the global threshold list
1. On the top navigation bar, click Resource.
2. From the navigation pane, select Application manager > Configurations.
The Configurations page opens.
3. Click Threshold Configuration.
The global threshold list displays all monitor indexes enabled with the threshold alarm function and the global threshold of each index.
4. Click an application category to view monitor indexes for this application category.
The Application Type field also refreshes.
To view threshold configurations for all application categories, click Unlimited next to Application Category.
5. Click an application type to view monitor indexes for this application type.
To view threshold configurations for all application types of an application category, click the application category, and then click Unlimited next to Application Type.
Global Threshold list contents
¡ Application Type—Type of the application.
¡ Application Unit—Name of the application unit to which the monitor index belongs. Each application unit corresponds to an independent area in the application monitor report.
¡ Index—Name of the application monitor index enabled with the threshold alarm function.
¡ Threshold Condition—Threshold condition, which can be Greater than or equal to (≥), Less than or equal to (≤), Include, or Exclude.
¡ Enable Level-1 Threshold—Displays whether the Level-1 threshold for the monitor index has been set.
¡ Level-1 Threshold—Level-1 threshold value of the monitor index.
¡ Trigger Times—Number of times that the monitor index meets the Level-1 threshold to trigger an alarm.
¡ Enable Level-2 Threshold—Displays whether the Level-2 threshold for the monitor index has been set.
¡ Level-2 Threshold—Level-2 threshold value of the monitor index.
¡ Trigger Times—Number of times that the monitor index meets the Level-2 threshold to trigger an alarm.
¡ Modify—Click the Modify icon ![]() to modify the
predefined or user-defined global threshold values.
to modify the
predefined or user-defined global threshold values.
¡ Delete—Click the Delete icon ![]() to delete the
predefined or user-defined global threshold values.
to delete the
predefined or user-defined global threshold values.
Add threshold configuration
With this function, operators can manually enable the threshold alarm function and set thresholds for monitor indexes. In addition, operators can configure monitor indexes to use global thresholds or custom thresholds in the application monitor report or custom view report.
To add threshold configuration for a monitor index:
1. On the top navigation bar, click Resource.
2. From the navigation pane, select Application manager > Configurations.
The Configurations page opens.
3. Click Threshold Configuration.
The global threshold list is displayed.
4. Click Add.
The Add Threshold page opens.
5. Configure the following parameters for the monitor index:
¡ Application Type—Click Select, select an application type from the popup window, and then click OK. The selected application type name automatically populates the Application Type field.
¡ Application Unit/Index/Threshold Type—Click Select, select an application monitor index from the popup window (options vary with application type), and then click OK. The name, type, and application unit of the selected monitor index automatically populate the Index, Threshold Type, and Application Unit fields.
¡ Threshold Condition—Select a threshold condition from the list (options vary with the monitor index type). For the Value type, options are Greater than or equal to and Less than or equal to. For the String type, options are Include and Exclude.
¡ Unit—Select a unit type of the monitor index from the list. The value depends on the monitor index type. Some indexes do not contain a unit type, such as the physical thread count of a .NET server.
6. Configure the Level-1 threshold parameters for the monitor index.
Application management generates a major alarm when the monitor index meets the Level-1 threshold. If you enable the Level-2 threshold, APM generates a major alarm when the monitor index meets the Level-1 threshold but does not meet the Level-2 threshold.
¡ Enable Level-1 Threshold—Select whether to enable the Level-1 threshold setting for the monitor index.
¡ Threshold—If you enable the Level-1 threshold, set a Level-1 threshold value in the Threshold field.
¡ Trigger Times—If you enable the Level-1 threshold, set an alarm trigger frequency in the Trigger Times field. When the monitor index meets the Level-1 threshold once, the field value increases by one. Application management generates a Level-1 threshold alarm if the monitor index meets the Level-1 threshold for the number of times specified by Trigger Times.
7. Configure the Level-2 threshold parameters for the monitor index.
Application management generates a critical alarm when the monitor index meets the Level-2 threshold.
¡ Enable Level-2 Threshold—Configure the Level-2 threshold setting for the monitor index. If you enable the Level-2 threshold, set a Level-2 threshold value in the Threshold field. Application management activates a critical alarm when the monitor index meets the threshold.
¡ Threshold—If you enable the Level-2 threshold, set a Level-2 threshold value in the Threshold field.
¡ Trigger Times—If you enable the Level-2 threshold, set an alarm trigger frequency in the Trigger Times field. When the monitor index meets the Level-2 threshold once, the field value increases by one. Application management generates a Level-2 threshold alarm if the monitor index meets the Level-2 threshold for the number of times specified by Trigger Times.
8. Click OK.
Baseline configuration
The baseline function of an application index can only be enabled or disabled globally. When you enable the baseline function for an application index, specify a baseline alarm level for the index.
To view the baseline configuration list:
1. On the top navigation bar, click Resource.
2. From the navigation pane, select Application manager > Configurations.
The Configurations page opens.
3. Click Baseline Configuration.
The baseline configuration list displays all application monitor indexes that can be enabled with the baseline function.
4. Click an application category to view monitor indexes for this application category.
The Application Type field also refreshes.
To view baseline configurations for all application categories, click Unlimited next to Application Category.
5. Click an application type to view the monitor indexes for this application type.
To view baseline configurations for all application types of an application category, click the application category, and then click Unlimited next to Application Type.
Baseline configuration list contents
¡ Application Type—Type of the application.
¡ Application Unit—Name of the application unit to which the baseline configuration belongs. Each application unit corresponds to an independent area in the application monitor report.
¡ Index—Name of the application monitor index that is enabled with the baseline function.
¡ Enabled—Displays whether the baseline function for the monitor index has been enabled.
¡ Shield Times—Interval for generating baseline alarms for the monitor index.
¡ Alarm Level—Level of the baseline alarm. Options are Critical, Major, and Minor.
¡ Modify—Click the Modify icon ![]() to modify the baseline configuration of the monitor index.
to modify the baseline configuration of the monitor index.
Port configuration
An application can listen to data and provide services through multiple ports. With these ports, application management finds applications running on the host and reads monitor indexes to calculate traffic statistics.
Port configuration allows operators to modify the settings of default application monitor port and traffic collection port for applications.
· Application Monitor Port—The Auto Discovery function scans the applications installed or deployed on a host through this type of ports.
· Traffic Collection Port—Applications use this type of port to provide services. Through these ports, application management can identify traffic of different application types running on the same IP address.
To view the application default port list:
1. On the top navigation bar, click Resource.
2. From the navigation pane, select Application manager > Configurations.
The Configurations page opens.
3. Click Port Configuration.
The port configuration list is displayed.
Port configuration list contents
¡ Application Type—Name of the application type.
¡ Application Monitor Port—Default port value that identifies the type of applications in Auto Discovery.
¡ Traffic Collection Port—Default port value for data traffic collection.
¡ Modify—Click the Modify icon ![]() to modify default port settings for the application type.
to modify default port settings for the application type.
Probe configuration
To collect traffic of applications, you must configure probes for APM to use. When no probes are configured or all probes are deleted, application management stops collecting application traffic and all application monitor reports no longer contain the application traffic area.
For operating system applications, probes identify their traffic by IP address. For other applications, probes identify their traffic by the combination of IP address and traffic collection port.
View the probe list
1. On the top navigation bar, click Resource.
2. From the navigation pane, select Application manager > Configurations.
The Configurations page opens.
3. Click Probe Configuration.
The probe list is displayed.
Probe list contents
¡ Name—Name of the probe. Click the name to view its details.
¡ IP Address—IP address of the probe.
¡ Description—Description of the probe.
¡ Modify—Click the Modify icon ![]() to modify the probe
settings.
to modify the probe
settings.
¡ Delete—Click the Delete icon ![]() to delete the probe.
to delete the probe.
Add a probe
1. On the top navigation bar, click Resource Management.
2. From the navigation pane, select Application manager > Configurations.
The Configurations page opens.
3. Click Probe Configuration.
The probe list is displayed.
4. Click Add.
5. Configure the following parameters:
¡ Name—Enter the name of the probe. The name must be unique in application management.
¡ IP Address—Enter the IP address or host name of the probe. The IP address must be an IPv4 address.
¡ Description—Enter the description of the probe.
¡ Password—Enter the password of the probe. The value must be the same as that configured on the probe.
6. Click OK.
Deploy network configuration to probes
When you add an application monitor, application management automatically sends the network configuration (IP address or IP-to-port combination) of the monitored application to probes. If the network configuration failed to be delivered, troubleshoot the communication failure and manually deploy the network configuration to probes.
To deploy the network configuration of monitored applications to probes:
1. On the top navigation bar, click Resource.
2. From the navigation pane, select Application manager > Configurations.
The Configurations page opens.
3. Click Probe Configuration.
The probe list is displayed.
4. Click Deploy.
Application management deploys the network configuration of monitored applications to all probes on the list.
Parameter configuration
Application management operating parameters include the monitor data retention periods and data background colors.
To modify application management operating parameters:
1. On the top navigation bar, click Resource.
2. From the navigation pane, select Application manager > Configurations.
The Configurations page opens.
3. Click Parameter Configuration.
4. Configure the following parameters as needed:
¡ Original Data Retention Time (Day)—Enter how many days application management will keep the original data collected from applications.
¡ Hourly Data Retention Time (Month)—Enter how many months application management will keep the hourly application data that is aggregated from the original data.
¡ Daily Data Retention Time (Month)—Enter how many months application management will keep the daily application data that is aggregated from the original data.
¡ Threshold-1 Color—Enter the RGB value of the background color for the monitor index data that meets the threshold-1 condition. Alternatively, you can click the box to select a color from the popup color panel. The default setting is RGB FFD200, representing orange.
¡ Threshold-2 Color—Enter the RGB value of the background color for the monitor index data that meets the threshold-2 condition. Alternatively, you can click the box to select a color from the popup color panel. The default setting is RGB FF0000, representing red.
¡ Whether IDC Environment—Select Yes or No from the list. If you select Yes, you switch to the IDC cloud tenant environment, where the system displays functions according to your privileges, and you cannot switch back to non-IDC environment.
¡ Whether to display subordinate APM data—Select Yes or No from the list. If you select Yes, the U-Center system displays subordinate APM data.
5. Click OK.
Template configuration
Application management provides application and agent templates. When you add application monitors or install agents remotely, use correct templates for them to simplify the configuration.
View the template configuration list
1. On the top navigation bar, click Resource.
2. From the navigation pane, select Application manager > Configurations.
The Configurations page opens.
3. Click Template Configuration.
The Template Configuration page opens.
Template configuration list contents
¡ Template Name—Name of the template.
¡ Type—Type of the template. Options are Application Template (Application type), Agent Template(Windows), and Template(Linux).
¡ Description—Description of the template.
¡ Modify—Click
the Modify icon ![]() to modify the template configuration.
to modify the template configuration.
¡ Delete—Click the Delete icon ![]() to delete the template.
to delete the template.
Add an agent template
1. On the top navigation bar, click Resource Management.
2. From the navigation pane, select Application manager > Configurations.
The Configurations page opens.
3. Click Template Configuration.
The Template Configuration page opens.
4. Click Add Template.
The Select Template Type window opens.
5. Select Agent Template.
6. Click OK.
The Add Agent Template page opens.
7. Configure the following basic host information:
¡ Template Name—Enter a name for the template.
¡ Host Type—Select the host type that is compatible with the template. Options are Windows and Linux.
¡ Installation Path—Enter the absolute path used in the agent installation on the target host.
¡ Username—Enter the name of the user that has the administrator's privileges on the target host.
¡ Password—Enter the password for the user that has the administrator's privileges on the target host.
¡ Description—Enter a description for the template.
8. Click OK.
Add an application template
1. On the top navigation bar, click Resource Management.
2. From the navigation pane, select Application manager > Configurations.
The Configurations page opens.
3. Click Template Configuration.
The Template Configuration page opens.
4. Click Add Template.
The Select Template Type window opens.
5. Select Application Template.
6. Select an application type from the Application Type list.
7. Click OK.
The page for adding an application template for the selected application type opens.
8. Configure the application monitoring parameters.
Different application types require different monitoring parameters.
9. Click OK.
Pollinterval configuration
The function is divided into global and custom pollinterval configurations, which can be used to query, add and modify the global and custom pollinterval configuration information.
View the application pollinterval list
1. On the top navigation bar, click Resource Management.
2. From the navigation pane, select Application manager > Configurations.
3. Click Pollinterval Configuration to enter the Pollinterval Configuration page.
The area above the pollinterval list contains query criteria. The list displays collection units based on the query criterion you select.
4. Query collection units:
¡ To display all collection units, click Unlimited in the Application Category field of the query criteria area.
¡ To display collection units only for an application category, click the application category name link in the Application Category field.
¡ To display collection units only for an application type in an application category, click the application category name link in the Application Category field and then click the application type link in the Application Type field.
You can configure the following pollinterval configuration:
· Application Type—Select an application type.
· Collection Units—Select a collection unit.
· Enable—Select whether to enable the pollinterval configuration.
· Enable Collect—Select whether to collect data from the collection unit.
· Pollinterval—Intervals at which data is collected.
· Unit—Unit of the pollinterval, which can be Min, Hour, Day, or Second.
· Modify—Click the Modify icon ![]() for an entry in the pollinterval configuration
list to modify that entry.
for an entry in the pollinterval configuration
list to modify that entry.
· Delete—Click the Delete
icon ![]() for a user
customized entry in the pollinterval configuration list to delete that entry.
for a user
customized entry in the pollinterval configuration list to delete that entry.
Add a global pollinterval
This function helps you add a global pollinterval. APM predefines multiple types of global pollintervals by default. The administrator can add self-defined global pollintervals as needed. A global pollinterval takes effect immediately after it is added.
To add a global pollinterval:
1. On the top navigation bar, click Resource Management.
2. From the navigation pane, select Application manager > Configurations.
3. Click Pollinterval Configuration.
4. Click Add.
5. Configure pollinterval parameters.
6. Click OK.