- Table of Contents
- Related Documents
-
| Title | Size | Download |
|---|---|---|
| 04-Operation monitoring | 59.92 KB |
This help contains the following topics:
¡ Session establishment rate statistics
Introduction
The operation monitor on the dashboard provides device operating status information. You can click the Select widgets button to select the information to be displayed.
Device status
The Device Status tab displays the CPU usage, memory usage, and CF card usage. You can click the Details icon to display detailed information and set the alarm thresholds.
Alarm thresholds include CPU usage alarm thresholds and free-memory alarm thresholds. Set alarm thresholds as required.
CPU usage thresholds
The device samples CPU usage at 1-minute intervals and compares the samples with the CPU usage threshold and the CPU usage recovery threshold.
· If a sample is greater than the CPU usage threshold, the device determines the CPU usage is high and sends alarms.
· If the CPU usage drops to or below the CPU usage recovery threshold, the device determines the CPU usage has recovered.
The CPU usage threshold must be greater than the CPU usage recovery threshold.
Free-memory thresholds
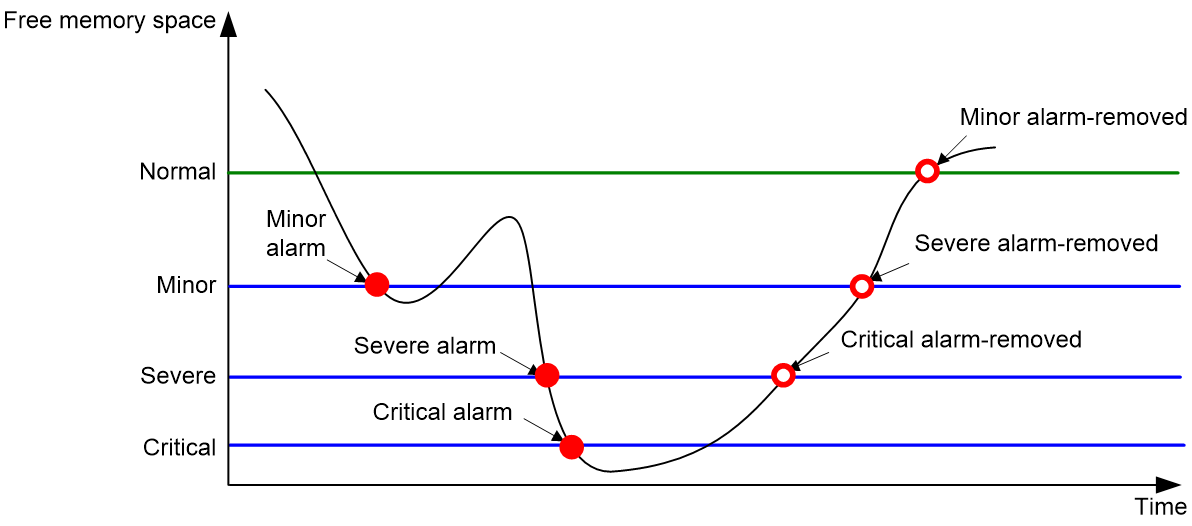
To ensure correct operation and improve memory efficiency, the system monitors the amount of free memory space in real time. If the amount of free memory space reaches the minor, severe, or critical alarm threshold, the system issues an alarm to affected service modules and processes.
As shown in Table 1 and Figure 1, the system supports the following free-memory thresholds:
· Normal state threshold.
· Minor alarm threshold.
· Severe alarm threshold.
· Critical alarm threshold.
Table 1 Memory alarm notifications and memory alarm-removed notifications
|
Notification |
Triggering condition |
Remarks |
|
Minor alarm notification |
The amount of free memory space decreases to or below the minor alarm threshold for the first time. |
After generating and sending a minor alarm notification, the system does not generate and send any additional minor alarm notifications until the first minor alarm is removed. |
|
Severe alarm notification |
The amount of free memory space decreases to or below the severe alarm threshold for the first time. |
After generating and sending a severe alarm notification, the system does not generate and send any additional severe alarm notifications until the first severe alarm is removed. |
|
Critical alarm notification |
The amount of free memory space decreases to or below the critical alarm threshold for the first time. |
After generating and sending a critical alarm notification, the system does not generate and send any additional critical alarm notifications until the first critical alarm is removed. |
|
Critical alarm-removed notification |
The amount of free memory space increases to or above the severe alarm threshold. |
N/A |
|
Severe alarm-removed notification |
The amount of free memory space increases to or above the minor alarm threshold. |
N/A |
|
Minor alarm-removed notification |
The amount of free memory space increases to or above the normal state threshold. |
N/A |
Figure 1 Memory alarm notifications and alarm-removed notifications
System logs
The System Logs tab displays the system log messages of and above the error level. You can click the Details icon to display detailed information about all levels of log messages and use the information for device status analysis and troubleshooting.
System traffic statistics
The System Traffic Statistics tab displays the inbound and outbound traffic statistics during a period of time in a line chart. You can use the chart to analyze traffic distribution over time on the network.
To display detailed traffic statistics on interfaces, click the Details icon.
To set traffic statistics parameters and filter the statistics result, click the Set icon.
Table 2 System traffic statistics configuration items
|
Item |
Description |
|
Auto refresh |
Select this option if you want the system to refresh the statistics regularly. |
|
Refresh interval |
Statistics refresh interval. |
|
Traffic unit |
Unit for traffic: · bps—Bits per second. · Bps—Bytes per second. |
|
Time range |
Time range of the traffic: · Past hour · Past day · Past 30 days |
|
Interfaces |
Filter the statistics result by interfaces. You can select All to collect statistics for all interfaces or select specific interfaces to collect statistics for the selected interfaces. |
|
Statistics type |
Statistics type: · Traffic volume—Collects statistics on the amount of traffic. · Traffic rate—Collects statistics on packet rates |
System session statistics
The System Sessions tab displays statistics on the number of sessions established during the past hour. You can click the Details icon to display statistics on the number of sessions established during the past hour, the past day, and past 30 days.
You can click the following buttons to enable top 10 ranking and view the ranking result:
· Enable top 10 ranking—Enables the device to collect statistics based on services and sort the statistics by source or destination address.
· View top 10 ranking—Displays the top 10 ranking result. You can select the time period (past hour, past day, or past 30 days) and the sort criterion (source or destination address).
Session establishment rate statistics
The Session Establishment Rate Statistics tab displays session establishment rate statistics during the past hour.
You can perform the following tasks on the tab:
· Click the Details icon to display session establishment rate statistics during the past hour, the past day, and past 30 days.
· Click the View top 10 ranking button to display top 10 ranking result. You can select the time period (past hour, past day, or past 30 days) and the sort criterion (source or destination address).
System information
The System Info tab displays device information, for example, the device name, device model, software version, and IRF mode.
Internet access monitoring
The Internet Access Monitoring tab displays Internet access information, including the application type, website address, and transferred files. You can click the Details icon to display detailed Internet access information and audit user behaviors.
License information
The License Info tab displays license information about features. You can click the Details icon to display detailed license information, including the license type, status, and validity period.