- Table of Contents
- Related Documents
-
| Title | Size | Download |
|---|---|---|
| 01-Text | 14.97 MB |
Contents
Sign in to HDM for rack servers
Sign in to HDM for blade servers and AE modules
View Ethernet adapter information
View factory information about FRUs
Sensors (for the R2700, R2900, R4700, and R4900)
View status and temperature readings of temperature sensors
View status and speed of each fan
View status of electrical current
View status and temperature readings of temperature sensors
View status and speed of each fan
View status of electrical current
View status and temperature readings of temperature sensors
View status and speed of each fan
View status of electrical current
View status of the system initialization process
View status and temperature readings of temperature sensors
View status and speed of each fan
View status of electrical current
Sensors (for the R4300 and X10000)
View status and temperature readings of temperature sensors
View status and speed of each fan
View status of electrical current
Sensors (for the AE100, B5700, B5800, and B7800)
View status and temperature readings of temperature sensors
View status of electrical current
View status and temperature readings of temperature sensors
View status and speed of each fan
View status of the system initialization process
Set the operation log storage location
General restrictions and guidelines for network configuration
View summary information about the dedicated network port
Configure the dedicated network port
Enable the shared network port
View summary information about the shared network port
Configure the shared network port
Enable or disable automatic shared port selection
Change the shared network port
General restrictions and guidelines
Enable or disable bonding mode
Enable or disable active/standby mode
User roles and privileges matrix
View or close HDM user sessions
Types of firewall rules and their priority order
Firewall rule configuration guidelines
Upload an SSL certificate and key to HDM
Operate the server from H5 KVM
Turn on or turn off the UID LED of the server
Configure boot options for the next reboot
View information about a logical drive (a RAID array) or delete a logical drive
Manage power and power consumption
View the power status of the server
Change the power status of the server
View summary information about power supplies
Manage redundant power supplies
Set the operating mode of power supplies
View the power consumption history statistics
View the power consumption history chart
Import and export configuration
Export HDM, BIOS, or RAID configuration
Restore factory default HDM settings
Firmware update restrictions and guidelines
Prerequisites for firmware update
About HDM
Introduction
H3C Device Management (HDM) is a remote server management system that provides abundant features as described in Table 1.
|
Description |
|
|
Web-based management |
Provides a user-friendly Web-based management interface for easy management. |
|
Various management interfaces |
Provides abundant management interfaces, such as IPMI, HTTPS, SNMP, RESTful, and Redfish, to meet various system integration requirements. |
|
IPMI v1.5 and IPMI v2.0 compliance |
Provides a standard management interface for standard management system integration. |
|
Remote control |
Provides remote access to the server through KVM and virtual media, enabling server monitoring and management anywhere anytime. |
|
Critical OS event screenshot and video recording |
Takes a screenshot or records a video upon a critical OS event (for example, a crash) for future troubleshooting. |
|
Video recording |
Records operations on the server. |
|
Sideband and VLAN |
Supports VLANs and the sideband technology that allows for flexible network management. |
|
LDAP |
Simplifies user management and enhances management security by managing users on the LDAP server. |
|
All-round server monitoring, alarming, and event logging |
Monitors server operation, for example, temperature, voltage, and fan speed, and generates alarms and logs if any event occurs, such as drive failure or power supply failure. |
|
Smart Hardware Diagnosis (SHD) |
Supports SHD for component fault diagnosis, bringing ease to fault location and faulty component replacement. |
|
Out-of-band RAID management |
Supports out-of-band RAID monitoring and configuration to improve RAID configuration efficiency and management capability. |
|
Primary/backup image switchover |
Enables startup by using the backup image if the system crashes, which enhances system availability. |
Applicable products
This document is applicable to the following products:
· AE100.
· H3C UniServer B5700 G3.
· H3C UniServer B5800 G3.
· H3C UniServer B7800 G3.
· H3C UniServer R2700 G3.
· H3C UniServer R2900 G3.
· H3C UniServer R4300 G3.
· H3C UniServer R4700 G3.
· H3C UniServer R4900 G3.
· H3C UniServer R4950 G3.
· H3C UniServer R6700 G3.
· H3C UniServer R6900 G3.
· H3C UniServer R8900 G3.
· H3C UniStor X10000 G3.
Sign in to HDM
The following information describes the prerequisites for a successful sign-in to HDM, the default sign-in parameters, the sign-in procedure, and common operations for all pages.
Sign in to HDM for rack servers
Prepare for an HDM sign-in
Before you sign in to the HDM Web interface, make sure all preparation requirements are met.
Set up the HDM client
HDM does not require installation of client software. You can use a Web browser to access HDM.
Make sure the browser and resolution setting of the configuration terminal meet the requirements in Table 2.
Table 2 Browser and resolution requirements
|
Browsers |
Resolution |
|
Google Chrome 48.0 (or higher) Internet Explorer 11 (or higher) Mozilla Firefox 50.0 (or higher) |
Minimum: 1366*768 Recommended: 1600*900 (or higher) |
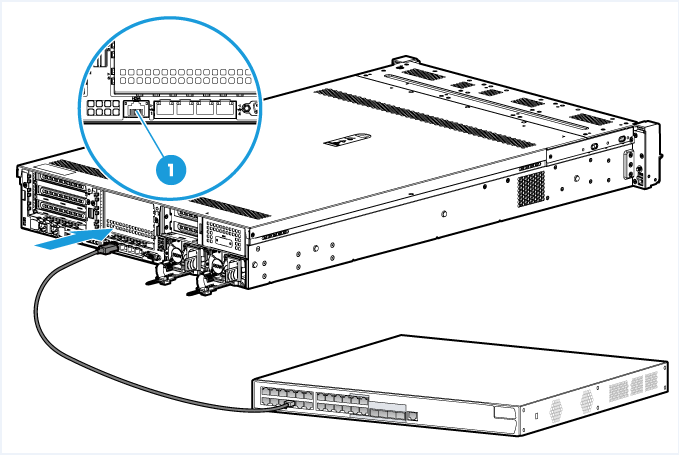
Connect the server to the network
Connect either of the following network port on the server to the network:
· HDM shared network port—Transmits HDM management traffic and server data traffic simultaneously. This port is available on all servers.
· HDM dedicated network port—Transmits only HDM management traffic. This port is not available on blade servers and AE modules.
For network port configuration on rack or storage servers, see "Manage network configuration." For network port configuration on blade servers and AE modules, see "Shared port."
Figure 1 Connecting the server to the network (HDM dedicated network port)
Obtain the HDM sign-in settings
To sign in to HDM, you must obtain its management IP address and user account information.
On first sign-in, use the default settings in Table 3. To change the management IP address after login, see "Manage network configuration."
Table 3 Default HDM sign-in settings
|
Item |
Default setting |
|
IP address |
HDM shared network port: DHCP HDM dedicated network port: 192.168.1.2/24 |
|
Username |
admin |
|
Password (case-sensitive) |
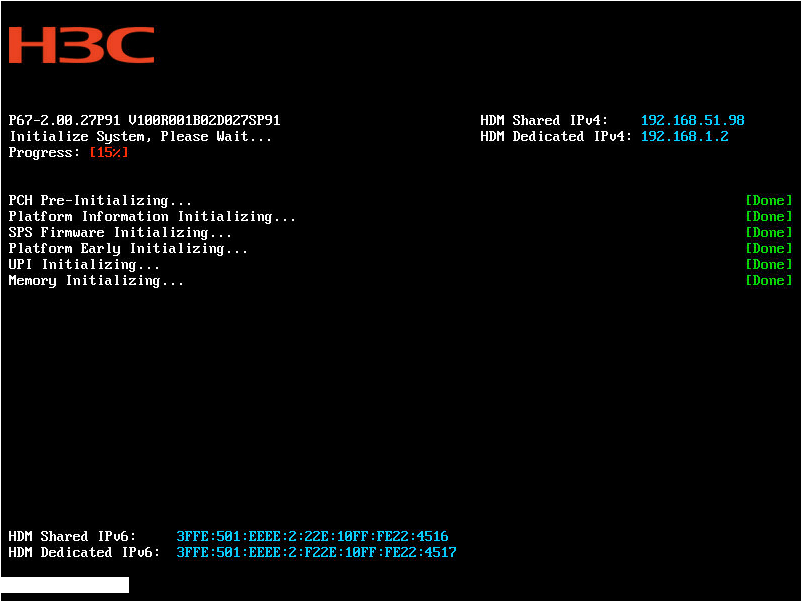
You can obtain the HDM management IP address from the POST screen of the BIOS. As shown in Figure 2, the POST screen displays the IPv4 addresses of the shared and dedicated network ports at the upper right corner, and the IPv6 addresses at the lower left corner.
Figure 2 Obtaining the HDM management IP address (BIOS version 2.00.27)
Sign in to HDM
Restrictions and guidelines
By default, the session timeout is 30 minutes. If no operation is performed within 30 minutes, the system logs you out.
After five consecutive password check failures, your account will be locked for five minutes.
For security purposes, change the default username and password at the first login, and update your password periodically.
Procedure
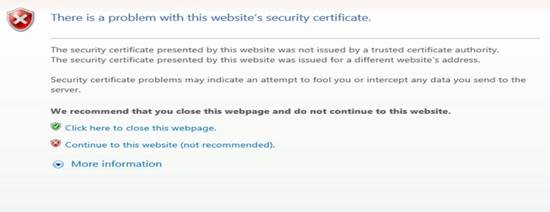
2. On the security certificate page that opens, click Continue to this website (not recommended).
Figure 3 Security certificate confirmation page
3. On the sign-in page, enter the username and password, and then click Sign in.
If this is the first sign-in, enter the default username (admin) and password (Password@_). The password is case-sensitive.
Figure 4 HDM sign-in page

4. If this is the first sign-in, change the username and password for security purposes as described in "User accounts."
Sign in to HDM for blade servers and AE modules
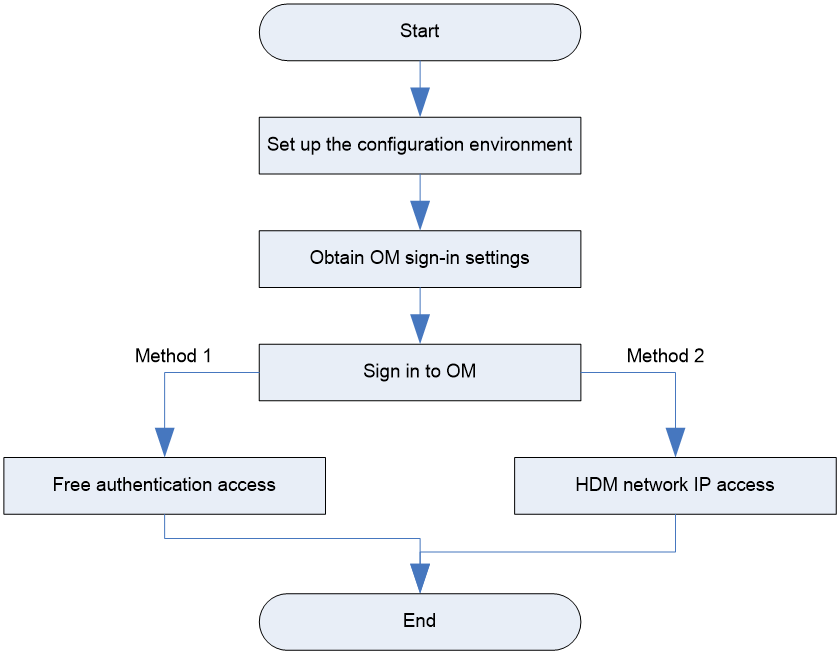
For blade servers and AE modules, HDM is accessible only from OM. You can access HDM from the Remote Consoles page without being authenticated or by clicking the HDM network IP address from the blade server information page.
Only OM administrator users and operator users that have the HDM access privilege can access HDM from OM.
The HDM sign-in procedure is the same for blade servers and AE modules. This section uses the procedure for blade servers as an example.
HDM sign-in flowchart
Prepare for an HDM sign-in
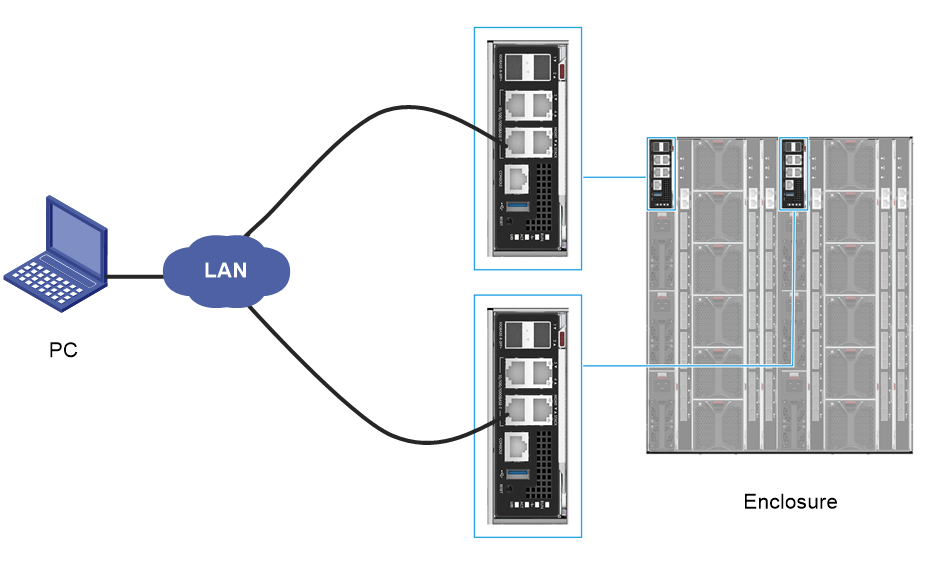
Setting up the configuration environment
As shown in Figure 5, use a local PC as the HDM client and connect the PC to the management (MGMT) ports on the active and standby OM modules. For more information about port locations, see the labels on the front panel of the OM modules.
Figure 5 Setting up the configuration environment
Obtain OM sign-in settings
To sign in to OM Web interface, you must obtain its management IP address and user account information. On first sign-in, use the default settings in Table 4.
Table 4 Default OM sign-in settings
|
Item |
Default setting |
|
IP address |
192.168.100.100/24 |
|
Username |
admin |
|
Password (case-sensitive) |
Password@_ |
Set up the HDM client
HDM does not require installation of client software. You can use a Web browser to access HDM. To ensure login success, follow these restrictions:
· Make sure the IP address of the HDM client is in the same network segment with the management IP addresses of OM modules and HDM. You can obtain the HDM management IP address from the OM Web interface. For more information, see OM online help.
· Make sure the browser and resolution setting of the configuration terminal meet the requirements in Table 5.
Table 5 Browser and resolution requirements
|
Browsers |
Resolution |
|
Google Chrome 58.0 (or higher) |
Recommended: 1600*900 (or higher) |
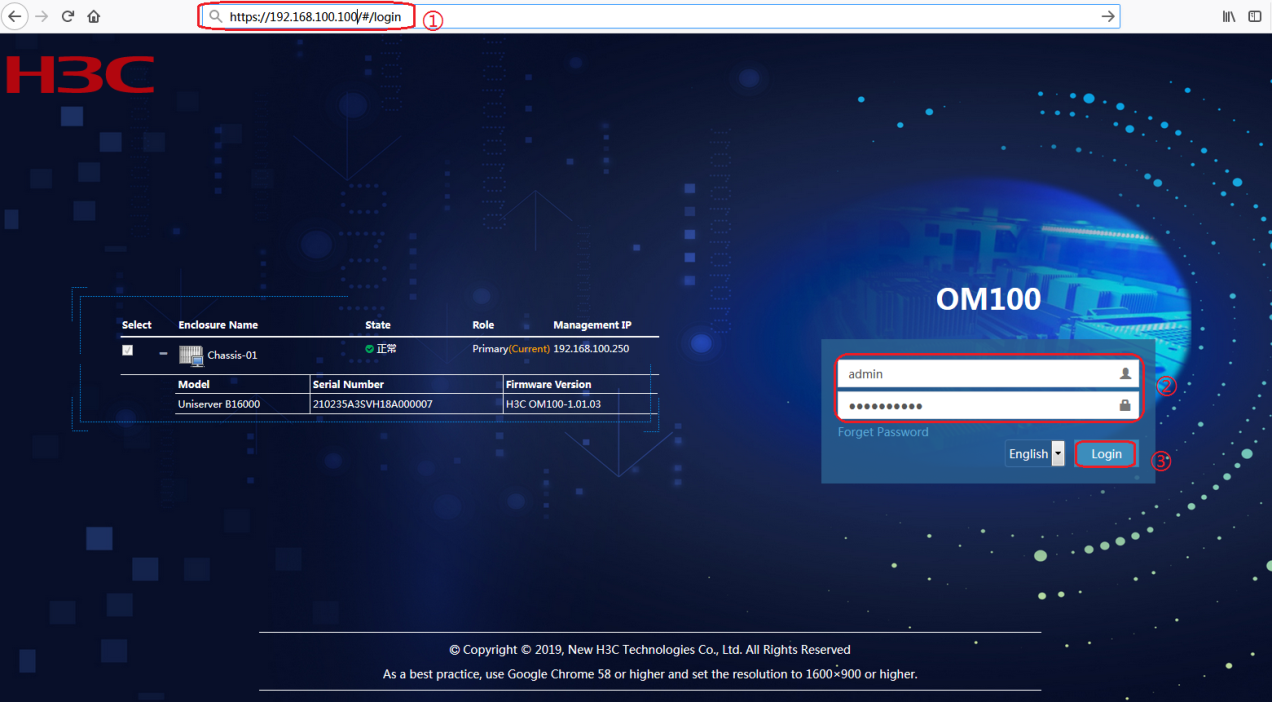
Sign in to OM
1. Open the browser, and enter the OM management IP address in the format of https://OM_ip_address.
2. On the sign-in page, enter the username and password, and then click Login.
If this is the first sign-in, enter the default username (admin) and password (Password@_). The password is case-sensitive.
Figure 6 Signing in to OM
Sign in to HDM
Free authentication access
1. In the navigation pane of the OM Web interface, click Blade Servers, select the target server, and then click Remote Consoles.
2. On the Remote Consoles tab, click the Access HDM button to sign in to HDM, as shown in Figure 7.
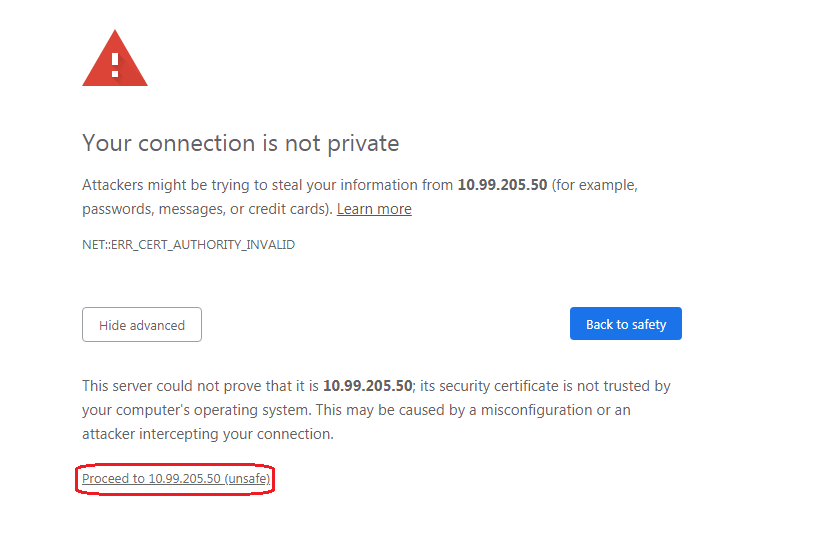
If this is the first sign-in, click the Proceed to link as shown in Figure 8 to trust the webpage that opens.
Figure 7 Free authentication access
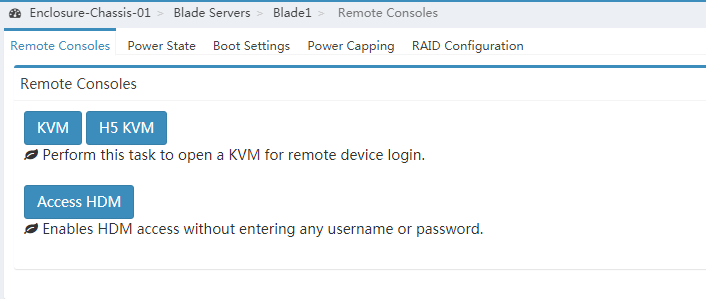
Figure 8 Confirming the connection
The HDM Web interface opens.
HDM network IP access
1. In the navigation pane of the OM Web interface, click Blade Servers, select the target server.
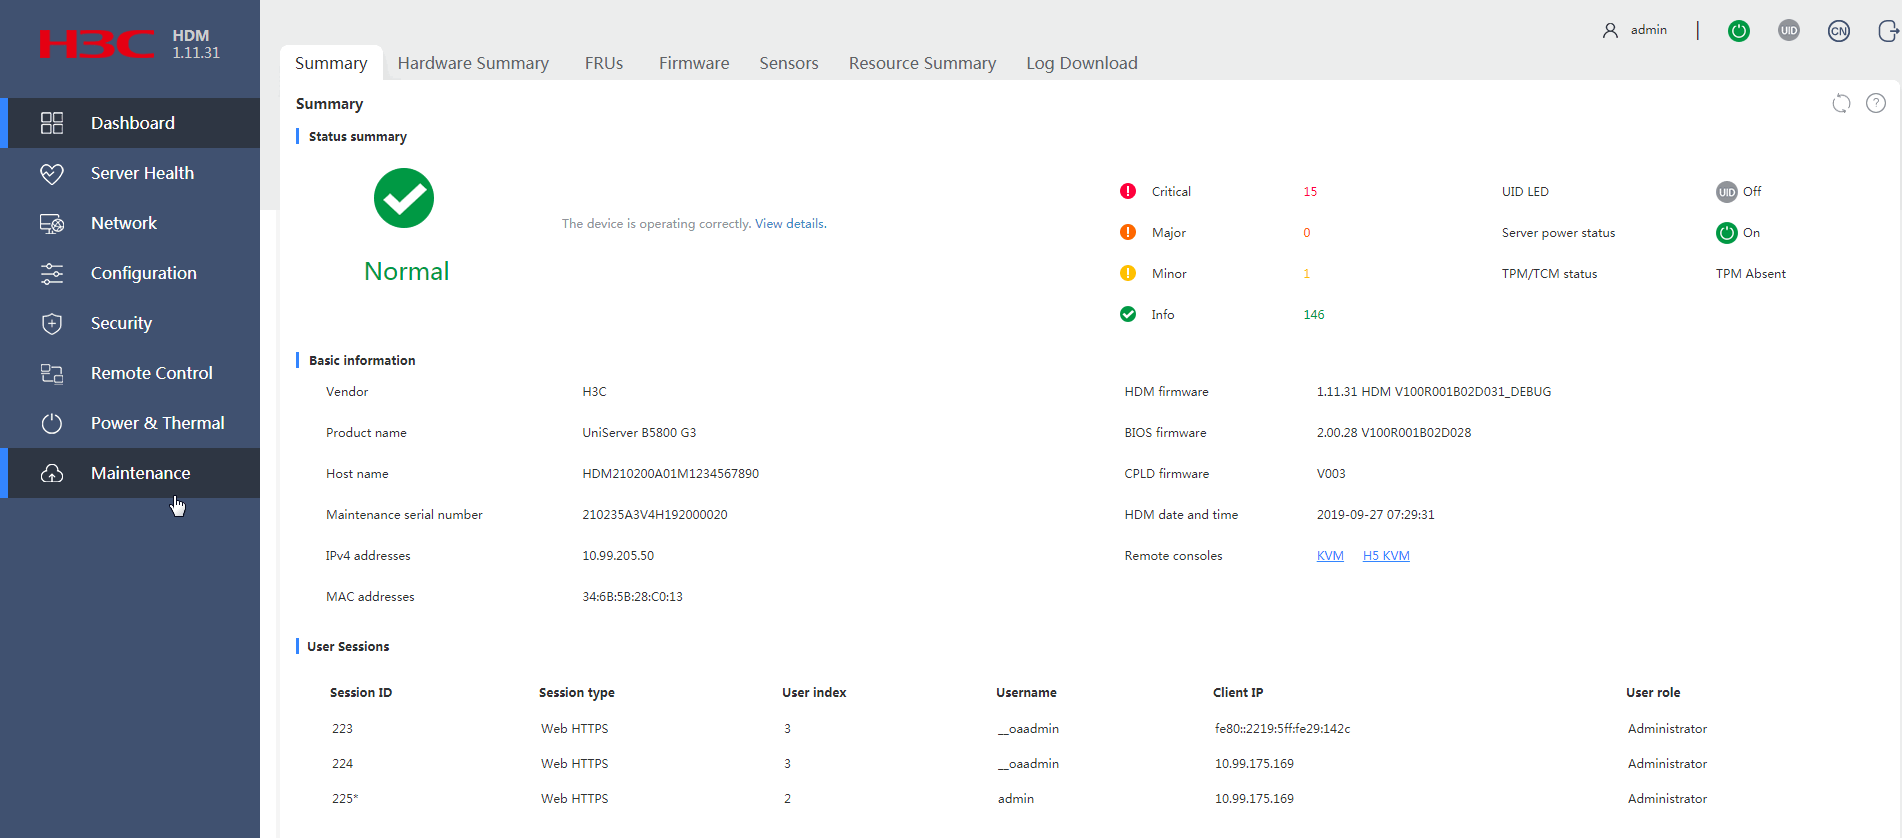
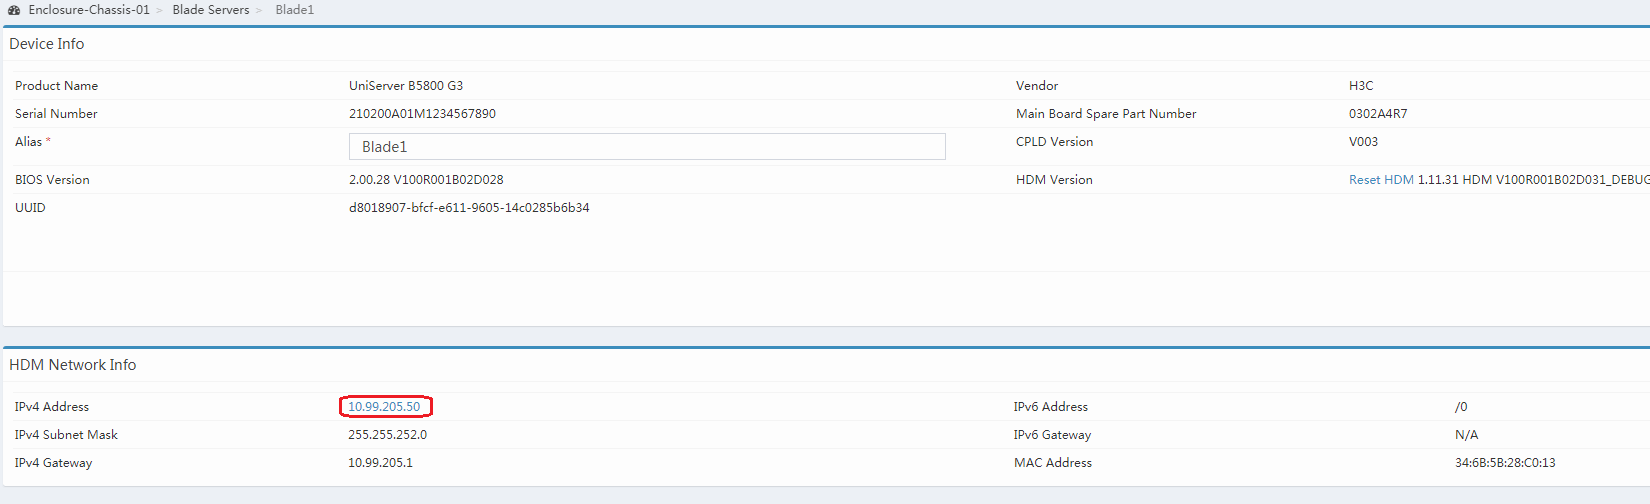
2. In the HDM Network Info section, click the IP address link from the IPv4 Address field, as shown in Figure 10.
If this is the first sign-in, click the Proceed to link as shown in Figure 8 to trust the webpage that opens.
Figure 10 HDM network IP access
The HDM Web interface opens.
Figure 11 HDM Web interface

Common operations
You can perform the following operations on any HDM page:
· To change the language, click ![]() for English and
for English and ![]() for
Chinese.
for
Chinese.
· To access the HDM online
help, click ![]() .
.
· To log out, click ![]() .
.
· To refresh the page, click ![]() .
.
Display device information
Summary
The Summary menu presents an overview of the server, including its status summary, basic information, system alarm status, server power status, UID LED status, TCP/TCM status, SD card slot status, and HDM user sessions. In addition, this page provides shortcuts for you to quickly access the desirable function or feature menus.
Procedure
In the navigation pane, select Dashboard > Summary, as shown in Figure 12.
Figure 12 Viewing summary information about the server
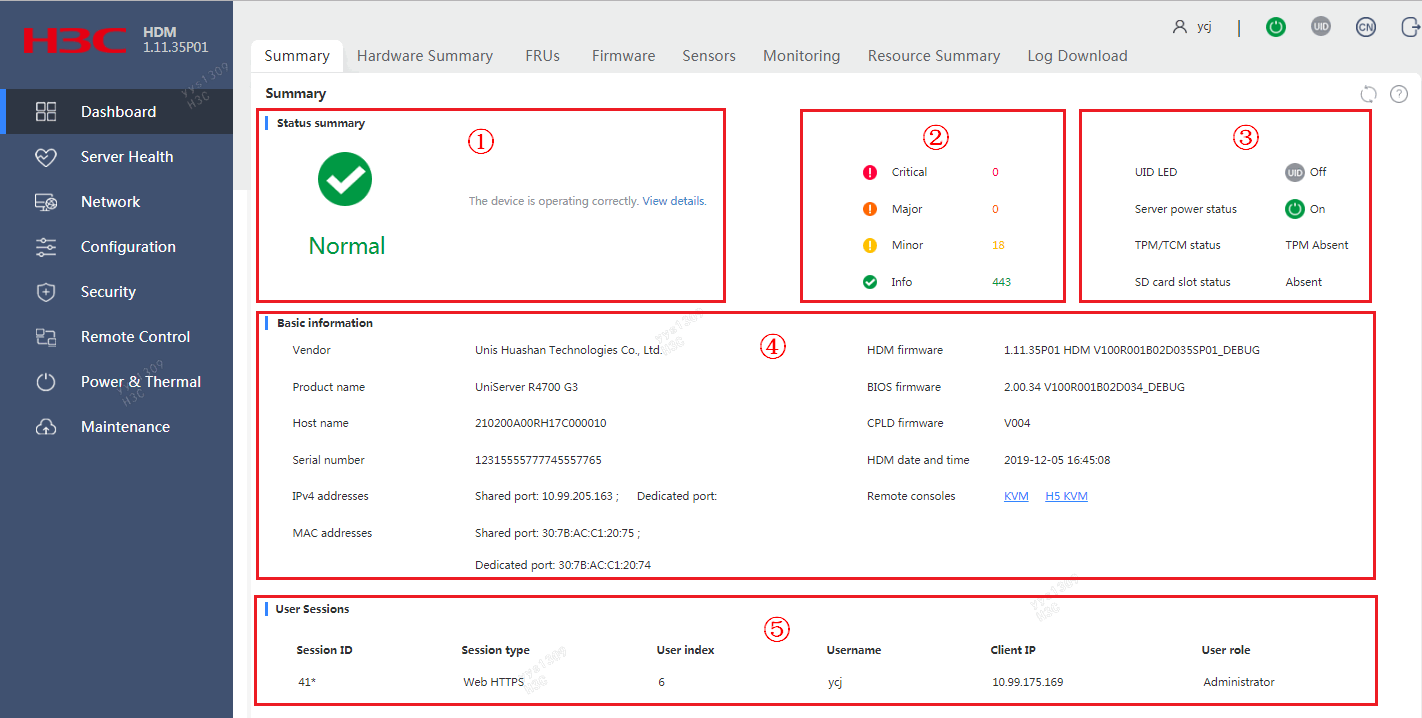
The work pane provides the following sections:
· Section 1—Displays the overall health state of the system and subsystems with issues. Table 6 displays the summary of subsystem health states.
¡ If this section displays ![]() Normal, all server subsystems are
operating correctly. No administrative action is required.
Normal, all server subsystems are
operating correctly. No administrative action is required.
¡ If
this section displays ![]() Critical or
Critical or ![]() Major, a minimum of one subsystem is experiencing issues. In this situation, view the specific sensor statistics or event
logs to identify the issues, as shown in Figure 13 and
Figure 14.
Major, a minimum of one subsystem is experiencing issues. In this situation, view the specific sensor statistics or event
logs to identify the issues, as shown in Figure 13 and
Figure 14.
Figure 13 Viewing sensor statistics
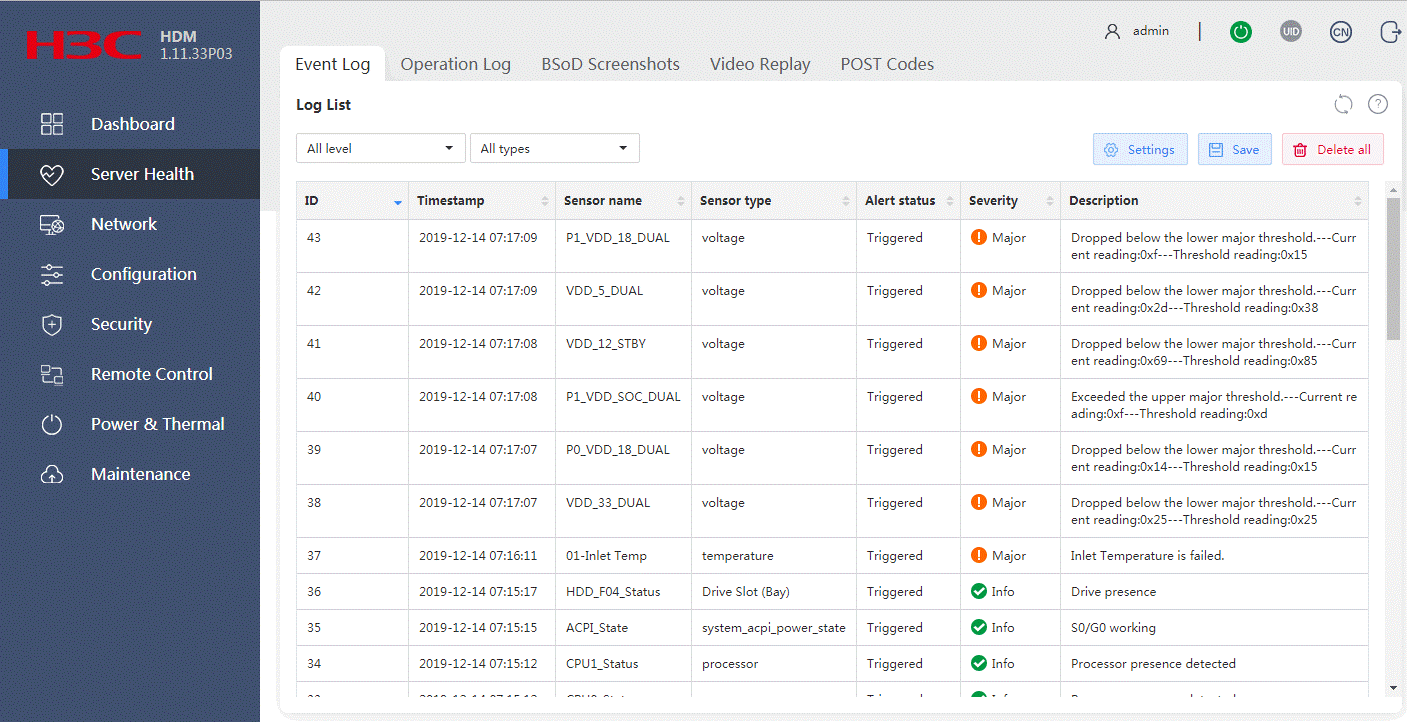
· Section 2—Displays the number of alarms for each alarm severity level. An alarm represents an event that requires administrative attention or action. To view detailed information about alarms of a severity level, click the severity or number link. For more information, see "Event log."
Severity options include:
¡ Info—The event does not affect the system and no action is required. Examples include normal state changes and alarm removed events.
¡ Minor—The event has minor impact on the system, but it requires prompt action to avoid an escalation in severity.
¡ Major—The event has serious impact on some subsystems and might result in service interruption. Immediate action is required.
¡ Critical—The event might result in system crash or shutdown. Immediate action is required.
· Section 3—Displays UID LED status, server power status, TCP/TCM status, and presence of an SD card expander module. For information about setting the power state, see "Power control."
¡ UID LED status options include:
- On—The UID LED of the server is steady blue.
- Flashing—The UID LED of the server is flashing blue. The UID LED flashes if a firmware update is being performed on the server or if the remote console is open after the UID button was turned on.
- Off—The UID LED of the server is off.
¡ Server power status options include:
- On—The server is powered on.
- Off—The server is powered off.
¡ TPM/TCM status options indicate the enabling status of TPM/TCM.
Trusted Platform Module (TPM) is a microchip embedded in the system board. It stores encryption information (such as encryption keys) for authenticating server hardware and software. Trusted Cryptography Module (TCM) is a trusted computing platform-based hardware module with protected storage space, which enables the platform to implement password calculation. For information about the TPM/TCM module installation, see the user guide for the server.
¡ SD card slot status options indicate whether an SD card expander module is present.
· Section 4—Displays basic information about the server, including:
¡ Host name of the server. For information about changing the host name, see "Manage network configuration."
¡ Serial number as a unique product code assigned by the manufacturer.
¡ IPv4 addresses of the network ports for accessing the HDM. This field displays the HDM dedicated and shared network ports if they are not bonded. If the network ports are bonded, this field displays the bond port Bond0.
¡ MAC address of the network port being used for accessing HDM. For more information, see "Manage network configuration."
¡ Current firmware versions of the HDM, BIOS, and CPLD. For information about firmware update, see "Update firmware."
¡ Date and time on the HDM. For more information, see "NTP."
¡ Remote consoles supported: KVM and H5 KVM. For more information, see "Remote control."
· Section 5—Displays all HDM user sessions that are accessing HDM, including Telnet, SSH, Web, and Serial sessions. The session with an asterisk (*) attached to the session ID represents the current session. For more information about HDM user sessions, see "Access services."
Parameters
Table 6 Subsystem health states
|
Subsystem |
State |
Description |
|
Fans |
|
The fans are operating correctly in redundancy. None of the fans at critical locations have failed. |
|
|
Fan redundancy issue is present because fans at two or more critical locations have failed. |
|
|
Temperature |
|
All component temperatures are within the normal range. No action is required. |
|
|
A component temperature has crossed a major threshold, but it has not reached a critical threshold. Immediate action is required. |
|
|
|
A component temperature has crossed a critical threshold. Immediate action is required. |
|
|
Power supplies |
|
The power supply is operating correctly. |
|
|
A severe power supply error has occurred. |
|
|
Current |
|
No overcurrent is present. |
|
|
Overcurrent is present on some components on the system board. |
|
|
Voltage |
|
All components are in a normal voltage condition. No action is required. |
|
|
A voltage value has crossed a major threshold, but it has not reached a critical threshold. Immediate action is required. |
|
|
|
A voltage value has crossed a critical threshold. Immediate action is required. |
|
|
Memory |
|
The memory is operating correctly. |
|
|
No memory modules are present, all memory modules are isolated, or an unrecoverable memory error has occurred. |
|
|
Processors |
|
The processors are operating correctly. |
|
|
An overtemperature condition has occurred. |
|
|
|
The temperature of the processor has exceeded the critical threshold, an unrecoverable processor error has occurred, or the primary processor is absent. |
|
|
Drives |
|
All drives are operating correctly. |
|
|
A severe drive error has occurred. |
Hardware summary
The Hardware Summary menu displays information about hardware, including processors, memory, and storage.
The available server configuration varies by server model.
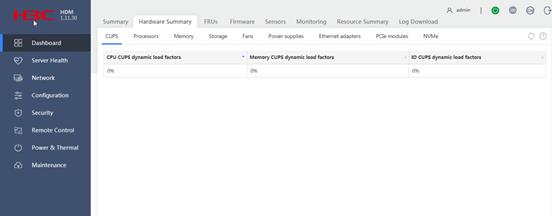
View CUPS information
The CUPS feature provides real-time monitoring of processor (CPU), memory, and I/O usage in the system. It uses the proportions of dynamic load factors for CPU, memory, and I/O usage to indicate the type of main services running on the system.
A higher CPU, memory, or I/O CUPS dynamic load factor indicates that main services running on the system are compute-intensive, memory-intensive, or I/O-intensive.
Restrictions and guidelines
The CUPS feature is available only on the R2700, R2900, R4300, R4700, R4900, R6700, R6900, R8900, and X10000 servers.
The CPU, memory, and I/O CUPS load factors are all 0% when the server is powered off or no service runs on the server.
CUPS monitoring is an out-of-band function and does not consume processor resources.
The CPU and MEM CUPS load factors are uncorrelated with the CPU and MEM usage calculated in the OS.
Procedure
1. In the navigation pane, select Dashboard > Hardware Summary.
2. Click the CUPS tab to view CUPS information, as shown in Figure 15.
Figure 15 Viewing CUPS information
View processor information
Restrictions and guidelines
HDM updates processor and memory information at the POST phase. When the server is powered off, HDM displays the processor information obtained at the most recent POST.
HDM might display incorrect processor and memory information at the POST phase. Refresh the page after the server completes POST to obtain the correct information.
Procedure
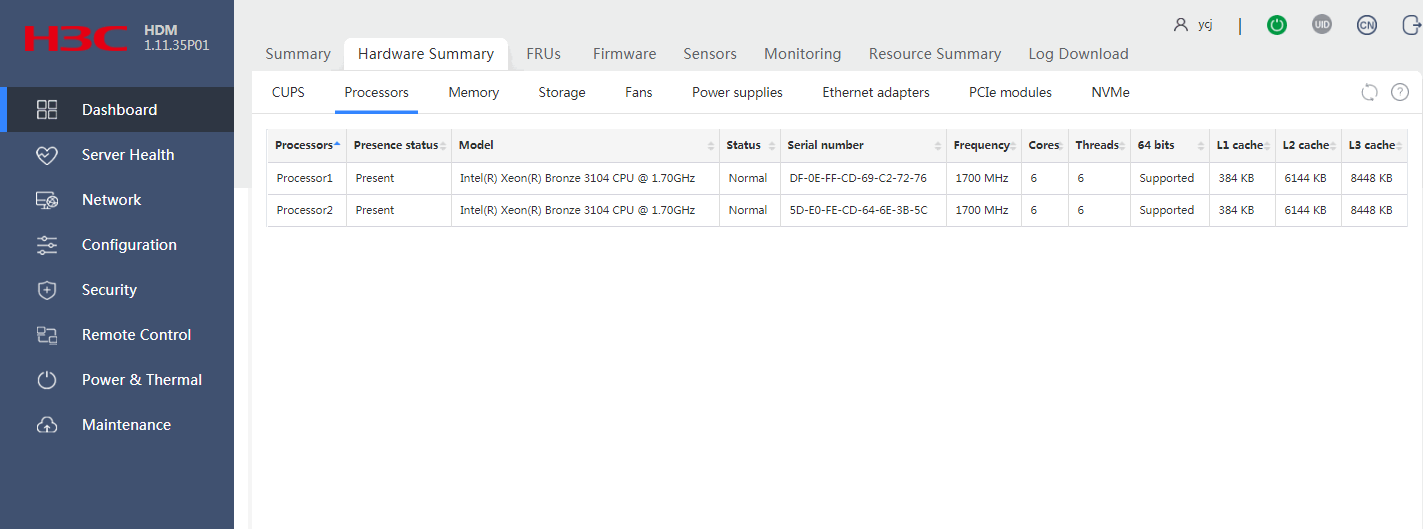
1. In the navigation pane, select Dashboard >Hardware Summary.
2. Click the Processors tab to view processor information, as shown in Figure 16.
Figure 16 Viewing processor information
Parameters
· Model: Model of the processor.
· Presence status: Presence status of the processor. Options include Present and Absent.
· Frequency: Base frequency of the processor.
· Status: Operating status of the processor. Options include Normal and Abnormal.
· Serial number: Unique product code assigned by the manufacturer. This field displays N/A if HDM fails to obtain the serial number.
· Cores: Cores of the processor.
· Threads: Number of the threads supported by the processor.
· 64 bits: Indicates whether the processor supports 64-bit computing. Options include Supported and Not supported.
· L1 cache: L1 cache of the processor.
· L2 cache: L2 cache of the processor.
· L3 cache: L3 cache of the processor.
View memory information
Restrictions and guidelines
HDM updates processor and memory information at the POST phase. When the server is powered off, HDM displays the processor information obtained at the most recent POST.
HDM might display incorrect processor and memory information at the POST phase. Refresh the page after the server completes POST to obtain the correct information.
If the Status field for a memory module displays that it is absent, abnormal, or uninitialized, all remaining fields display a tilde (~) except the Processor, Channel, and Slot fields.
Procedure
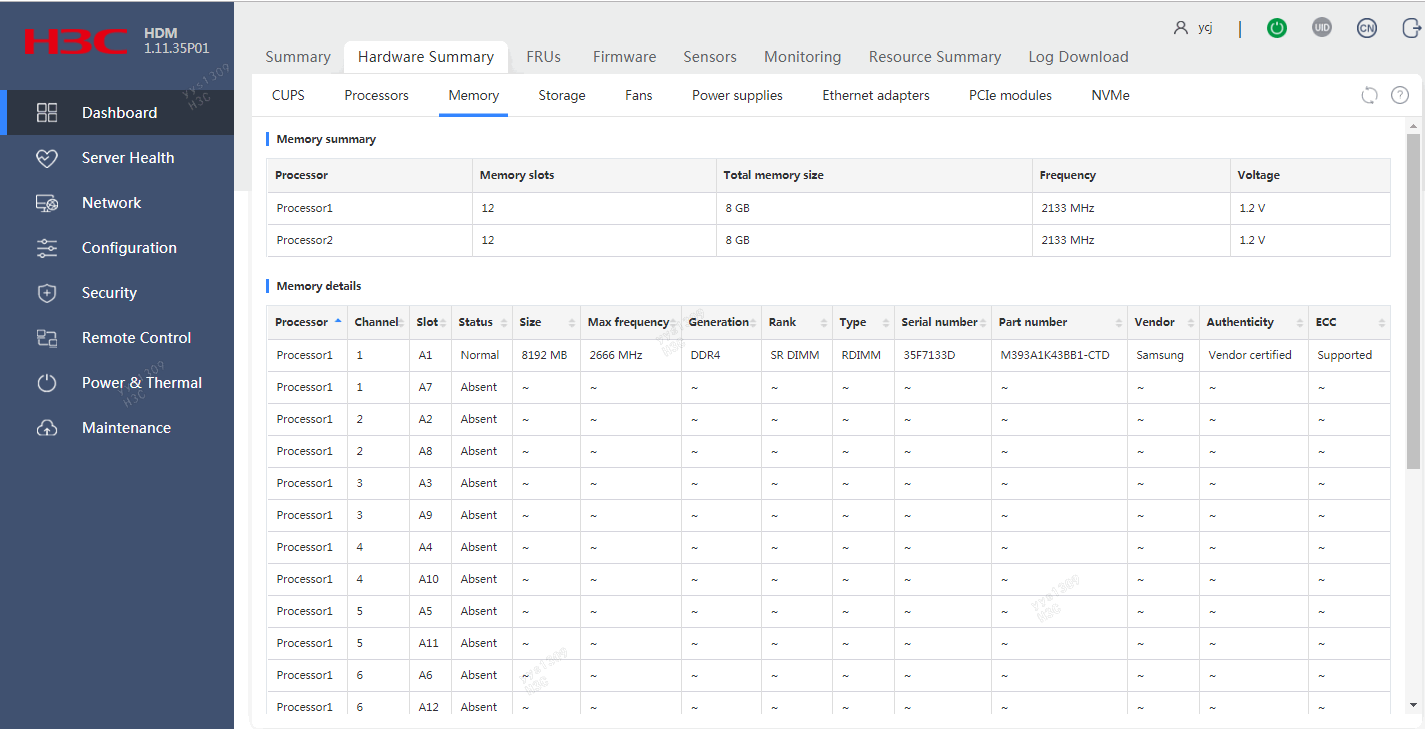
1. In the navigation pane, select Dashboard > Hardware Summary.
2. Click the Memory tab to view memory information, as shown in Figure 17.
Figure 17 Viewing memory information
Parameters
· Processor: ID of the processor to which the memory module is attached.
· Memory slots: Number of memory slots supported by the processor.
· Total memory size: Total memory capacity for the processor.
· Frequency: Frequency at which the memory operates.
· Channel: Channel ID of the memory module.
· Slot: Slot number of the memory module.
· Status: Memory module status. Options include:
¡ Normal—The memory module is operating correctly.
¡ Absent—The memory module is not securely installed or no memory module is installed.
¡ Abnormal—Either of the following conditions exists:
- The memory module is faulty.
- The memory module is present in a channel that is disabled because a memory training error has occurred on any other memory module in the same channel.
· Max frequency: Main frequency of the memory module.
· Type: DIMM type. Options include RDIMM and NVDIMM.
· Serial number: Unique product code assigned by the manufacturer. This field displays N/A if HDM fails to obtain the serial number.
· Authenticity: Whether the memory is vendor certified.
¡ If it is certified, this field displays Vendor certified.
¡ If it is not certified, this field displays Normal.
· ECC: Support for error-correcting code (ECC).
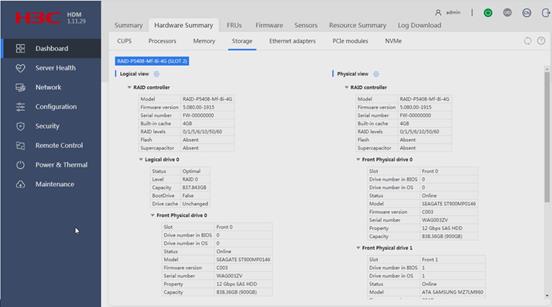
View storage information
Perform this task to view information about storage controllers (RAID controllers or RAID-incapable storage controllers), logical drives, and physical drives.
Restrictions and guidelines
· If the storage controller and the backplane are not installed in accordance with specifications, the following fields for each physical drive might be displayed incorrectly:
¡ Slot.
¡ Drive number in the BIOS.
¡ Drive number in OS.
· Logical view is available only for storage controllers.
· Storage and sensor information is not available for LSI HBA cards that do not support OOB.
· If the drive status is Failed, the drive information (including the drive size, speed, and interface type) might be inaccurate and is provided only for reference.
· The default maximum capacity of a logical drive might be slightly different from the maximum capacity you can set. If you do not specify a drive capacity when creating a logical drive, the drive capacity is the default maximum capacity calculated by the system.
· During system initialization, HDM displays PMC RAID or HBA controller information obtained before the initialization. HDM updates this information only after the system starts up.
Procedure
1. In the navigation pane, select Dashboard > Hardware Summary.
2. Click the Storage tab, as shown in Figure 18.
3. Click a storage controller name to view its detailed information. The storage controller name is a combination of its model and installation position. The page displays information about the first storage controller by default.
4. To manage the physical or logical drives, click the cog icon for physical or logical drive management.
Figure 18 Viewing storage information
Parameters
Storage controller information
· Serial number: Serial number of the storage controller. If the storage controller is PMC type, you can use the OEM command to modify its serial number.
· WWN: SAS address of the storage controller. WWN is displayed only if an LSI HBA card is installed.
· Built-in cache: Capacity of the read/write cache embedded in the storage controller.
· RAID levels: RAID levels supported by the storage controller.
· Flash: Status of the flash card of the power fail safeguard module.
¡ For an LSI storage controller, status options include:
- Normal—The flash card is operating correctly.
- Abnormal—The flash card is operating incorrectly.
- Absent—The flash card is not connected to the supercapacitor, not installed securely, or not installed at all.
¡ For a PMC storage controller, status options include:
- Normal—The flash card is operating correctly.
- Absent—The flash card of the power fail module is not securely installed or is not installed at all.
- Abnormal_status code—The flash card is operating incorrectly. You can check the status code to identify the exceptions that cause the flash card to enter the abnormal state.
- Warning_status code—A warning is present on the flash card. You can check the status code to identify the exceptions that cause the flash card to enter the warning state.
A status code is a hexadecimal number. To identify the exceptions, convert the hexadecimal status code into a 16-digit binary number (bit 0 to bit 15 from the right to the left). A set bit means that the exception indicated by the bit is present. For information about a set bit and its corresponding exception, see Table 7.
For example, if the status code is 0x500 (binary format 0000 0101 0000 0000), exceptions indicated by bit 8 and bit 10 are present on the flash card.
Table 7 Flash card exceptions and their set bits
|
Bit# |
Bit state |
Description |
|
0 |
1 |
GB subsystem is currently initializing. |
|
1 |
1 |
GB subsystem is in ready state. |
|
2 |
1 |
GB subsystem is executing a learning cycle. Learning cycles do not disrupt normal operation or the ability to protect data. |
|
3 |
1 |
GB subsystem has failed. |
|
4 |
1 |
The supercapacitor pack has exceeded the maximum temperature threshold. |
|
5 |
1 |
The supercapacitor pack has exceeded the major temperature threshold. |
|
6 |
1 |
The supercapacitor pack is over voltage. |
|
7 |
1 |
The supercapacitor pack has exceeded the maximum charging current. |
|
8 |
1 |
GB subsystem learning cycle has passed. |
|
9 |
1 |
GB subsystem learning cycle has failed. |
|
10 |
1 |
The supercapacitor pack has failed. |
|
11 |
1 |
The supercapacitor pack is nearing the end of its life. Replacement is recommended. |
|
12 |
1 |
The supercapacitor pack has reached the end of its life Replacement is required. |
|
13 |
1 |
One of the capacitors in the supercapacitor pack seems to be missing. |
|
14 |
N/A |
Reserved. |
|
15 |
N/A |
Reserved. |
|
|
NOTE: The Green backup (GB) system reports several types of operation status progress and health information. |
· Charging status: The remaining amount of power available with the supercapacitor.
|
|
NOTE: The Flash and Charging status fields are available only if a power fail safeguard module is installed. A power fail safeguard module contains a flash card and a supercapacitor. When a system power failure occurs, this supercapacitor can provide power for a minimum of 20 seconds. During this interval, the storage controller transfers data from memory to the flash card, where the data remains indefinitely or until the controller retrieves the data. |
Logical drive information
· Status: Status of the logical drive. Options include:
¡ Normal—The logical drive is operating correctly.
¡ Degraded—Some RAID member drives have failed and require prompt replacement.
¡ Rebuilding—The RAID array is being rebuilt to reconstruct data and recover from the degraded state.
¡ Failed—The logical drive is corrupt and inaccessible.
¡ Formatting—The logical drive is being formatted. All data will be deleted upon this action.
¡ Scanning—The member disk drives are being scanned to maintain data continuity in the logical drive. This field is available for logical drives with parity bits, such as RAID 5 and RAID 6 logical drives.
¡ Suboptimal—One member drive in the RAID 6 or RAID 60 logical drive has failed. If more than one member drive has failed, the logical drive is placed in Degraded state. This field is available for RAID 6 and RAID 60 logical drives.
¡ Migrating—Data is being migrated between drives or the RAID array is changing to a new RAID level.
¡ Copying back—Data is being copied from the hot spare disk back to the replacement drive of a failed drive. When this operation is complete, the hot spare returns to the hot standby state.
· BootEnable: Indicates whether the logical drive is a boot drive. Options include:
¡ True—The logical drive is a boot drive.
¡ False—The logical drive is not a boot drive.
Support for this field varies by storage controller model.
· Drive cache: Indicates whether drive cache is enabled for the logical drive. Options include:
¡ Unchanged—The default drive cache policy is used.
¡ Enable—Drive cache is enabled.
¡ Disable—Drive cache is disabled.
Support for this field varies by storage controller model.
Physical drive information
· Slot: Slot number of the physical drive.
· Drive number in BIOS: Drive number displayed in BIOS.
· Drive number in OS: Drive number displayed in the operating system.
· Status: Status of the physical drive. Options include:
¡ Unconfigured good—The physical drive has been initialized or has not been configured, and it is available for RAID configuration and hot spare setting.
¡ Unconfigured bad—The physical drive has residual RAID information, which requires manual deletion.
¡ Online—The physical drive is already used to create a RAID.
¡ Offline—The physical drive is disabled.
¡ Rebuilding—The physical drive is being used in RAID rebuilding.
¡ Hot spare—The physical drive is already used as a hot spare.
¡ JBOD—The physical drive is already used to create a JBOD.
¡ Failed—The physical drive failed.
¡ Early warning—The physical drive is analyzing possible failures.
¡ Raw—A new physical drive or a physical drive in Unconfigured good state is uninitialized.
¡ Optimal—The physical drive is used as a common hard disk for storage. It is not used for other purposes.
· Type: Speed, interface type, and drive type of the physical drive.
· Remaining SSD life—Remaining SSD life in percent. Support for this field varies by drive model.
View fan information
Restrictions and guidelines
This feature is available only for the R2700, R2900, R4300, R4700, R4900, R4950, R6700, R6900, R8900, and X10000 servers.
Procedure
1. In the navigation pane, select Dashboard >Hardware Summary.
2. Click the Fans tab to view fan information, as shown in Figure 19.
Figure 19 Viewing fan information
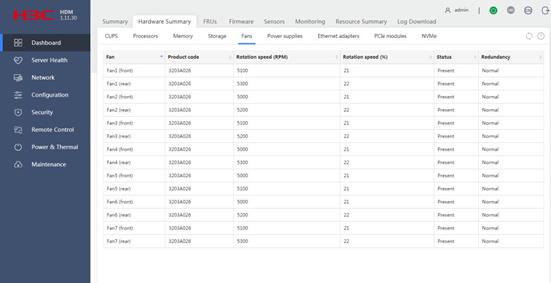
Parameters
· Product code—Product code that identifies the fan.
· Rotation speed (RPM)—Current actual rotational speed.
· Rotation speed (%)—Current RPM as a percentage of the rated RPM.
· Status—Presence status of the fan.
· Redundancy—Redundancy status. This field displays Abnormal if the fan at a required location is absent or has failed. This field displays Normal if the fan at a required location is operating correctly. For a non-required location, this field displays Normal regardless of whether a fan is absent or present.
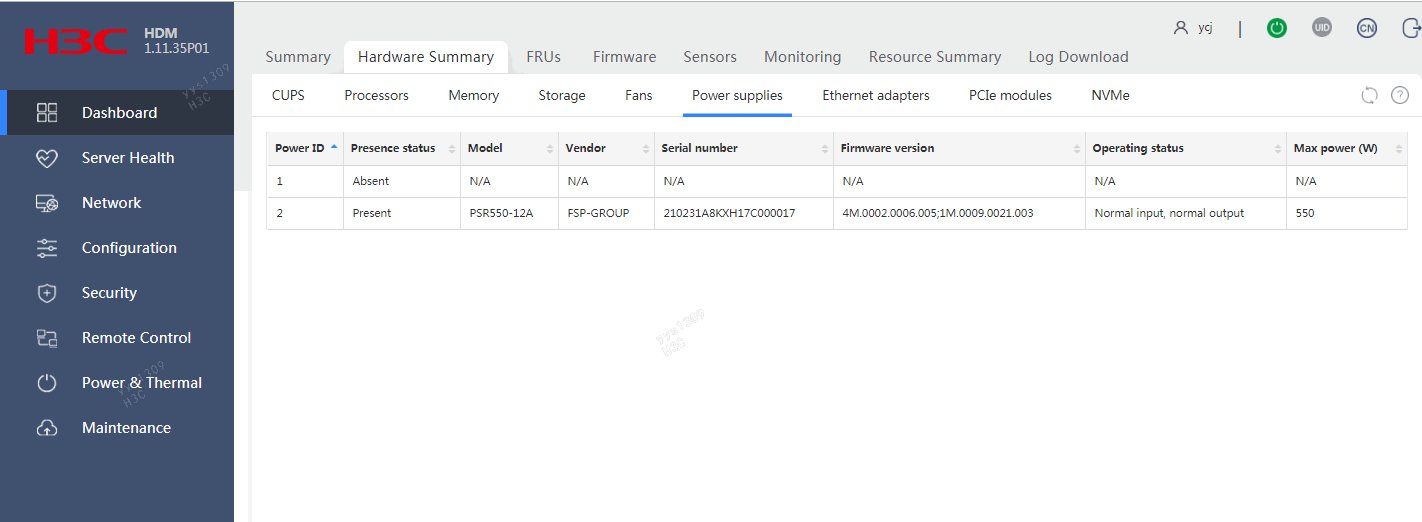
View power supply information
Restrictions and guidelines
This feature is available only for the R2700, R2900, R4300, R4700, R4900, R4950, R6700, R6900, R8900, and X10000 servers.
Procedure
1. In the navigation pane, select Dashboard >Hardware Summary.
2. Click the Power supplies tab to view information about power supplies, including ID, presence status, model, their manufacturers (vendors), serial numbers, firmware versions, operating status, and maximum input power, as shown in Figure 20.
Figure 20 Viewing power supply information
View Ethernet adapter information
1. In the navigation pane, select Dashboard >Hardware Summary.
2. Click the Ethernet adapters tab to view Ethernet adapter information, as shown in Figure 21.
Figure 21 Viewing Ethernet adapter information
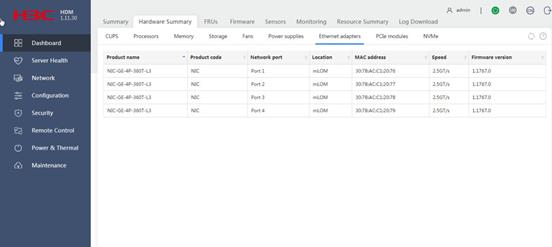
Parameters
· Product name: Model of the Ethernet adapter.
· Product code: Type of the Ethernet adapter.
· Network port: Network port on the Ethernet adapter.
· Location: Physical location of the Ethernet adapter.
· MAC address: MAC address of the network port.
· Speed: Link speed of the network port.
· Firmware version: Firmware version of the Ethernet adapter.
View PCIe module information
1. In the navigation pane, select Dashboard >Hardware Summary.
2. Click the PCIe modules tab to view PCIe module information, as shown in Figure 22.
Figure 22 Viewing PCIe module information
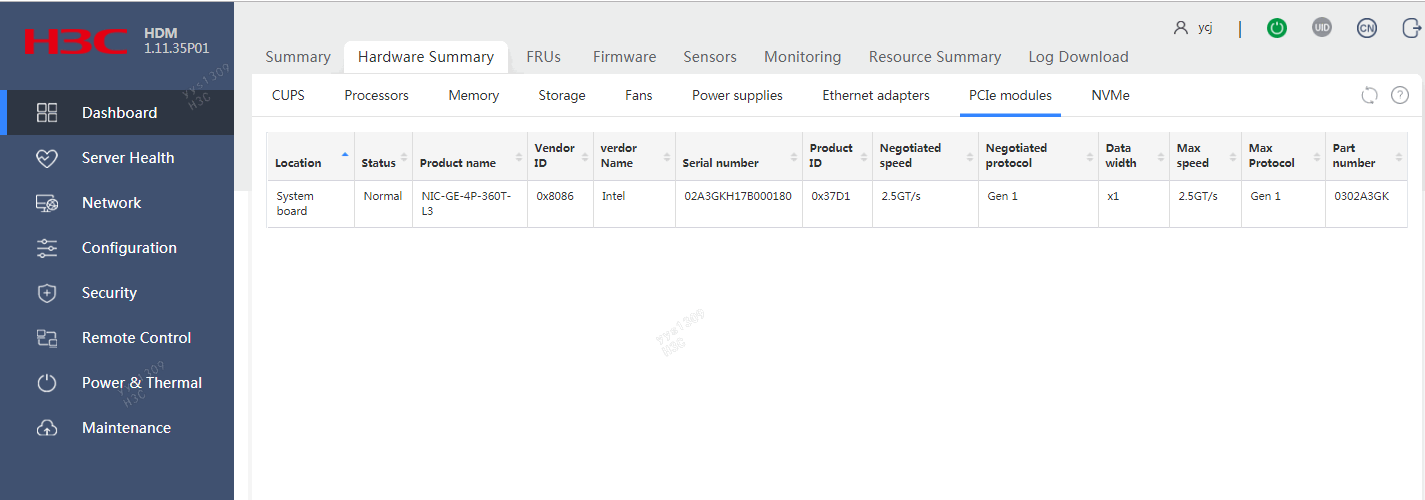
Parameters
· Location: Physical location of the PCIe module.
· Status: PCIe module status, including Normal, Abnormal, and Absent.
· Slot: Slot number. For information about the slot location, see the user guide for the server.
· Product name: Model of the PCIe module.
· Vendor ID: ID of the module's manufacturer.
· Vendor name: Name of the module's manufacturer.
· Serial number: Unique product code assigned by the manufacturer. This field displays N/A if HDM fails to obtain the serial number.
· Product ID: Product ID assigned by the manufacturer.
· Negotiated speed: Auto-negotiated PCIe link rate.
· Negotiated protocol: Auto-negotiated generation of the PCIe standard.
· Negotiated link width: Auto-negotiated link width of the PCIe module.
· Max speed: Maximum link rate.
· Supported latest protocol: Supported latest generation of the PCIe standard.
· Part number—Part number of the PCIe module, which corresponds to the model of the PCIe module. This field displays N/A if HDM fails to obtain the part number.
View NVMe drive information
1. In the navigation pane, select Dashboard > Hardware Summary.
2. Click the NVMe tab to view NVMe drive information, as shown in Figure 23.
Figure 23 Viewing NVMe drive information
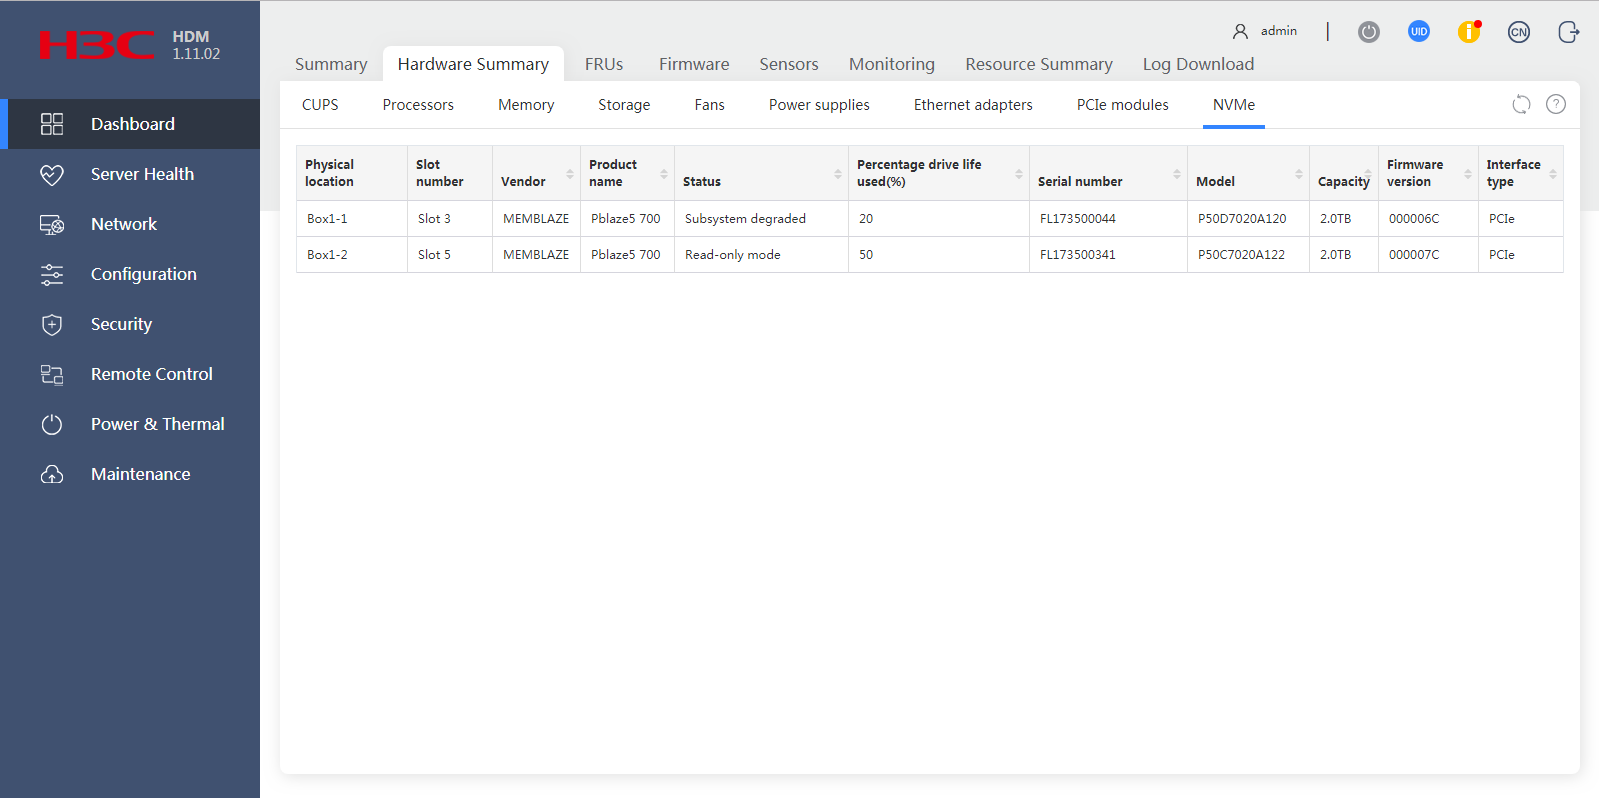
Parameters
· Physical location—NVMe drive backplane number and NVMe drive slot number.
The NVMe drive backplane number is available only for U.2 NVMe drives connected to some NVMe drive backplanes in some servers, as shown in Table 8. For any other NVMe drives, this field displays only the NVMe drive slot number.
|
Server model |
NVMe drive vendor |
Drive backplane model |
|
· H3C UniServer R2900 G3 · H3C UniServer R4900 G3 |
· Intel · HGST · Samsung · Memblaze |
· RS33B08SN4 · RS31B24SN · RS33B12LN1 |
|
H3C UniServer R4700 G3 |
· RS33B08SN5 · RS33B02SN2 |
|
|
H3C UniServer R2700 G3 |
· RS33B08SN6 · RS33B02SN2 |
· Slot number—Slot number of the NVMe drive or PCIe slot number assigned to the drive by the system.
· Vendor—Manufacturer of the NVMe drive.
· Product name—Product name of the NVMe drive.
· Status—NVMe drive status:
¡ Normal—The NVMe drive is operating correctly.
¡ Spare space below threshold—The available space in the NVMe drive has fallen below the threshold.
¡ Temperature anomaly—The NVMe drive temperature is above the upper threshold or below the lower threshold.
¡ Subsystem degraded—The NVMe subsystem reliability has been degraded because of storage media or internal errors.
¡ Read-only mode—The NVMe drive has been placed in read only mode.
¡ Cache failed—The volatile memory backup device has failed.
· Percentage drive life used—Estimate of the percentage of NVMe subsystem life used. The value can be greater than 100.
· Serial number—Serial number of the NVMe drive.
· Model—Model of the NVMe drive.
· Capacity—Capacity of the NVMe drive.
· Firmware version—Firmware version of the NVMe drive. This field displays N/A if HDM does not support displaying the firmware version of the NVMe drive.
· Interface type—Interface type of the NVMe drive.
FRUs
The FRUs menu displays the factory information coded in hardware about the field replaceable units.
View factory information about FRUs
Restrictions and guidelines
The tab for an FRU type is available only if a minimum of one FRU of that type is installed.
Procedure
1. In the navigation pane, select Dashboard > FRUs.
2. In the work pane, navigate to the FRU tab to view factory information about the server and the FRU, including the product name, asset tag, server type, chassis number, and number of MAC addresses, as shown in Figure 24.
Figure 24 Viewing FRU information
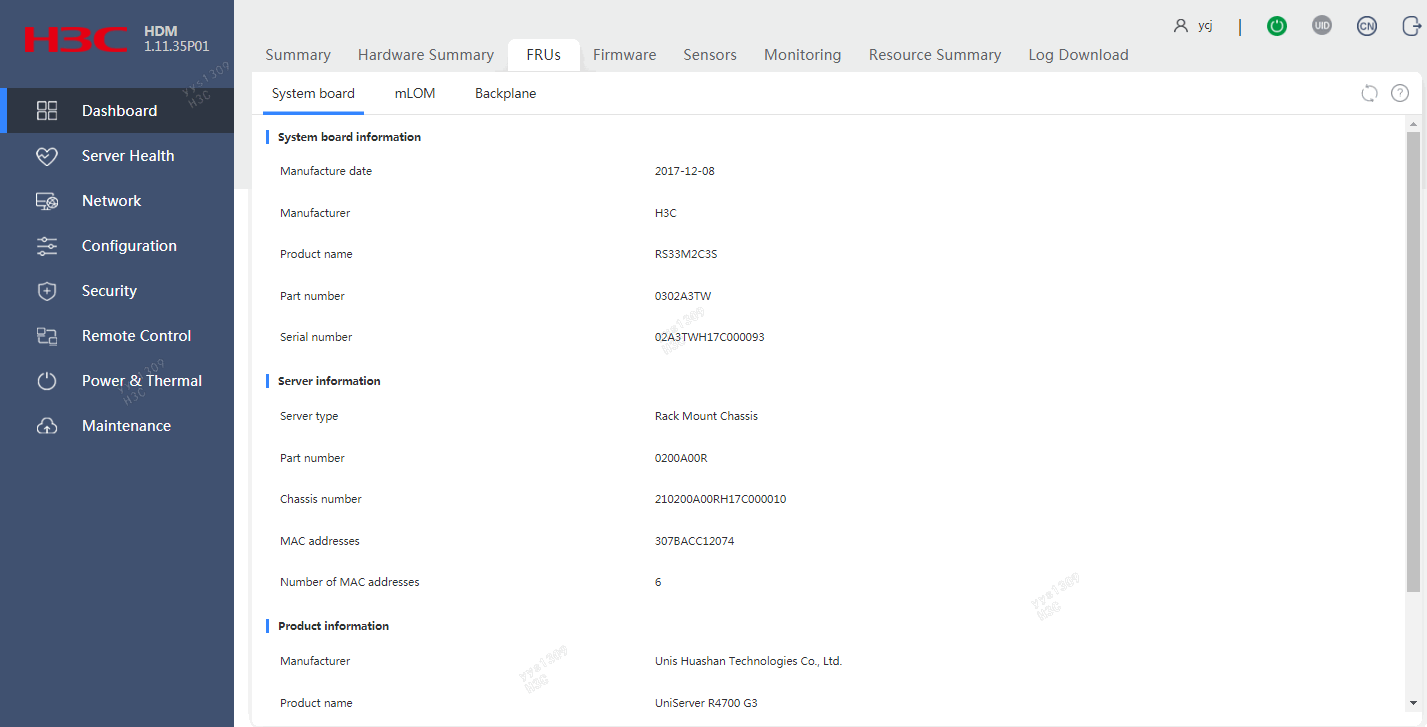
Parameters
Asset tag: Asset tag of the server. The asset tag can contain only letters, digits, spaces, and the following special characters:` ~ ! @ # $ % ^ & * ( ) _ + - = [ ] { } | ; ' : \ " , . / < > ?
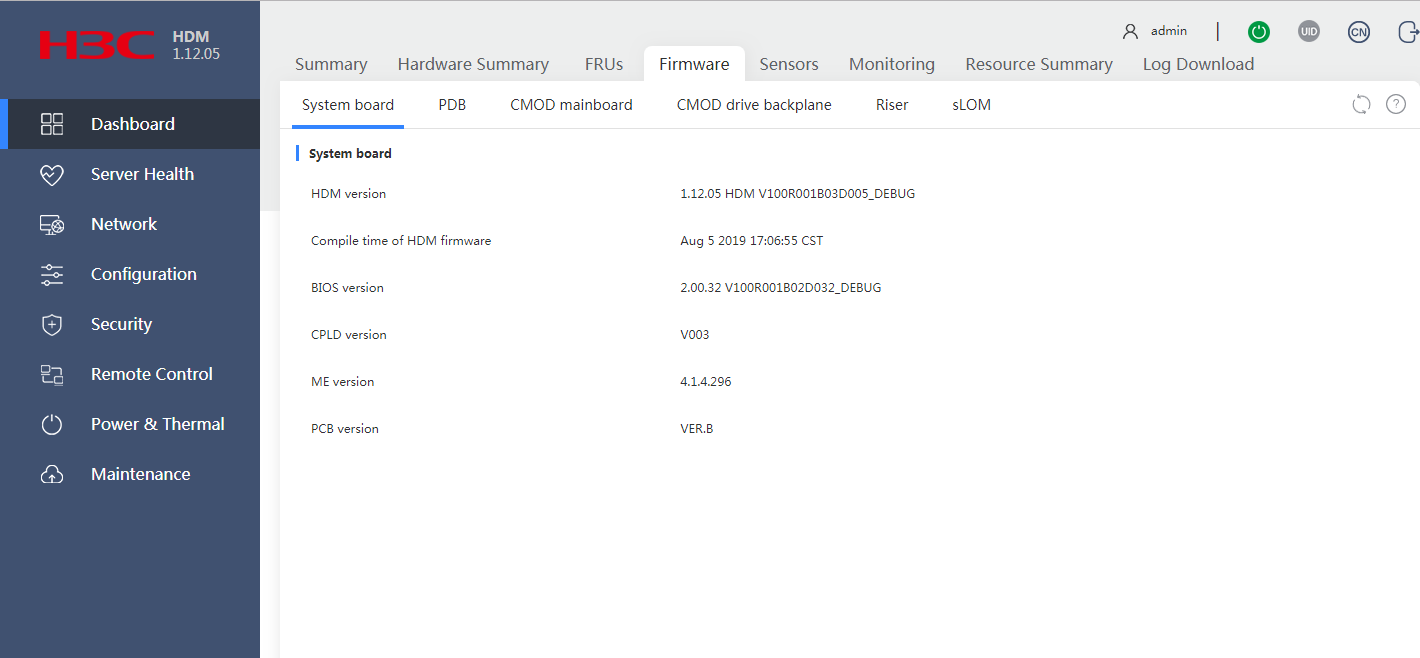
Firmware
Information displayed on the Firmware menu varies by server model. Use Table 9 to determine the components whose firmware information can be displayed.
Table 9 Supported components for firmware information display
|
Server models |
Components |
|
· H3C UniServer R2700 G3 · H3C UniServer R2900 G3 · H3C UniServer R4300 G3 · H3C UniServer R4700 G3 · H3C UniServer R4900 G3 · H3C UniServer R4950 G3 · H3C UniStor X10000 G3 |
· System board. · Diagnostic panel. · Drive backplanes. · Drive expander modules. |
|
H3C UniServer R6700 G3 |
· System board. · Diagnostic panel. · Drive backplanes. · Processor mezzanine board. |
|
H3C UniServer R6900 G3 |
· System board. · Diagnostic panel. · Drive backplanes. · Drive expander modules. · PDB. · CMOD mainboards. · Rear riser cards. · CMOD riser cards. |
|
H3C UniServer R8900 G3 |
· System board. · Diagnostic panel. · PDB. · CMOD drive backplane. · CMOD mainboards. · Rear riser cards. · CMOD riser cards. · sLOM Ethernet adapters. |
|
· AE100 · H3C UniServer B5700 G3 · H3C UniServer B5800 G3 · H3C UniServer B7800 G3 |
System board. |
Identify firmware information
Restrictions and guidelines
The tab for the system board or diagnostic panel is available only if the board or panel is installed.
Procedure
In the navigation pane, select Dashboard > Firmware, as shown in Figure 25.
Figure 25 Viewing firmware information (for the R8900)
Sensors (for the R2700, R2900, R4700, and R4900)
The Sensors menu displays data collected by each sensor in the system. You can use the sensor data to monitor the health state of the server and identify the cause when the system health deteriorates.
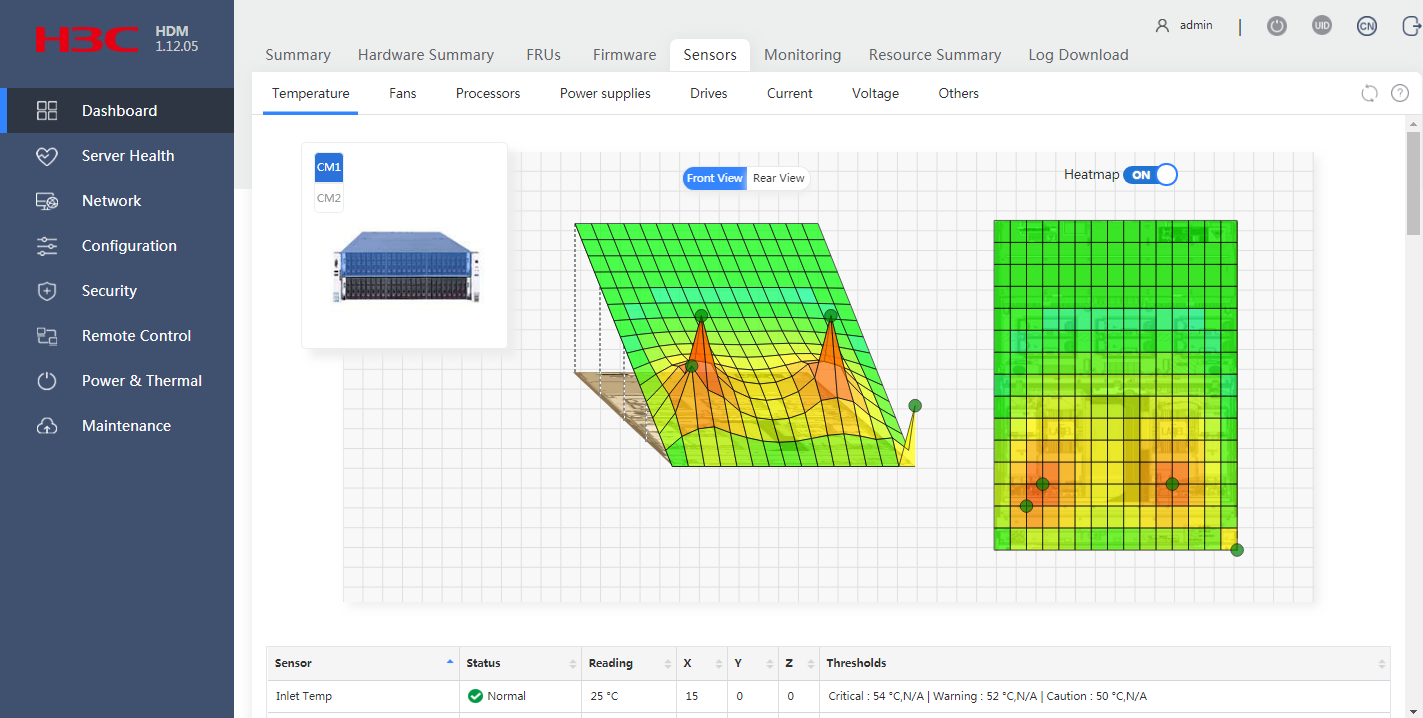
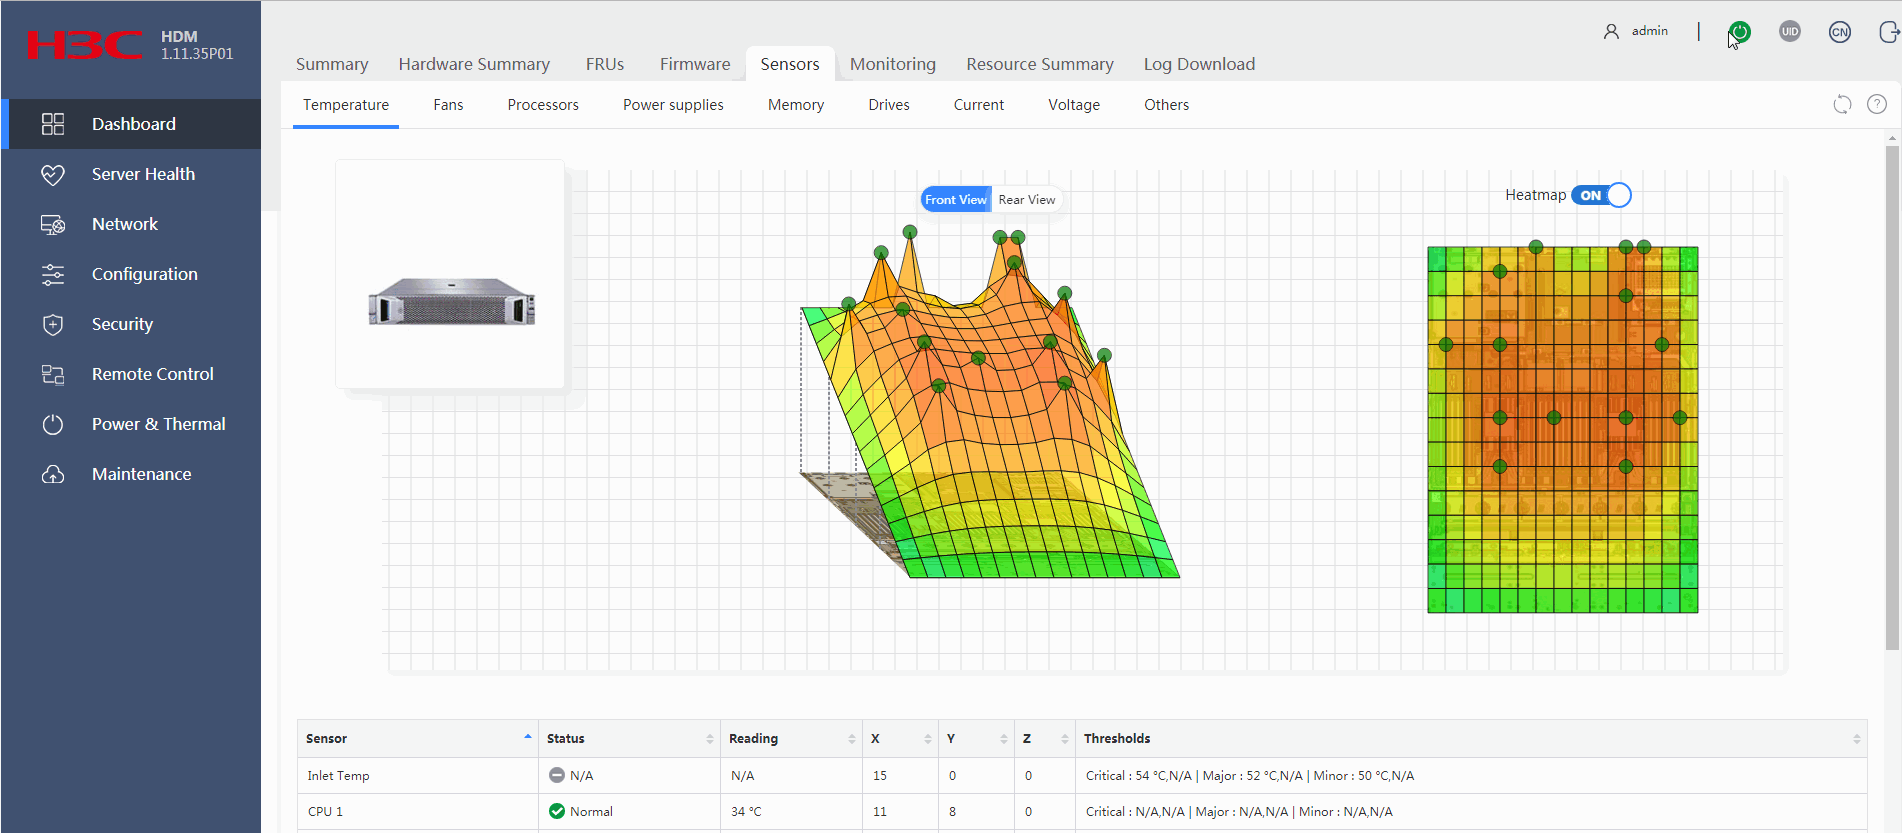
View status and temperature readings of temperature sensors
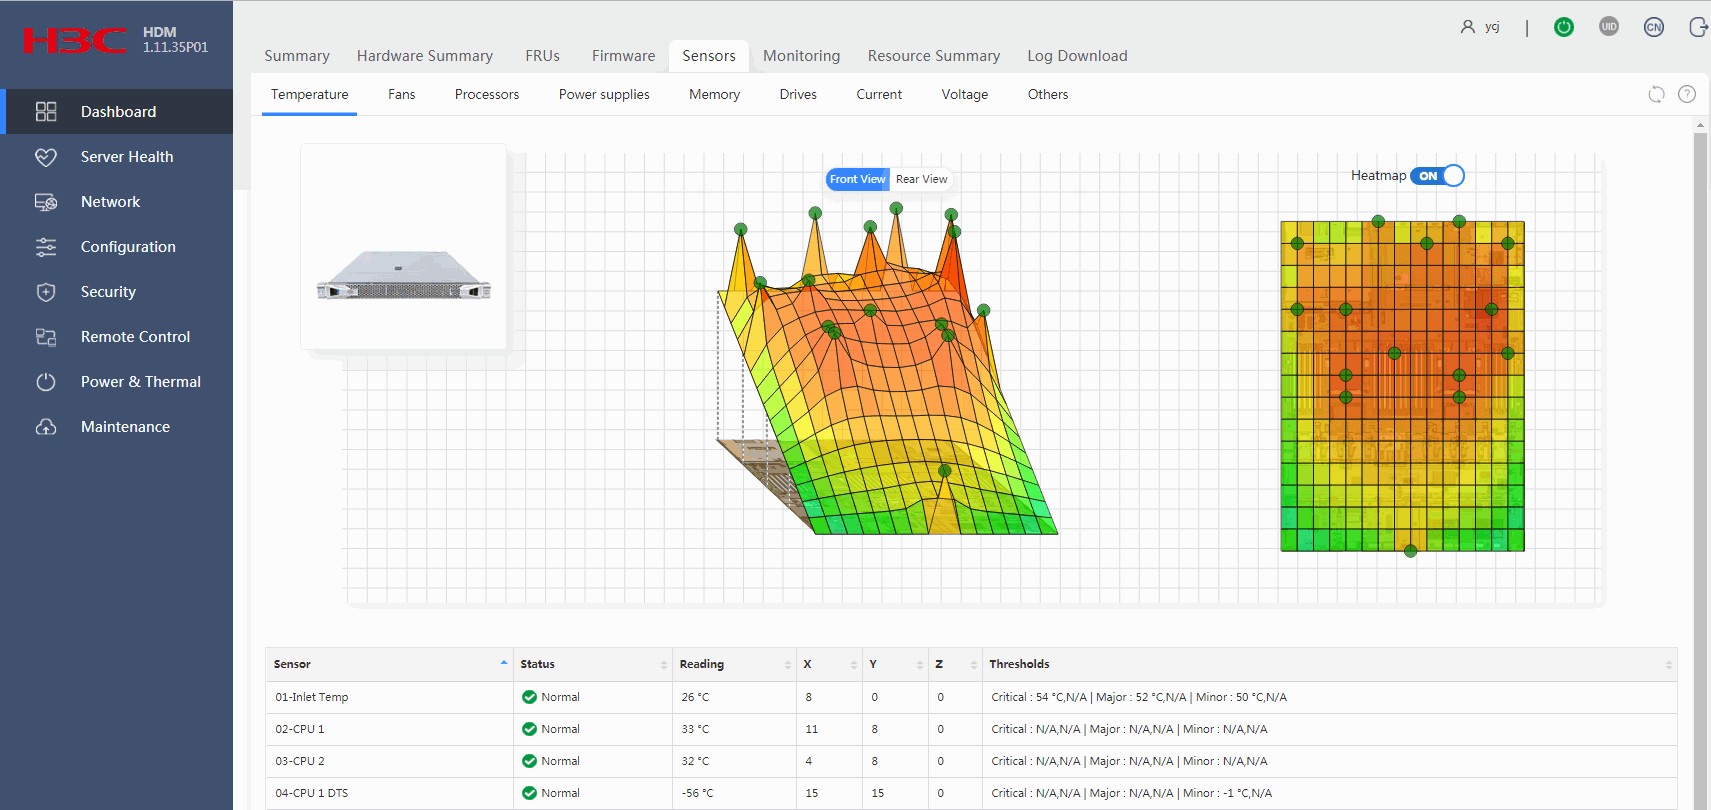
HDM presents temperature data in both heatmap and table formats to help you monitor the cooling performance of the server.
· The temperature heatmaps use colors between green and red to show the temperature distribution inside the server chassis in 3D view and uses circles to represent sensors. Green indicates 0°C (32°F). As the temperature gets higher, the color gets warmer until it changes to red. With the temperature heatmaps, you can quickly identify the component that is in a poor cooling condition.
· The temperature sensor table displays the temperature reading, status, and coordinates of each sensor.
Restrictions and guidelines
The temperature heatmaps do not display sensors whose reading is negative.
Procedure
1. In the navigation pane, select Dashboard > Sensors.
2. In the work pane, click the Temperature tab, as shown in Figure 26.
3. To obtain the name, status, and reading of the sensor at a location, hover the mouse over the circle at that location on a temperature heatmap.
Figure 26 Viewing temperature sensor information
Parameters
· Status: Temperature status of a component:
¡ Normal—The temperature is normal, between the lower and upper minor thresholds (exclusive). No action is required.
¡ Minor—The temperature is between the lower major threshold (exclusive) and lower minor threshold (inclusive) or between the upper minor threshold (inclusive) and upper major threshold exclusive). Administrative attention is required.
¡ Major—The temperature is between the lower critical threshold (exclusive) and lower major threshold (inclusive) or between the upper major threshold (inclusive) and upper critical threshold (exclusive). Immediate action is required.
¡ Critical—The temperature is equal to or below the lower critical threshold, or it is equal to or above the upper critical threshold. Immediate action is required.
¡ N/A—The monitored component is not installed or the temperature sensor cannot be read.
· Reading: Current temperature. If HDM fails to obtain the sensor reading, this field displays N/A.
· X: Location of the sensor on the X axis.
· Y: Location of the sensor on the Y axis.
· Z: Server in which the sensor is located. The value 0 indicates the current server.
· Thresholds: Temperature thresholds:
¡ Critical—Lower and upper critical thresholds. When the temperature reaches either threshold, the server might automatically shut down to avoid damage to its components.
¡ Major—Lower and upper major thresholds. If the temperature reaches either threshold, server performance will significantly degrade.
¡ Minor—Lower and upper minor thresholds. If the temperature reaches either threshold, server performance will slightly degrade.
If a threshold is not specified, N/A is displayed.
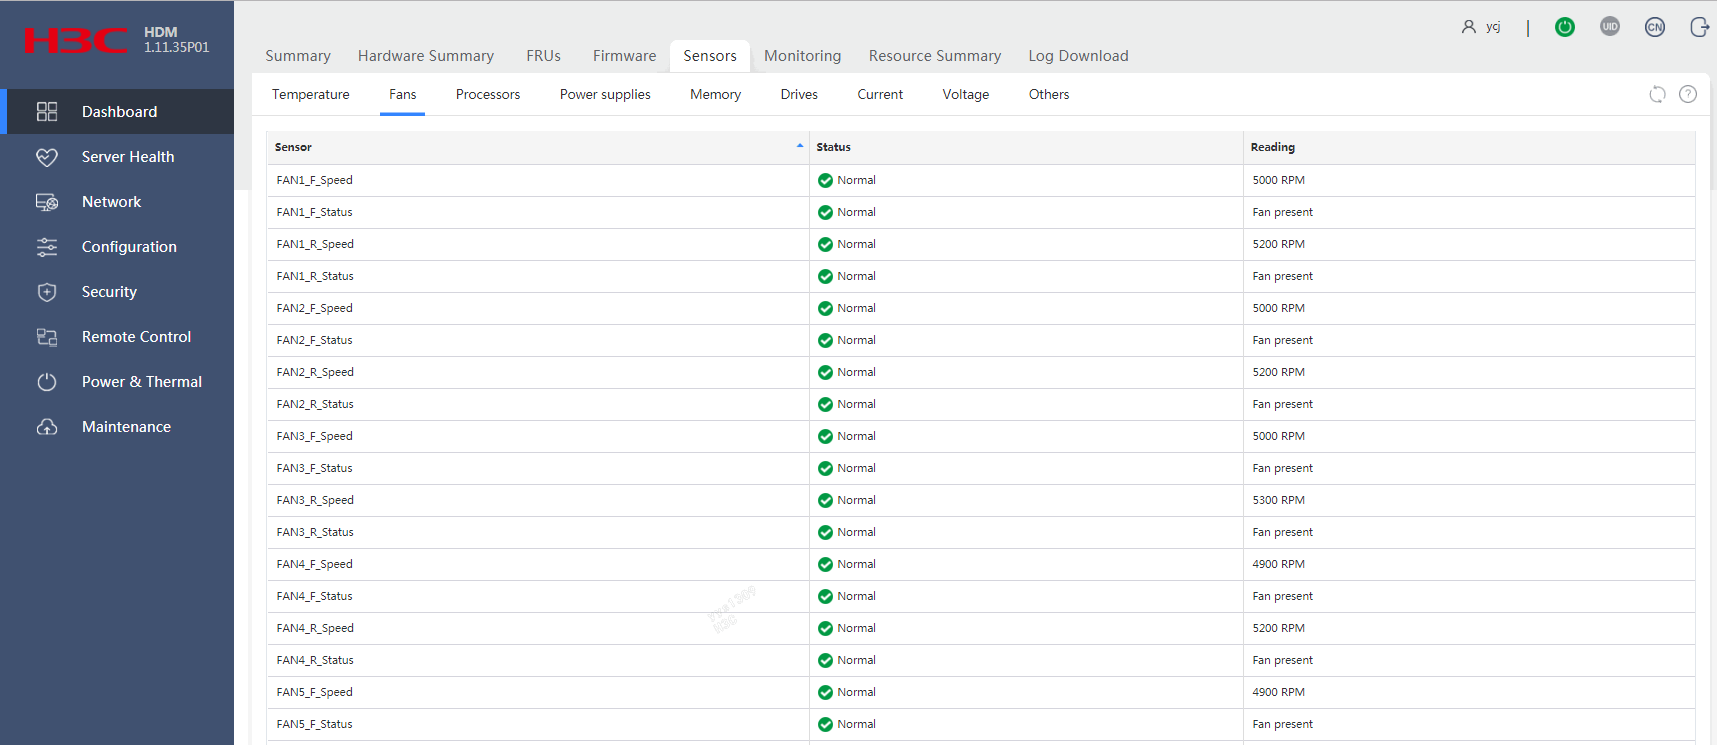
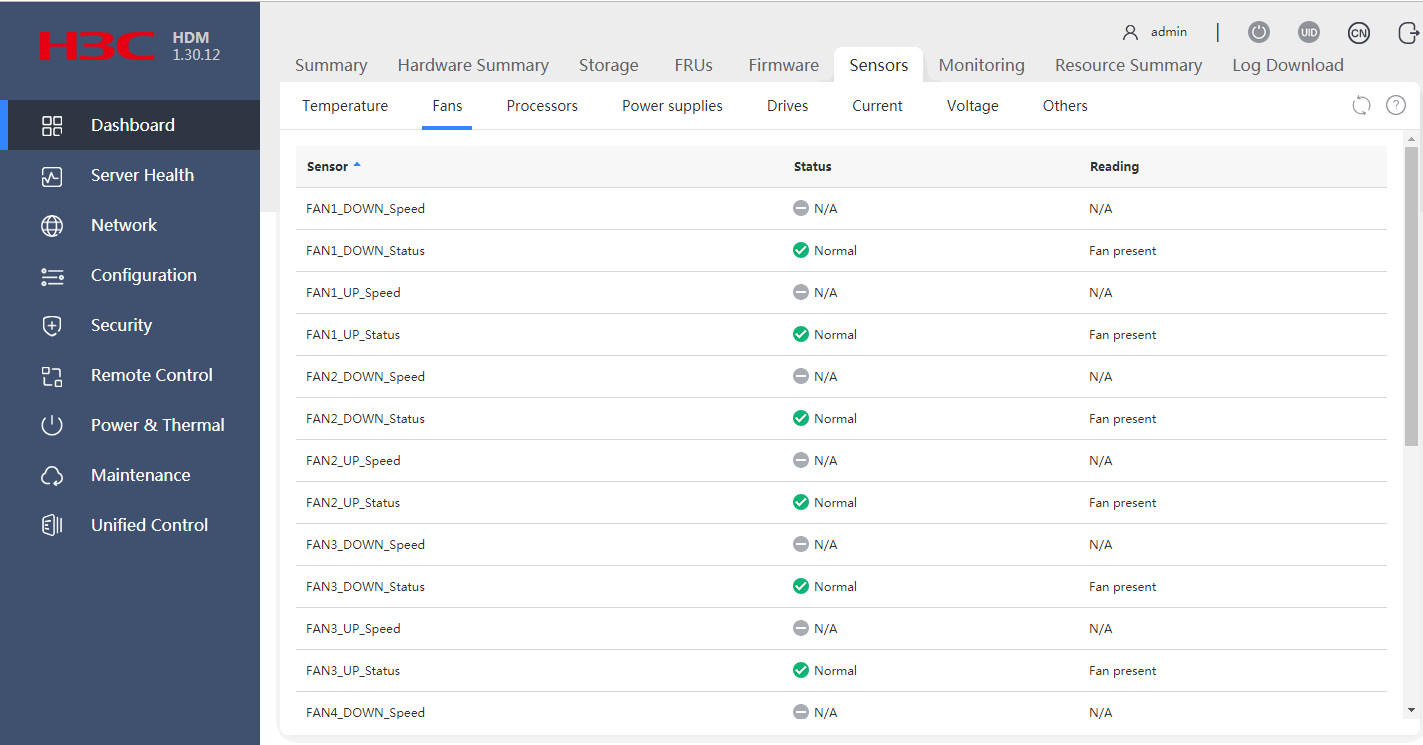
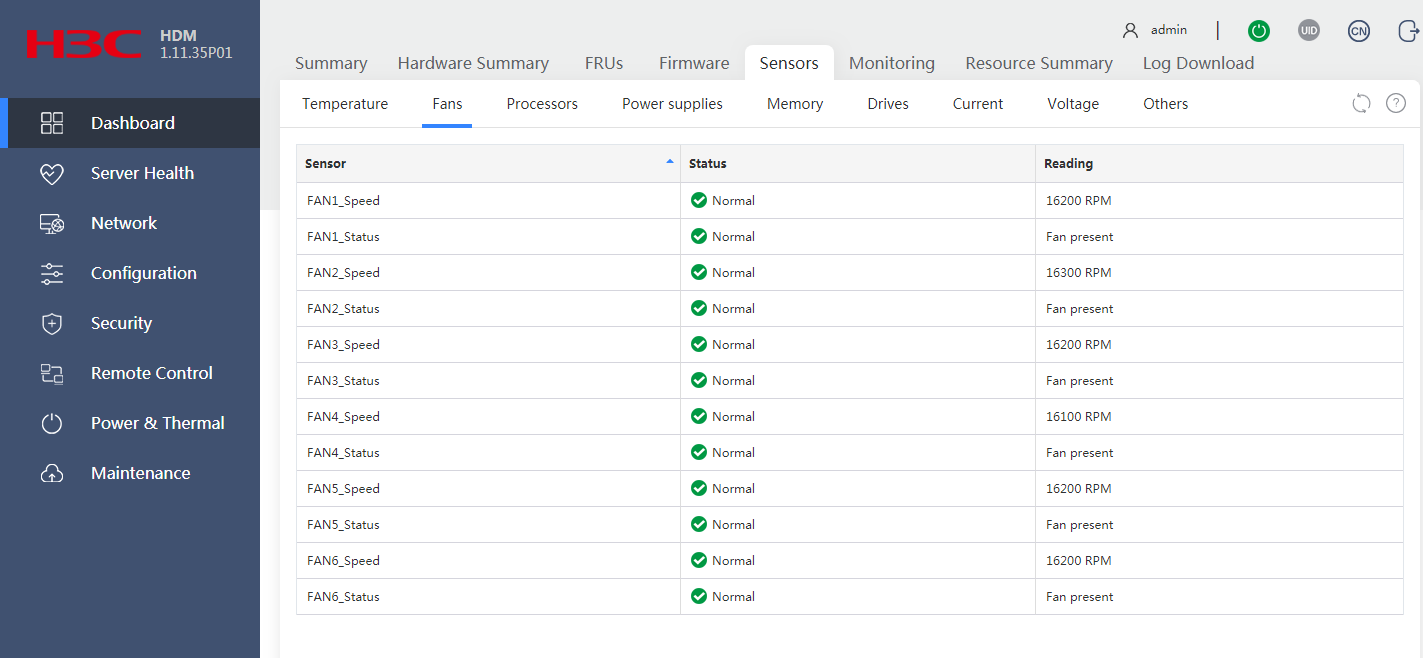
View status and speed of each fan
Each fan has a status sensor and a speed sensor, which are named FANnumber_Status and FANnumber_Speed, respectively. The number argument represents the number of the fan.
Procedure
1. In the navigation pane, select Dashboard > Sensors.
2. Click the Fans tab to view running status and rotation speed (in RPM) of each fan, as shown in Figure 27.
Figure 27 Viewing running status and rotation speed of each fan
Parameters
FANnumber_Status sensors
· Status: Running status of the fan:
¡ Normal—The fan is operating correctly.
¡ Minor—Fan rotation speed has undesirably slowed down, or the fan is absent or installed incorrectly.
· Reading: Operating status of the fan.
FANnumber_Speed sensors
· Status: Presence of the fan. Options include:
¡ Normal—The fan is present and operating correctly.
¡ N/A—The fan is absent or a fan rotation anomaly is present.
· Reading: RPM of the fan.
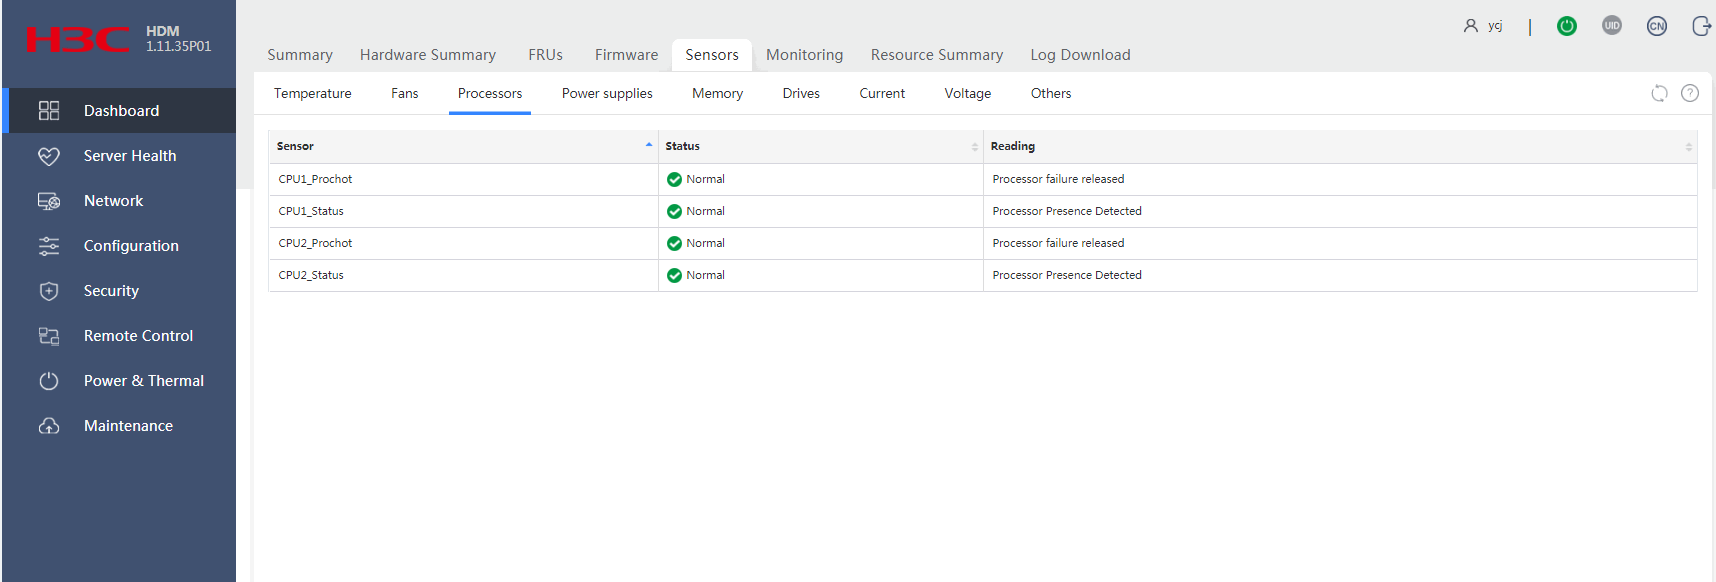
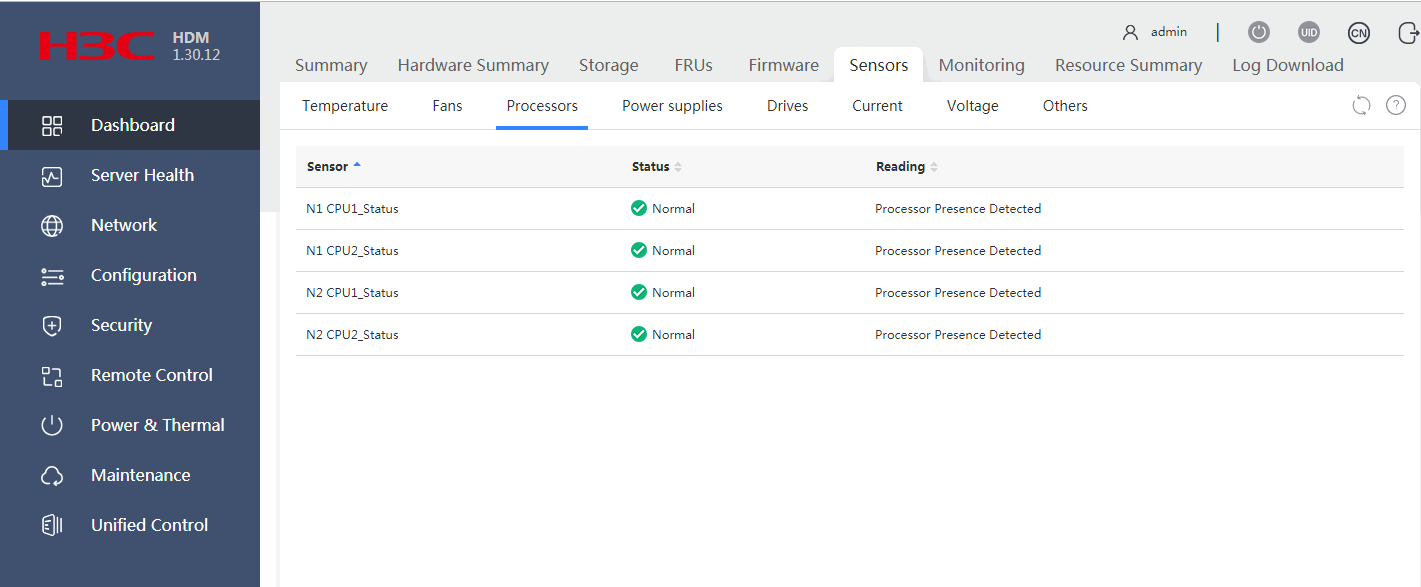
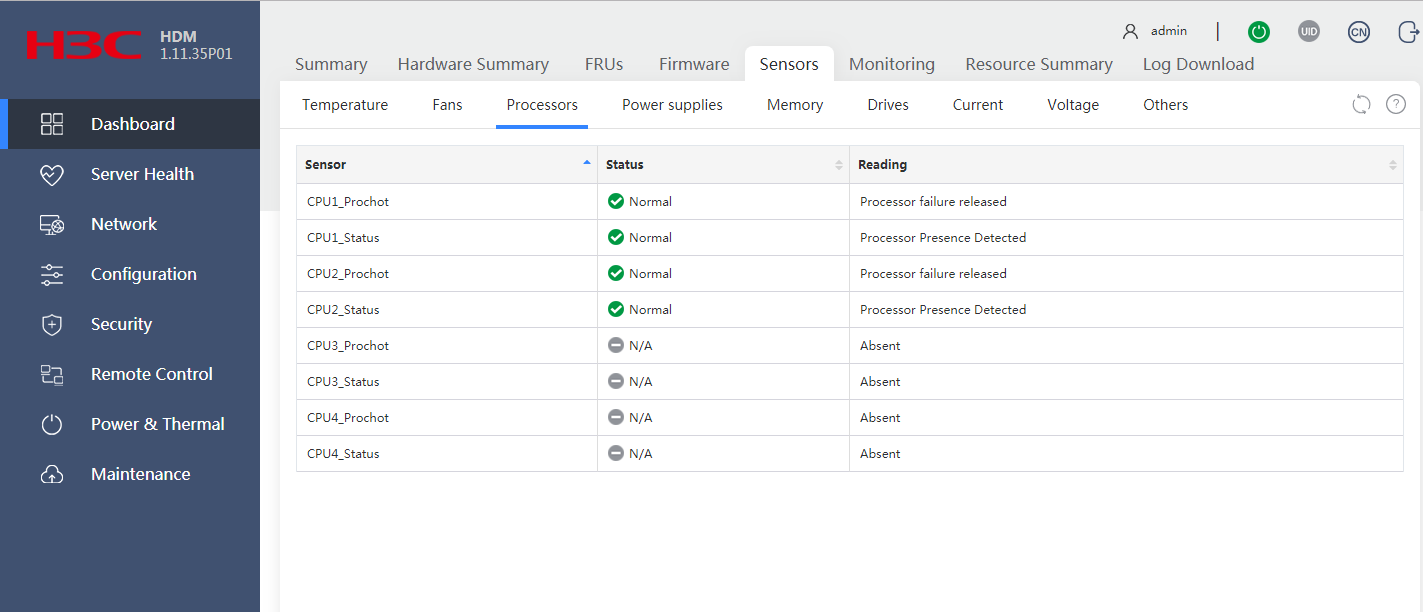
View status of each processor
Each processor has two status sensors, which are named in the formats of CPUnumber_Prochot and CPUnumber_Status, respectively. The number argument represents the number of the processor.
Procedure
1. In the navigation pane, select Dashboard > Sensors.
2. Click the Processors tab to view status of each processor, as shown in Figure 28.
Figure 28 Viewing processor status
Parameters
CPUnumber_Prochot sensors
· Status: PROCHOT alarm status on the processor.
¡ Normal—The processor is present.
¡ Major—A PROCHOT alarm is generated because of high processor temperature. The processor is underclocked if the alarm occurs.
¡ N/A—The processor is absent.
· Reading: Processor sensor reading.
CPUnumber_Status sensors
· Status: Status of the processor.
¡ Normal—The processor is present.
¡ Minor—A recoverable error occurred on the processor.
¡ Critical—An unrecoverable error occurred on the processor, or the temperature of the sensor has exceeded the critical threshold. When the temperature of the sensor exceeds the critical threshold, the server automatically shuts down.
¡ N/A—The processor is absent.
· Reading: Processor sensor reading.
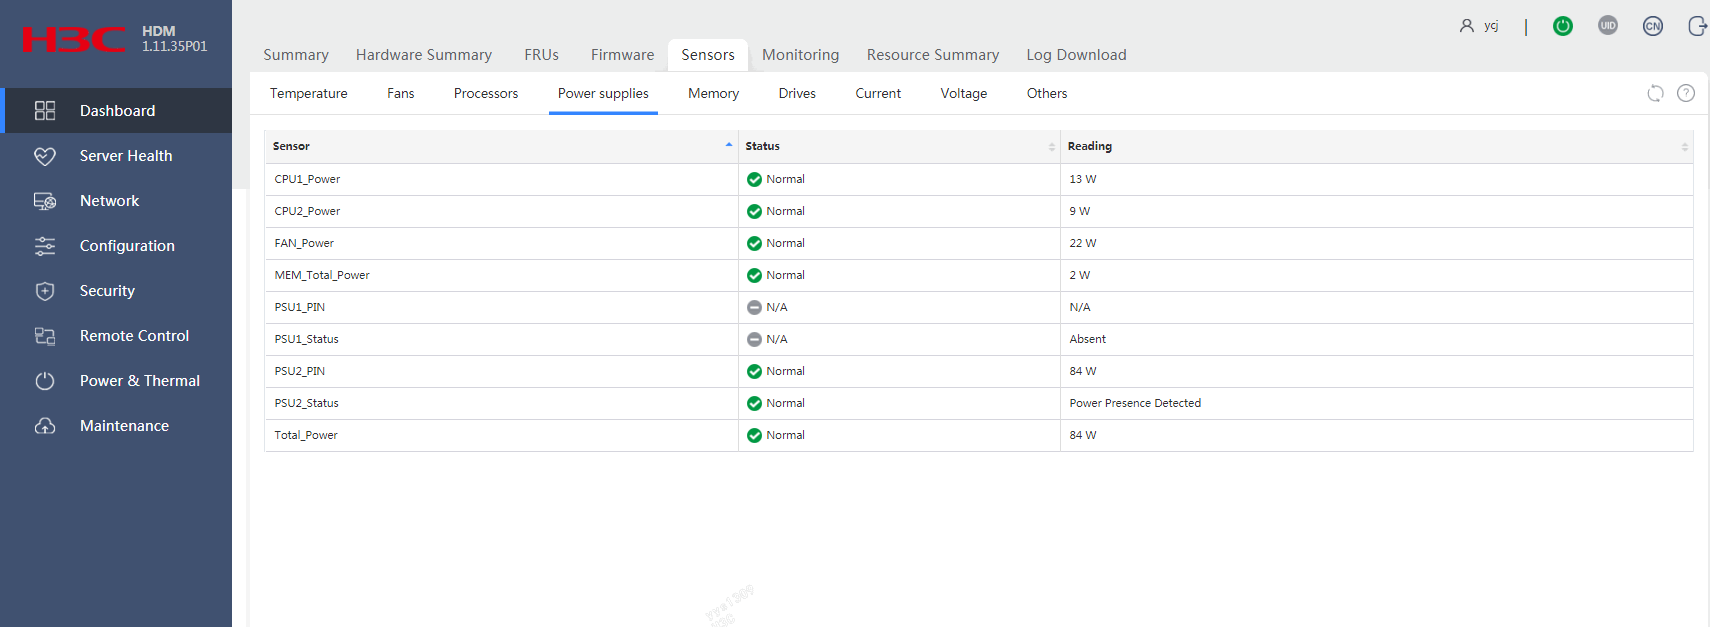
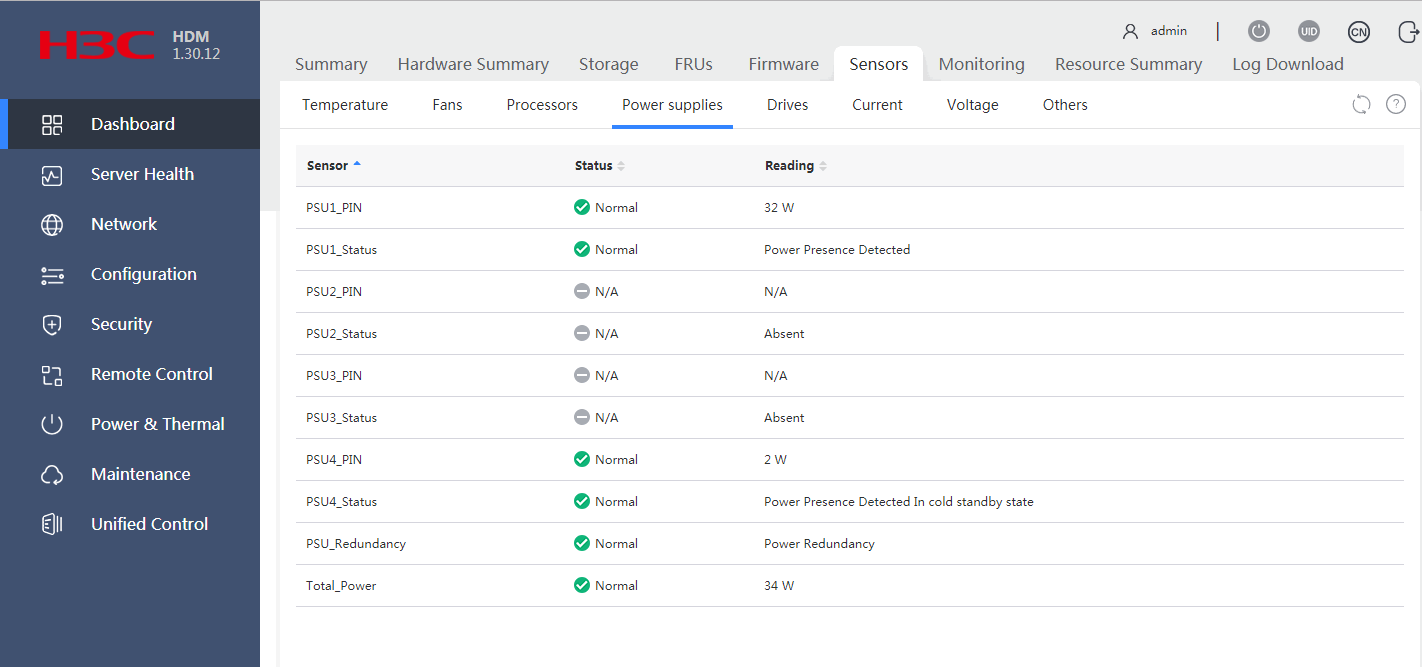
View power supply status
The server provides the following sensors for monitoring the power status of power supplies and the server:
· CPUnumber_Power—Monitors the power status of a processor. The number argument represents the number of the processor.
· FAN _Power—Monitors the power status of present fans.
· MEM_Total_Power—Monitors the power status of present DIMMs.
· PSUnumber_PIN—Monitors the input of a power supply. The number argument represents the number of the power supply.
· PSUnumber_Status—Monitors the running status of a power supply. The number argument represents the number of the power supply.
· PSU_Redundancy—Monitors the status of power supply redundancy.
· Total_Power—Monitors the power status of the server.
Procedure
1. In the navigation pane, select Dashboard > Sensors.
2. Click the Power supplies tab to view status and power input of each power supply and the server, as shown in Figure 29.
Figure 29 Viewing power supply status
Parameters
CPUnumber_Power sensor
· Status: Power status of the processor. Options include:
¡ Normal—The processor is present and the server is powered on.
¡ N/A—The processor is absent or the server is powered off.
· Reading: Current total power of the present processors.
Fan_Power sensor
· Status: Power status of fans. Options include:
¡ Normal—Fans are present and the server is powered on.
¡ N/A—No fan is present or the server is powered off.
· Reading: Current total power of the present fans.
MEM_Total_Power sensor
· Status: Power status of DIMMs. Options include:
¡ Normal—DIMMs are present and the server is powered on.
¡ N/A—No DIMM is present or the server is powered off.
· Reading: Current total power of the present DIMMs.
PSUnumber_PIN sensors
· Status: Power input status of the power supply. Options include:
¡ Normal—Power input is normal.
¡ N/A—No power input exists.
· Reading: Current input power.
PSUnumber_Status sensors
· Status: Running status of the power supply. Options include:
¡ Normal—The power supply is operating correctly or in cold standby state.
¡ Minor—The power supply is in Early warning or Modules not matching state.
¡ Major—The power supply is in one of the following states: Failed, No input, Input beyond the range.
¡ N/A—The power supply is absent.
· Reading: Reading of the power supply status sensor. Options include:
¡ In cold standby state.
¡ Early warning.
¡ Failed.
¡ No input.
¡ Input beyond the range.
¡ Modules not matching.
PSU_Redundancy sensor
· Status: Redundancy status of power supplies. Options include:
¡ Normal—Power supply redundancy is normal.
¡ Minor—Power supply redundancy is lost.
· Reading: Reading of the power supply redundancy sensor. Options include:
¡ Power Redundancy—Two power supplies of the same model are present and operating correctly.
¡ Power Redundancy Lost—A power supply is absent or faulty, or two power supplies are of different models.
Total_Power sensor
· Status: Power input status of the server. Options include:
¡ Normal—Power input of the server is normal.
¡ N/A—Failed to obtain the power input status from the server.
· Reading: Current total input power of the server.
View memory status
The memory sensors monitor the memory modules of processors in the server. The memory sensors are named in the CPU1_DIMM_Anumber or CPU2_DIMM_Bnumber format.
Procedure
1. In the navigation pane, select Dashboard > Sensors.
2. Click the Memory tab to view memory status, as shown in Figure 30.
Figure 30 Viewing memory status
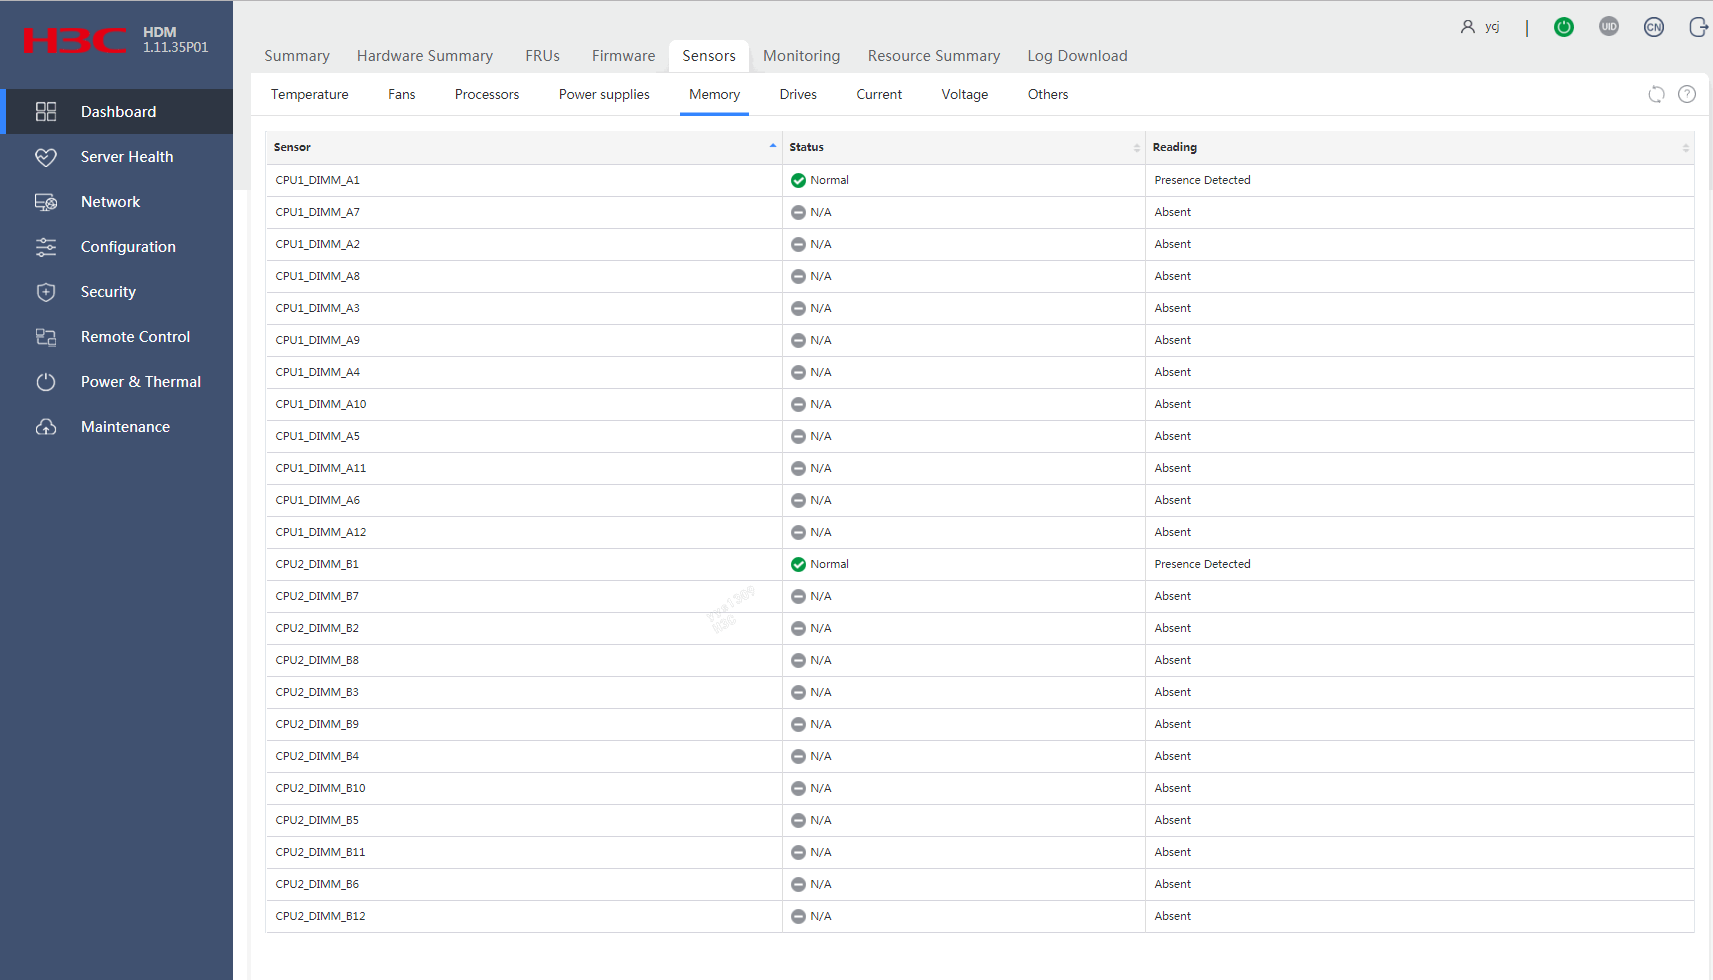
Parameters
· Status: Presence and operating status of memory. Options include:
¡ Normal—No memory error is present.
¡ Absent—Memory is absent.
¡ Minor/Major/Critical—Memory error is present.
· Reading: Reading of the memory sensor.
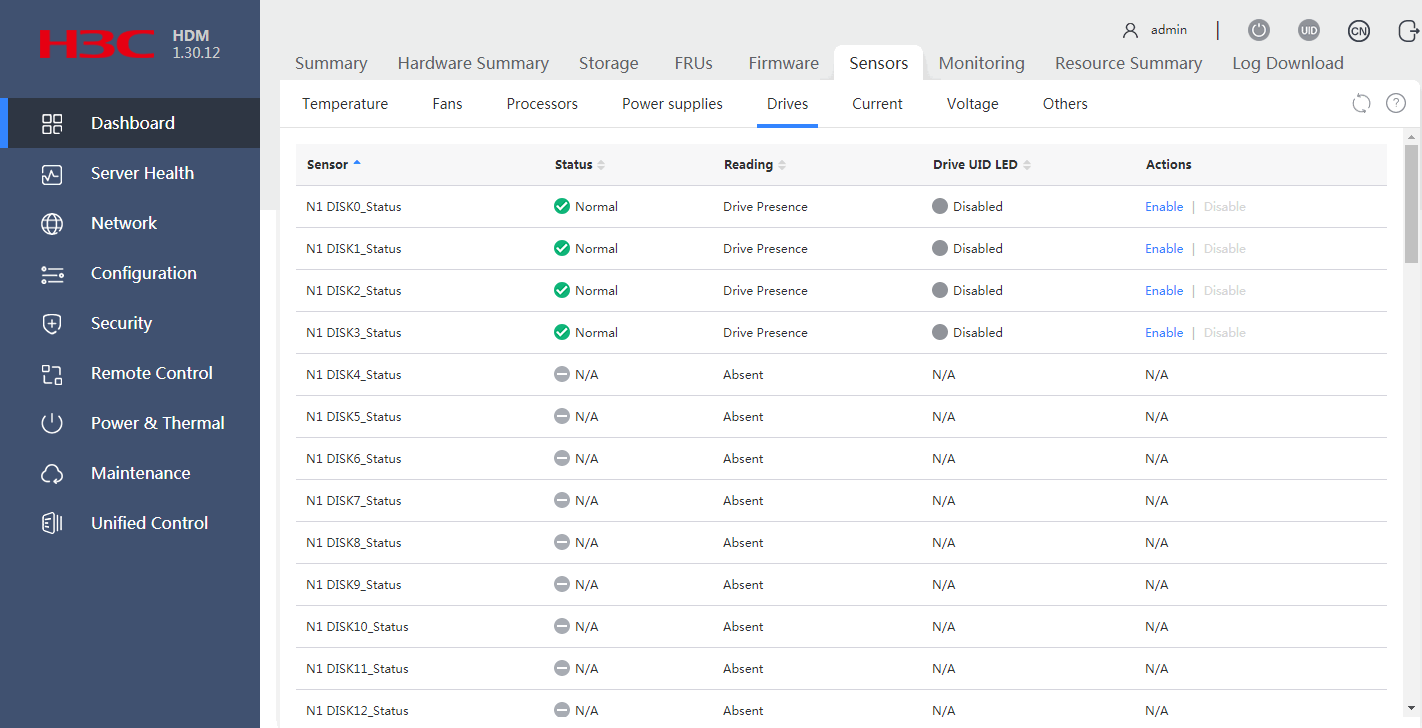
View drive status
Each drive in the server has a drive sensor. The sensor for a drive at the server front is named HDD_Fnumber_Status and the sensor for a drive at the server rear is named HDD_Rnumber_Status.
Restrictions and guidelines
The drive UID LED is unavailable for M.2 drives when the server is powered off.
The drive UID LED is unavailable for a drive if the Fault/UID LED of the drive is steady amber.
Procedure
1. In the navigation pane, select Dashboard > Sensors.
2. Click the Drives tab to view drive status, as shown in Figure 31.
Figure 31 Viewing drive status
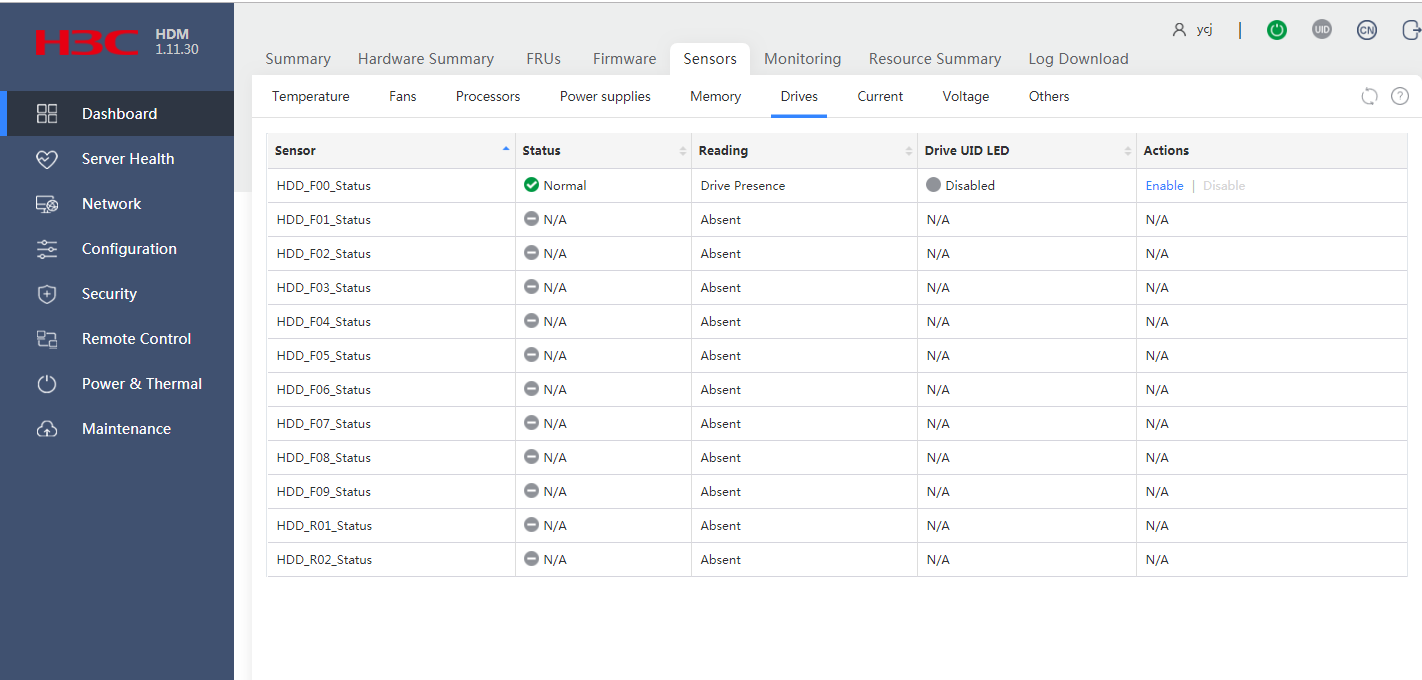
Parameters
· Status: Operating status of the drive. Options include:
¡ Normal—The drive is operating correctly.
¡ N/A—The drive is not present.
¡ Minor/Major/Critical—A drive fault is present. The error code is displayed in the Reading field.
· Reading: Reading of the drive sensor. The available readings are defined in IPMI.
· Drive UID LED: Status of the drive UID LED function. Options include:
¡ Enabled—The drive Fault/UID LED is steady blue for drive locating.
¡ Disabled—The drive Fault/UID LED status varies by drive status.
· Actions: Select whether to enable the drive UID LED function. Options include:
¡ Enable.
¡ Disable.
View status of electrical current
The electrical current sensor (OverCurrent) monitors the electrical current in the server.
Procedure
1. In the navigation pane, select Dashboard > Sensors.
2. Click the Current tab to view electrical current status and readings, as shown in Figure 32.
Figure 32 Viewing electrical current status
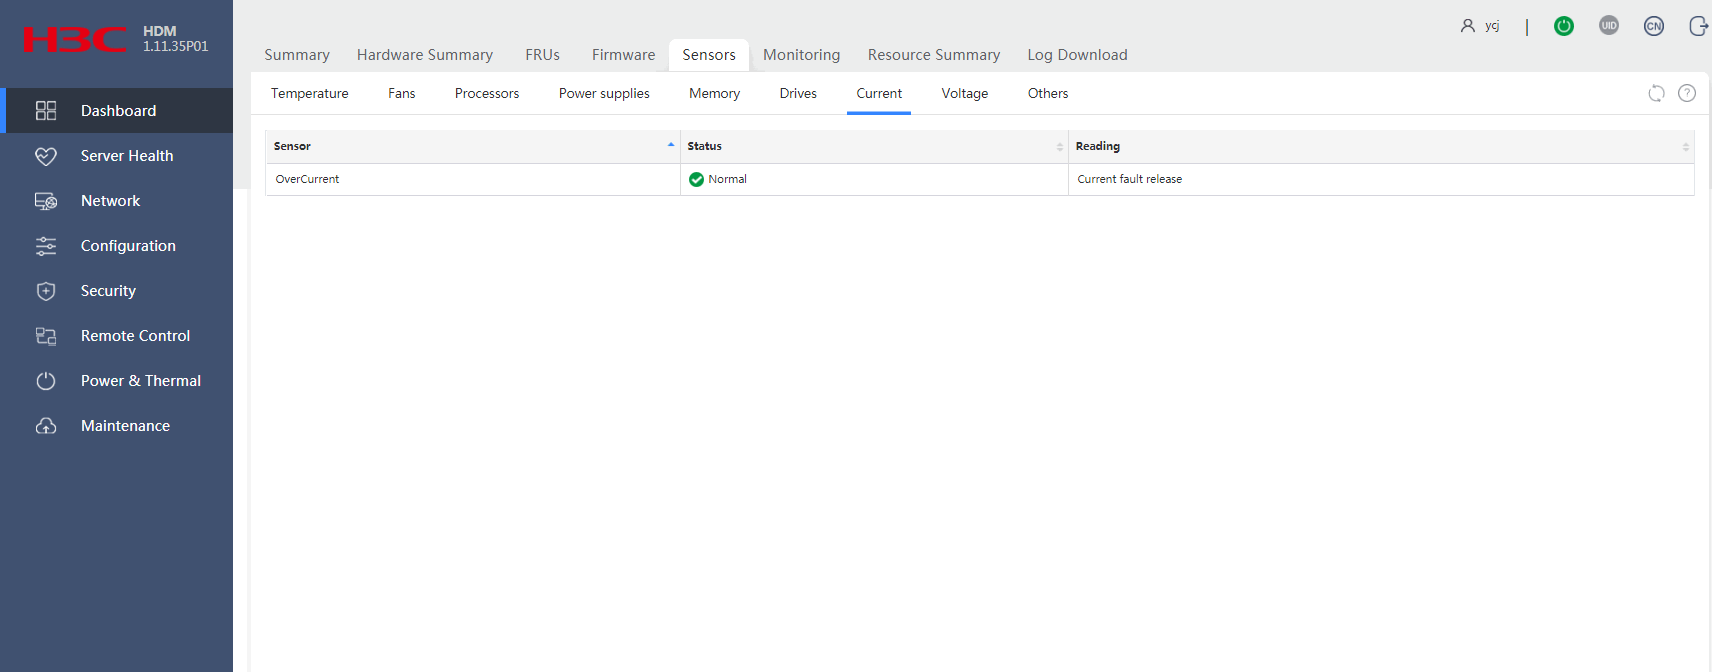
Parameters
· Status: Presence of electrical current fault. Options include:
¡ Normal—No electrical current fault is present.
¡ Major—Electrical current fault is present.
· Reading: Reading of the electrical current sensor.
View status of voltage
The voltage sensors monitor the voltage on each server component.
The following are types of voltage sensors:
· Sensors with a _PG suffix (for example, CPU1_DDR_VPP1_PG). These sensors monitor the components for the presence of voltage faults.
· Sensors without a _PG suffix (for example, CPU1_DDR_VPP1). These sensors monitor the components for voltage threshold crossing events.
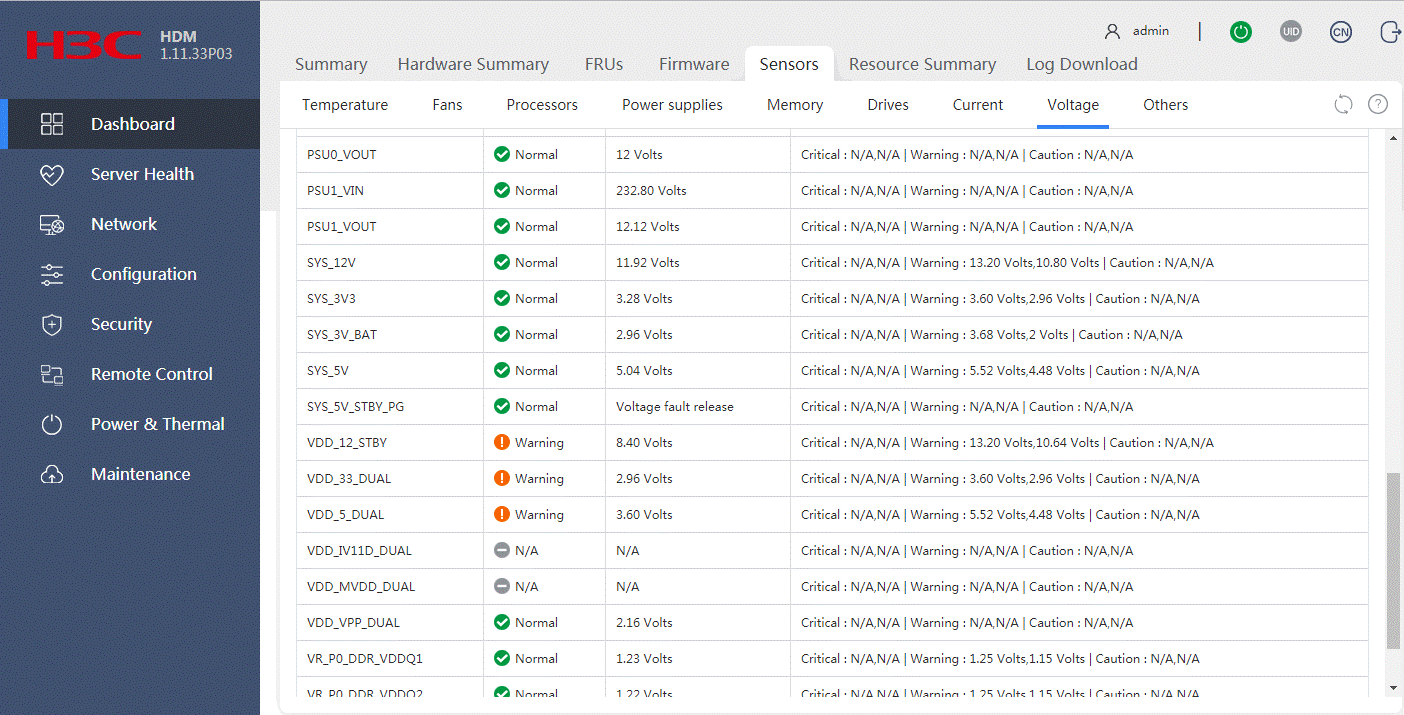
Procedure
1. In the navigation pane, select Dashboard > Sensors.
2. Click the Voltage tab to view voltage status and readings, as shown in Figure 33.
Figure 33 Viewing voltage status
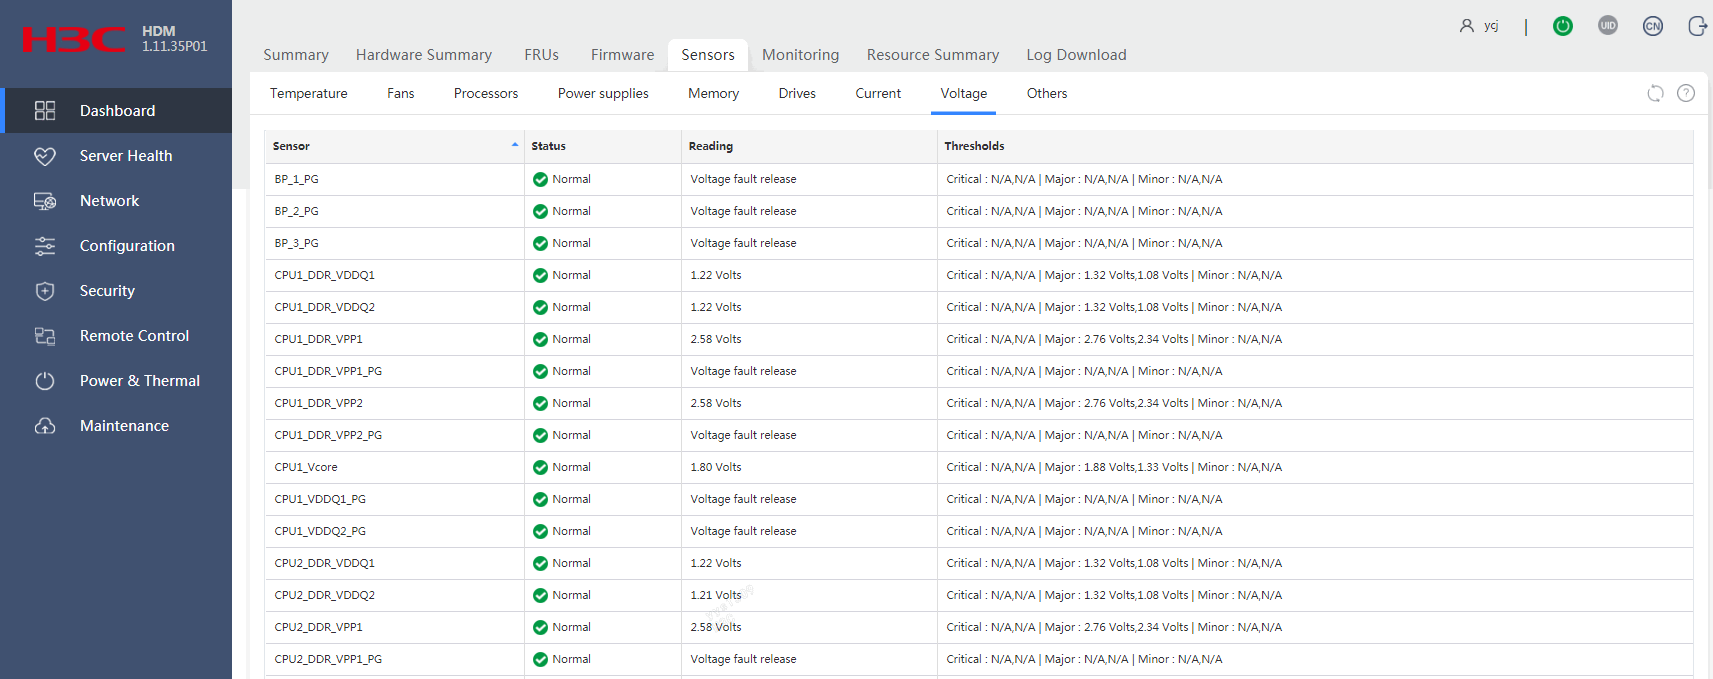
Parameters
Sensors with a _PG suffix
· Status: Presence of voltage fault. Options include:
¡ Normal—No voltage fault is present.
¡ Major—Voltage fault is present.
· Reading: Reading of the voltage sensor. The reading indicates whether a voltage fault is present.
Sensors without a _PG suffix
· Status: Voltage status. Options include:
¡ Normal—The voltage is between the lower minor threshold (exclusive) and upper minor threshold (exclusive).
¡ N/A—The component is absent or the voltage value cannot be obtained.
¡ Major—The voltage exceeds the upper major threshold or drops below the lower major threshold. In this state, server performance degrades significantly.
· Reading: Voltage detected by the sensor. This field displays N/A if the component is absent or the voltage value cannot be obtained.
· Thresholds: Voltage thresholds:
¡ Critical—Lower and upper critical thresholds.
¡ Major—Lower and upper major thresholds.
¡ Minor—Lower and upper minor thresholds.
If a threshold is not specified, N/A is displayed.
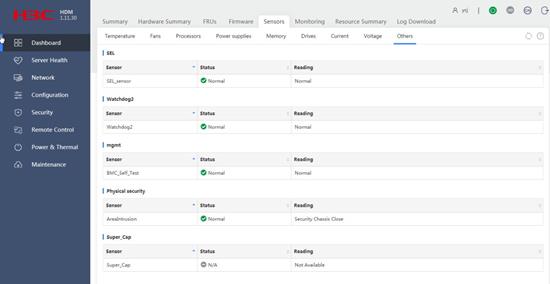
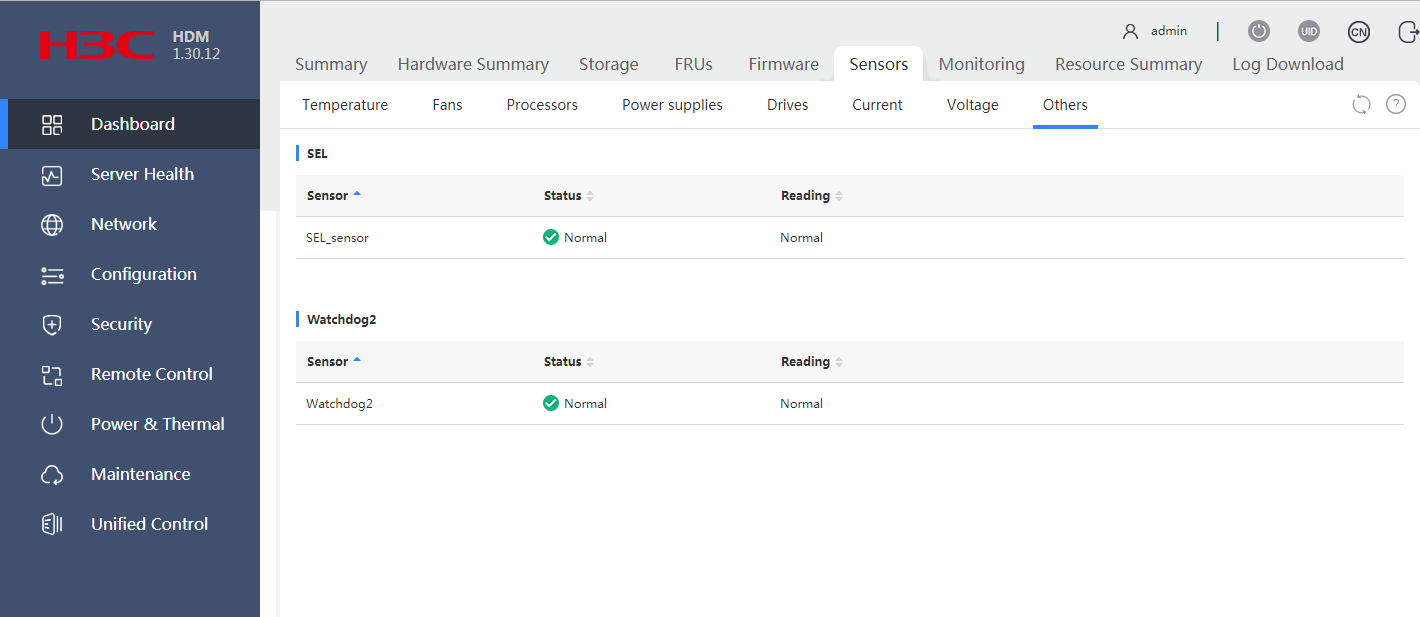
View event log status
The event log sensor (SEL_sensor) monitors status of the event log.
Procedure
1. In the navigation page, select Dashboard > Sensors.
2. In the work pane, click the Others tab, as shown in Figure 34.
3. In the SEL section, view status and reading of the event log sensor.
Figure 34 Viewing event log status

Parameters
· Status: Running status of the event log sensor. Options include:
¡ Normal—The event log is operating correctly or the event log has been cleared or reset.
¡ Minor—The log is full or the number of event log entries has exceeded 75% of the event log size.
· Reading: Reading of the event log sensor.
View operating system status
The operating system sensor (Watchdog2) monitors the operating system (OS) of the server for system crash events and restarts the OS upon detection of an OS crash.
Procedure
1. In the navigation page, select Dashboard > Sensors.
2. In the work pane, click the Others tab, as shown in Figure 35.
3. In the Watchdog2 section, view status and reading of the OS sensor.
Figure 35 Viewing operating system status

Parameters
· Status: Running status of the OS. Options include:
¡ Normal—The server OS is operating correctly.
¡ Minor—Indicates that a timer interruption or timer expiration event has occurred.
¡ Major—Indicates that a power supply hot restart, power-off, or power-cycle operation expired.
· Reading: Reading of the OS sensor.
View FRU status
The FRU sensor (BMC_Self_Test) monitors the status of FRUs in the server.
Restrictions and guidelines
This sensor is available only for the R4700 and R4900.
Procedure
1. In the navigation page, select Dashboard > Sensors.
2. In the work pane, click the Others tab, as shown in Figure 36.
3. In the mgmt section, view status and reading of the FRU sensor.

Parameters
· Status: Running status of the FRUs. Options include:
¡ Normal—All FRUs are operating correctly.
¡ Major—Failed to obtain FRU information or an error has occurred during FRU information check.
· Reading: Reading of the FRU sensor.
View physical security status
The physical security sensor (AreaIntrusion) monitors the server chassis for physical access events. When the chassis is opened, the sensor reports an event log. When the chassis is closed, the sensor does not report.
Procedure
1. In the navigation page, select Dashboard > Sensors.
2. In the work pane, click the Others tab, as shown in Figure 37.
3. In the Physical security section, view physical security status.
Figure 37 Viewing physical security status
Parameters
· Status: Running status of the sensor. Options include:
¡ Normal—The chassis is closed.
¡ Minor—The chassis is opened.
¡ N/A—The chassis-open alarm module is not present.
· Reading: Reading of the physical status sensor.
View supercapacitor status
The supercapacitor sensor (Super_Cap) monitors the status of the supercapacitor for a Mezzanine or standard storage controller. When the supercapacitor is operating incorrectly, the sensor reports an event log.
Procedure
1. In the navigation page, select Dashboard > Sensors.
2. In the work pane, click the Others tab, as shown in Figure 38.
3. In the Super_Cap section, view the supercapacitor status.
Figure 38 Viewing supercapacitor status

Parameters
· Status: Running status of the supercapacitor. Options include:
¡ Normal—The supercapacitor is operating correctly, the supercapacitor is absent, or the supercapacitor status cannot be obtained.
¡ Minor—A predictive error has occurred on the supercapacitor.
¡ Major—The supercapacitor is faulty.
· Reading: Reading of the supercapacitor sensor.
Sensors (for the R6900)
The Sensors menu displays data collected by each sensor in the system. You can use the sensor data to monitor the health state of the server and identify the cause when the system health deteriorates.
View status and temperature readings of temperature sensors
HDM presents temperature data in both heatmap and table formats to help you monitor the cooling performance of the server.
· The temperature heatmaps use colors between green and red to show the temperature distribution inside the server chassis in 3D view and uses circles to represent sensors. Green indicates 0°C (32°F). As the temperature gets higher, the color gets warmer until it changes to red. With the temperature heatmaps, you can quickly identify the component that is in a poor cooling condition.
· The temperature sensor table displays the temperature reading, status, and coordinates of each sensor.
Restrictions and guidelines
The temperature heatmaps do not display sensors whose reading is negative.
Procedure
1. In the navigation pane, select Dashboard > Sensors.
2. In the work pane, click the Temperature tab, and then select a compute module from the upper left corner of the workspace, as shown in Figure 39.
3. To obtain the name, status, and reading of the sensor at a location, hover the mouse over the circle at that location on a temperature heatmap.
Figure 39 Viewing temperature sensor information
Parameters
· Status: Temperature status of a component:
¡ Normal—The temperature is normal, between the lower and upper minor thresholds (exclusive). No action is required.
¡ Minor—The temperature is between the lower major threshold (exclusive) and lower minor threshold (inclusive) or between the upper minor threshold (inclusive) and upper major threshold exclusive). Administrative attention is required.
¡ Major—The temperature is between the lower critical threshold (exclusive) and lower major threshold (inclusive) or between the upper major threshold (inclusive) and upper critical threshold (exclusive). Immediate action is required.
¡ Critical—The temperature is equal to or below the lower critical threshold, or it is equal to or above the upper critical threshold. Immediate action is required.
¡ N/A—The monitored component is not installed or the temperature sensor cannot be read.
· Reading: Current temperature. If HDM fails to obtain the sensor reading, this field displays N/A.
· X: Location of the sensor on the X axis.
· Y: Location of the sensor on the Y axis.
· Z: Number of the compute module in which the server resides. The value 0 indicates that the sensor is shared by both compute modules in the server.
· Thresholds: Temperature thresholds:
¡ Critical—Lower and upper critical thresholds. When the temperature reaches either threshold, the server might automatically shut down to avoid damage to its components.
¡ Major—Lower and upper major thresholds. If the temperature reaches either threshold, server performance will significantly degrade.
¡ Minor—Lower and upper minor thresholds. If the temperature reaches either threshold, server performance will slightly degrade.
If a threshold is not specified, N/A is displayed.
View status and speed of each fan
Each fan has a status sensor and a speed sensor, which are named in the formats of FANnumber_UP/DOWN_Status and FANnumber_UP/DOWN_Speed, respectively. The number argument represents the number of the fan module. The UP and DOWN keywords represent the upper and lower fans in the fan module, respectively.
Procedure
1. In the navigation pane, select Dashboard > Sensors.
2. Click the Fans tab to view running status and rotation speed (in RPM) of each fan, as shown in Figure 40.
Figure 40 Viewing status and speed of each fan
Parameters
FANnumber_UP/DOWN_Status sensors
· Status: Running status of the fan:
¡ Normal—The fan is operating correctly.
¡ Minor—Fan rotation speed has undesirably slowed down, or the fan is absent or installed incorrectly.
· Reading: Operating status of the fan.
FANnumber_UP/DOWN_Speed sensors
· Status: Presence of the fan. Options include:
¡ Normal—The fan is present and operating correctly.
¡ N/A—The fan is absent a fan rotation anomaly is present.
· Reading: RPM of the fan.
View status of each processor
Each processor sensor is named in Nnumber CPUnumber_Status format, where the Nnumber argument represents the number of the compute module (CMOD), and the CPUnumber argument represents the number of the processor.
Procedure
1. In the navigation pane, select Dashboard > Sensors.
2. Click the Processors tab to view status of each processor, as shown in Figure 41.
Figure 41 Viewing processor status
Parameters
· Status: Status of the processor.
¡ Normal—The processor is present.
¡ Minor—A recoverable error occurred on the processor.
¡ Critical—An unrecoverable error occurred on the processor, or the temperature of the sensor has exceeded the critical threshold. When the temperature of the sensor exceeds the critical threshold, the server automatically shuts down.
¡ N/A—The processor is absent.
· Reading: Processor sensor reading.
View power supply status
The server provides the following sensors for monitoring the power status of power supplies and the server:
· PSUnumber_PIN—Monitors the input of a power supply. The number argument represents the number of the power supply.
· PSUnumber_Status—Monitors the running status of a power supply. The number argument represents the number of the power supply.
· PSU_Redundancy—Monitors the status of power supply redundancy.
· Total_Power—Monitors the power status of the server.
Procedure
1. In the navigation pane, select Dashboard > Sensors.
2. Click the Power supplies tab to view status and power input of each power supply and the server, as shown in Figure 42.
Figure 42 Viewing power supply status
Parameters
PSUnumber_PIN sensors
· Status: Power input status of the power supply. Options include:
¡ Normal—Power input is normal.
¡ N/A—No power input exists.
· Reading: Current input power.
PSUnumber_Status sensors
· Status: Running status of the power supply. Options include:
¡ Normal—The power supply is operating correctly or in cold standby state.
¡ Minor—The power supply is in Early warning or Modules not matching state.
¡ Major—The power supply is in one of the following states: Failed, No input, Input beyond the range.
¡ N/A—The power supply is absent.
· Reading: Reading of the power supply status sensor. Options include:
¡ In cold standby state.
¡ Early warning.
¡ Failed.
¡ No input.
¡ Input beyond the range.
¡ Modules not matching.
PSU_Redundancy sensor
· Status: Redundancy status of power supplies. Options include:
¡ Normal—Power supply redundancy is normal.
¡ Minor—Power supply redundancy is lost.
· Reading: Reading of the power supply redundancy sensor. Options include:
¡ Power Redundancy—All power supplies are present and operating correctly.
¡ Power Redundancy Lost—A minimum of one power supply is absent or operating incorrectly.
Total_Power sensor
· Status: Power input status of the server. Options include:
¡ Normal—Power input for the server is normal.
¡ N/A—Failed to obtain the power input status for the server.
· Reading: Current total input power of the server.
View drive status
Each drive has a status sensor, which are named in the formats of Nnumber DISKnumber_Status and Nnumber NVMEnumber_Status for SAS/SATA drives and NVMe drives, respectively. The Nnumber argument represents the number of the compute module (CMOD). The DISKnumber or NVMEnumber argument represents the number of the drive.
Restrictions and guidelines
The drive UID LED is unavailable for M.2 drives when the server is powered off.
The drive UID LED is unavailable for a drive if the Fault/UID LED of the drive is steady amber.
Procedure
1. In the navigation pane, select Dashboard > Sensors.
2. Click the Drives tab to view drive status and readings, as shown in Figure 43.
Figure 43 Viewing drive status
Parameters
· Status: Presence of drive fault. Options include:
¡ Normal—The drive is operating correctly.
¡ N/A—The drive sensor is faulty or the server is powered off.
¡ Minor/Major/Critical—A drive fault is present. The error code is displayed in the Reading field.
· Reading: Reading of the drive sensor. Available readings are compliant with IPMI.
· Drive UID LED: Status of the drive UID LED function. Options include:
¡ Enabled—The drive Fault/UID LED is steady blue for drive locating.
¡ Disabled—The drive Fault/UID LED status varies by drive status.
· Actions: Select whether to enable the drive UID LED function. Options include:
¡ Enable.
¡ Disable.
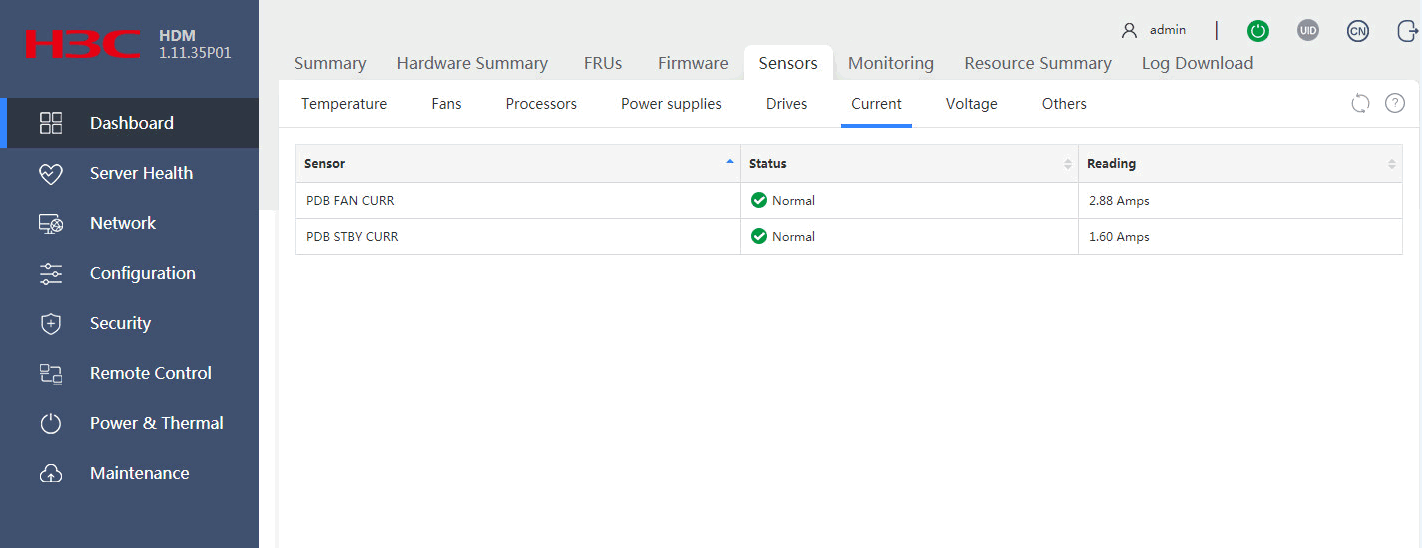
View status of electrical current
The server provides a PDB FAN CURR sensor and a PDB STBY CURR sensor to monitor the electrical current of the fan system and the SMC system, respectively.
Procedure
1. In the navigation pane, select Dashboard > Sensors.
2. Click the Current tab to view electrical current status and readings, as shown in Figure 44.
Figure 44 Viewing electrical current status
Parameters
· Status: Presence of electrical current fault. Options include:
¡ Normal—No electrical current fault is present.
¡ N/A—The sensor is faulty or the server is powered off.
· Reading: Reading of the electrical current sensor.
View status of voltage
The voltage sensors monitor the voltage on each server component. Each voltage sensor has a Nnumber prefix that represents the number of the compute module in which the sensor resides, for example N1 PVCCSA P1 and N1 PVCCIN P1.
Procedure
1. In the navigation pane, select Dashboard > Sensors.
2. Click the Voltage tab to view voltage status and readings, as shown in Figure 45.
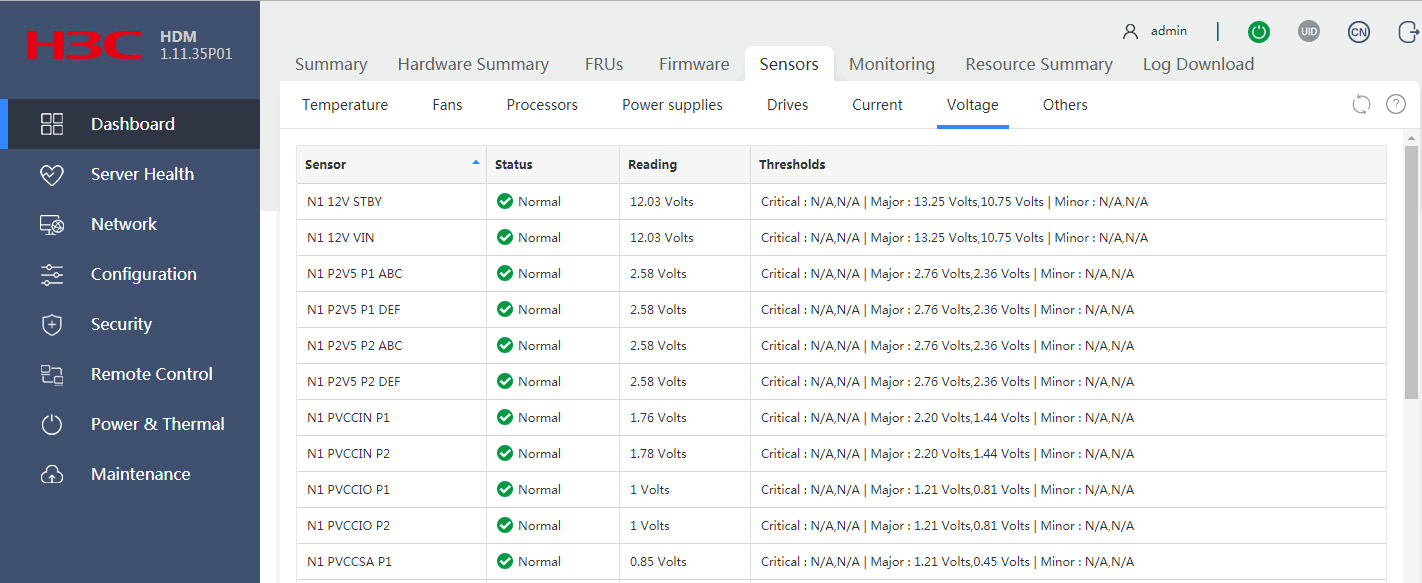
Parameters
· Sensor:
¡ PVCCSA P1: Monitors the PVCCSA voltage of CPU 1.
¡ P2V5 P1 ABC: Monitors VPP voltage of DIMM_ABC for CPU 1. The voltage should be about 2.5 V.
¡ PVCCIN P1: Monitors the PVCCIN voltage of CPU 1.
¡ 12V VIN: Monitors the 12 V input voltage provided by the active power supplies to the system.
¡ VDDQ P1 ABC: Monitors the VDDQ voltage of DIMM_ABC for CPU 1. The voltage should be about 1.2 V.
¡ PVCCIO P1: Monitors the PVCCIO voltage of CPU 1.
¡ VDDQ P1 DEF: Monitors the VDDQ voltage of DIMM_DEF for CPU 1. The voltage should be about 1.2 V.
¡ P2V5 P1 DEF: Monitors the VPP voltage of DIMM_DEF for CPU 1. The voltage should be about 2.5 V.
¡ P2V5 P2 ABC: Monitors the VPP voltage of DIMM_ABC for CPU 2. The voltage should be about 2.5 V.
¡ PVCCIN P2: Monitors the PVCCIN voltage of CPU 2.
¡ PVCCIO P2: Monitors the PVCCIO voltage of CPU 2.
¡ PVCCSA P2: Monitors the PVCCSA voltage of CPU 2.
¡ VDDQ P2 ABC: Monitors the VDDQ voltage of DIMM_ABC for CPU 2. The voltage should be about 1.2 V.
¡ VDDQ P2 DEF: Monitors the VDDQ voltage of DIMM_DEF for CPU 2. The voltage should be about 1.2 V.
¡ P2V5 P2 DEF: Monitors the VPP voltage of DIMM_DEF for CPU 2. The voltage should be about 2.5 V.
¡ 12V STBY: Monitors the 12 V input voltage provided by the standby power supplies to the system.
¡ PDB FAN VOLT: Monitors the power supply voltage for fans on the power distribution board.
¡ PDB STBY VOLT: Monitors the 12 V power supply provided by the standby power supplies on the power distribution board.
· Status: Voltage status. Options include:
¡ Normal—The voltage is between the lower minor threshold (exclusive) and upper minor threshold (exclusive).
¡ N/A—The component is absent or the voltage value cannot be obtained.
¡ Major—The voltage exceeds the upper major threshold or drops below the lower major threshold. In this state, server performance degrades significantly.
· Reading: Voltage detected by the sensor. This field displays N/A if the component is absent or the voltage value cannot be obtained.
· Thresholds: Voltage thresholds:
¡ Critical—Lower and upper critical thresholds.
¡ Major—Lower and upper major thresholds.
¡ Minor—Lower and upper minor thresholds.
If a threshold is not specified, N/A is displayed.
View event log status
The event log sensor (SEL_sensor) monitors status of the event log.
Procedure
1. In the navigation page, select Dashboard > Sensors.
2. In the work pane, click the Others tab, as shown in Figure 46.
3. In the SEL section, view status and reading of the event log sensor.
Figure 46 Viewing event log status
Parameters
· Status: Running status of the event log sensor. Options include:
¡ Normal—The event log is operating correctly or the event log has been cleared or reset.
¡ Minor—The log is full or the number of event log entries has exceeded 75% of the event log size.
· Reading: Reading of the event log sensor.
View operating system status
The operating system sensor (Watchdog2) monitors the operating system (OS) of the server for system crash events and restarts the OS upon detection of an OS crash.
Procedure
1. In the navigation page, select Dashboard > Sensors.
2. In the work pane, click the Others tab, as shown in Figure 47.
3. In the Watchdog2 section, view status and reading of the OS sensor.
Figure 47 Viewing operating system status

Parameters
· Status: Running status of the OS. Options include:
¡ Normal—The server OS is operating correctly.
¡ Minor—Indicates that a timer interruption or timer expiration event has occurred.
¡ Major—Indicates that a power supply hot restart, power-off, or power-cycle operation expired.
Sensors (for the R6700)
The Sensors menu displays data collected by each sensor in the system. You can use the sensor data to monitor the health state of the server and identify the cause when the system health deteriorates.
View status and temperature readings of temperature sensors
HDM presents temperature data in both heatmap and table formats to help you monitor the cooling performance of the server.
· The temperature heatmaps use colors between green and red to show the temperature distribution inside the server chassis in 3D view and uses circles to represent sensors. Green indicates 0°C (32°F). As the temperature gets higher, the color gets warmer until it changes to red. With the temperature heatmaps, you can quickly identify the component that is in a poor cooling condition.
· The temperature sensor table displays the temperature reading, status, and coordinates of each sensor.
Restrictions and guidelines
The temperature heatmaps do not display sensors whose reading is negative.
Procedure
1. In the navigation pane, select Dashboard > Sensors.
2. In the work pane, click the Temperature tab, as shown in Figure 48.
3. To obtain the name, status, and reading of the sensor at a location, hover the mouse over the circle at that location on a temperature heatmap.
Figure 48 Viewing temperature sensor information
Parameters
· Status: Temperature status of a component:
¡ Normal—The temperature is normal, between the lower and upper minor thresholds (exclusive). No action is required.
¡ Minor—The temperature is between the lower major threshold (exclusive) and lower minor threshold (inclusive) or between the upper minor threshold (inclusive) and upper major threshold exclusive). Administrative attention is required.
¡ Major—The temperature is between the lower critical threshold (exclusive) and lower major threshold (inclusive) or between the upper major threshold (inclusive) and upper critical threshold (exclusive). Immediate action is required.
¡ Critical—The temperature is equal to or below the lower critical threshold, or it is equal to or above the upper critical threshold. Immediate action is required.
¡ N/A—The monitored component is not installed or the temperature sensor cannot be read.
· Reading: Current temperature. If HDM fails to obtain the sensor reading, this field displays N/A.
· X: Location of the sensor on the X axis.
· Y: Location of the sensor on the Y axis.
· Z: Server in which the sensor is located. The value 0 indicates the current server.
· Thresholds: Temperature thresholds:
¡ Critical—Lower and upper critical thresholds. When the temperature reaches either threshold, the server might automatically shut down to avoid damage to its components.
¡ Major—Lower and upper major thresholds. If the temperature reaches either threshold, server performance will significantly degrade.
¡ Minor—Lower and upper minor thresholds. If the temperature reaches either threshold, server performance will slightly degrade.
If a threshold is not specified, N/A is displayed.
View status and speed of each fan
Each fan has a status sensor and a speed sensor, which are named FANnumber_Status and FANnumber_Speed, respectively. The number argument represents the number of the fan.
Procedure
1. In the navigation pane, select Dashboard > Sensors.
2. Click the Fans tab to view running status and rotation speed (in RPM) of each fan, as shown in Figure 49.
Figure 49 Viewing status and speed of each fan
Parameters
FANnumber_Status sensors
· Status: Running status of the fan:
¡ Normal—The fan is operating correctly.
¡ Minor—Fan rotation speed has undesirably slowed down, or the fan is absent or installed incorrectly.
· Reading: Operating status of the fan.
FANnumber_Speed sensors
· Status: Presence of the fan. Options include:
¡ Normal—The fan is present and operating correctly.
¡ N/A—The fan is absent or a fan rotation anomaly is present.
· Reading: RPM of the fan.
View status of each processor
Each processor has two status sensors, which are named in the formats of CPUnumber_Prochot and CPUnumber_Status, respectively. The number argument represents the number of the processor.
Procedure
1. In the navigation pane, select Dashboard > Sensors.
2. Click the Processors tab to view status of each processor, as shown in Figure 50.
Figure 50 Viewing processor status
Parameters
CPUnumber_Status sensors
· Status: Status of the processor.
¡ Normal—The processor is present.
¡ Minor—A recoverable error occurred on the processor.
¡ Critical—An unrecoverable error occurred on the processor, or the temperature of the sensor has exceeded the critical threshold. When the temperature of the sensor exceeds the critical threshold, the server automatically shuts down.
¡ N/A—The processor is absent.
· Reading: Processor sensor reading.
CPUnumber_Prochot sensors
· Status: PROCHOT alarm status on the processor.
¡ Normal—The processor is present.
¡ Major—A PROCHOT alarm is generated because of high processor temperature. The processor is underclocked if the alarm occurs.
¡ N/A—The processor is absent.
· Reading: Processor sensor reading.
View power supply status
The server provides the following sensors for monitoring the power status of power supplies, processors, DIMMs, fans, and the server:
· CPU_Total_Power—Monitors the power status of present processors.
· Fan_Power—Monitors the power status of present fans.
· MEM_Total_Power—Monitors the power status of present DIMMs.
· PSUnumber_PIN—Monitors the input of a power supply. The number argument represents the number of the power supply.
· PSUnumber_Status—Monitors the running status of a power supply. The number argument represents the number of the power supply.
· PSU_Redundancy—Monitors the status of power supply redundancy.
· Total_Power—Monitors the power status of the server.
Procedure
1. In the navigation pane, select Dashboard > Sensors.
2. Click the Power supplies tab, as shown in Figure 51.
Figure 51 Viewing power supply status
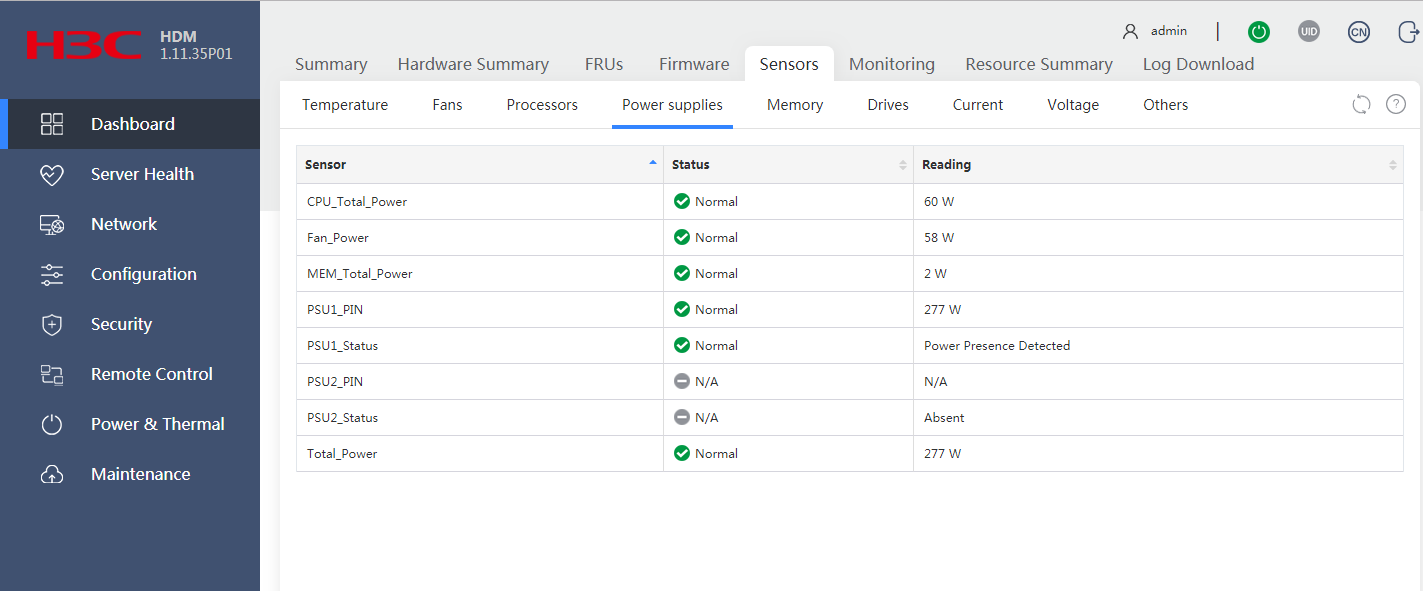
Parameters
CPU_Total_Power sensor
· Status: Power status of processors. Options include:
¡ Normal—Processors are present and the server is powered on.
¡ N/A—No processor is present or the server is powered off.
· Reading: Current total power of the present processors.
Fan_Power sensor
· Status: Power status of fans. Options include:
¡ Normal—Fans are present and the server is powered on.
¡ N/A—No fan is present or the server is powered off.
· Reading: Current total power of the present fans.
MEM_Total_Power sensor
· Status: Power status of DIMMs. Options include:
¡ Normal—DIMMs are present and the server is powered on.
¡ N/A—No DIMM is present or the server is powered off.
· Reading: Current total power of the present DIMMs.
PSUnumber_PIN sensors
· Status: Power input status of the power supply. Options include:
¡ Normal—Power input is normal.
¡ N/A—No power input exists.
· Reading: Current input power.
PSUnumber_Status sensors
· Status: Running status of the power supply. Options include:
¡ Normal—The power supply is operating correctly or in cold standby state.
¡ Minor—The power supply is in Early warning or Modules not matching state.
¡ Major—The power supply is in one of the following states: Failed, No input, Input beyond the range.
¡ N/A—The power supply is absent.
· Reading: Reading of the power supply status sensor. Options include:
¡ In cold standby state.
¡ Early warning.
¡ Failed.
¡ No input.
¡ Input beyond the range.
¡ Modules not matching.
PSU_Redundancy sensor
· Status: Redundancy status of power supplies. Options include:
¡ Normal—Power supply redundancy is normal.
¡ Minor—Power supply redundancy is lost.
· Reading: Reading of the power supply redundancy sensor. Options include:
¡ Power Redundancy—Two power supplies of the same model are present and operating correctly.
¡ Power Redundancy Lost—A power supply is absent or faulty, or two power supplies are of different models.
Total_Power sensor
· Status: Power input status of the server. Options include:
¡ Normal—Power input for the server is normal.
¡ N/A—Failed to obtain the power input status for the server.
· Reading: Current total input power of the server.
View memory status
The memory sensors monitor the memory modules of processors in the server. The memory sensors are named in the CPU1_DIMM_Anumber, CPU2_DIMM_Bnumber, CPU3_DIMM_Anumber, or CPU4_DIMM_Bnumber format.
Procedure
1. In the navigation pane, select Dashboard > Sensors.
2. Click the Memory tab to view memory status, as shown in Figure 52.
Figure 52 Viewing memory status
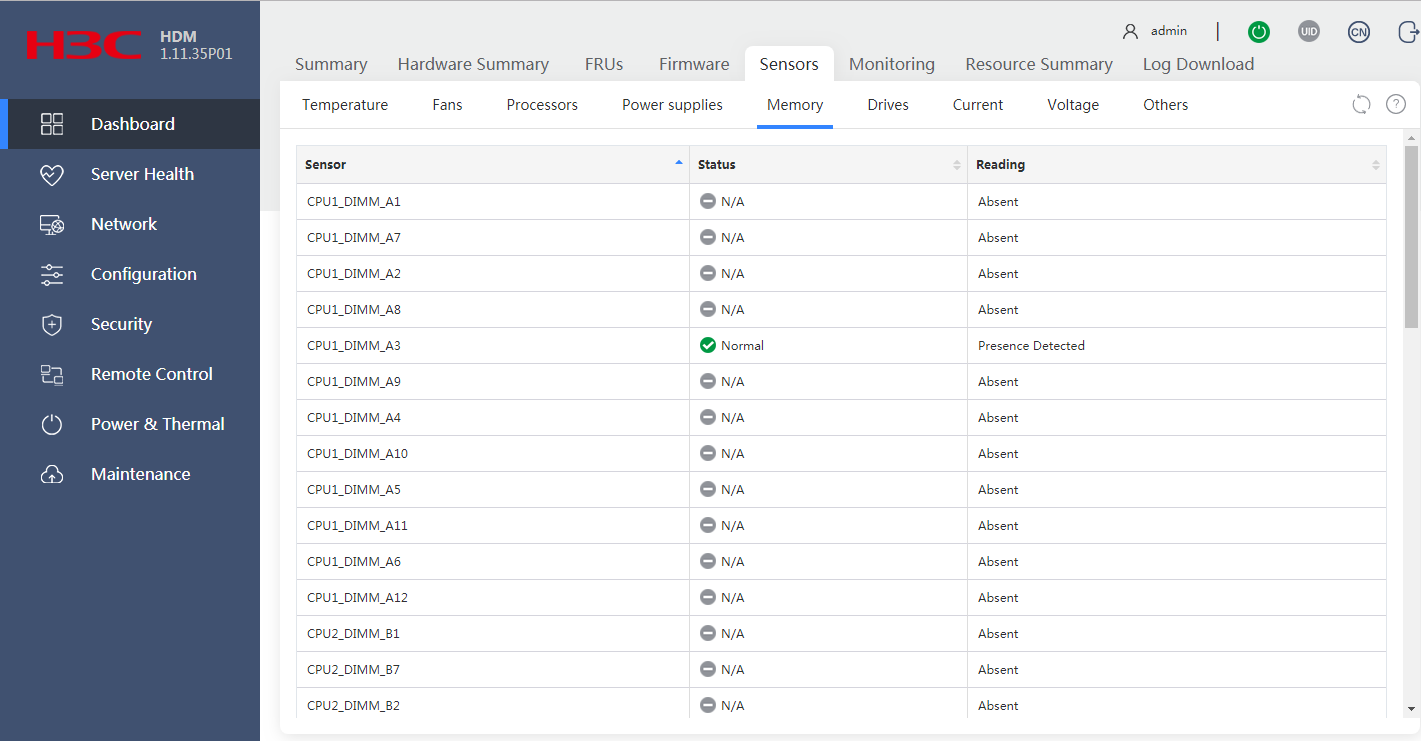
Parameters
· Status: Presence and operating status of memory. Options include:
¡ Normal—No memory error is present.
¡ Absent—Memory is absent.
¡ Minor/Major/Critical—Memory error is present.
· Reading: Reading of the memory sensor.
View drive status
Each drive (HDD, SSD, or NVMe drive) in the server has a drive sensor. The sensor for a drive at the server front is named DISK_Fnumber_Status and the sensor for a drive at the server rear is named DISK_Rnumber_Status.
Restrictions and guidelines
The drive UID LED is unavailable for M.2 drives when the server is powered off.
The drive UID LED is unavailable for a drive if the Fault/UID LED of the drive is steady amber.
Procedure
1. In the navigation pane, select Dashboard > Sensors.
2. Click the Drives tab to view drive status, as shown in Figure 53.
Figure 53 Viewing drive status
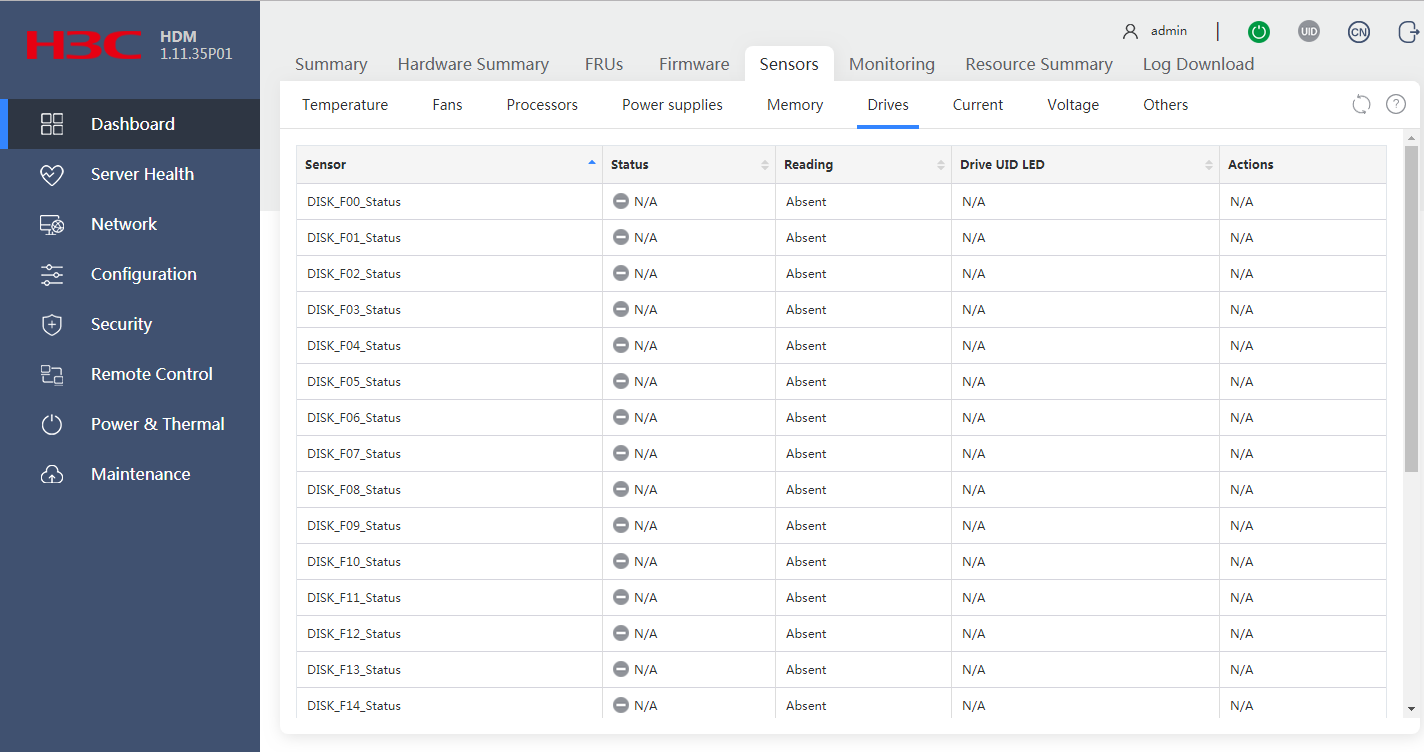
Parameters
· Status: Operating status of the drive. Options include:
¡ Normal—The drive is operating correctly.
¡ N/A—The drive is not present.
¡ Minor/Major/Critical—A drive fault is present. The error code is displayed in the Reading field.
· Reading: Reading of the drive sensor. The available readings are defined in IPMI.
· Drive UID LED: Status of the drive UID LED function. Options include:
¡ Enabled—The drive Fault/UID LED is steady blue for drive locating.
¡ Disabled—The drive Fault/UID LED status varies by drive status.
· Actions: Select whether to enable the drive UID LED function. Options include:
¡ Enable.
¡ Disable.
View status of electrical current
The electrical current sensor (OverCurrent) monitors the electrical current in the server.
Procedure
1. In the navigation pane, select Dashboard > Sensors.
2. Click the Current tab to view electrical current status and readings, as shown in Figure 54.
Figure 54 Viewing electrical current status
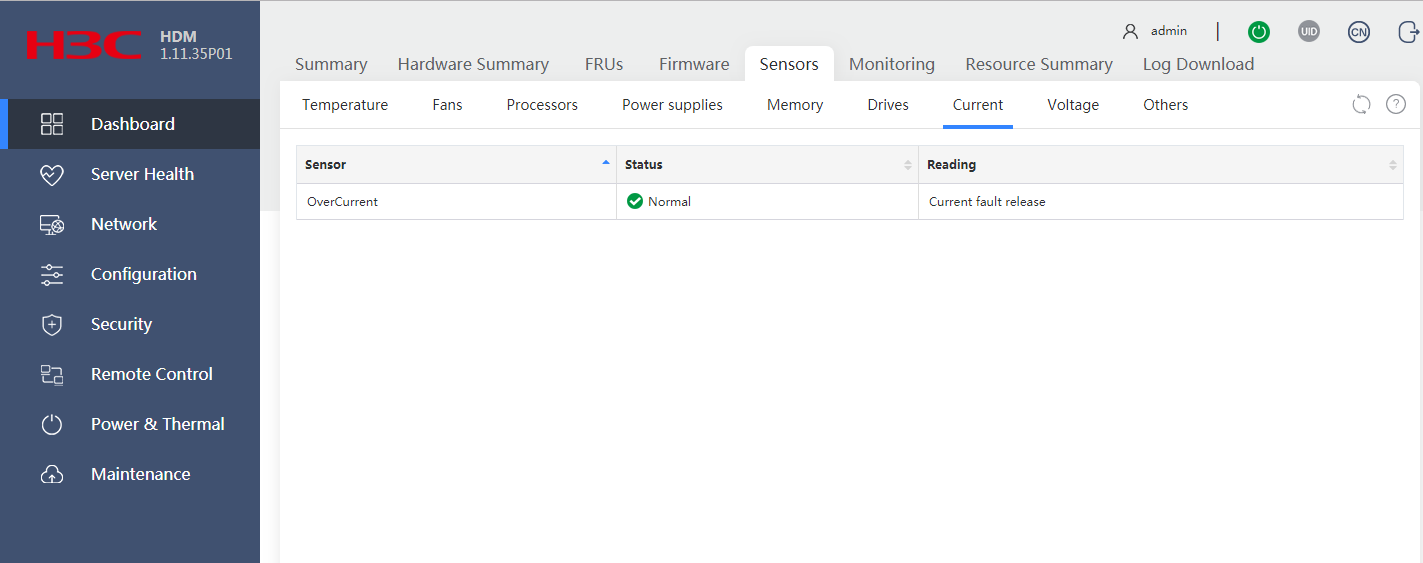
Parameters
· Status: Presence of electrical current fault. Options include:
¡ Normal—No electrical current fault is present.
¡ Major—Electrical current fault is present.
· Reading: Reading of the electrical current sensor.
View status of voltage
The voltage sensors monitor the voltage on each server component.
The following are types of voltage sensors:
· Sensors with a _PG suffix (for example, BP_1_PG). These sensors monitor the components for the presence of voltage faults.
· Sensors without a _PG suffix (for example, CPU1_DDR_VPP1). These sensors monitor the components for voltage threshold crossing events.
Procedure
1. In the navigation pane, select Dashboard > Sensors.
2. Click the Voltage tab to view voltage status and readings, as shown in Figure 55.
Figure 55 Viewing voltage status
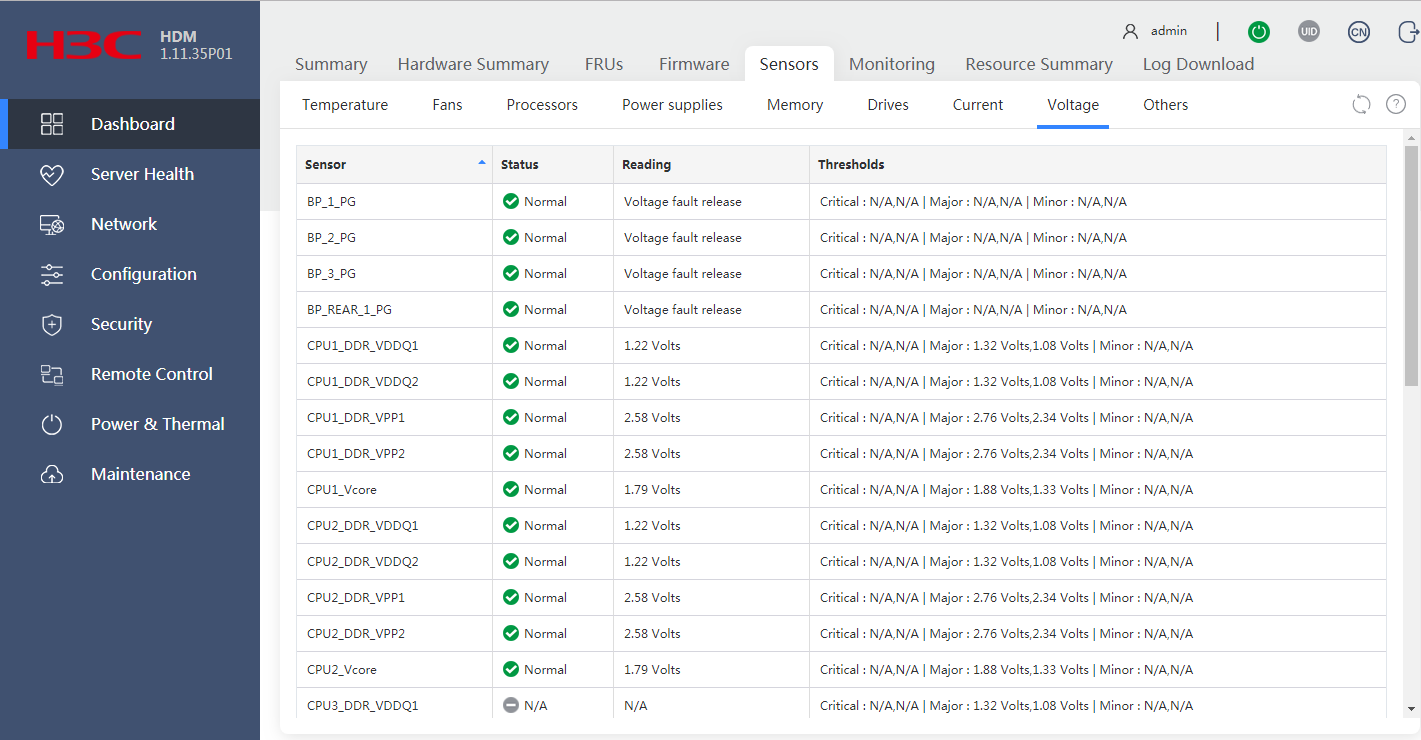
Parameters
Sensors with a _PG suffix
· Status: Presence of voltage fault. Options include:
¡ Normal—No voltage fault is present.
¡ Major—Voltage fault is present.
· Reading: Reading of the voltage sensor. The reading indicates whether a voltage fault is present.
Sensors without a _PG suffix
· Status: Voltage status. Options include:
¡ Normal—The voltage is between the lower minor threshold (exclusive) and upper minor threshold (exclusive).
¡ N/A—The component is absent or the voltage value cannot be obtained.
¡ Major—The voltage exceeds the upper major threshold or drops below the lower major threshold.
· Reading: Voltage detected by the sensor. This field displays N/A if the component is absent or the voltage value cannot be obtained.
· Thresholds: Voltage thresholds:
¡ Critical—Lower and upper critical thresholds.
¡ Major—Lower and upper major thresholds.
¡ Minor—Lower and upper minor thresholds.
If a threshold is not specified, N/A is displayed.
View event log status
The event log sensor (SEL_sensor) monitors status of the event log.
Procedure
1. In the navigation page, select Dashboard > Sensors.
2. In the work pane, click the Others tab, as shown in Figure 56.
3. In the SEL section, view status and reading of the event log sensor.
Figure 56 Viewing event log status

Parameters
· Status: Running status of the event log sensor. Options include:
¡ Normal—The event log is operating correctly or the event log has been cleared or reset.
¡ Minor—The log is full or the number of event log entries has exceeded 75% of the event log size.
· Reading: Reading of the event log sensor.
View operating system status
The operating system sensor (Watchdog2) monitors the operating system (OS) of the server for system crash events and restarts the OS upon detection of an OS crash.
Procedure
1. In the navigation page, select Dashboard > Sensors.
2. In the work pane, click the Others tab, as shown in Figure 57.
3. In the Watchdog2 section, view status and reading of the OS sensor.
Figure 57 Viewing operating system status

Parameters
· Status: Running status of the OS. Options include:
¡ Normal—The server OS is operating correctly.
¡ Minor—Indicates that a timer interruption or timer expiration event has occurred.
¡ Major—Indicates that a power supply hot restart, power-off, or power-cycle operation expired.
· Reading: Reading of the OS sensor.
View status of the system initialization process
The system initialization sensor (SYS_FW_Progress) monitors the real-time status of the system initialization process.
Procedure
1. In the navigation page, select Dashboard > Sensors.
2. In the work pane, click the Others tab, as shown in Figure 58.
3. In the sys_fw_progress section, view system initialization status.
Figure 58 Viewing status of the system initialization process
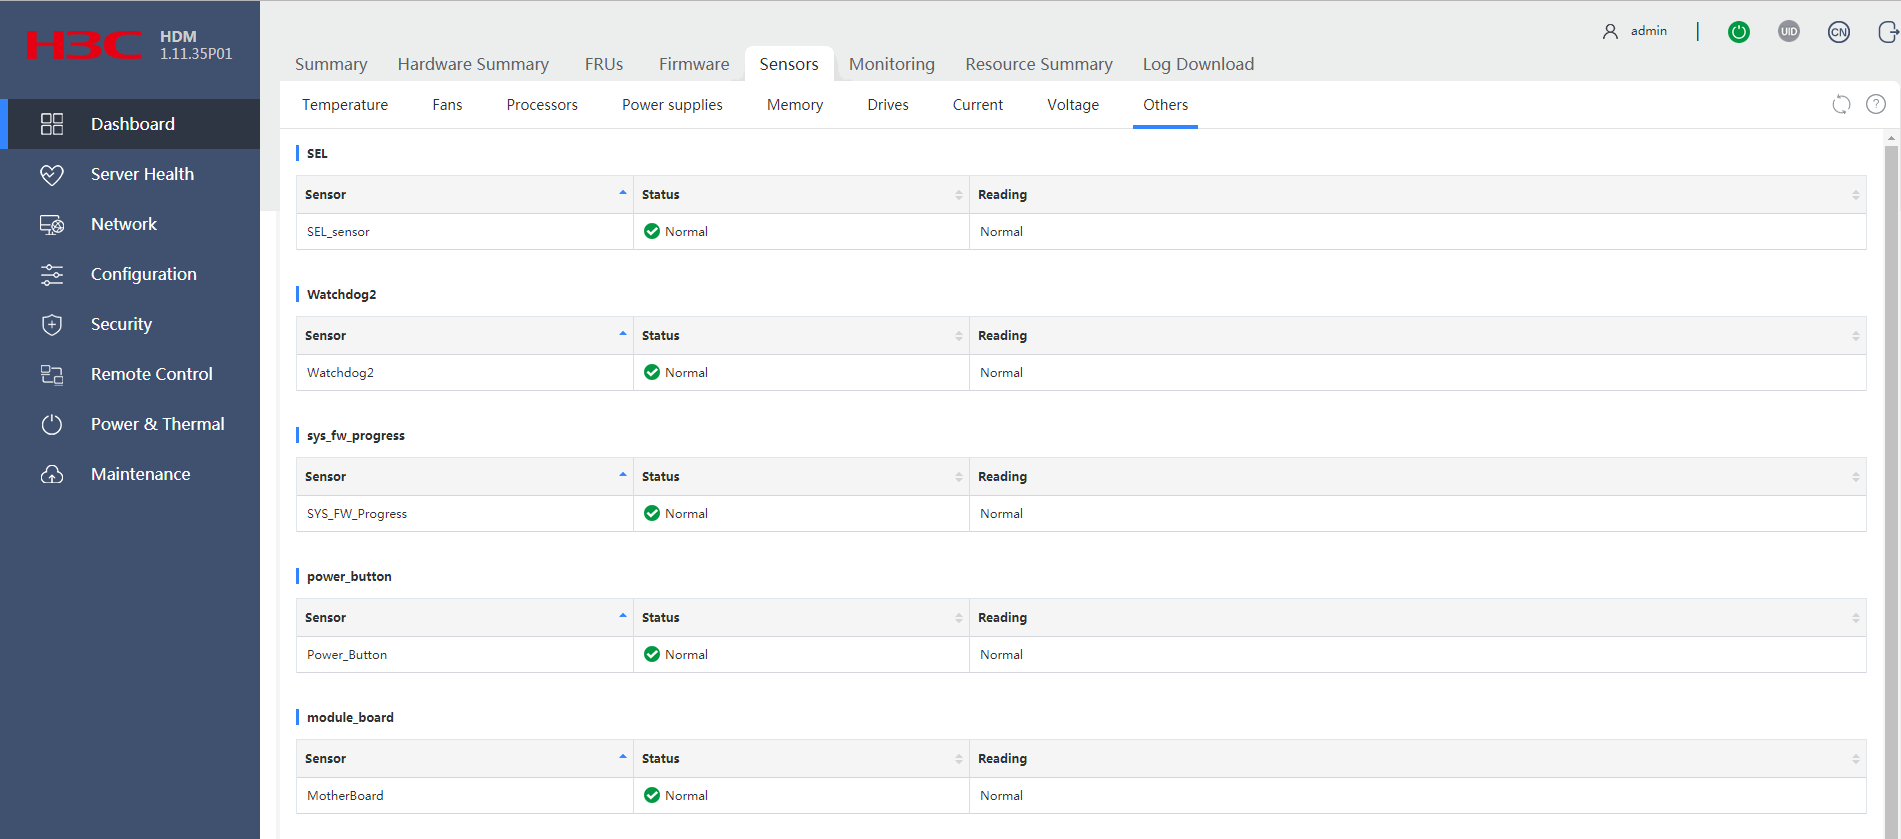
Parameters
· Status: Current system initialization status. Options include:
¡ Normal—The initialization process is normal.
¡ N/A—The server is powered off.
¡ Major—An initialization error has occurred.
· Reading: Reading of the sensor.
View power button status
The power button sensor (Power_Button) monitors the status of the power button.
Procedure
1. In the navigation page, select Dashboard > Sensors.
2. In the work pane, click the Others tab, as shown in Figure 59.
3. In the power_button section, view power button status.
Figure 59 Viewing power button status

Parameters
· Status: Current status of the power button. Options include:
¡ Normal—The power button is operating correctly.
¡ N/A—The power button is faulty.
· Reading: Reading of the sensor.
View system board status
The system board sensor (MotherBoard) monitors the status of the system board.
Procedures
1. In the navigation page, select Dashboard > Sensors.
2. In the work pane, click the Others tab, as shown in Figure 60.
3. In the module_board section, view system board status.
Figure 60 Viewing system board status

Parameters
· Status: Current status of the system board. Options include:
¡ Normal—The system board is normal.
¡ Major—The system board is faulty.
· Reading: Reading of the sensor.
View system restart status
The system restart sensor (SYS_Restart) monitors the status of the system restart process.
Procedure
1. In the navigation page, select Dashboard > Sensors.
2. In the work pane, click the Others tab, as shown in Figure 61.
3. In the sys_restart section, view system restart status.
Figure 61 Viewing system restart status

Parameters
· Status: Current system restart status. Options include:
¡ Normal—The system restarts correctly.
¡ Major—An error occurs during system restart.
· Reading: Reading of the sensor.
View system status
The system sensor (ACPI_State) monitors the status of the server system.
Procedure
1. In the navigation page, select Dashboard > Sensors.
2. In the work pane, click the Others tab, as shown in Figure 62.
3. In the acpi_state section, view system status.
Figure 62 Viewing system status
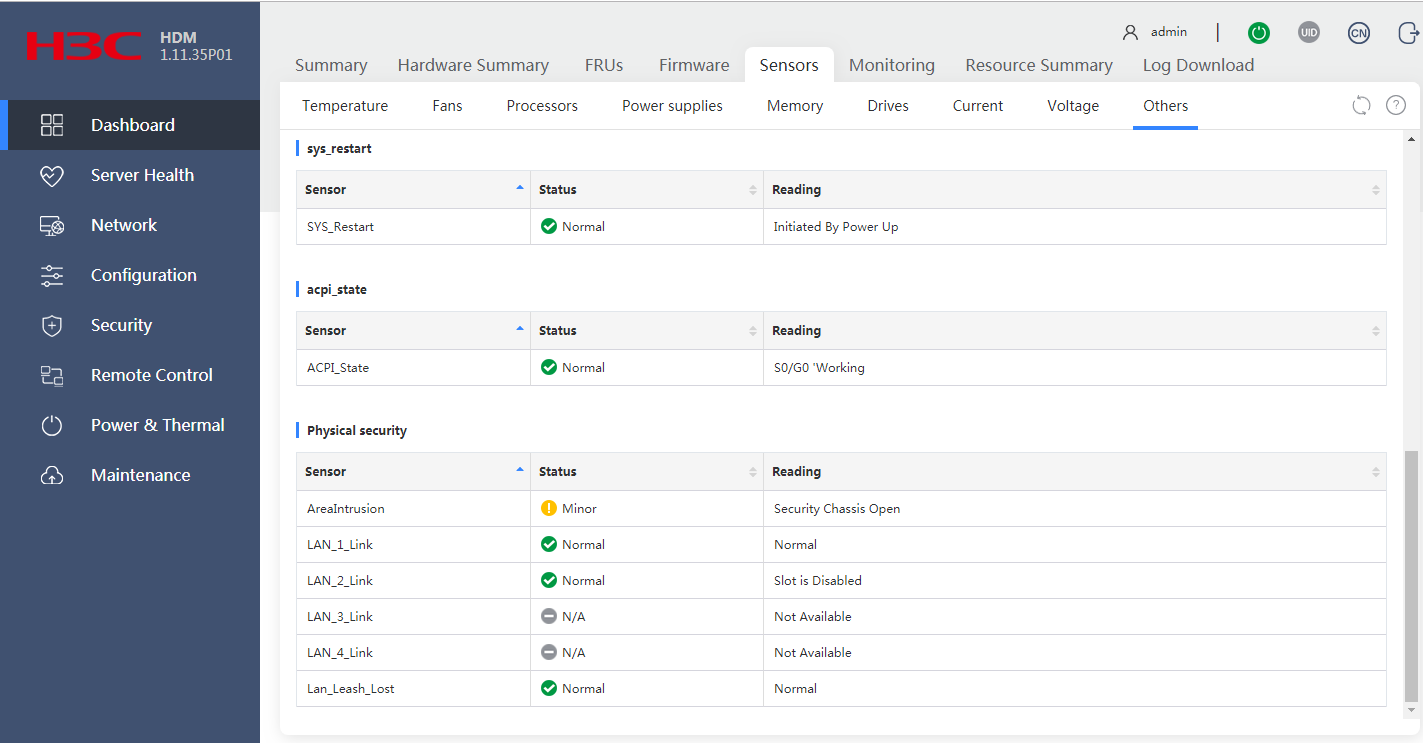
Parameters
· Status: Current system status. Options include:
¡ Normal—The system is operating correctly.
¡ Major—An error occurs in the system.
· Reading: Reading of the sensor.
View physical security status
The server provides the following sensors for monitoring server physical access events and the status of shared network ports:
· AreaIntrusion—Monitors the server chassis for physical access events. When the chassis is opened, the sensor reports an event log. When the chassis is closed, the sensor does not report.
· Lan_Leash_Lost—Monitors the status of all shared network ports.
· Lan_number_Link—Monitors the status of shared network port 1, 2, 3, or 4. The number argument represents the number of the shared network port.
Procedure
1. In the navigation page, select Dashboard > Sensors.
2. In the work pane, click the Others tab, as shown in Figure 63.
3. In the Physical security section, view physical security status.
Figure 63 Viewing physical security status

Parameters
AreaIntrusion sensor
· Status: Chassis access status. Options include:
¡ Normal—The chassis is closed.
¡ Minor—The chassis is opened.
¡ N/A—The chassis-open alarm module is not present.
· Reading: Reading of the physical status sensor.
Lan_number_Link sensors
· Status: Running status of the specific shared network port. Options include:
¡ Normal—The shared network port is enabled.
¡ N/A—The shared network port is disabled.
· Reading: Reading of the sensor.
Lan_Leash_Lost sensor
· Status: Running status of the shared network ports in the server. Options include:
¡ Normal—A minimum of one shared network port is enabled.
¡ N/A—No shared network port exists or all shared network ports are operating incorrectly.
· Reading: Reading of the sensor.
Sensors (for the R4950)
The Sensors menu displays data collected by each sensor in the system. You can use the sensor data to monitor the health state of the server and identify the cause when the system health deteriorates.
View status and temperature readings of temperature sensors
HDM presents temperature data in both heatmap and table formats to help you monitor the cooling performance of the server.
· The temperature heatmaps use colors between green and red to show the temperature distribution inside the server chassis in 3D view and uses circles to represent sensors. Green indicates 0°C (32°F). As the temperature gets higher, the color gets warmer until it changes to red. With the temperature heatmaps, you can quickly identify the component that is in a poor cooling condition.
· The temperature sensor table displays the temperature reading, status, and coordinates of each sensor.
Restrictions and guidelines
The temperature heatmaps do not display sensors whose reading is negative.
Procedure
1. In the navigation pane, select Dashboard > Sensors.
2. In the work pane, click the Temperature tab, as shown in Figure 64.
3. To obtain the name, status, and reading of the sensor at a location, hover the mouse over the circle at that location on a temperature heatmap.
Figure 64 Viewing temperature sensor information
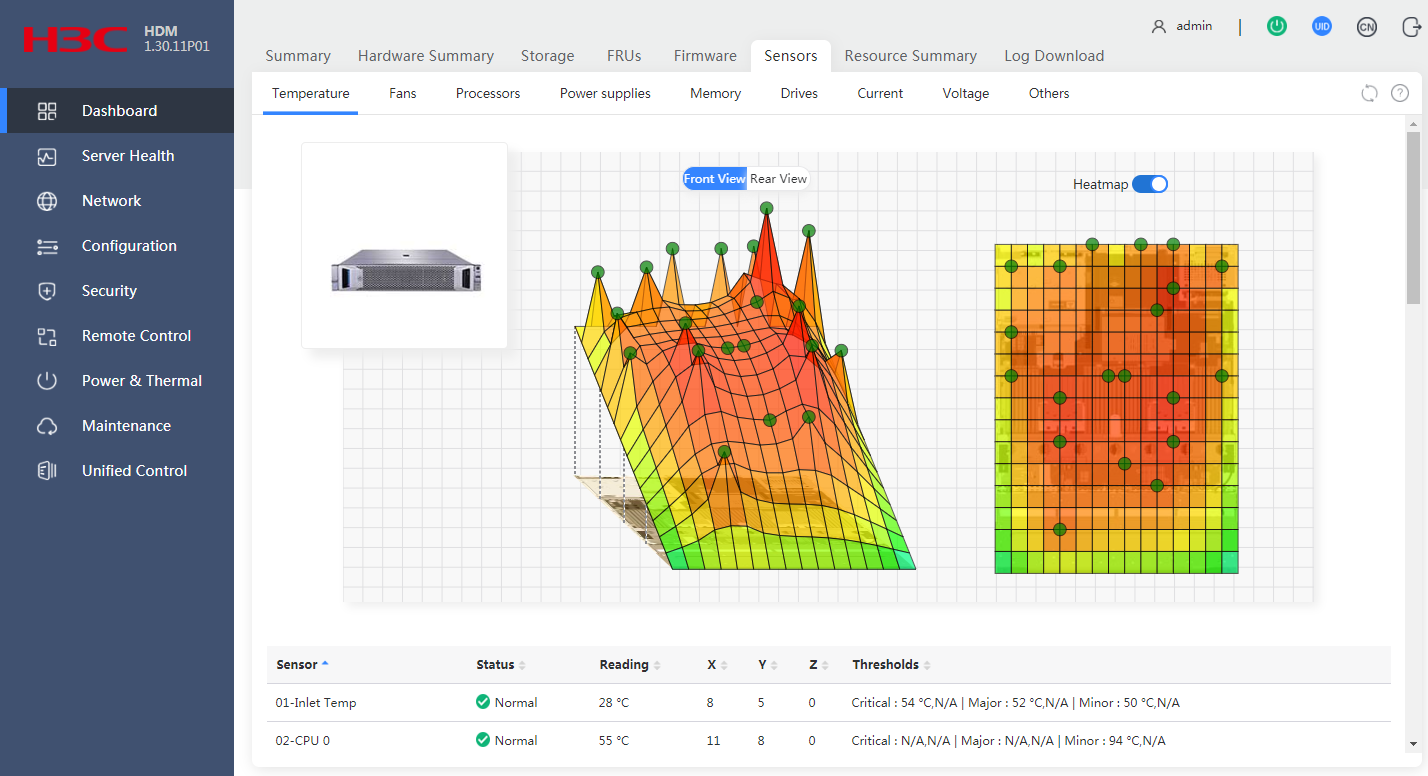
Parameters
· Status: Temperature status of a component:
¡ Normal—The temperature is normal, between the lower and upper minor thresholds (exclusive). No action is required.
¡ Minor—The temperature is between the lower major threshold (exclusive) and lower minor threshold (inclusive) or between the upper minor threshold (inclusive) and upper major threshold exclusive). Administrative attention is required.
¡ Major—The temperature is between the lower critical threshold (exclusive) and lower major threshold (inclusive) or between the upper major threshold (inclusive) and upper critical threshold (exclusive). Immediate action is required.
¡ Critical—The temperature is equal to or below the lower critical threshold, or it is equal to or above the upper critical threshold. Immediate action is required.
¡ N/A—The monitored component is not installed or the temperature sensor cannot be read.
· Reading: Current temperature. If HDM fails to obtain the sensor reading, this field displays N/A.
· X: Location of the sensor on the X axis.
· Y: Location of the sensor on the Y axis.
· Z: Server in which the sensor is located. The value 0 indicates the current server.
· Thresholds: Temperature thresholds:
¡ Critical—Lower and upper critical thresholds. When the temperature reaches either threshold, the server might automatically shut down to avoid damage to its components.
¡ Major—Lower and upper major thresholds. If the temperature reaches either threshold, server performance will significantly degrade.
¡ Minor—Lower and upper minor thresholds. If the temperature reaches either threshold, server performance will slightly degrade.
If a threshold is not specified, N/A is displayed.
View status and speed of each fan
Each fan has a status sensor and a speed sensor, which are named FANnumber_Status and FANnumber_Speed, respectively. The number argument represents the number of the fan.
Procedure
1. In the navigation pane, select Dashboard > Sensors.
2. Click the Fans tab to view running status and rotation speed (in RPM) of each fan, as shown in Figure 65.
Figure 65 Viewing status and speed of each fan
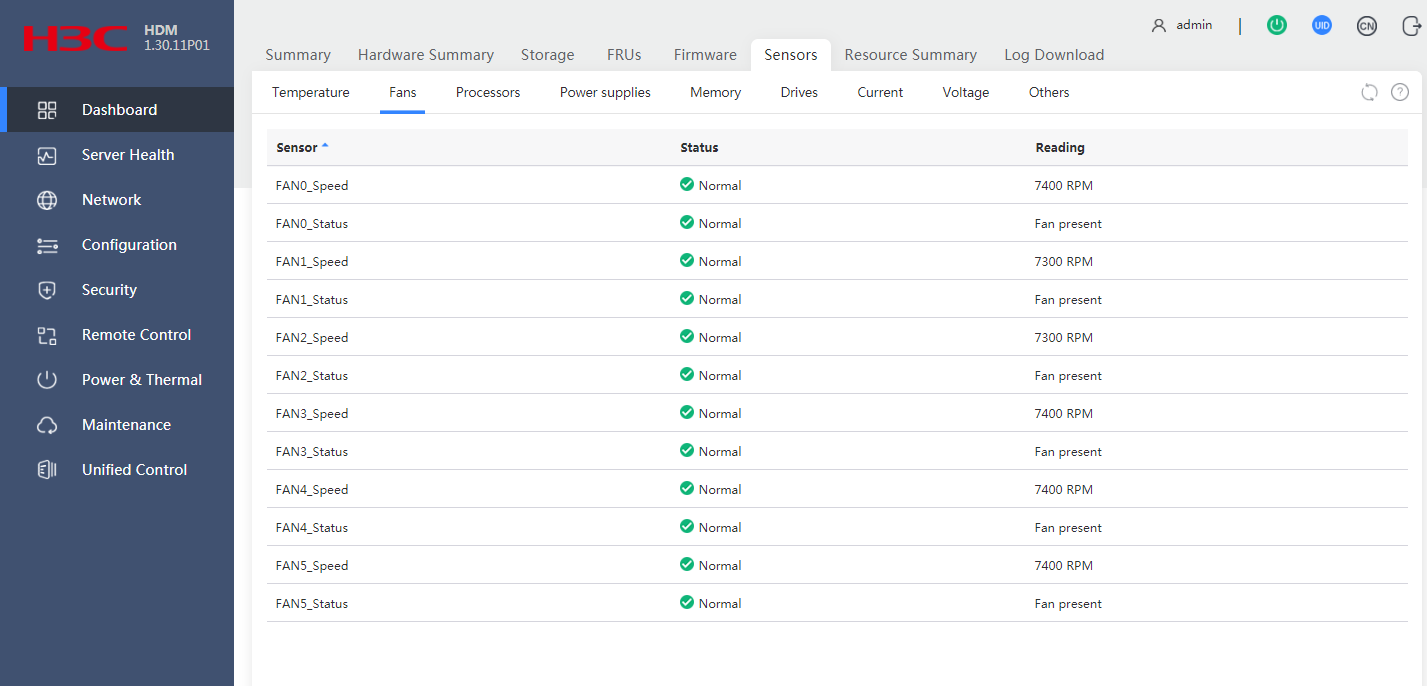
Parameters
FANnumber_Status sensors
· Status: Running status of the fan:
¡ Normal—The fan is operating correctly.
¡ Minor—Fan rotation speed has undesirably slowed down, or the fan is absent or installed incorrectly.
· Reading: Operating status of the fan.
FANnumber_Speed sensors
· Status: Presence of the fan. Options include:
¡ Normal—The fan is present and operating correctly.
¡ N/A—The fan is absent or a fan rotation anomaly is present.
· Reading: RPM of the fan.
View status of each processor
Each processor has a status sensor named in the format of CPUnumber_Status. The number argument represents the number of the processor.
Procedure
1. In the navigation pane, select Dashboard > Sensors.
2. Click the Processors tab to view status of each processor, as shown in Figure 66.
Figure 66 Viewing processor status
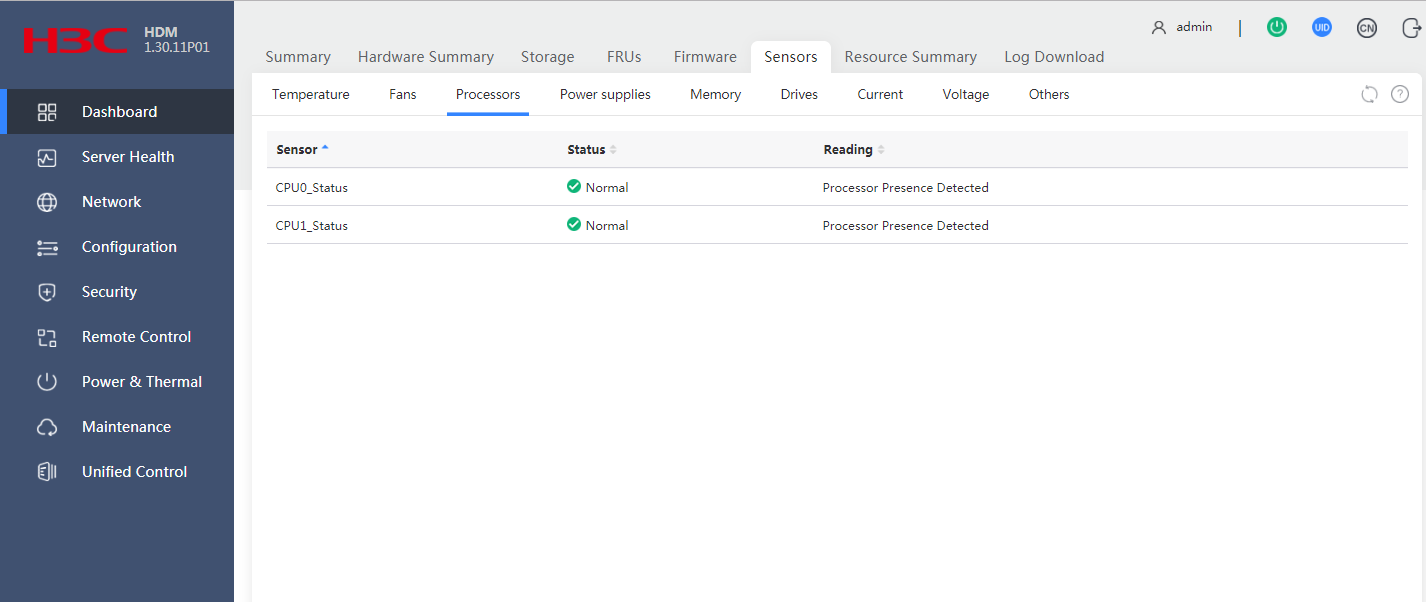
Parameters
CPUnumber_Status sensors
· Status: Status of the processor.
¡ Normal—The processor is present.
¡ Minor—A recoverable error occurred on the processor.
¡ Critical—An unrecoverable error occurred on the processor, or the temperature of the sensor has exceeded the critical threshold. When the temperature of the sensor exceeds the critical threshold, the server automatically shuts down.
¡ N/A—The processor is absent.
· Reading: Processor sensor reading.
View power supply status
The following sensors monitor the power status of each power supply and the server:
· PSUnumber_PIN—Monitors the input of a power supply. The number argument represents the number of the power supply.
· PSUnumber_Status—Monitors the running status of a power supply. The number argument represents the number of the power supply.
· Total_Power—Monitors the power status of the server.
Procedure
1. In the navigation pane, select Dashboard > Sensors.
2. Click the Power supplies tab to view status and power input of each power supply, as shown in Figure 67.
Figure 67 Viewing power supply status
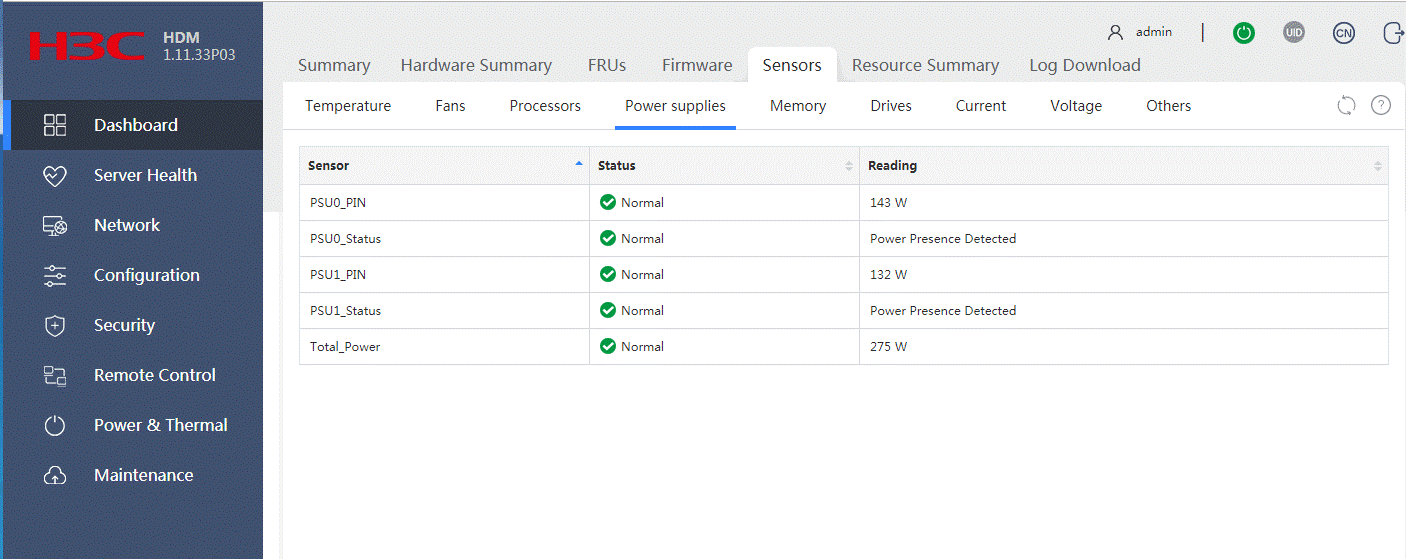
Parameters
PSUnumber_PIN sensors
· Status: Power input status of the power supply. Options include:
¡ Normal—Power input is normal.
¡ N/A—No power input exists.
· Reading: Current input power.
PSUnumber_Status sensors
· Status: Running status of the power supply. Options include:
¡ Normal—The power supply is operating correctly or in cold standby state.
¡ Minor—The power supply is in Early warning or Modules not matching state.
¡ Major—The power supply is in one of the following states: Failed, No input, Input beyond the range.
¡ N/A—The power supply is absent.
· Reading: Reading of the power supply status sensor. Options include:
¡ In cold standby state.
¡ Early warning.
¡ Failed.
¡ No input.
¡ Input beyond the range.
¡ Modules not matching.
Total_Power sensor
· Status: Power input status of the server. Options include:
¡ Normal—Power input of the server is normal.
¡ N/A—Failed to obtain the power input status from the server.
· Reading: Current total input power of the server.
View memory status
Each DIMM has a sensor named in the format of DIMMxyz to monitor the memory modules of processors in the server. The x argument represents the processor ID, the y argument represents the channel ID, and the z argument represents the DIMM slot number.
Procedure
1. In the navigation pane, select Dashboard > Sensors.
2. Click the Memory tab to view memory status, as shown in Figure 68.
Figure 68 Viewing memory status
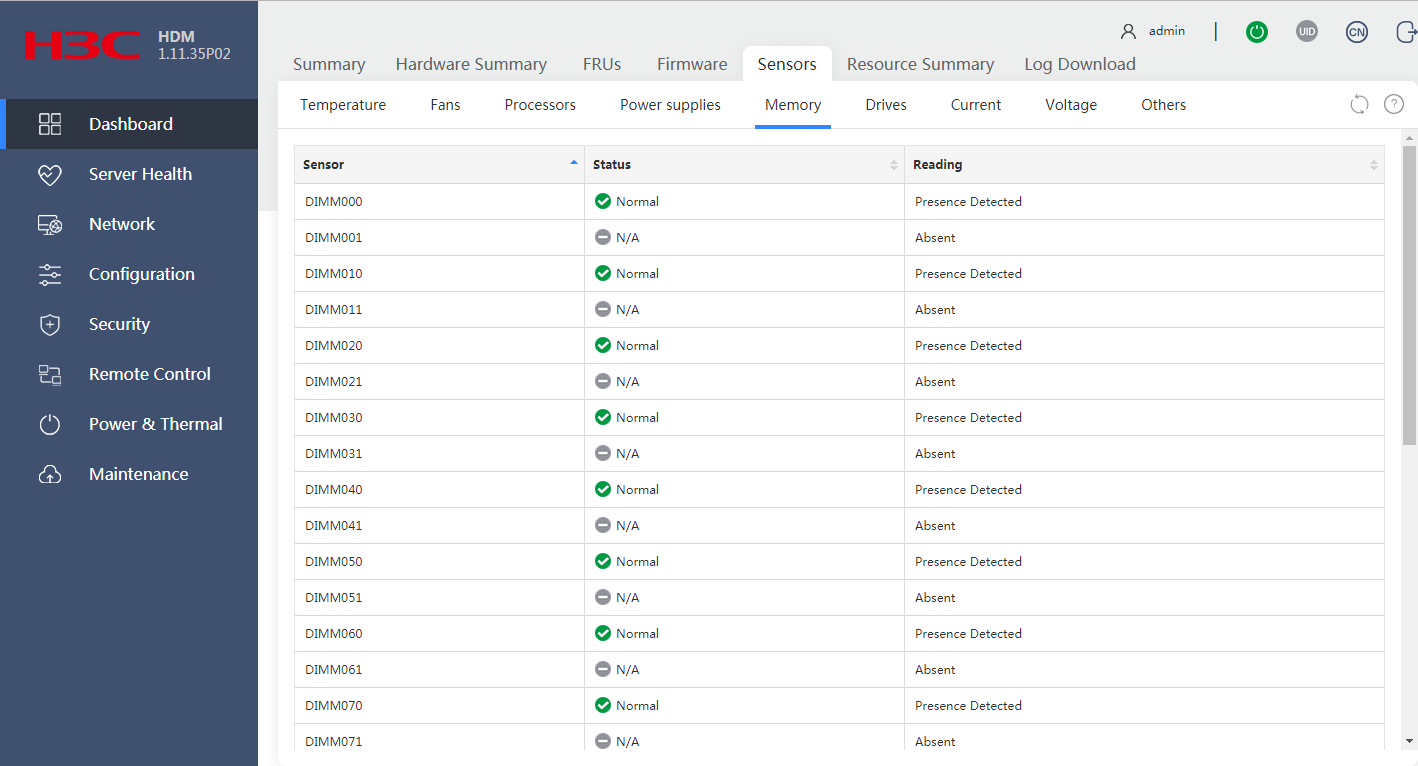
Parameters
· Status: Presence and operating status of memory. Options include:
¡ Normal—No memory error is present.
¡ Absent—Memory is absent.
¡ Minor/Major/Critical—Memory error is present.
· Reading: Reading of the memory sensor.
View drive status
The following sensors monitor the presence status of each drive:
· HDD_Fnumber_Status—Monitors the presence of a front-installed HDD.
· HDD_Rnumber_Status—Monitors the presence of a rear-installed HDD.
· NVME_Fnumber_Status—Monitors the presence of a front-installed NVMe SSD.
The number argument represents the number of the drive.
Restrictions and guidelines
The drive UID LED is unavailable for M.2 drives when the server is powered off.
The drive UID LED is unavailable for a drive if the Fault/UID LED of the drive is steady amber.
Procedure
1. In the navigation pane, select Dashboard > Sensors.
2. Click the Drives tab to view drive status, as shown in Figure 69.
Figure 69 Viewing drive status
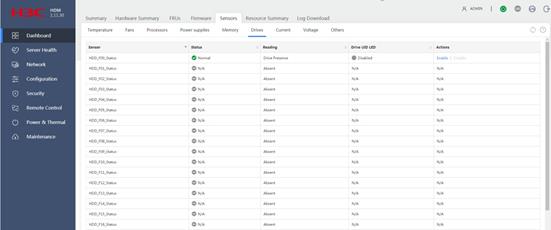
Parameters
· Status: Operating status of the drive. Options include:
¡ Normal—The drive is operating correctly.
¡ N/A—The drive is not present.
¡ Minor/Major/Critical—A drive fault is present. The error code is displayed in the Reading field.
· Reading: Reading of the drive sensor. The available readings are defined in IPMI.
· Drive UID LED: Status of the drive UID LED function. Options include:
¡ Enabled—The drive Fault/UID LED is steady blue for drive locating.
¡ Disabled—The drive Fault/UID LED status varies by drive status.
· Actions: Select whether to enable the drive UID LED function. Options include:
¡ Enable.
¡ Disable.
View status of electrical current
The electrical current sensor (OverCurrent) monitors the electrical current in the server.
Procedure
1. In the navigation pane, select Dashboard > Sensors.
2. Click the Current tab to view electrical current status and readings, as shown in Figure 70.
Figure 70 Viewing electrical current status

Parameters
· Status: Presence of electrical current fault. Options include:
¡ Normal—No electrical current fault is present.
¡ Major—Electrical current fault is present.
· Reading: Reading of the electrical current sensor.
View status of voltage
The voltage sensors monitor the voltage on each server component.
The following are types of voltage sensors:
· Sensors with a _PG suffix (for example, CPU1_DDR_VPP1_PG). These sensors monitor the components for the presence of voltage faults.
· Sensors without a _PG suffix (for example, P1_VDD_18_RUN). These sensors monitor the components for voltage threshold crossing events.
Procedure
1. In the navigation pane, select Dashboard > Sensors.
2. Click the Voltage tab to view voltage status and readings, as shown in Figure 71.
Figure 71 Viewing voltage status
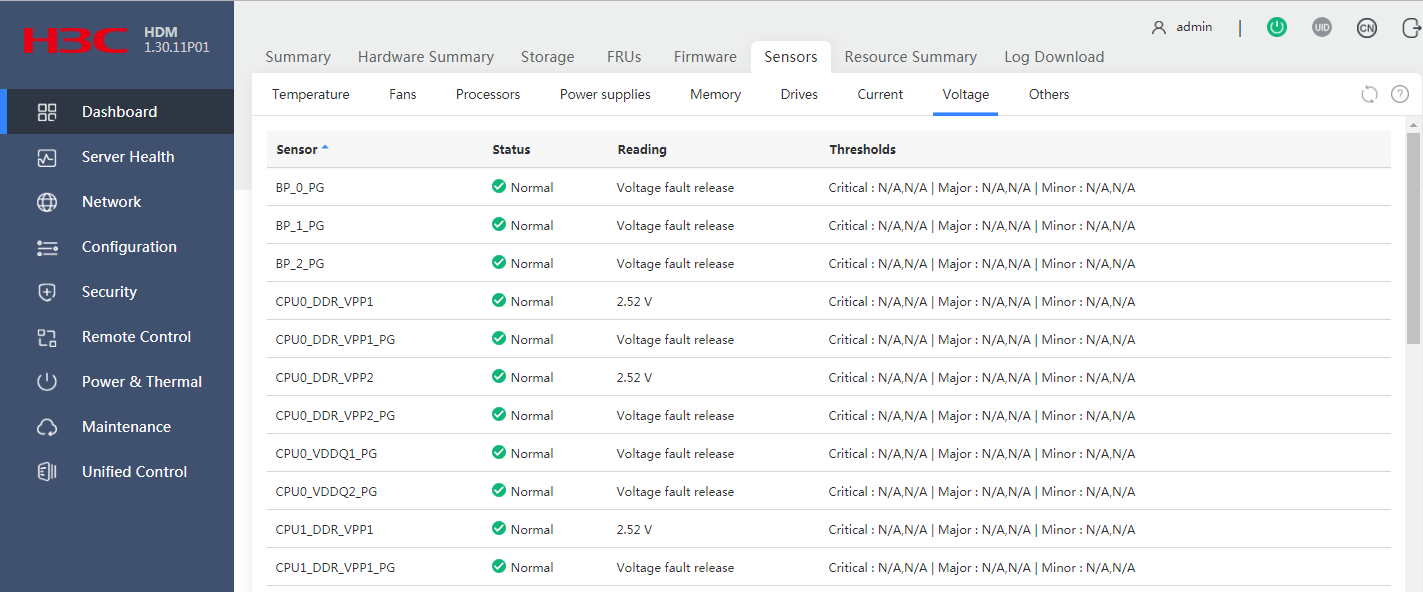
Parameters
Sensors with a _PG suffix
· Status: Presence of voltage fault. Options include:
¡ Normal—No voltage fault is present.
¡ Major—Voltage fault is present.
· Reading: Reading of the voltage sensor. The reading indicates whether a voltage fault is present.
Sensors without a _PG suffix
· Status: Voltage status. Options include:
¡ Normal—The voltage is between the lower minor threshold (exclusive) and upper minor threshold (exclusive).
¡ N/A—The component is absent or the voltage value cannot be obtained.
¡ Major—The voltage exceeds the upper major threshold or drops below the lower major threshold.
· Reading: Voltage detected by the sensor. This field displays N/A if the component is absent or the voltage value cannot be obtained.
· Thresholds: Voltage thresholds:
¡ Critical—Lower and upper critical thresholds.
¡ Major—Lower and upper major thresholds.
¡ Minor—Lower and upper minor thresholds.
If a threshold is not specified, N/A is displayed.
View event log status
The event log sensor (SEL_sensor) monitors status of the event log.
Procedure
1. In the navigation page, select Dashboard > Sensors.
2. In the work pane, click the Others tab, as shown in Figure 72.
3. In the SEL section, view status and reading of the event log sensor.
Figure 72 Viewing event log status

Parameters
· Status: Running status of the event log sensor. Options include:
¡ Normal—The event log is operating correctly or the event log has been cleared or reset.
¡ Minor—The log is full or the number of event log entries has exceeded 75% of the event log size.
· Reading: Reading of the event log sensor.
View operating system status
The operating system sensor (Watchdog2) monitors the operating system (OS) of the server for system crash events and restarts the OS upon detection of an OS crash.
Procedure
1. In the navigation page, select Dashboard > Sensors.
2. In the work pane, click the Others tab, as shown in Figure 73.
3. In the Watchdog2 section, view status and reading of the OS sensor.
Figure 73 Viewing operating system status

Parameters
· Status: Running status of the OS. Options include:
¡ Normal—The server OS is operating correctly.
¡ Minor—Indicates that a timer interruption or timer expiration event has occurred.
¡ Major—Indicates that a power supply hot restart, power-off, or power-cycle operation expired.
· Reading: Reading of the OS sensor.
View physical security status
The physical security sensor (AreaIntrusion) monitors the server chassis for physical access events. When the chassis is opened, the sensor reports an event log. When the chassis is closed, the sensor does not report.
Procedure
1. In the navigation page, select Dashboard > Sensors.
2. In the work pane, click the Others tab, as shown in Figure 74.
3. In the Physical security section, view physical security status.
Figure 74 Viewing physical security status
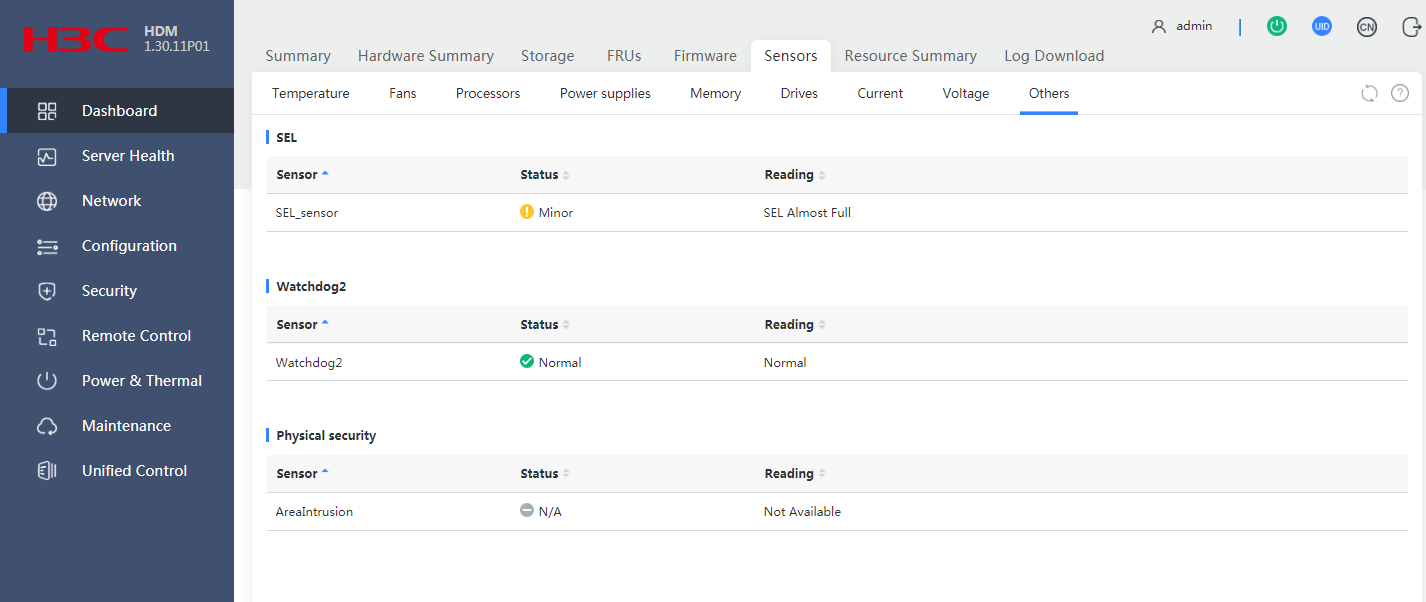
Parameters
· Status: Running status of the sensor. Options include:
¡ Normal—The chassis is closed.
¡ Minor—That the chassis is opened.
¡ N/A—The chassis-open alarm module is not present.
· Reading: Reading of the physical status sensor.
Sensors (for the R4300 and X10000)
The Sensors menu displays data collected by each sensor in the system. You can use the sensor data to monitor the health state of the server and identify the cause when the system health deteriorates.
View status and temperature readings of temperature sensors
HDM presents temperature data in both heatmap and table formats to help you monitor the cooling performance of the server.
· The temperature heatmaps use colors between green and red to show the temperature distribution inside the server chassis in 3D view and uses circles to represent sensors. Green indicates 0°C (32°F). As the temperature gets higher, the color gets warmer until it changes to red. With the temperature heatmaps, you can quickly identify the component that is in a poor cooling condition.
· The temperature sensor table displays the temperature reading, status, and coordinates of each sensor.
Restrictions and guidelines
The temperature heatmaps do not display sensors whose reading is negative.
Procedure
1. In the navigation pane, select Dashboard > Sensors.
2. In the work pane, click the Temperature tab, as shown in Figure 75.
3. To obtain the name, status, and reading of the sensor at a location, hover the mouse over the circle at that location on a temperature heatmap.
Figure 75 Viewing temperature sensor information
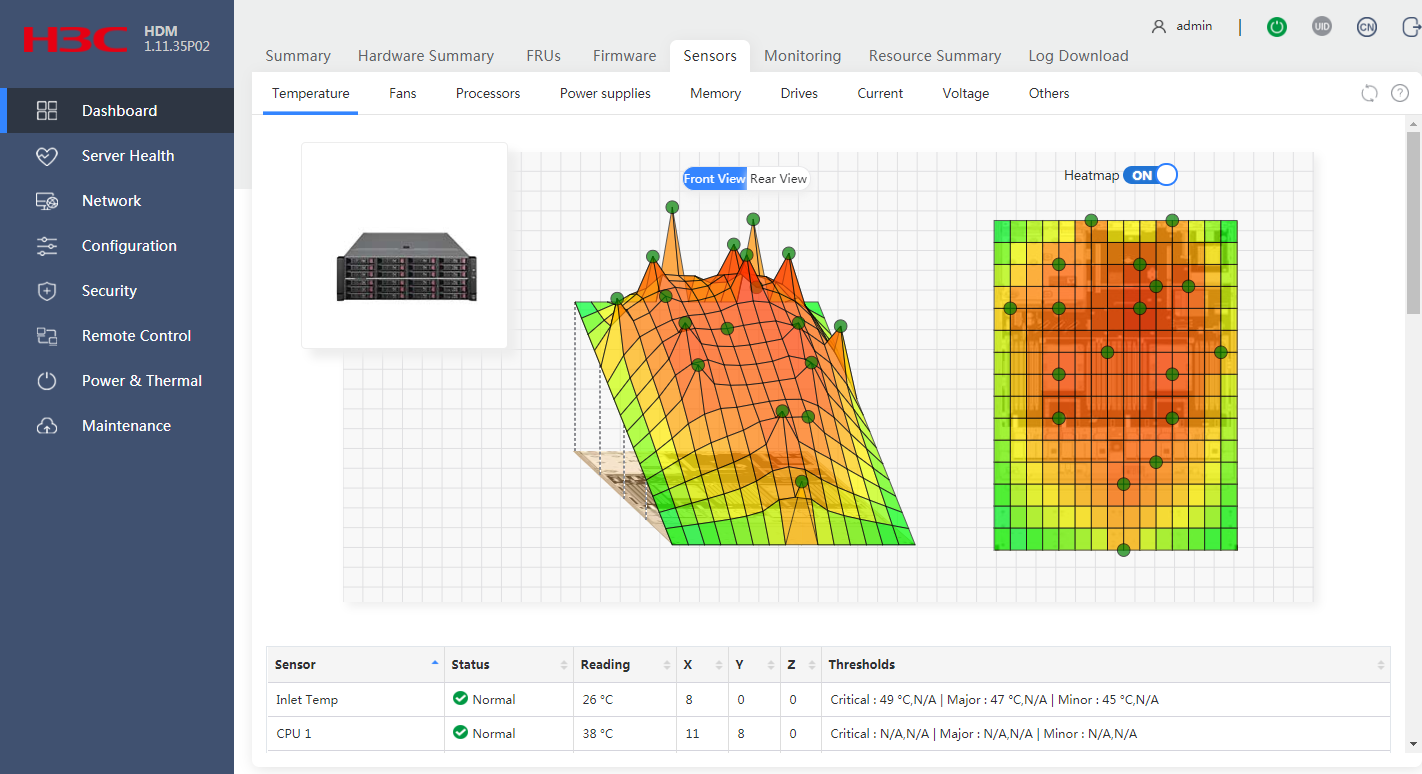
Parameters
· Status: Temperature status of a component:
¡ Normal—The temperature is normal, between the lower and upper minor thresholds (exclusive). No action is required.
¡ Minor—The temperature is between the lower major threshold (exclusive) and lower minor threshold (inclusive) or between the upper minor threshold (inclusive) and upper major threshold exclusive). Administrative attention is required.
¡ Major—The temperature is between the lower critical threshold (exclusive) and lower major threshold (inclusive) or between the upper major threshold (inclusive) and upper critical threshold (exclusive). Immediate action is required.
¡ Critical—The temperature is equal to or below the lower critical threshold, or it is equal to or above the upper critical threshold. Immediate action is required.
¡ N/A—The monitored component is not installed or the temperature sensor cannot be read.
· Reading: Current temperature. If HDM fails to obtain the sensor reading, this field displays N/A.
· X: Location of the sensor on the X axis.
· Y: Location of the sensor on the Y axis.
· Z: Server in which the sensor is located. The value 0 indicates the current server.
· Thresholds: Temperature thresholds:
¡ Critical—Lower and upper critical thresholds. When the temperature reaches either threshold, the server might automatically shut down to avoid damage to its components.
¡ Major—Lower and upper major thresholds. If the temperature reaches either threshold, server performance will significantly degrade.
¡ Minor—Lower and upper minor thresholds. If the temperature reaches either threshold, server performance will slightly degrade.
If a threshold is not specified, N/A is displayed.
View status and speed of each fan
Each server fan has a status sensor and a speed sensor, which are named FANnumber_F/R_Status and FANnumber_F/R_Speed, respectively. The number argument represents the number of the fan module. The F and R keywords represent the front and rear fans in a fan module, respectively.
Each power supply fan has a speed sensor named PSUnumber_FanSpeed. The number argument represents the number of the power supply.
Procedure
1. In the navigation pane, select Dashboard > Sensors.
2. Click the Fans tab to view running status and rotation speed (in RPM) of each fan, as shown in Figure 76.
Figure 76 Viewing status and speed of each fan
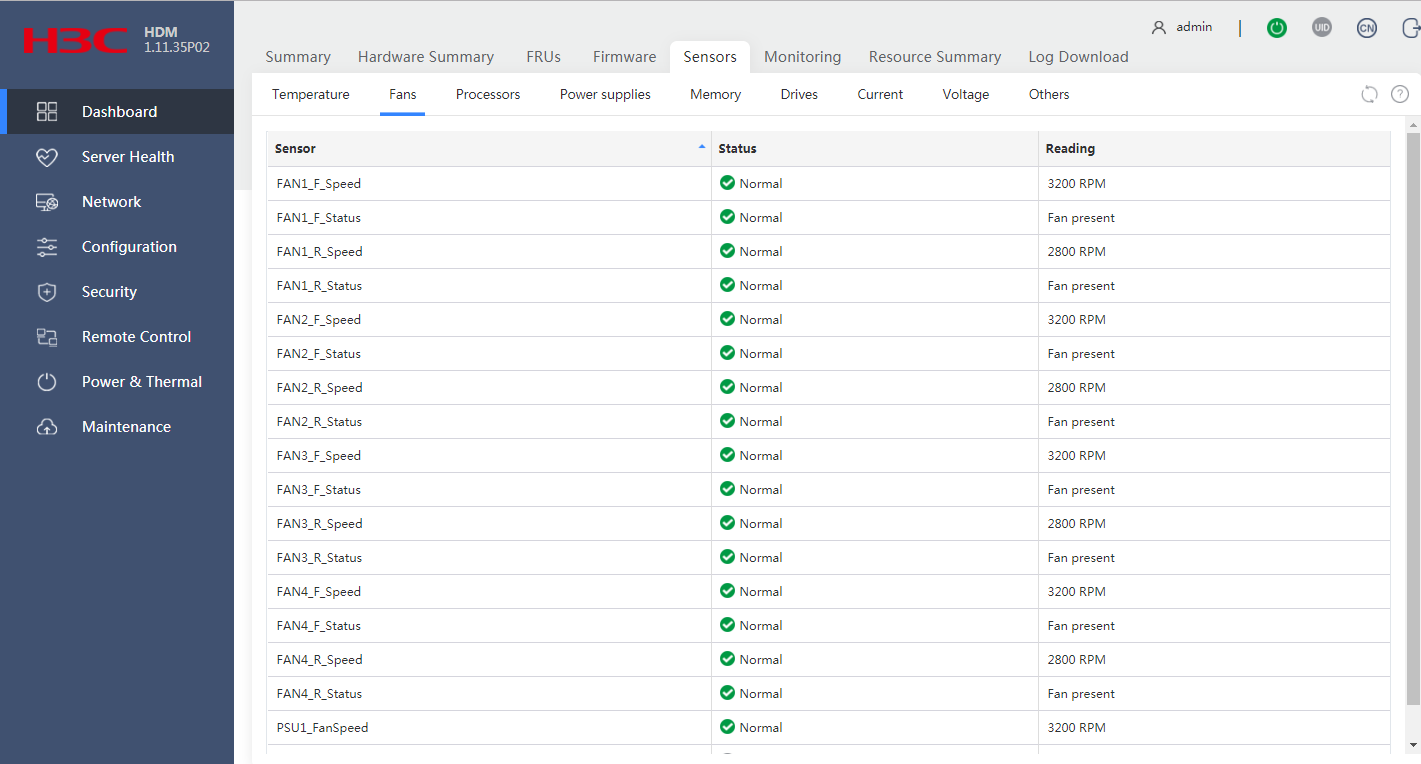
Parameters
FANnumber_F/R_Status sensors
· Status: Running status of the fan:
¡ Normal—The fan is operating correctly.
¡ Minor—Fan rotation speed has undesirably slowed down, or the fan is absent or installed incorrectly.
· Reading: Operating status of the fan.
FANnumber_F/R_Speed sensors
· Status: Presence of the fan. Options include:
¡ Normal—The fan is present and operating correctly.
¡ N/A—The fan is absent or a fan rotation anomaly is present.
· Reading: RPM of the fan.
PSUnumber_FanSpeed sensors
· Status: Presence of the fan. Options include:
¡ Normal—The power supply fan is operating correctly.
¡ N/A—The power supply is absent or the fan is faulty.
· Reading: RPM of the fan.
View status of each processor
Each processor has a status sensors named in the format of CPUnumber_Status. The number argument represents the number of the processor.
Procedure
1. In the navigation pane, select Dashboard > Sensors.
2. Click the Processors tab to view status of each processor, as shown in Figure 77.
Figure 77 Viewing processor status
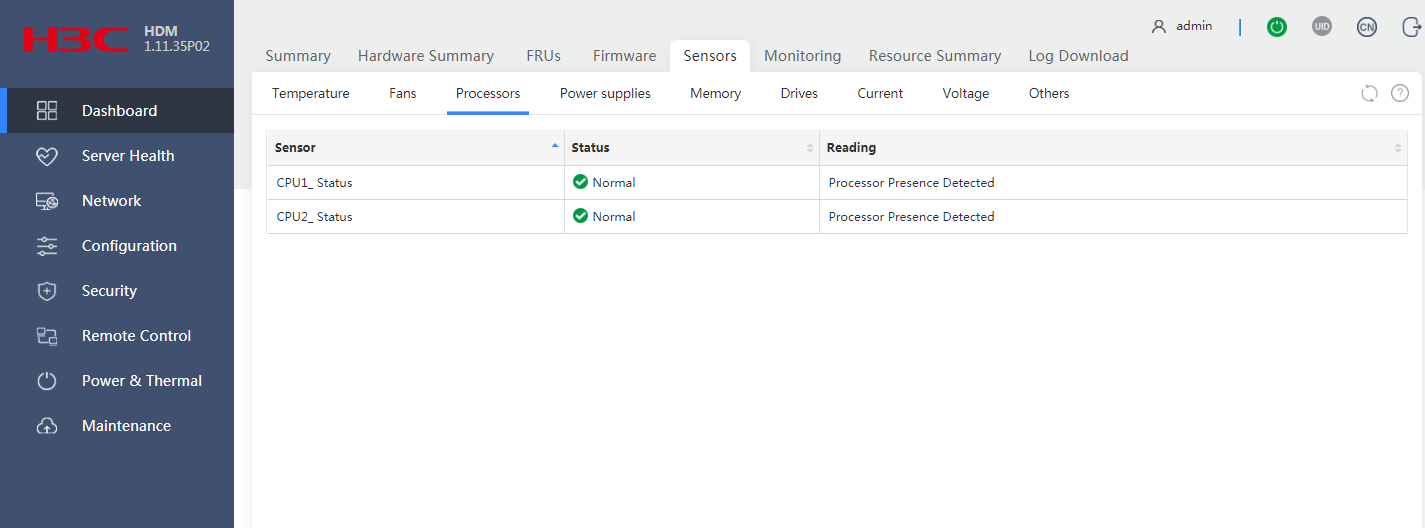
Parameters
CPUnumber_Status sensors
· Status: Status of the processor.
¡ Normal—The processor is present.
¡ Minor—A recoverable error occurred on the processor.
¡ Critical—An unrecoverable error occurred on the processor, or the temperature of the sensor has exceeded the critical threshold. When the temperature of the sensor exceeds the critical threshold, the server automatically shuts down.
¡ N/A—The processor is absent.
· Reading: Processor sensor reading.
View power supply status
The server provides the following sensors for monitoring the power status of power supplies and the server:
· CPUnumber_Power—Monitors the power status of a processor. The number argument represents the number of the processor.
· MEM_Total_Power—Monitors the power status of present DIMMs.
· PSUnumber_PIN—Monitors the input of a power supply. The number argument represents the number of the power supply.
· PSUnumber_Status—Monitors the running status of a power supply. The number argument represents the number of the power supply.
Procedure
1. In the navigation pane, select Dashboard > Sensors.
2. Click the Power supplies tab to view status and power input of each power supply and the server, as shown in Figure 78.
Figure 78 Viewing power supply status
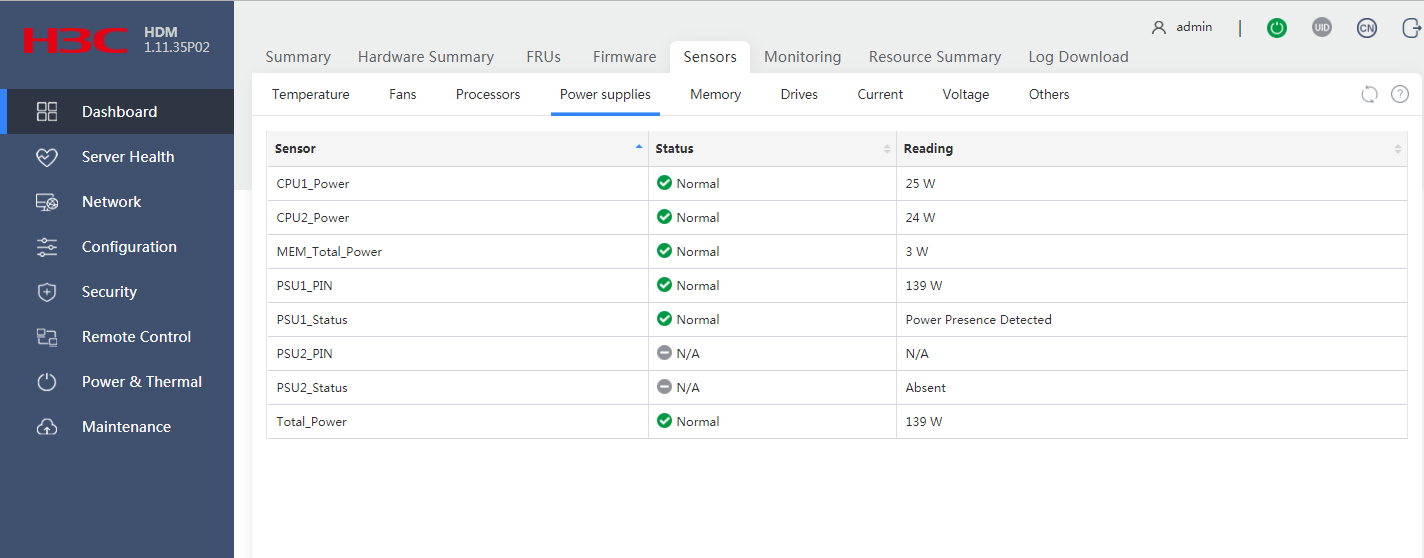
Parameters
CPUnumber_Power sensor
· Status: Power status of the processor. Options include:
¡ Normal—The processor is present and the server is powered on.
¡ N/A—The processor is absent or the server is powered off.
· Reading: Current total power of the present processors.
MEM_Total_Power sensor
· Status: Power status of DIMMs. Options include:
¡ Normal—DIMMs are present and the server is powered on.
¡ N/A—No DIMM is present or the server is powered off.
· Reading: Current total power of the present DIMMs.
PSUnumber_PIN sensors
· Status: Power input status of the power supply. Options include:
¡ Normal—Power input is normal.
¡ N/A—No power input exists.
· Reading: Current input power.
PSUnumber_Status sensors
· Status: Running status of the power supply. Options include:
¡ Normal—The power supply is operating correctly or in cold standby state.
¡ Minor—The power supply is in Early warning or Modules not matching state.
¡ Major—The power supply is in one of the following states: Failed, No input, Input beyond the range.
¡ N/A—The power supply is absent.
· Reading: Reading of the power supply status sensor. Options include:
¡ In cold standby state.
¡ Early warning.
¡ Failed.
¡ No input.
¡ Input beyond the range.
¡ Modules not matching.
View memory status
The memory sensors monitor the memory modules of processors in the server. The memory sensors are named in the CPU1_DIMM_Anumber or CPU2_DIMM_Bnumber format.
Procedure
1. In the navigation pane, select Dashboard > Sensors.
2. Click the Memory tab to view memory status, as shown in Figure 79.
Figure 79 Viewing memory status
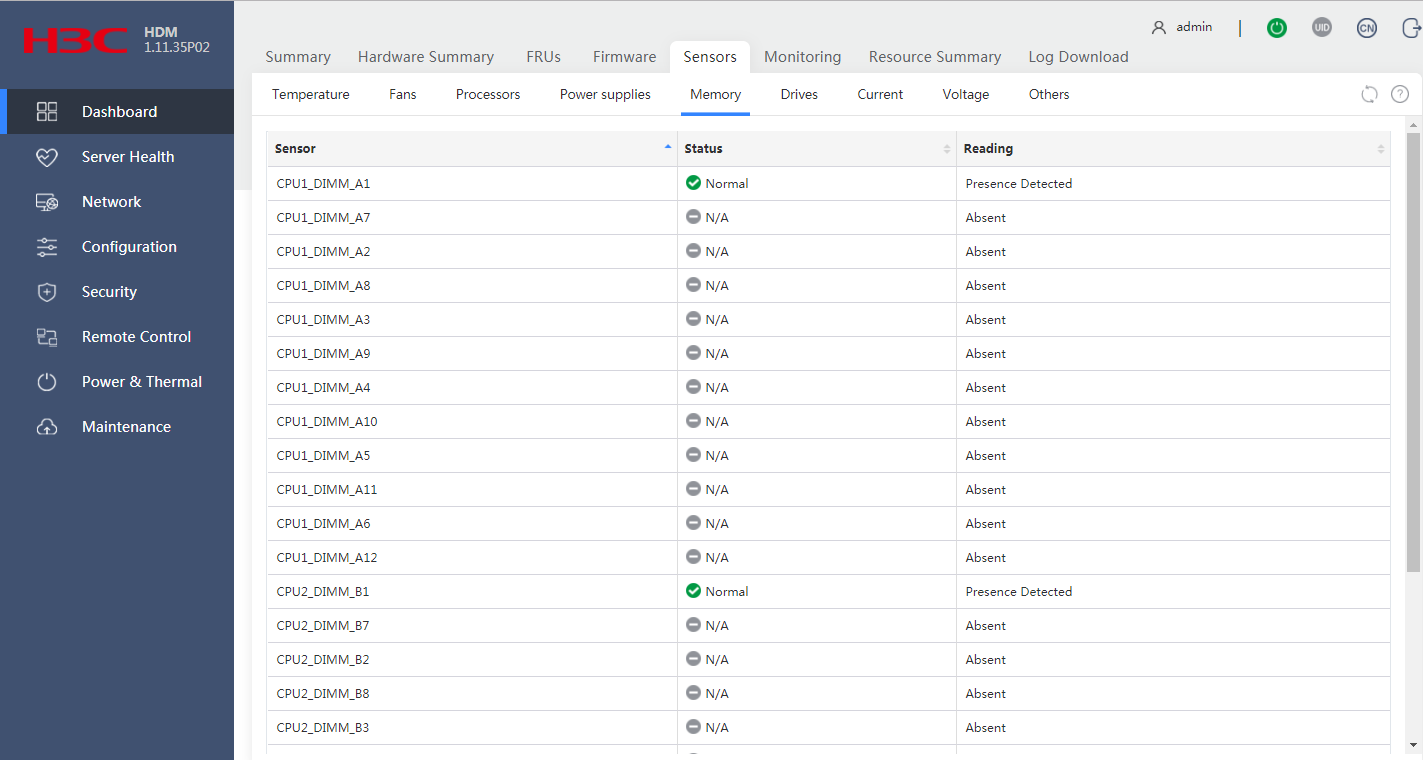
Parameters
· Status: Presence and operating status of memory. Options include:
¡ Normal—No memory error is present.
¡ Absent—Memory is absent.
¡ Minor/Major/Critical—Memory error is present.
· Reading: Reading of the memory sensor.
View drive status
Each HDD in the server has a drive sensor. The sensor for an HDD at the server front is named HDD_Fnumber_Status and the sensor for an HDD at the server rear is named HDD_Rnumber_Status.
Restrictions and guidelines
The drive UID LED is unavailable for M.2 drives when the server is powered off.
The drive UID LED is unavailable for a drive if the Fault/UID LED of the drive is steady amber.
The drive UID LED is available only for the R4300.
Procedure
1. In the navigation pane, select Dashboard > Sensors.
2. Click the Drives tab to view drive status, as shown in Figure 80.
Figure 80 Viewing drive status
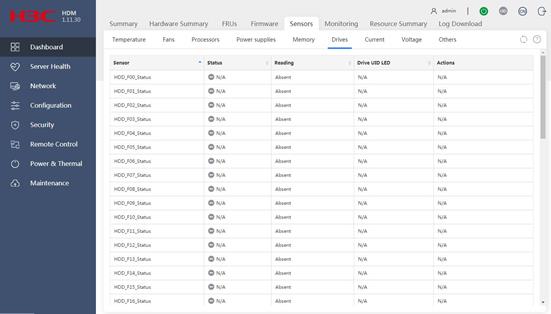
Parameters
· Status: Operating status of the drive. Options include:
¡ Normal—The drive is operating correctly.
¡ N/A—The drive is not present.
¡ Minor/Major/Critical—A drive fault is present. The error code is displayed in the Reading field.
· Reading: Reading of the drive sensor. The available readings are defined in IPMI.
· Drive UID LED: Status of the drive UID LED function. Options include:
¡ Enabled—The drive Fault/UID LED is steady blue for drive locating.
¡ Disabled—The drive Fault/UID LED status varies by drive status.
· Actions: Select whether to enable the drive UID LED function. Options include:
¡ Enable.
¡ Disable.
View status of electrical current
The electrical current sensor (OverCurrent) monitors the electrical current in the server.
Procedure
1. In the navigation pane, select Dashboard > Sensors.
2. Click the Current tab to view electrical current status and readings, as shown in Figure 81.
Figure 81 Viewing electrical current status
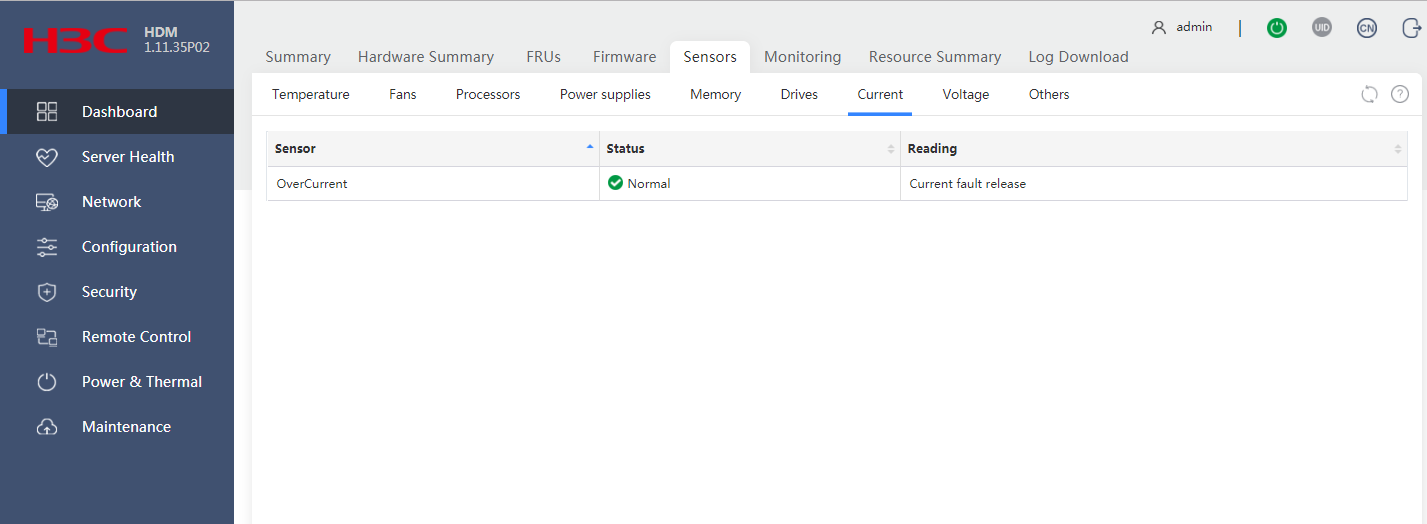
Parameters
· Status: Presence of electrical current fault. Options include:
¡ Normal—No electrical current fault is present.
¡ Major—Electrical current fault is present.
· Reading: Reading of the electrical current sensor.
View status of voltage
The voltage sensors monitor the voltage on each server component.
The following are types of voltage sensors:
· Sensors with a _PG suffix (for example, CPU1_DDR_VPP1_PG). These sensors monitor the components for the presence of voltage faults.
· Sensors without a _PG suffix (for example, CPU1_DDR_VPP1). These sensors monitor the components for voltage threshold crossing events.
Procedure
1. In the navigation pane, select Dashboard > Sensors.
2. Click the Voltage tab to view voltage status and readings, as shown in Figure 82.
Figure 82 Viewing voltage status
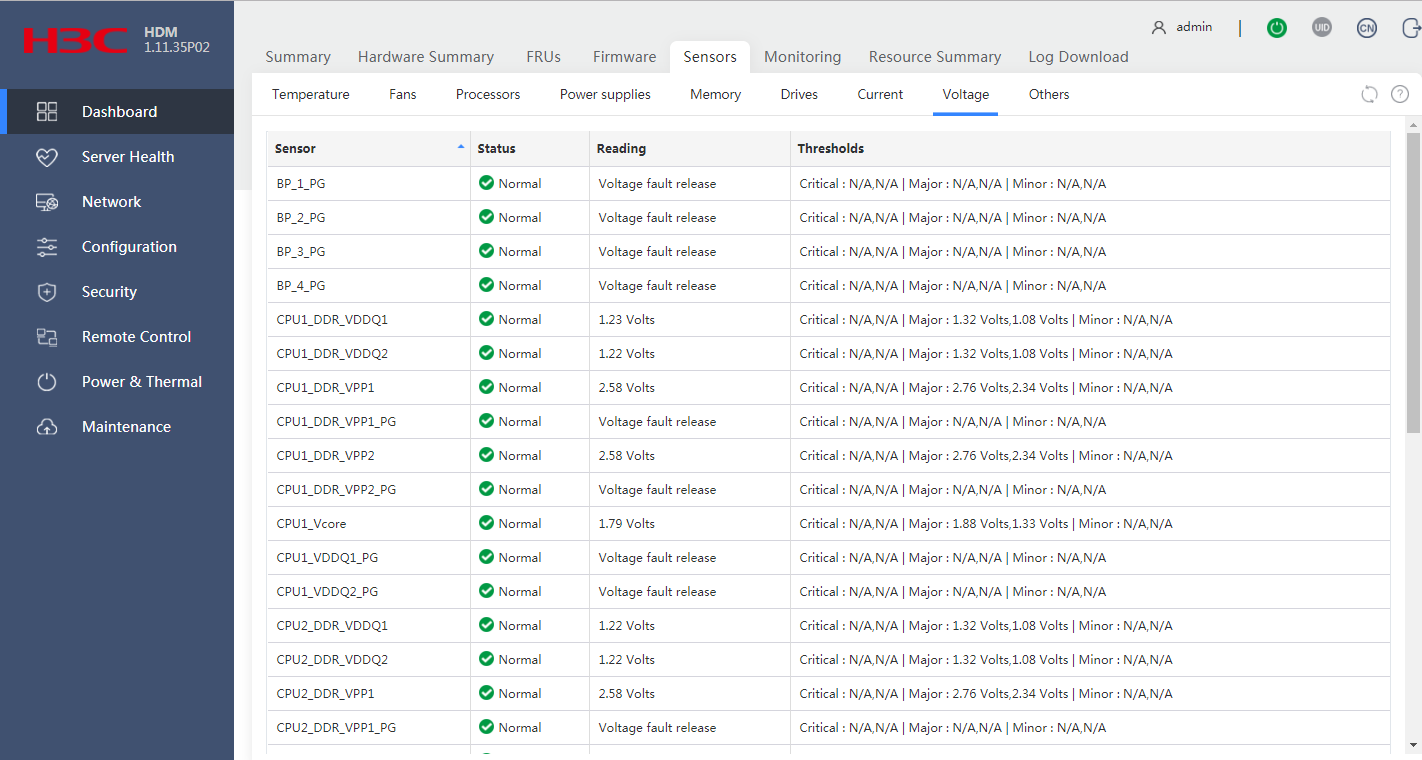
Parameters
Sensors with a _PG suffix
· Status: Presence of voltage fault. Options include:
¡ Normal—No voltage fault is present.
¡ Major—Voltage fault is present.
· Reading: Reading of the voltage sensor. The reading indicates whether a voltage fault is present.
Sensors without a _PG suffix
· Status: Voltage status. Options include:
¡ Normal—The voltage is between the lower minor threshold (exclusive) and upper minor threshold (exclusive).
¡ N/A—The component is absent or the voltage value cannot be obtained.
¡ Major—The voltage exceeds the upper major threshold or drops below the lower major threshold. In this state, server performance degrades significantly.
· Reading: Voltage detected by the sensor. This field displays N/A if the component is absent or the voltage value cannot be obtained.
· Thresholds: Voltage thresholds:
¡ Critical—Lower and upper critical thresholds.
¡ Major—Lower and upper major thresholds.
¡ Minor—Lower and upper minor thresholds.
If a threshold is not specified, N/A is displayed.
View event log status
The event log sensor (SEL_sensor) monitors status of the event log.
Procedure
1. In the navigation page, select Dashboard > Sensors.
2. In the work pane, click the Others tab, as shown in Figure 83.
3. In the SEL section, view status and reading of the event log sensor.
Figure 83 Viewing event log status

Parameters
· Status: Running status of the event log sensor. Options include:
¡ Normal—The event log is operating correctly or the event log has been cleared or reset.
¡ Minor—The log is full or the number of event log entries has exceeded 75% of the event log size.
· Reading: Reading of the event log sensor.
View operating system status
The operating system sensor (Watchdog2) monitors the operating system (OS) of the server for system crash events and restarts the OS upon detection of an OS crash.
Procedure
1. In the navigation page, select Dashboard > Sensors.
2. In the work pane, click the Others tab, as shown in Figure 84.
3. In the Watchdog2 section, view status and reading of the OS sensor.
Figure 84 Viewing operating system status
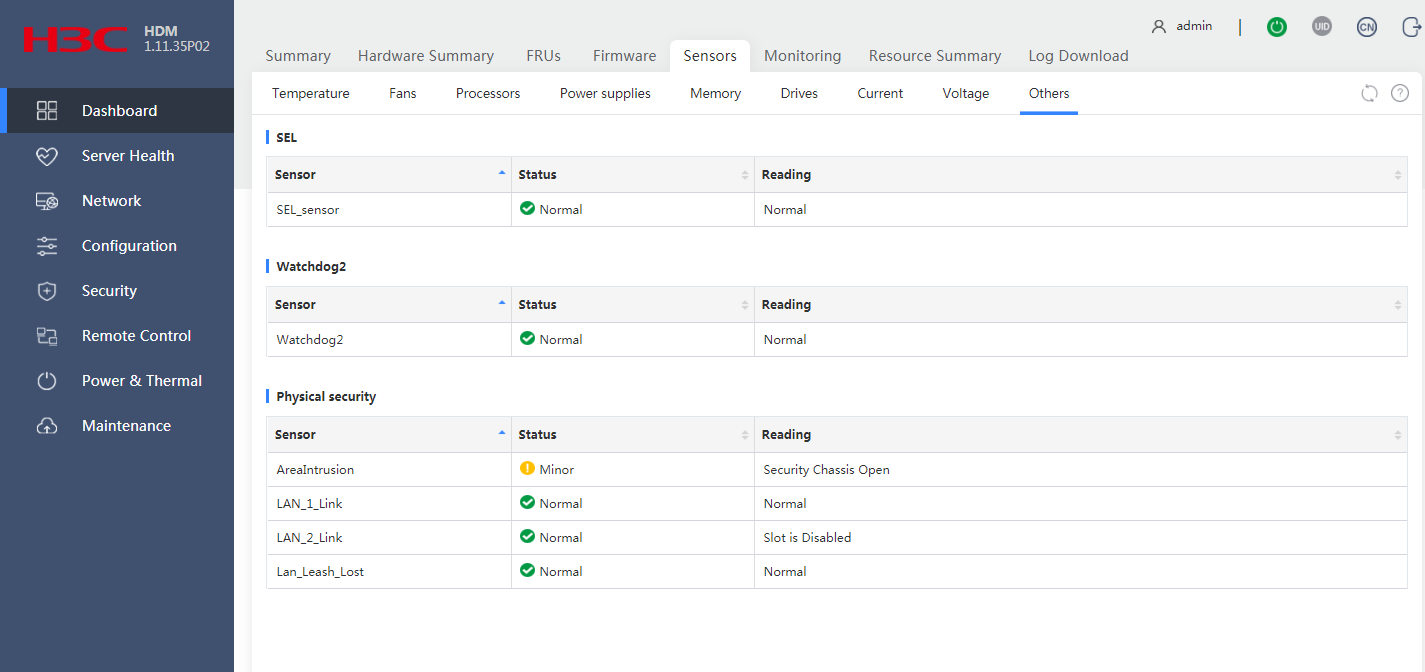
Parameters
· Status: Running status of the OS. Options include:
¡ Normal—The server OS is operating correctly.
¡ Minor—Indicates that a timer interruption or timer expiration event has occurred.
¡ Major—Indicates that a power supply hot restart, power-off, or power-cycle operation expired.
· Reading: Reading of the OS sensor.
View physical security status
The server provides the following sensors for monitoring server physical access events and the status of shared network ports:
· AreaIntrusion—Monitors the server chassis for physical access events. When the chassis is opened, the sensor reports an event log. When the chassis is closed, the sensor does not report.
· Lan_Leash_Lost—Monitors the status of all shared network ports.
Procedure
1. In the navigation page, select Dashboard > Sensors.
2. In the work pane, click the Others tab, as shown in Figure 85.
3. In the Physical security section, view physical security status.
Figure 85 Viewing physical security status

Parameters
AreaIntrusion sensor
· Status: Running status of the sensor. Options include:
¡ Normal—The chassis is closed.
¡ Minor—That the chassis is opened.
¡ N/A—The chassis-open alarm module is not present.
· Reading: Reading of the physical status sensor.
Lan_Leash_Lost sensor
· Status: Running status of the shared network ports in the server. Options include:
¡ Normal—A minimum of one shared network port is enabled.
¡ N/A—No shared network port exists or all shared network ports are operating incorrectly.
· Reading: Reading of the sensor.
Sensors (for the AE100, B5700, B5800, and B7800)
The Sensors menu displays data collected by each sensor in the system. You can use the sensor data to monitor the health state of the server and identify the cause when the system health deteriorates.
The available sensor types vary by server model.
View status and temperature readings of temperature sensors
HDM presents temperature data in both heatmap format and table format to help you monitor the cooling performance of the server.
· The temperature heatmaps use colors between green and red to show the temperature distribution inside the server chassis in 3D view and uses circles to represent sensors. Green indicates 0°C (32°F). As the temperature gets higher, the color gets warmer until it changes to red. With the temperature heatmaps, you can quickly identify the component that is in a poor cooling condition.
· The temperature sensor table displays the temperature reading, status, and coordinates of each sensor.
Restrictions and guidelines
The temperature heatmaps do not display sensors whose reading is negative.
Procedure
1. In the navigation pane, select Dashboard > Sensors.
2. In the work pane, click the Temperature tab, as shown in Figure 86.
3. To obtain the name, status, and reading of the sensor at a location, hover the mouse over the circle at that location on a temperature heatmap.
Figure 86 Viewing temperature sensor information
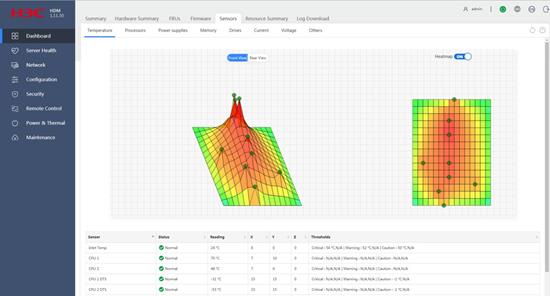
Parameters
· Status: Temperature status of a component:
¡ Normal—The temperature is normal, between the lower and upper minor thresholds (exclusive). No action is required.
¡ Minor—The temperature is between the lower major threshold (exclusive) and lower minor threshold (inclusive) or between the upper minor threshold (inclusive) and upper major threshold exclusive). Administrative attention is required.
¡ Major—The temperature is between the lower critical threshold (exclusive) and lower major threshold (inclusive) or between the upper major threshold (inclusive) and upper critical threshold (exclusive). Immediate action is required.
¡ Critical—The temperature is equal to or below the lower critical threshold, or it is equal to or above the upper critical threshold. Immediate action is required.
¡ N/A—The monitored component is not installed or the temperature sensor cannot be read.
· Reading: Current temperature. If HDM fails to obtain the sensor reading, this field displays N/A.
· X: Location of the sensor on the X axis.
· Y: Location of the sensor on the Y axis.
· Z: Server in which the sensor is located. The value 0 indicates the current server.
· Thresholds: Temperature thresholds:
¡ Critical—Lower and upper critical thresholds. When the temperature reaches either threshold, the server might automatically shut down to avoid damage to its components.
¡ Major—Lower and upper major thresholds. If the temperature reaches either threshold, server performance will significantly degrade.
¡ Minor—Lower and upper minor thresholds. If the temperature reaches either threshold, server performance will slightly degrade.
If a threshold is not specified, N/A is displayed.
View status of each processor
Each processor has a temperature sensor named in the format of CPUnumber_Prochot and an operating status sensor named in the format of CPUnumber_Status. The number argument represents the number of the processor.
Procedure
1. In the navigation pane, select Dashboard > Sensors.
2. Click the Processors tab to view status of each processor, as shown in Figure 87.
Figure 87 Viewing processor status
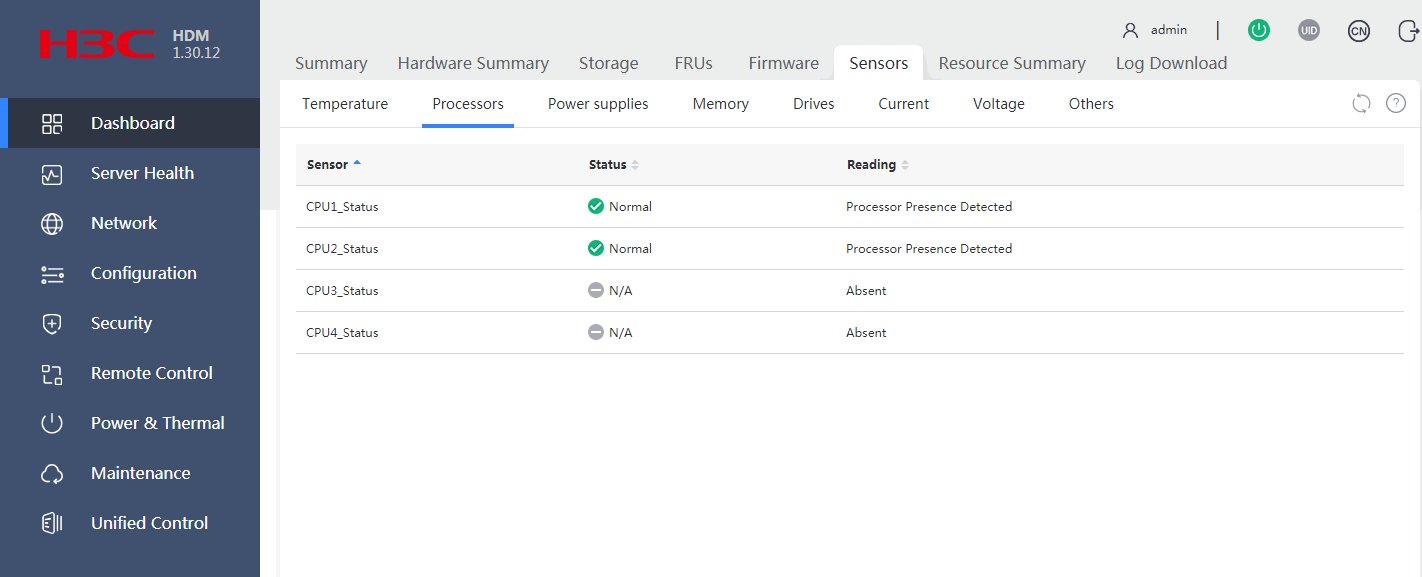
Parameters
CPUnumber_Prochot sensors
· Status: PROCHOT alarm status on the processor.
¡ Normal—The processor is present.
¡ Major—A PROCHOT alarm is generated because of high processor temperature. The processor is underclocked if the alarm occurs.
¡ N/A—The processor is absent.
· Reading: Processor sensor reading.
CPUnumber_Status sensors
· Status: Status of the processor.
¡ Normal—The processor is present.
¡ Minor—A recoverable error occurred on the processor.
¡ Critical—An unrecoverable error occurred on the processor, or the temperature of the sensor has exceeded the critical threshold. When the temperature of the sensor exceeds the critical threshold, the server automatically shuts down.
¡ N/A—The processor is absent.
· Reading: Processor sensor reading.
View power supply status
Each power supply has a status sensor named in the format of PSUnumber_PIN. The number argument represents the number of the power supply.
Procedure
1. In the navigation pane, select Dashboard > Sensors.
2. Click the Power supplies tab to view status and power input of each power supply, as shown in Figure 88.
Figure 88 Viewing power supply status
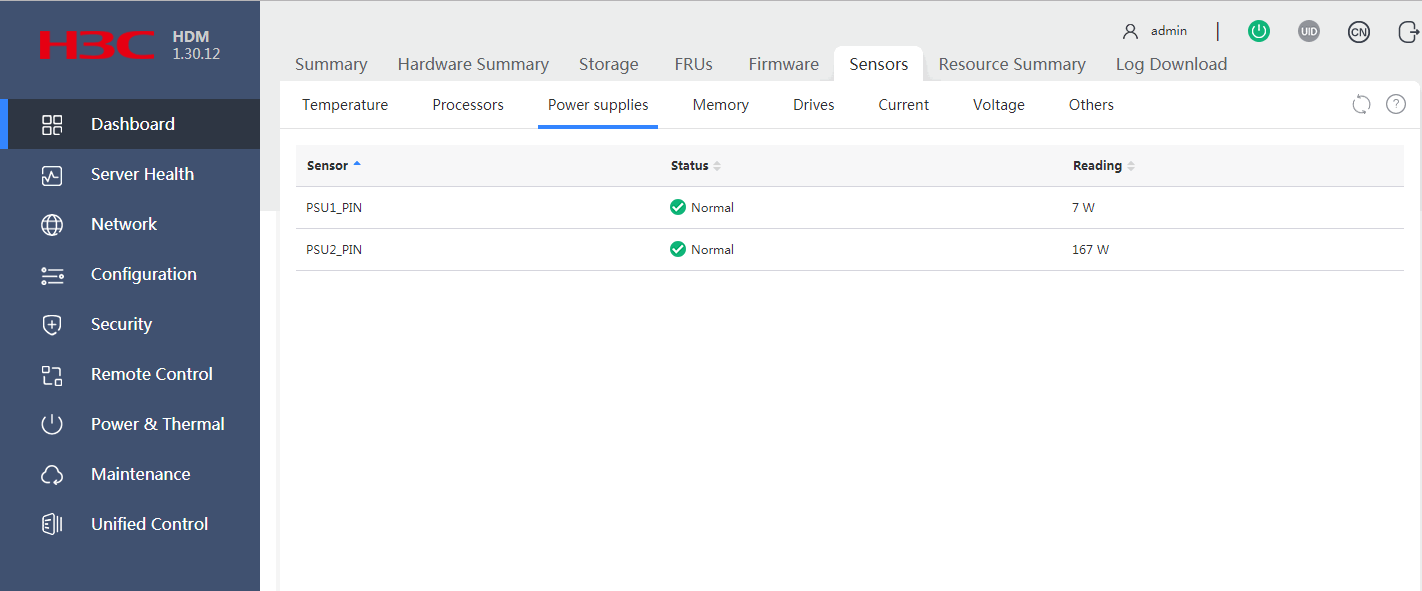
Parameters
PSUnumber_PIN sensors
· Status: Power input status of the power supply. Options include:
¡ Normal—Power input is normal.
¡ N/A—No power input exists.
· Reading: Current input power.
View memory status
The memory sensors monitor the memory modules of processors in the server. The memory sensors are named in the CPU1_DIMM_Anumber, CPU2_DIMM_Bnumber, CPU3_DIMM_Cnumber, or CPU4_DIMM_Dnumber format.
Procedure
1. In the navigation pane, select Dashboard > Sensors.
2. Click the Memory tab to view memory status, as shown in Figure 89.
Figure 89 Viewing memory status
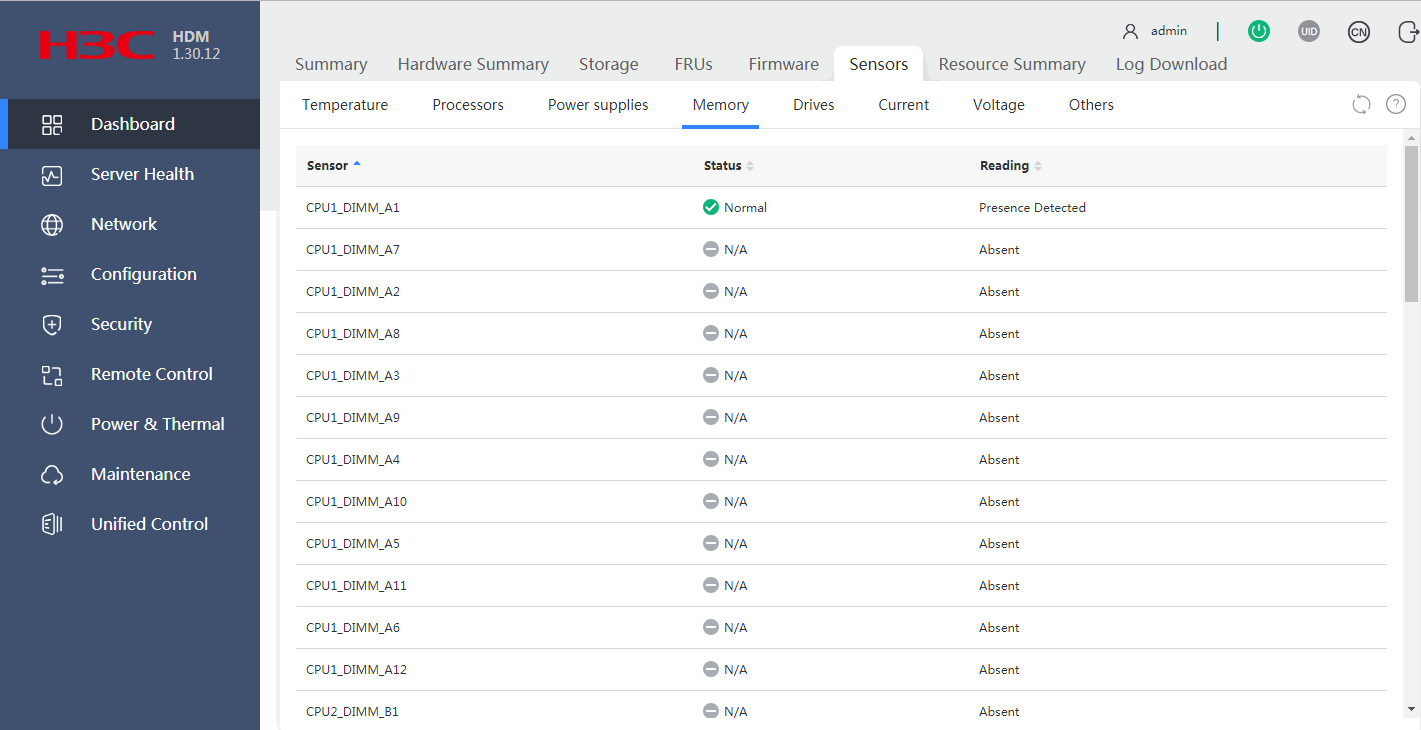
Parameters
· Status: Presence and operating status of memory. Options include:
¡ Normal—No memory error is present.
¡ N/A—Memory is absent.
¡ Minor/Major/Critical—Memory error is present.
· Reading: Reading of the memory sensor.
View drive status
Each drive, an HDD, SSD, or NVMe drive, in the server has a drive sensor. The sensor for a drive at the server front is named DISK_Fnumber_Status.
Restrictions and guidelines
The drive UID LED is unavailable for M.2 drives when the server is powered off.
The drive UID LED is unavailable for a drive if the Fault/UID LED of the drive is steady amber.
Procedure
1. In the navigation pane, select Dashboard > Sensors.
2. Click the Drives tab to view drive status, as shown in Figure 90.
Figure 90 Viewing drive status
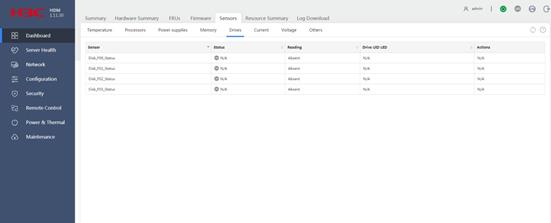
Parameters
· Status: Operating status of the drive. Options include:
¡ Normal—The drive is operating correctly.
¡ N/A—The drive is not present.
¡ Minor/Major/Critical—A drive fault is present. The error code is displayed in the Reading field.
· Reading: Reading of the drive sensor. The available readings are defined in IPMI.
· Drive UID LED: Status of the drive UID LED function. Options include:
¡ Enabled—The drive Fault/UID LED is steady blue for drive locating.
¡ Disabled—The drive Fault/UID LED status varies by drive status.
· Actions: Select whether to enable the drive UID LED function. Options include:
¡ Enable.
¡ Disable.
View status of electrical current
The server provides a sensor named OverCurrent to monitor the electrical current in the server and a power supply sensor named PSUnumber_IOUT to monitor the output current of each power supply. The number argument represents the number of the power supply.
Procedure
1. In the navigation pane, select Dashboard > Sensors.
2. Click the Current tab to view electrical current status and readings, as shown in Figure 91.
Figure 91 Viewing electrical current status
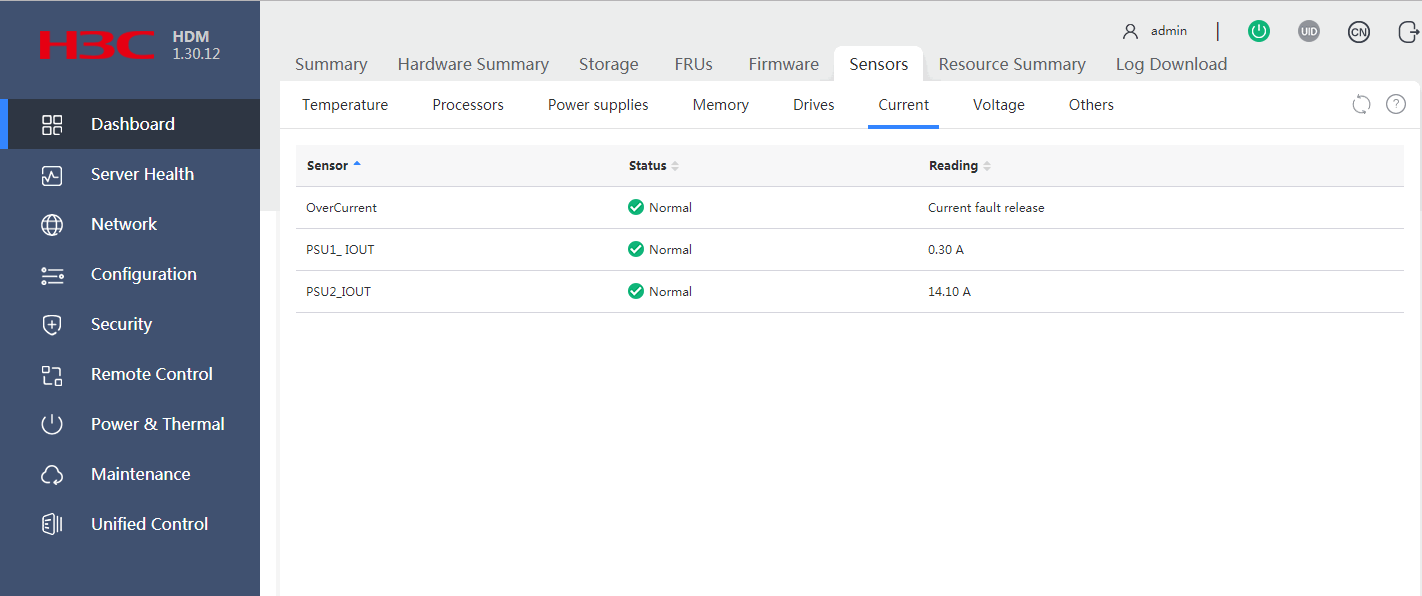
Parameters
OverCurrent sensor
· Status: Presence of electrical current fault. Options include:
¡ Normal—No electrical current fault is present.
¡ Major—Electrical current fault is present.
· Reading: Reading of the electrical current sensor.
PSUnumber_IOUT sensors
· Status: Status of the output current from the power supply. Options include:
¡ Normal—The output current from the power supply is normal.
¡ N/A—The output current from the power supply is abnormal.
· Reading: Value of the output current.
View status of voltage
The server provides the following voltage sensors to monitor the voltage on each server component:
· CPUnumber_Vcore.
· PSUnumber_VIN.
· SYS_12V.
· SYS_3V3.
· SYS_5V.
Procedure
1. In the navigation pane, select Dashboard > Sensors.
2. Click the Voltage tab to view voltage status and readings, as shown in Figure 92.
Figure 92 Viewing voltage status
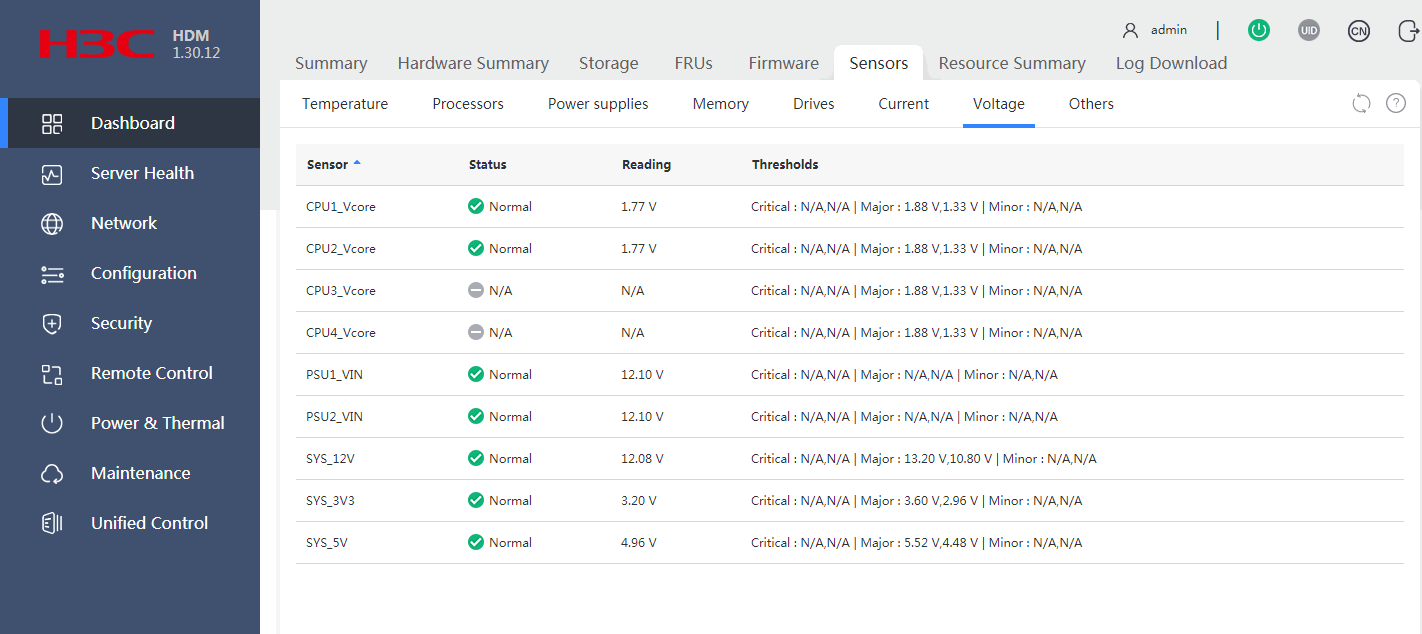
Parameters
· Status: Voltage status. Options include:
¡ Normal—The voltage is between the lower minor threshold (exclusive) and upper minor threshold (exclusive).
¡ N/A—The component is absent or the voltage value cannot be obtained.
¡ Major—The voltage exceeds the upper major threshold or drops below the lower major threshold. In this state, server performance degrades significantly.
· Reading: Voltage detected by the sensor. This field displays N/A if the component is absent or the voltage value cannot be obtained.
· Thresholds: Voltage thresholds:
¡ Critical—Lower and upper critical thresholds.
¡ Major—Lower and upper major thresholds.
¡ Minor—Lower and upper minor thresholds.
If a threshold is not specified, N/A is displayed.
View event log status
The event log sensor (SEL_sensor) monitors status of the event log.
Procedure
1. In the navigation page, select Dashboard > Sensors.
2. In the work pane, click the Others tab, as shown in Figure 93.
3. In the SEL section, view status and reading of the event log sensor.
Figure 93 Viewing event log status
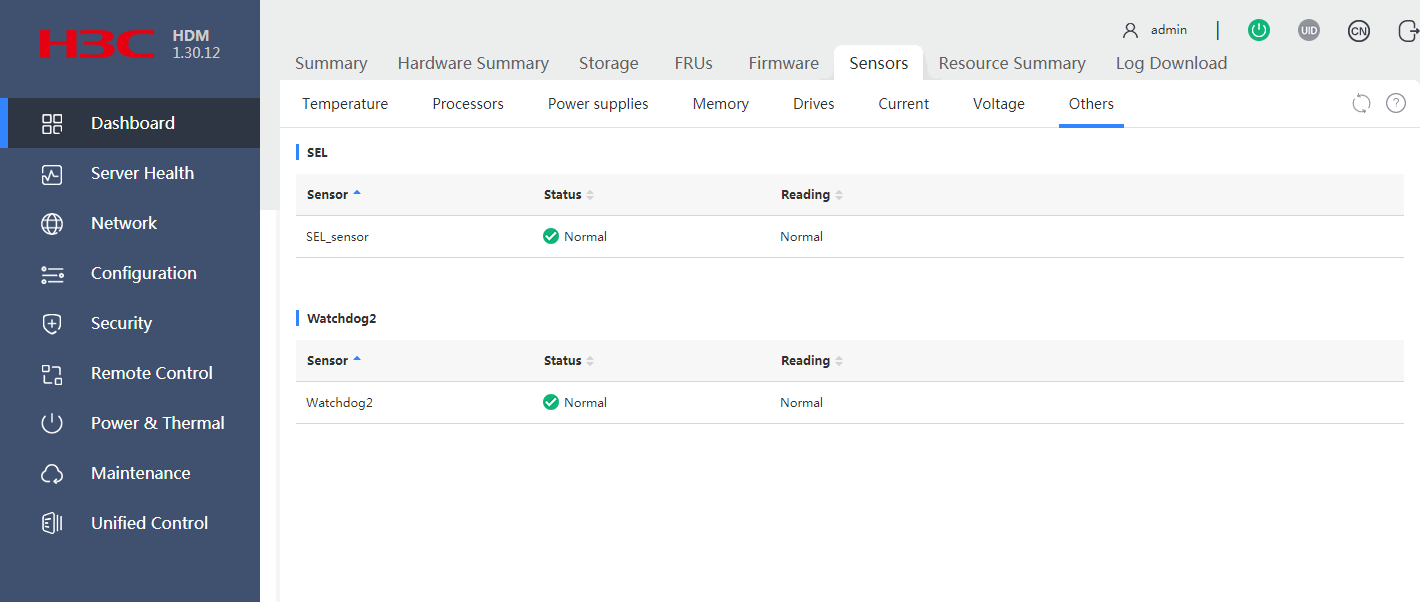
Parameters
· Status: Running status of the event log sensor. Options include:
¡ Normal—The event log is operating correctly or the event log has been cleared or reset.
¡ Minor—The log is full or the number of event log entries has exceeded 75% of the event log size.
· Reading: Reading of the event log sensor.
View operating system status
The operating system sensor (Watchdog2) monitors the operating system (OS) of the server for system crash events and restarts the OS upon detection of an OS crash.
Procedure
1. In the navigation page, select Dashboard > Sensors.
2. In the work pane, click the Others tab, as shown in Figure 94.
3. In the Watchdog2 section, view status and reading of the OS sensor.
Figure 94 Viewing operating system status

Parameters
· Status: Running status of the OS. Options include:
¡ Normal—The server OS is operating correctly.
¡ Minor—Indicates that a timer interruption or timer expiration event has occurred.
¡ Major—Indicates that a power supply hot restart, power-off, or power-cycle operation expired.
· Reading: Reading of the OS sensor.
Sensors (for the R8900)
The Sensors menu displays data collected by each sensor in the system. You can use the sensor data to monitor the health state of the server and identify the cause when the system health deteriorates.
View status and temperature readings of temperature sensors
HDM presents temperature data in both heatmap and table formats to help you monitor the cooling performance of the server.
· The temperature heatmaps use colors between green and red to show the temperature distribution inside the server chassis in 3D view and uses circles to represent sensors. Green indicates 0°C (32°F). As the temperature gets higher, the color gets warmer until it changes to red. With the temperature heatmaps, you can quickly identify the component that is in a poor cooling condition.
· The temperature sensor table displays the temperature reading, status, and coordinates of each sensor.
Restrictions and guidelines
The temperature heatmaps do not display sensors whose reading is negative.
Procedure
1. In the navigation pane, select Dashboard > Sensors.
2. In the work pane, click the Temperature tab, and then select a compute module from the upper left corner of the workspace, as shown in Figure 95.
3. To obtain the name, status, and reading of the sensor at a location, hover the mouse over the circle at that location on a temperature heatmap.
Figure 95 Viewing temperature sensor information
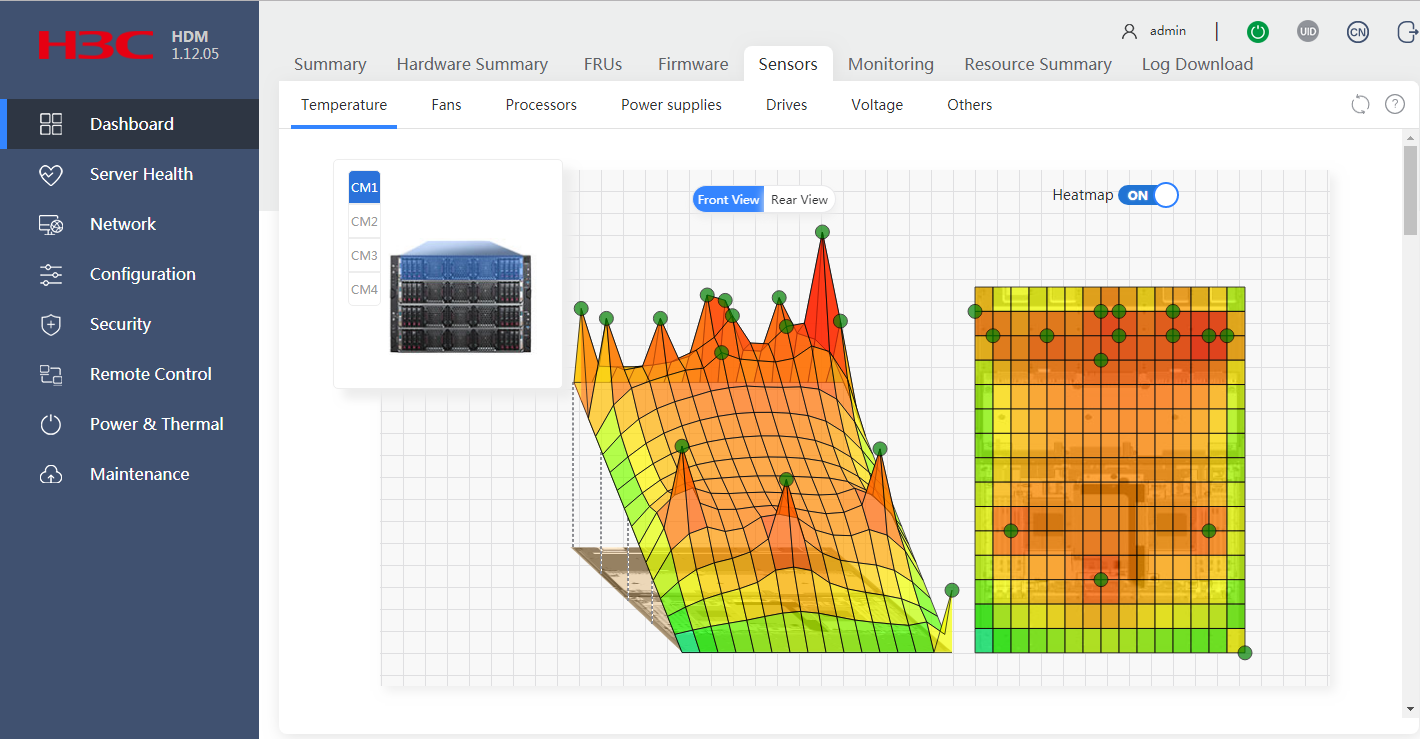
Parameters
· Status: Temperature status of a component:
¡ Normal—The temperature is normal, between the lower and upper minor thresholds (exclusive). No action is required.
¡ Minor—The temperature is between the lower major threshold (exclusive) and lower minor threshold (inclusive) or between the upper minor threshold (inclusive) and upper major threshold exclusive). Administrative attention is required.
¡ Major—The temperature is between the lower critical threshold (exclusive) and lower major threshold (inclusive) or between the upper major threshold (inclusive) and upper critical threshold (exclusive). Immediate action is required.
¡ Critical—The temperature is equal to or below the lower critical threshold, or it is equal to or above the upper critical threshold. Immediate action is required.
¡ N/A—The monitored component is not installed or the temperature sensor cannot be read.
· Reading: Current temperature. If HDM fails to obtain the sensor reading, this field displays N/A.
· X: Location of the sensor on the X axis.
· Y: Location of the sensor on the Y axis.
· Z: Number of the compute module in which the server resides. The value 0 indicates that the sensor is shared by all compute modules in the server.
· Thresholds: Temperature thresholds:
¡ Critical—Lower and upper critical thresholds. When the temperature reaches either threshold, the server might automatically shut down to avoid damage to its components.
¡ Major—Lower and upper major thresholds. If the temperature reaches either threshold, server performance will significantly degrade.
¡ Minor—Lower and upper minor thresholds. If the temperature reaches either threshold, server performance will slightly degrade.
If a threshold is not specified, N/A is displayed.
View status and speed of each fan
Each server fan has a status sensor and a speed sensor, which are named CMnumber FANnumber_Status and CMnumber FANnumber_F/R_Speed, respectively. The number argument in CMnumber represents the number of the compute module and the number argument in FANnumber represents the number of the fan module. The F and R keywords represent the front and rear fans in a fan module, respectively.
Procedure
1. In the navigation pane, select Dashboard > Sensors.
2. Click the Fans tab to view running status and rotation speed (in RPM) of each fan, as shown in Figure 96.
Figure 96 Viewing running status and rotation speed of each fan
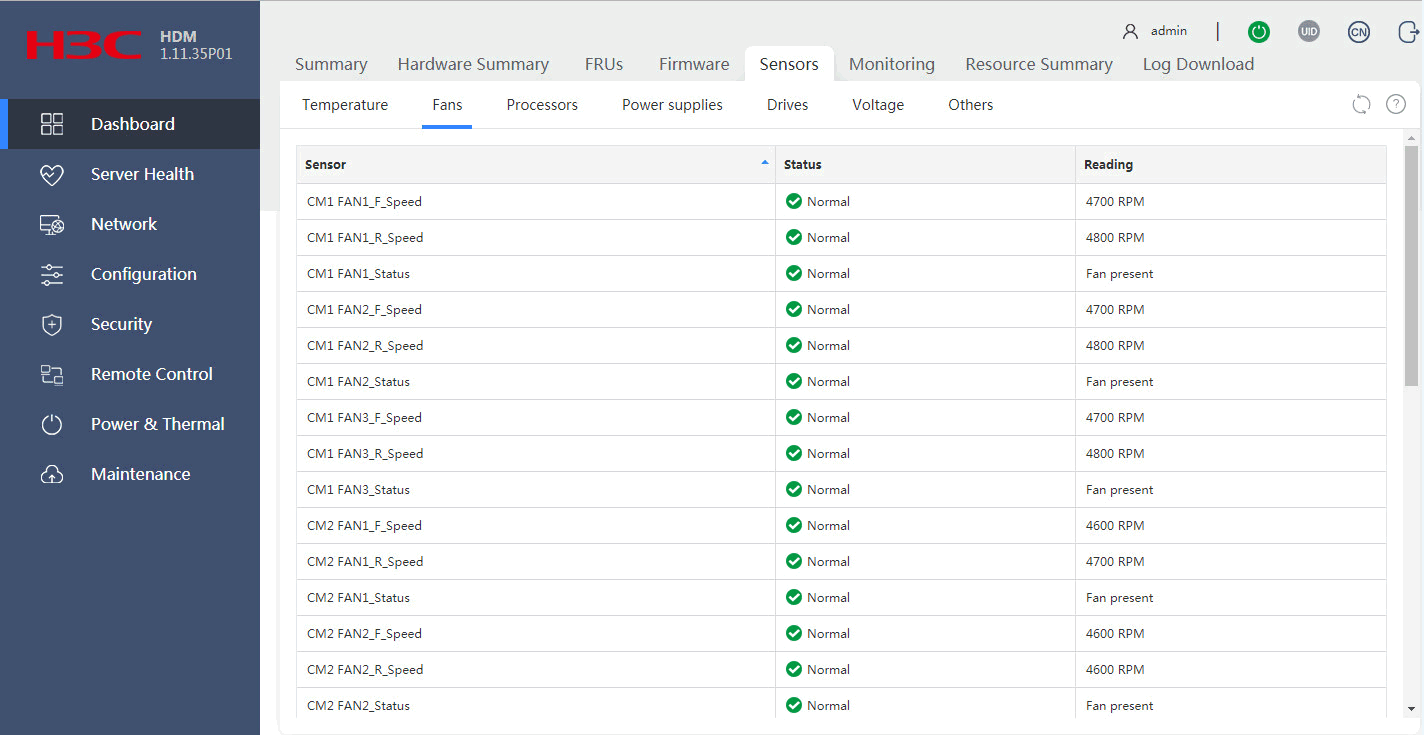
Parameters
CMnumber FANnumber_Status sensors
· Status: Running status of the fan:
¡ Normal—The fan is operating correctly.
¡ Minor—Fan rotation speed has undesirably slowed down, or the fan is absent or is installed incorrectly.
¡ N/A—The compute module is absent.
· Reading: Operating status of the fan.
FANnumber_F/R_Speed sensors
· Status: Presence of the fan. Options include:
¡ Normal—The fan is present and operating correctly.
¡ N/A—One of the following conditions exists:
- The compute module is absent.
- The compute module is operating correctly, but the fan is absent.
- The fan is installed incorrectly.
· Reading: RPM of the fan.
View status of each processor
Each processor has two status sensors, which are named in the formats of CMnumber CPUnumber_Prochot and CMnumber CPUnumber_Status, respectively. The number argument in CMnumber represents the number of the compute module. The number argument in CPUnumber represents the number of the processor.
Procedure
1. In the navigation pane, select Dashboard > Sensors.
2. Click the Processors tab to view status of each processor, as shown in Figure 97.
Figure 97 Viewing processor status
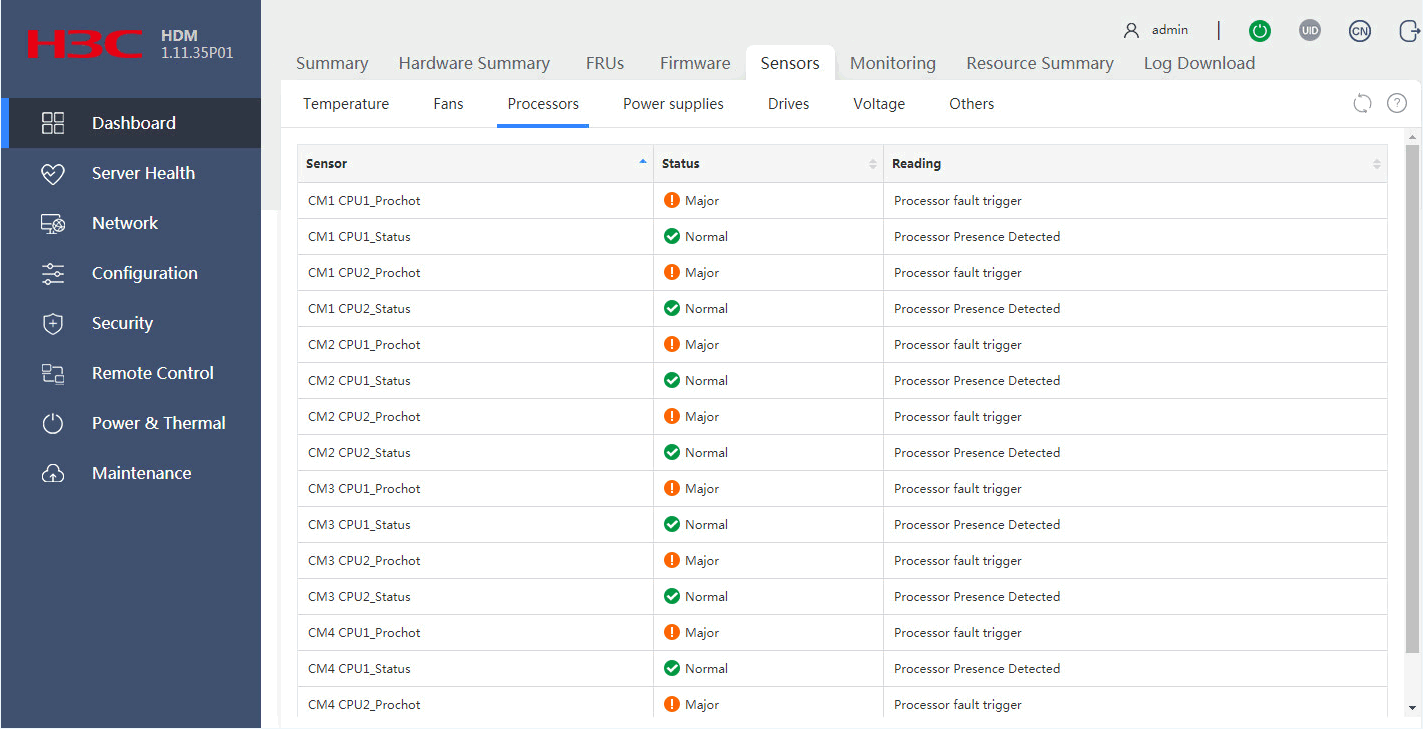
Parameters
CMnumber CPUnumber_Prochot sensors
· Status: PROCHOT alarm status of the processor.
¡ Normal—The processor is operating correctly.
¡ Major—A PROCHOT alarm is generated because of high processor temperature. The processor is underclocked if the alarm occurs.
¡ N/A—The processor is absent.
· Reading: Processor sensor reading.
CMnumber CPUnumber_Status sensors
· Status: Status of the processor.
¡ Normal—The processor is operating correctly.
¡ Minor—A recoverable error occurred on the processor.
¡ Critical—An unrecoverable error occurred on the processor, or the temperature of the sensor has exceeded the critical threshold. When the temperature of the sensor exceeds the critical threshold, the server automatically shuts down.
¡ N/A—The processor is absent.
· Reading: Processor sensor reading.
View power supply status
The server provides the following sensors for monitoring the power status of power supplies and the server:
· PSUnumber_PIN—Monitors the input of a power supply. The number argument represents the number of the power supply.
· PSUnumber_Status—Monitors the running status of a power supply. The number argument represents the number of the power supply.
· Total_Power—Monitors the power status of the server.
Procedure
1. In the navigation pane, select Dashboard > Sensors.
2. Click the Power supplies tab to view status and power input of each power supply and the server, as shown in Figure 98.
Figure 98 Viewing power supply status
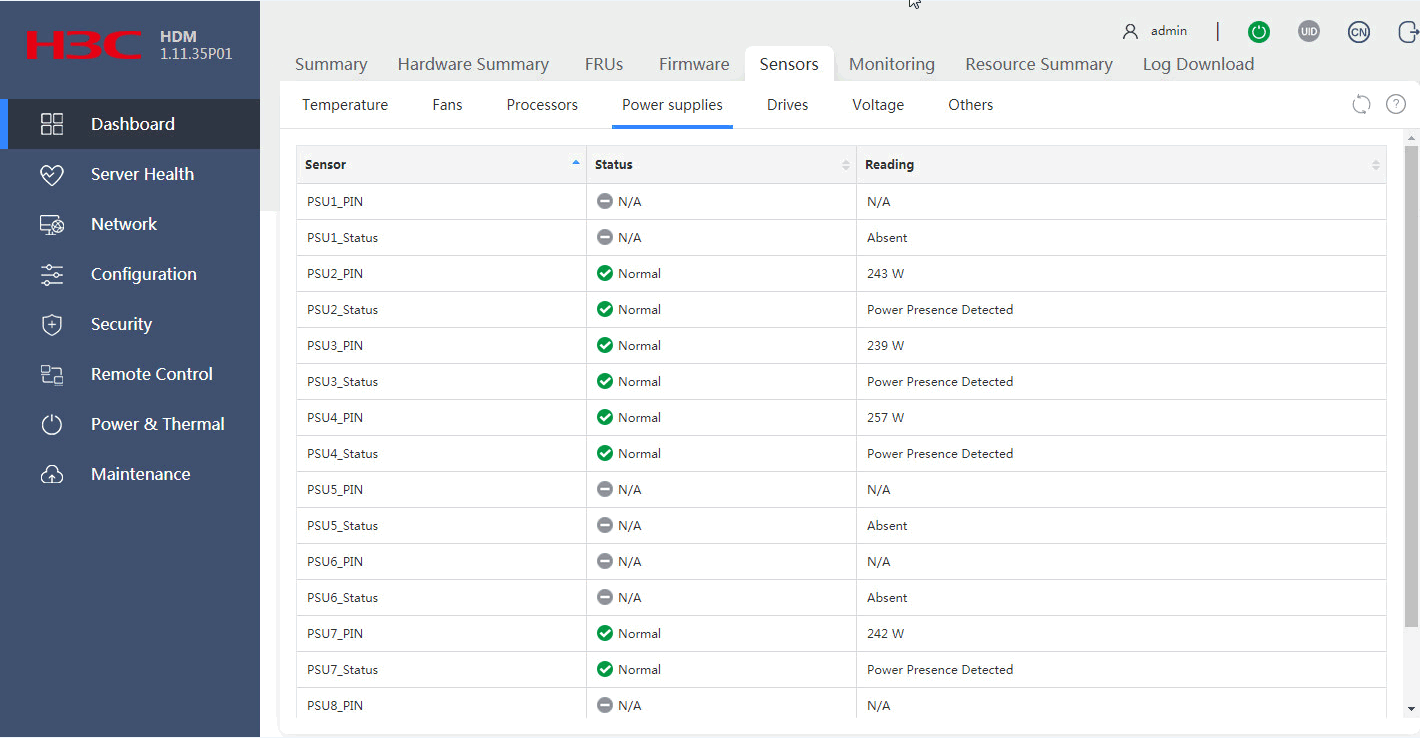
Parameters
PSUnumber_PIN sensors
· Status: Power input status of the power supply. Options include:
¡ Normal—Power input is normal.
¡ N/A—No power input exists.
· Reading: Current input power.
PSUnumber_Status sensors
· Status: Running status of the power supply. Options include:
¡ Normal—The power supply is operating correctly or in cold standby state.
¡ Minor—The power supply is in Early warning or Modules not matching state.
¡ Major—The power supply is in one of the following states: Failed, No input, Input beyond the range.
¡ N/A—The power supply is absent.
· Reading: Reading of the power supply status sensor. Options include:
¡ In cold standby state.
¡ Early warning.
¡ Failed.
¡ No input.
¡ Input beyond the range.
¡ Modules not matching.
Total_Power sensor
· Status: Power input status of the server. Options include:
¡ Normal—Power input of the server is normal.
¡ N/A—Failed to obtain the power input status from the server.
· Reading: Current total input power of the server.
View drive status
Each drive (HDD, SSD, or NVMe drive) has a status sensor, which is named in the format of CMnumber DISKnumber_Status. The number argument in CMnumber represents the number of the compute module. The number argument in DISKnumber represents the number of the drive.
Restrictions and guidelines
The drive UID LED is unavailable for M.2 drives when the server is powered off.
The drive UID LED is unavailable for a drive if the Fault/UID LED of the drive is steady amber.
Procedure
1. In the navigation pane, select Dashboard > Sensors.
2. Click the Drives tab to view drive status and readings, as shown in Figure 99.
Figure 99 Viewing drive status
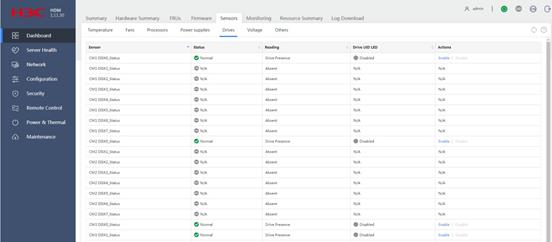
Parameters
· Status: Presence of drive fault. Options include:
¡ Normal—The drive is operating correctly.
¡ N/A—The drive is not present.
¡ Minor/Major/Critical—A drive fault is present. The error code is displayed in the Reading field.
· Reading: Reading of the drive sensor. Available readings are compliant with IPMI.
· Drive UID LED: Status of the drive UID LED function. Options include:
¡ Enabled—The drive Fault/UID LED is steady blue for drive locating.
¡ Disabled—The drive Fault/UID LED status varies by drive status.
· Actions: Select whether to enable the drive UID LED function. Options include:
¡ Enable.
¡ Disable.
View status of voltage
The server provides the following sensors for monitoring the voltage on each server component:
· CMnumber CPUnumber_DIMM_PG—Monitors the VDDQ and VPP voltages of DIMMs.
· CMnumber CPUnumber_PG—Monitors the PVCCIN, PVCCIO, and PVCCSA voltages of a processor.
· CMnumber 12V VIN—Monitors the 12 V input voltage provided by the active power supplies to the system.
· CMnumber 12V STBY—Monitors the 12 V input voltage provided by the standby power supplies to the system.
The number argument in CMnumber represents the number of the compute module. The number argument in CPUnumber represents the number of the processor.
Procedure
1. In the navigation pane, select Dashboard > Sensors.
2. Click the Voltage tab to view voltage status and readings, as shown in Figure 100.
Figure 100 Viewing voltage status
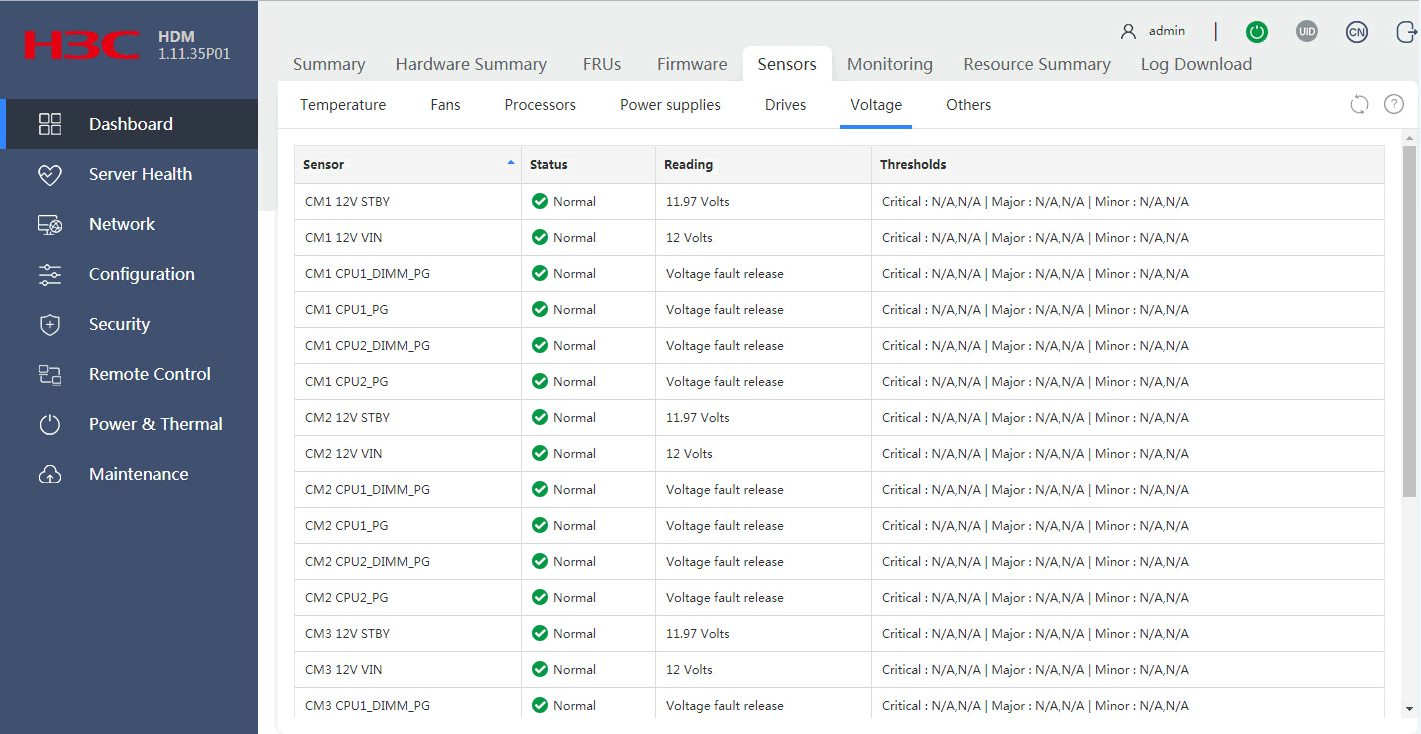
Parameters
CMnumber CPUnumber_DIMM_PG and CMnumber CPUnumber_PG sensors
· Status: Voltage status. Options include:
¡ Normal—No voltage fault is present.
¡ Major—Voltage fault is present.
· Reading: Reading of the voltage sensor. The reading indicates whether a voltage fault is present.
· Thresholds: Voltage thresholds:
¡ Critical—Lower and upper critical thresholds.
¡ Major—Lower and upper major thresholds.
¡ Minor—Lower and upper minor thresholds.
If a threshold is not specified, N/A is displayed.
CMnumber 12V VIN and CMnumber 12V STBY sensors
· Status: Voltage status. Options include:
¡ Normal—The voltage is between the lower minor threshold (exclusive) and upper minor threshold (exclusive).
¡ N/A—The component is absent or the voltage value cannot be obtained.
¡ Major—The voltage exceeds the upper major threshold or drops below the lower major threshold. In this state, server performance degrades significantly.
· Reading: Voltage detected by the sensor. This field displays N/A if the component is absent or the voltage value cannot be obtained.
· Thresholds: Voltage thresholds:
¡ Critical—Lower and upper critical thresholds.
¡ Major—Lower and upper major thresholds.
¡ Minor—Lower and upper minor thresholds.
If a threshold is not specified, N/A is displayed.
View event log status
The event log sensor (SEL_sensor) monitors status of the event log.
Procedure
1. In the navigation page, select Dashboard > Sensors.
2. In the work pane, click the Others tab, as shown in Figure 101.
3. In the SEL section, view status and reading of the event log sensor.
Figure 101 Viewing event log status

Parameters
· Status: Running status of the event log sensor. Options include:
¡ Normal—The event log is operating correctly or the event log has been cleared or reset.
¡ Minor—The log is full or the number of event log entries has exceeded 75% of the event log size.
· Reading: Reading of the event log sensor.
View operating system status
The operating system sensor (Watchdog2) monitors the operating system (OS) of the server for system crash events and restarts the OS upon detection of an OS crash.
Procedure
1. In the navigation page, select Dashboard > Sensors.
2. In the work pane, click the Others tab, as shown in Figure 102.
3. In the Watchdog2 section, view status and reading of the OS sensor.
Figure 102 Viewing operating system status
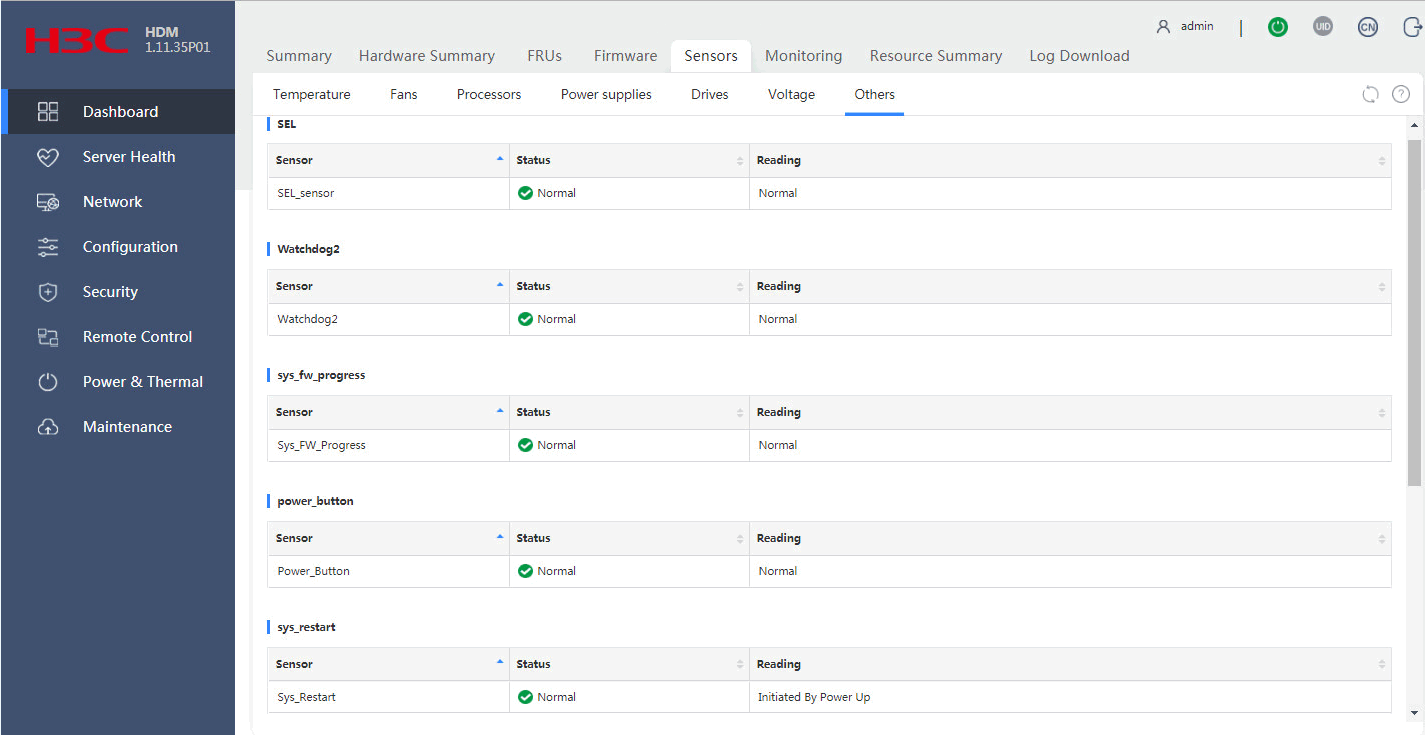
Parameters
· Status: Running status of the OS. Options include:
¡ Normal—The server OS is operating correctly.
¡ Minor—Indicates that a timer interruption or timer expiration event has occurred.
¡ Major—Indicates that a power supply hot restart, power-off, or power-cycle operation expired.
· Reading: Reading of the OS sensor.
View status of the system initialization process
The system initialization sensor (SYS_FW_Progress) monitors the real-time status of the system initialization process.
Procedure
1. In the navigation page, select Dashboard > Sensors.
2. In the work pane, click the Others tab, as shown in Figure 103.
3. In the sys_fw_progress section, view system initialization status.
Figure 103 Viewing system initialization status

Parameters
· Status: Current system initialization status. Options include:
¡ Normal—The initialization process is normal.
¡ N/A—The server is powered off.
¡ Major—An initialization error has occurred.
· Reading: Reading of the sensor.
View power button status
The power button sensor (Power_Button) monitors the status of the power button.
Procedure
1. In the navigation page, select Dashboard > Sensors.
2. In the work pane, click the Others tab, as shown in Figure 104.
3. In the power_button section, view power button status.
Figure 104 Viewing power button status

Parameters
· Status: Current status of the power button. Options include:
¡ Normal—The power button is operating correctly.
¡ N/A—The power button is faulty.
· Reading: Reading of the sensor.
View system restart status
The system restart sensor (Sys_Restart) monitors the status of the system restart process.
Procedure
1. In the navigation page, select Dashboard > Sensors.
2. In the work pane, click the Others tab, as shown in Figure 105.
3. In the sys_restart section, view system restart status.
Figure 105 Viewing system restart status

Parameters
· Status: Current system restart status. Options include:
¡ Normal—The system restarts correctly.
¡ Major—An error occurs during system restart.
· Reading: Reading of the sensor.
View system status
The system sensor (ACPI_State) monitors the status of the server system.
Procedure
1. In the navigation page, select Dashboard > Sensors.
2. In the work pane, click the Others tab, as shown in Figure 106.
3. In the acpi_state section, view system status.
Figure 106 Viewing system status
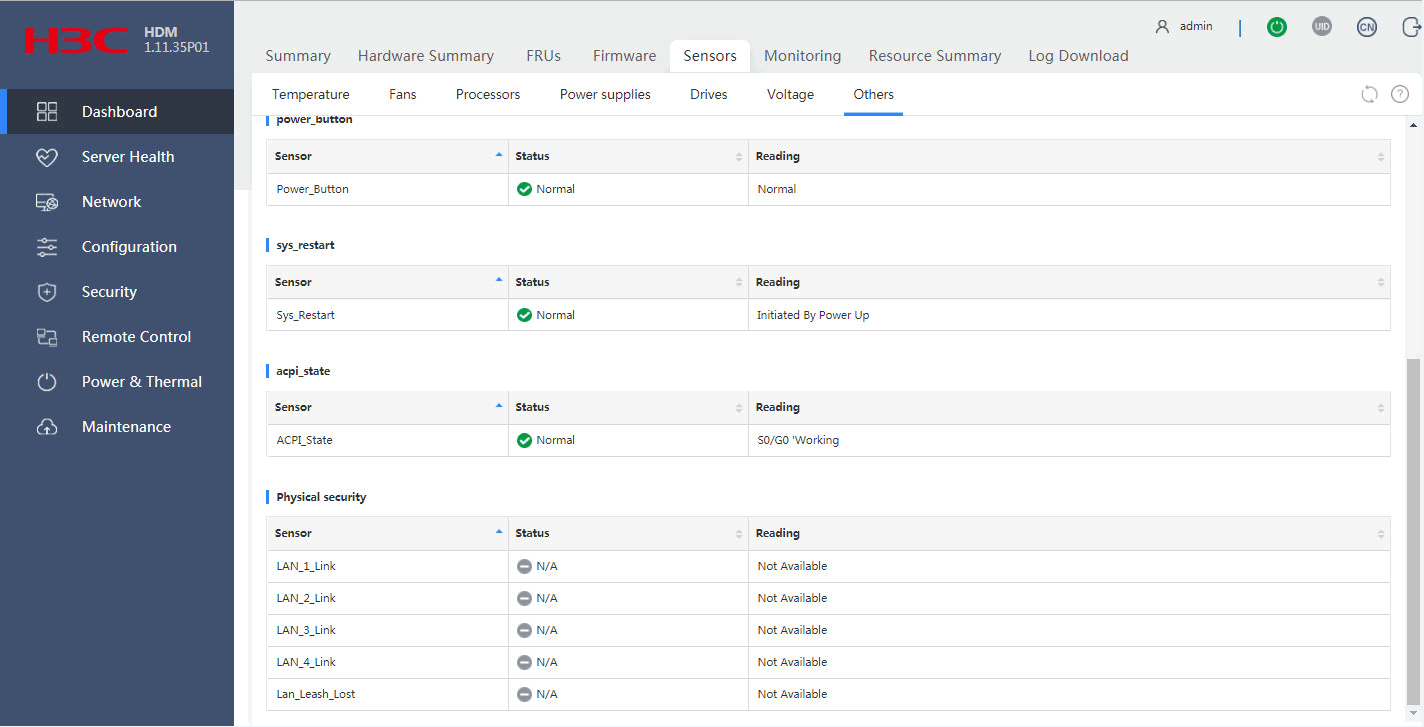
Parameters
· Status: Current system status. Options include:
¡ Normal—The system is operating correctly.
¡ Major—An error occurs in the system.
· Reading: Reading of the sensor.
View physical security status
The server provides the following sensors for monitoring the status of shared network ports:
· Lan_Leash_Lost—Monitors the status of all shared network ports.
· Lan_number_Link—Monitors the status of shared network port 1, 2, 3, or 4. The number argument represents the number of the shared network port.
Procedure
1. In the navigation page, select Dashboard > Sensors.
2. In the work pane, click the Others tab, as shown in Figure 107.
3. In the Physical security section, view physical security status.
Figure 107 Viewing physical security status

Parameters
Lan_number_Link sensors
· Status: Running status of the specific shared network port. Options include:
¡ Normal—The shared network port is enabled.
¡ N/A—The shared network port is disabled.
· Reading: Reading of the sensor.
Lan_Leash_Lost sensor
· Status: Running status of the shared network ports in the server. Options include:
¡ Normal—A minimum of one shared network port is enabled.
¡ N/A—No shared network port exists or all shared network ports are operating incorrectly.
· Reading: Reading of the sensor.
Monitoring
The Monitoring menu displays CPU usage, MEM usage, and air inlet temperature collected every 5 minutes in the past 24 hours.
Restrictions and guidelines
This feature is available only for the R2700, R2900, R4300, R4700, R4900, R6700, R6900, R8900, and X10000 servers.
HDM cannot obtain the server monitoring statistics while HDM is being reset.
Restoring the HDM factory defaults clears the monitoring statistics.
The CPU and MEM usage displayed in the chart are uncorrelated with the CPU and MEM usage calculated in the OS.
Procedure
1. In the navigation pane, select Dashboard > Monitoring.
2. In the work pane, click the CPU Usage, MEM Usage, or Air Inlet Temperature tab to view the corresponding information, as shown in Figure 108.
Figure 108 Viewing monitoring statistics
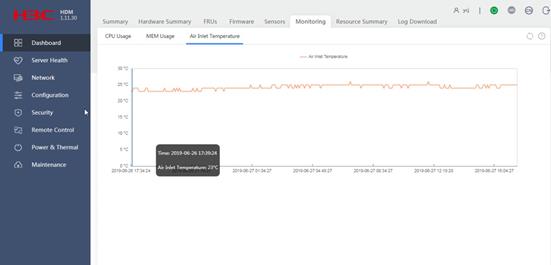
Resource summary
You can view the processor, memory, disk, and bandwidth usage information of the server and set alarm thresholds for the processor, memory, and disk usage.
You cannot set the alarm threshold for the bandwidth usage from HDM. To set this alarm threshold, use IPMI commands. For more information, see the IPMI command reference.
View resource summary
In the navigation pane, select Dashboard > Resource Summary.
Set alarm thresholds
Restrictions and guidelines
To use this feature, you must install and run FIST SMS in the operating system of the server. For more information about installing FIST SMS, see the appendix of the FIST installation guide.
The system generates a log entry if an alarm occurs or is cleared. You can view the alarms on the Event Log page.
Procedure
1. In the navigation pane, select Dashboard > Resource Summary.
2. Click Advanced at the upper right of the page.
3. In the dialog box that opens, set the alarm thresholds for processor usage, memory usage, and disk usage, as shown in Figure 109.
Figure 109 Setting alarm thresholds for processor, memory, and disk usage
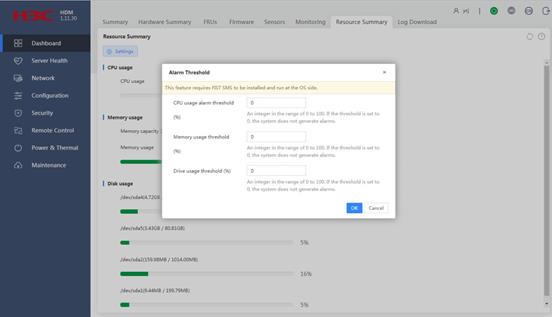
4. Click Save.
Download log
This feature enables users to download records about events, storage, configuration, and HDM throughout the lifecycle of the server. You can use a log analysis tool (for example, FIST) to analyze the downloaded log. For more information about using FIST, see the FIST user guide for the server.
Restrictions and guidelines
Simultaneous log downloading by multiple users is not supported.
If a time range is selected, the timestamps in the event log entries are used as the time reference to identify the matching log entries.
The downloaded log entries are saved in an .sds file folder. For more information about files in the file folder, see "Appendix Downloaded log files."
Procedure
1. In the navigation pane, select Dashboard > Log Download.
2. Specify log entries to download, as shown in Figure 110.
¡ To download all log entries, select Download entire log.
¡ To download the log entries for a period, select Download specified log. Then, set a time range in days.
Figure 110 Specifying log entries to download
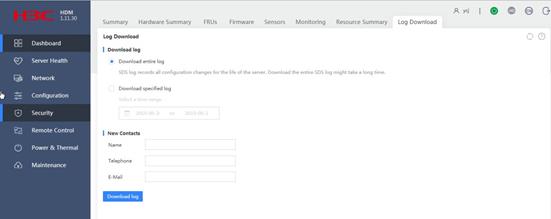
3. (Optional.) Add contact information.
4. Click Download log.
The page displays the downloading progress, as shown in Figure 111.
Figure 111 Displaying the downloading progress
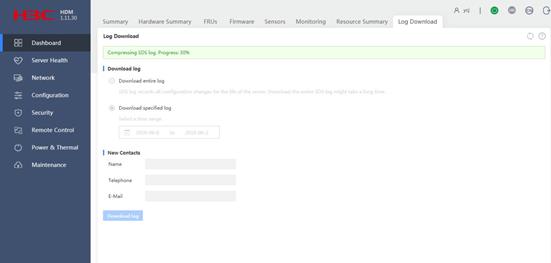
5. Save the downloaded log files to the local server.
6. (Optional.) Import the log files to a log analysis tool.
Display server health
Use server health diagnostic features such as logs, BSoD screenshot, video replay, and POST codes to assess the system health state and troubleshoot server issues.
Event log
The event log records events reported by server sensors.
Manage the event log
Filter and view the event log
1. In the navigation pane, select Server Health > Event Log.
2. In the work pane, filter events as follows:
¡ To display the events of a particular level, select that severity from the All severities list, as shown in Figure 112.
Figure 112 Filtering log entries by severity
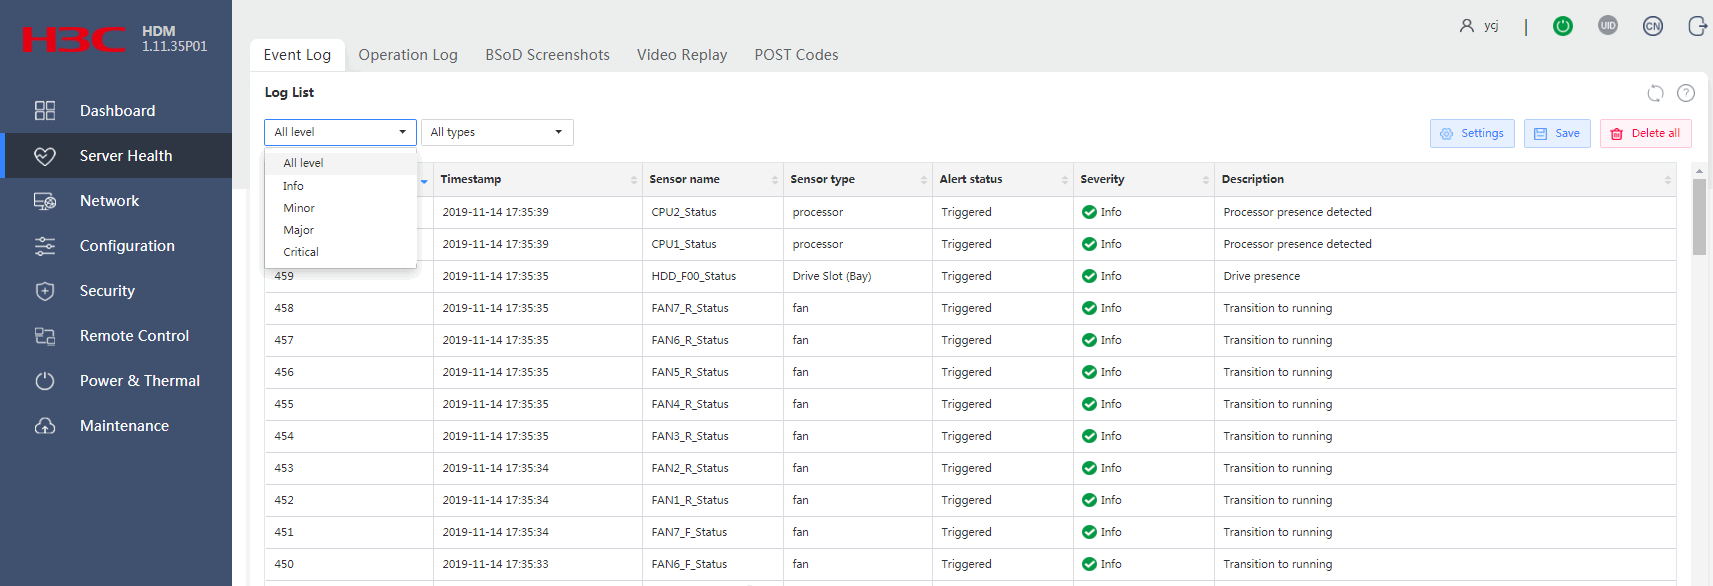
¡ To display the events generated by sensors of a particular type, select that sensor type from the All types list, as shown in Figure 113.
Figure 113 Filtering log entries by sensor type
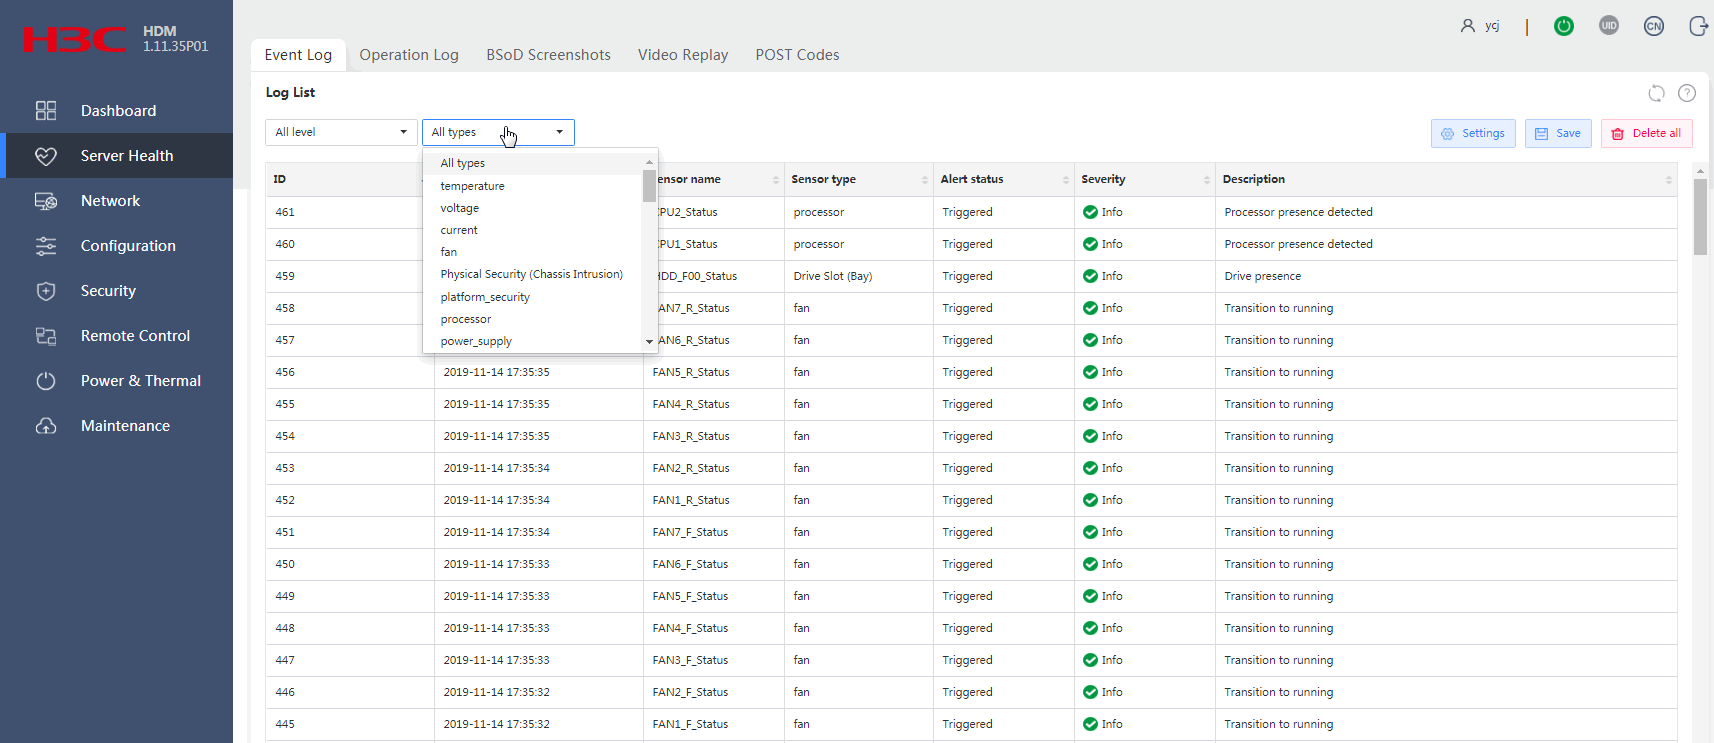
Delete all event log entries
1. In the navigation pane, select Server Health > Event Log.
2. In the work pane, click Delete all.
The deleted event log entries cannot be restored. After all event log entries are deleted, the system automatically generates a log entry that records the deletion.
Save the event log
1. In the navigation pane, select Server Health > Event Log.
2. Click Save to save event log entries to a .csv file.
Parameters
· ID: Event number. Events are numbered in chronological order. By default, the events in the event list are sorted by event number in ascending order.
· Timestamp: Date and time when the event was logged.
· Alert status: Alarm status of the event. Cleared means that the event alarm has been cleared. Triggered means that the event is to be resolved.
· Severity: Severity level of the event.
¡ Info—The event does not adversely affect the system. No action is required. Examples of informational events include expected state change events and alarm removed events.
¡ Minor—The event has minor impacts on the system. Prompt action is required to avoid an escalation in severity.
¡ Major—The event might cause part of the system to fail and result in service interruption. Immediate action is required.
¡ Critical—The event might result in system outage or power failure. Immediate action is required.
Remarks
When the event log reaches the maximum size (3639), logging action on new events depends on the event log policy.
Specify the event log policy
Perform this task to specify the action to take on new events when the event log is full.
The following are available actions:
· Stop logging events.
· Overwrite old events.
Procedure
1. In the navigation pane, select Server > Event Log.
2. Click Settings.
3. Configure the event log policy to stop logging events or overwrite old events when the event log fills up, as shown in Figure 114.
Figure 114 Specifying the event log policy
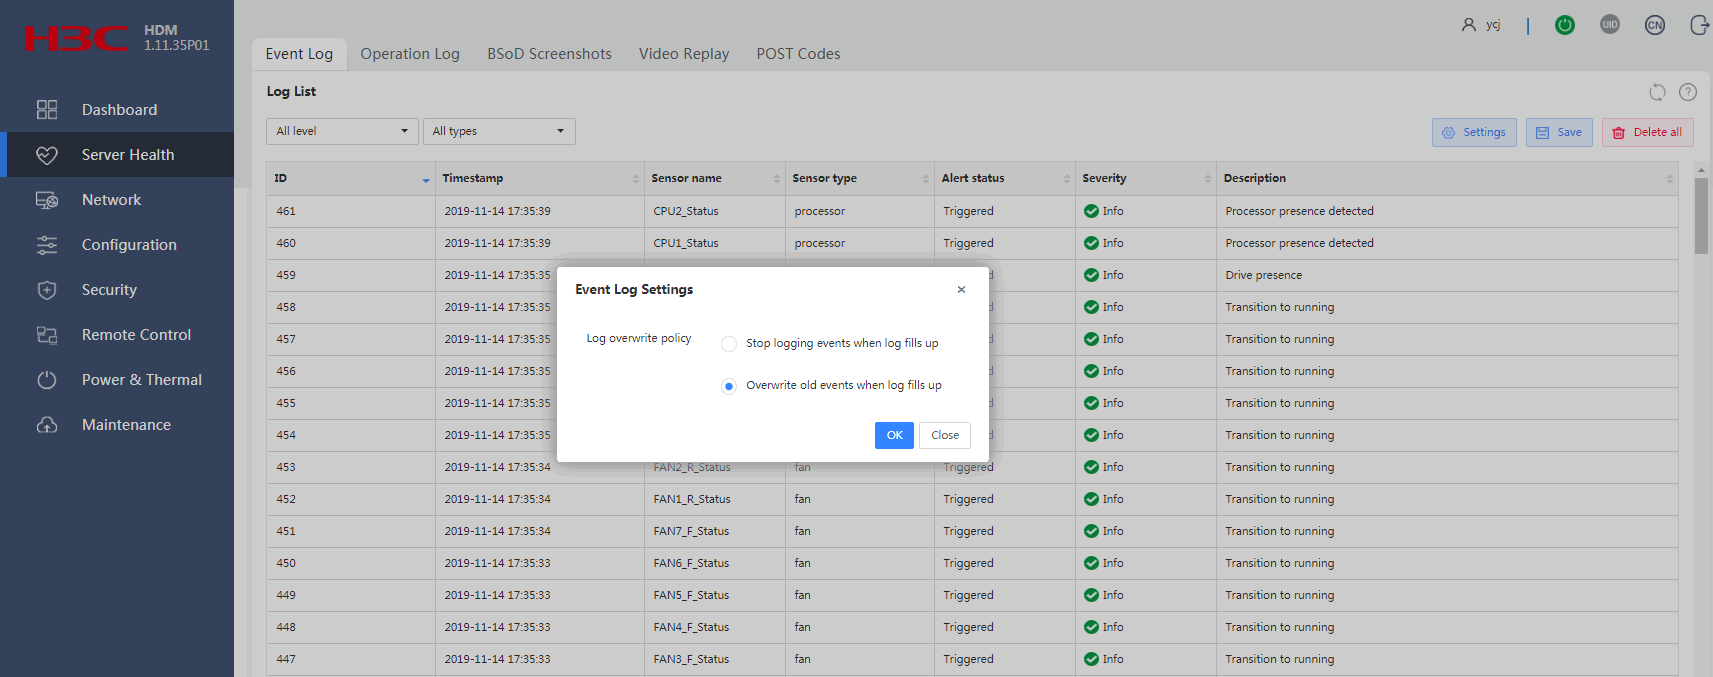
4. Click OK.
Operation log
The operation log includes audit log entries, firmware update log entries, hardware update log entries, and configuration log entries.
· Audit log entries record HDM administrative events, including access to HDM and remote console startup.
· Firmware update log entries record HDM firmware updates as well as their results.
· Hardware update log entries record hardware updates as well as their results. The hardware components include processors, DIMMs, drives, and power supplies.
· Configuration log entries record user configuration operations as well as their results.
Manage the operation log
View the operation log
1. In the navigation pane, select Server Health > Operation Log.
2. In the work pane, filter events as follows, as shown in Figure 115:
¡ To display the events generated by sensors of a particular type, select that sensor type from the All types list.
¡ To display the events of a particular level, select that severity from the All severities list.
Figure 115 Filtering log entries by severity
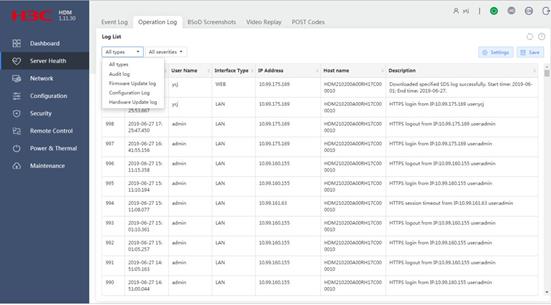
Save the operation log
1. In the navigation pane, select Server Health > Operation Log.
2. Click Save to save operation log entries to a .csv file, as shown in Figure 115.
Parameters
· ID: Event number. Events are numbered in chronological order. By default, the events in the event list are sorted by event number in ascending order. The system can display a maximum of 1000 event log entries.
· Timestamp: Date and time when the event was logged.
· Interface type: Type of the interface through which the operation was performed.
· IP address: User IP address.
· Host name: HDM host name.
· Description: Description of the log entry.
Set the operation log storage location
Perform this task to set the local or remote location for storing the operation log.
Procedure
1. In the navigation pane, select Server Health > Operation Log.
2. Click Settings.
3. Select a storage location for the operation log:
¡ Local—Saves the operation log on the local server.
¡ Remote—Saves the operation log on a remote log server in addition to the local server.
The operation log storage path on the local server is /mnt/sdmmc0p4/log/visible.log.
4. If you select Remote, enter the IPv4 or IPv6 address of the remote server, as shown in Figure 116.
Figure 116 Setting the operation log storage location
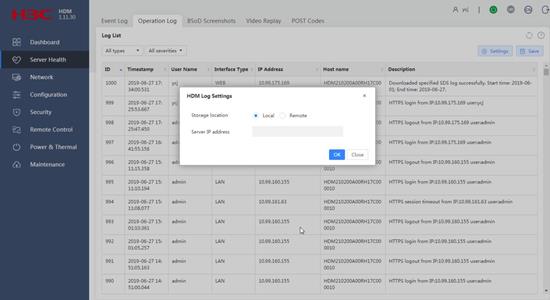
5. Click OK.
BSoD screenshots
View BSoD screenshots
Prerequisites
Make sure the KVM service has been enabled for your user account from the Security > Services page. If KVM is not enabled, contact the administrator.
Procedure
1. In the navigation pane, select Server Health > BSoD Screenshots.
2. View the BSoD screenshots listed on the page, as shown in Figure 117.
Figure 117 Viewing BSoD screenshots
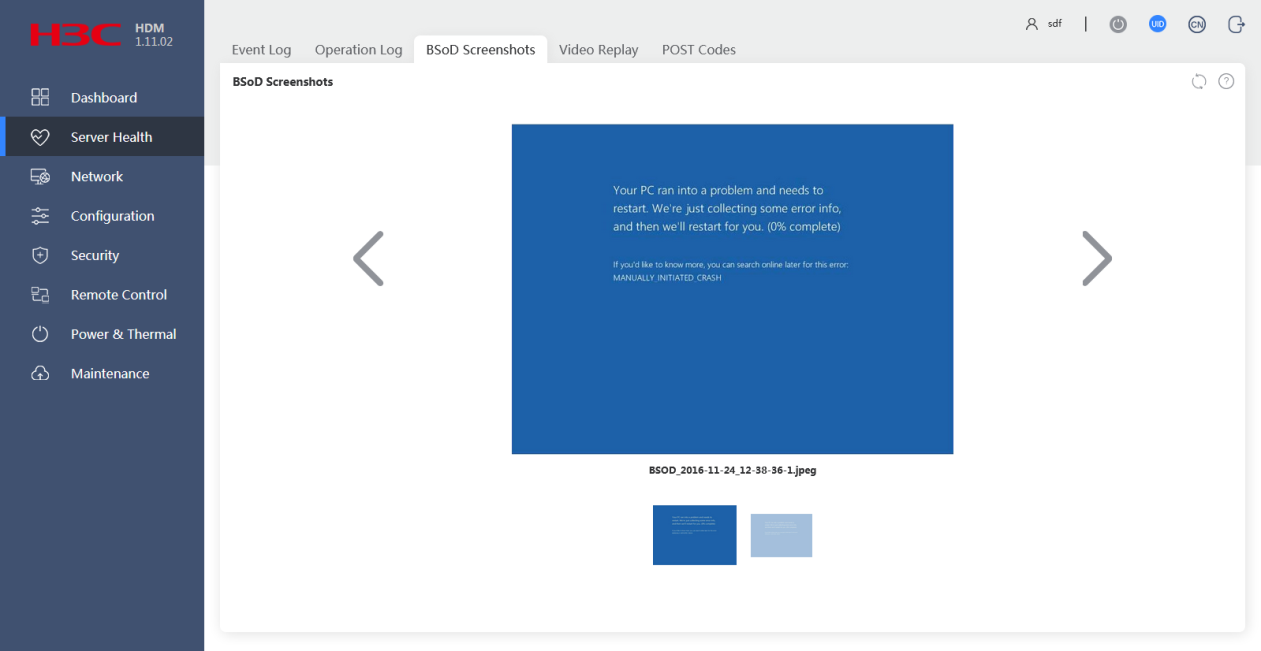
Video replay
This feature records the server status upon occurrence of severe operating system events, including crash, reset, and shutdown.
Enable video recording
Restrictions and guidelines
If the remote console is open when an event triggers video recording, video recording will fail.
Prerequisites
Make sure the KVM service has been enabled for your user account from the Security > Services page. If KVM is not enabled, contact the administrator.
Procedure
1. In the navigation pane, select Server Health > Video Replay.
2. In the work pane, click Settings, as shown in Figure 118.
Figure 118 Configuring video replay settings

3. Click Enable to enable video recording.
4. Set the video length. The value range is 15 to 255 seconds.
5. Select types of events to be recorded: crash, reset, or shutdown.
Crash event recording is available for Windows and Linux operating systems.
6. Click OK.
Play and manage videos
On the video replay page, you can play, download, and delete the recorded videos.
The system supports a maximum of three video files. If three video files already exist, a new video file overwrites the earliest one. The file creation time is recorded in the file properties.
Play a video
1. In the navigation pane, select Server Health > Video Replay.
2. Click the Play video link in the entry of the video to be played, as shown in Figure 119.
If the operating system was in sleep state when the event occurred, HDM displays a no signal message in place of the video.
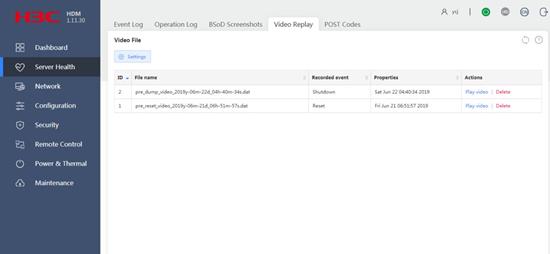
3. To close the video while it is playing, click Cancel, as shown in Figure 120.
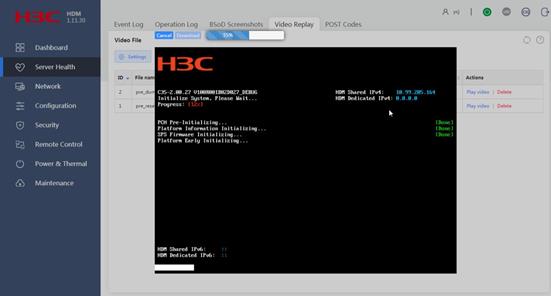
Download a video
1. In the navigation pane, select Server Health > Video Replay.
2. Click the Play video link in the entry of the video to be downloaded, as shown in Figure 119.
3. After the video is loaded, click Download in the entry of the video, as shown in Figure 121.
Figure 121 Downloading a video
Delete a video
1. In the navigation pane, select Server Health > Video Replay.
2. Click Delete in the Actions column, as shown in Figure 119.
POST codes
The system generates power-on self-test (POST) codes to record its state in each phase of server startup.
View POST codes
1. In the navigation pane, select Server Health > POST Codes.
2. In the work pane, view the system POST codes, as shown in Figure 122.
¡ POST code of current phase—POST code that describes the current startup state of the system.
¡ POST results—POST codes that describe all phases of the current or most recent startup of the system.
Figure 122 Viewing system POST codes
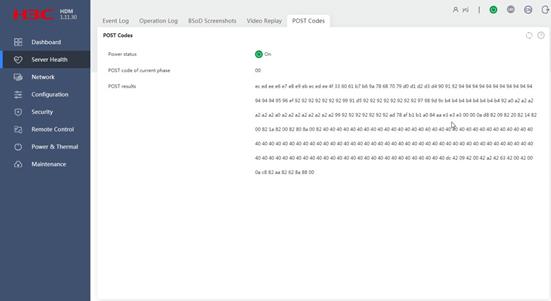
Manage network configuration
General restrictions and guidelines for network configuration
To ensure the network connectivity of HDM, follow these restrictions and guidelines when you configure network settings:
· If the HDM dedicated port and the shared network port are in normal mode, make sure their IP addresses are in different subnets. Network failure might occur if the two ports use IP addresses in the same subnet.
· Do not disable the HDM dedicated network port and the shared network port at the same time. HDM Web interface will be inaccessible if both network ports are disabled.
· Any change to network settings can cause HDM user sessions to disconnect and take a few minutes to take effect. After you change network settings, reconnect to the HDM Web interface at prompt.
· If you cannot access HDM at its IPv6 address, disable proxy server in the browser and then try again.
The system supports only the 64-bit subnet prefixes if you configure the network ports to obtain IPv6 addresses through DHCPv6 or stateless autoconfiguration.
Dedicated port
The HDM dedicated network port transmits only HDM management traffic. Its default IP address is 192.168.1.2/24.
HDM dedicated network port is available only for the R2700, R2900, R4300, R4700, R4900, R4950, R6700, R6900, R8900, and X10000 G3 servers.
View summary information about the dedicated network port
1. In the navigation pane, select Network > Dedicated Port, as shown in Figure 123.
2. On the Basic information tab in the work pane, view summary information about the dedicated network port, including its interface name, MAC address, IP address, and VLAN settings.
Figure 123 Viewing summary information about the dedicated network port
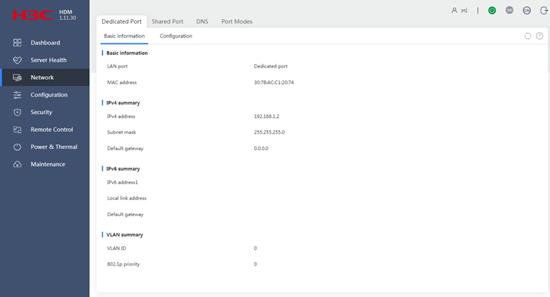
Configure the dedicated network port
Restrictions and guidelines
See "General restrictions and guidelines for network configuration."
Prerequisites
Verify that the HDM dedicated network port is physically connected to the network.
Configure IPv4 settings
1. In the navigation pane, select Network > Dedicated Port.
2. In the work pane, click the Configuration tab, as shown in Figure 124.
3. Select Enable for IPv4 to enable IPv4 network service.
4. Configure IPv4 address settings for the port:
¡ To use the IP address automatically assigned by a DHCP server, select Use DHCP.
¡ To manually configure static IP address settings, clear Use DHCP, and then enter an IPv4 address, subnet mask, and default gateway address.
The default IP address of the HDM dedicated network port is 192.168.1.2/24. If the default gateway address is set to 0.0.0.0, no default gateway is specified.
Figure 124 Configuring IPv4 settings
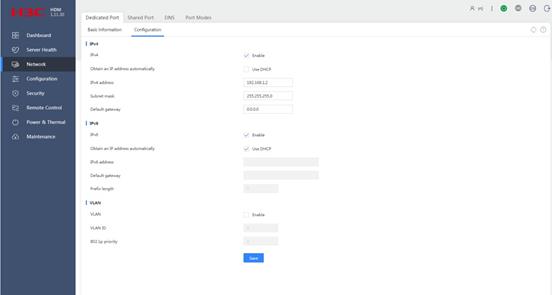
5. Click Save.
Configure IPv6 settings
1. In the navigation pane, select Network > Dedicated Port.
2. In the work pane, click the Configuration tab, as shown in Figure 124.
3. Select Enable for IPv6 to enable IPv6 network service.
4. Configure IPv6 address settings for the port:
¡ To use the IP address automatically assigned by a DHCP server, select Use DHCP.
¡ To manually configure static IP address settings, clear Use DHCP, and then enter an IPv6 address, the prefix length (in the range of 1 to 127), and default gateway address fe80::9628:2eff:fe9c:ffda.
5. Click Save.
Configure VLAN settings
1. In the navigation pane, select Network > Dedicated Port.
2. In the work pane, click the Configuration tab, as shown in Figure 124.
3. Select Enable for VLAN to enable VLAN service.
4. Enter a VLAN ID in the range of 2 to 4094.
5. Enter an 802.1p priority in the range of 0 to 7.
The 802.1p priority determines the transmission priority of the traffic from the VLAN when congestion occurs. The higher the value, the higher the priority.
6. Click Save.
Shared port
The HDM shared network port transmits HDM management traffic and server data traffic simultaneously. By default, the shared network port automatically obtains its IP address through DHCP.
The shared port can be manually specified or automatically selected. Automatic shared port selection provides higher HDM connection availability than manual configuration.
For more information about manually specifying the shared port, see "Configure the shared network port."
For more information about automatic shared port selection, see "Enable or disable automatic shared port selection."
Enable the shared network port
Restrictions and guidelines
Before you can configure the shared network port with network settings, you must enable the shared network port.
Make sure the dedicated network port is reachable before you disable the LAN function of the shared network port.
Procedure
1. In the navigation pane, select Network > Shared Port.
2. On the Basic information tab in the work pane, select Enable for LAN function, as shown in Figure 125.
Figure 125 Enabling the shared network port (for the R4900)
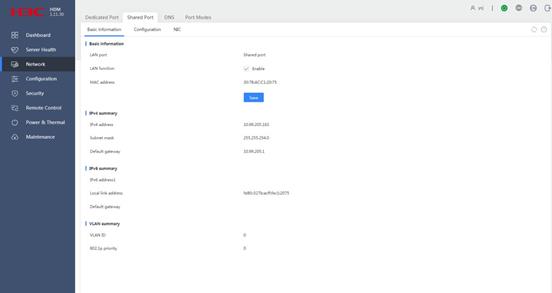
3. Click Save.
View summary information about the shared network port
1. In the navigation pane, select Network > Shared Port, as shown in Figure 125.
2. On the Basic information tab in the work pane, view summary information about the shared network port, including its interface name, MAC address, IP address, and VLAN settings.
Configure the shared network port
Restrictions and guidelines
See "General restrictions and guidelines for network configuration."
Prerequisites
Verify that the shared network port is physically connected to the network.
Enable the LAN function of the shared network port.
Configure IPv4 settings
1. In the navigation pane, select Network > Shared Port.
2. In the work pane, click the Configuration tab, as shown in Figure 126.
3. Select Enable for IPv4 to enable IPv4 network service.
4. Configure IPv4 address settings for the port:
¡ To use the IP address automatically assigned by a DHCP server, select Use DHCP. This is the default setting.
¡ To manually configure static IP address settings, clear Use DHCP, and then enter an IPv4 address, subnet mask, and default gateway address.
If the default gateway address is set to 0.0.0.0, no default gateway is specified.
Figure 126 Configuring IPv4 settings (for the R4900)
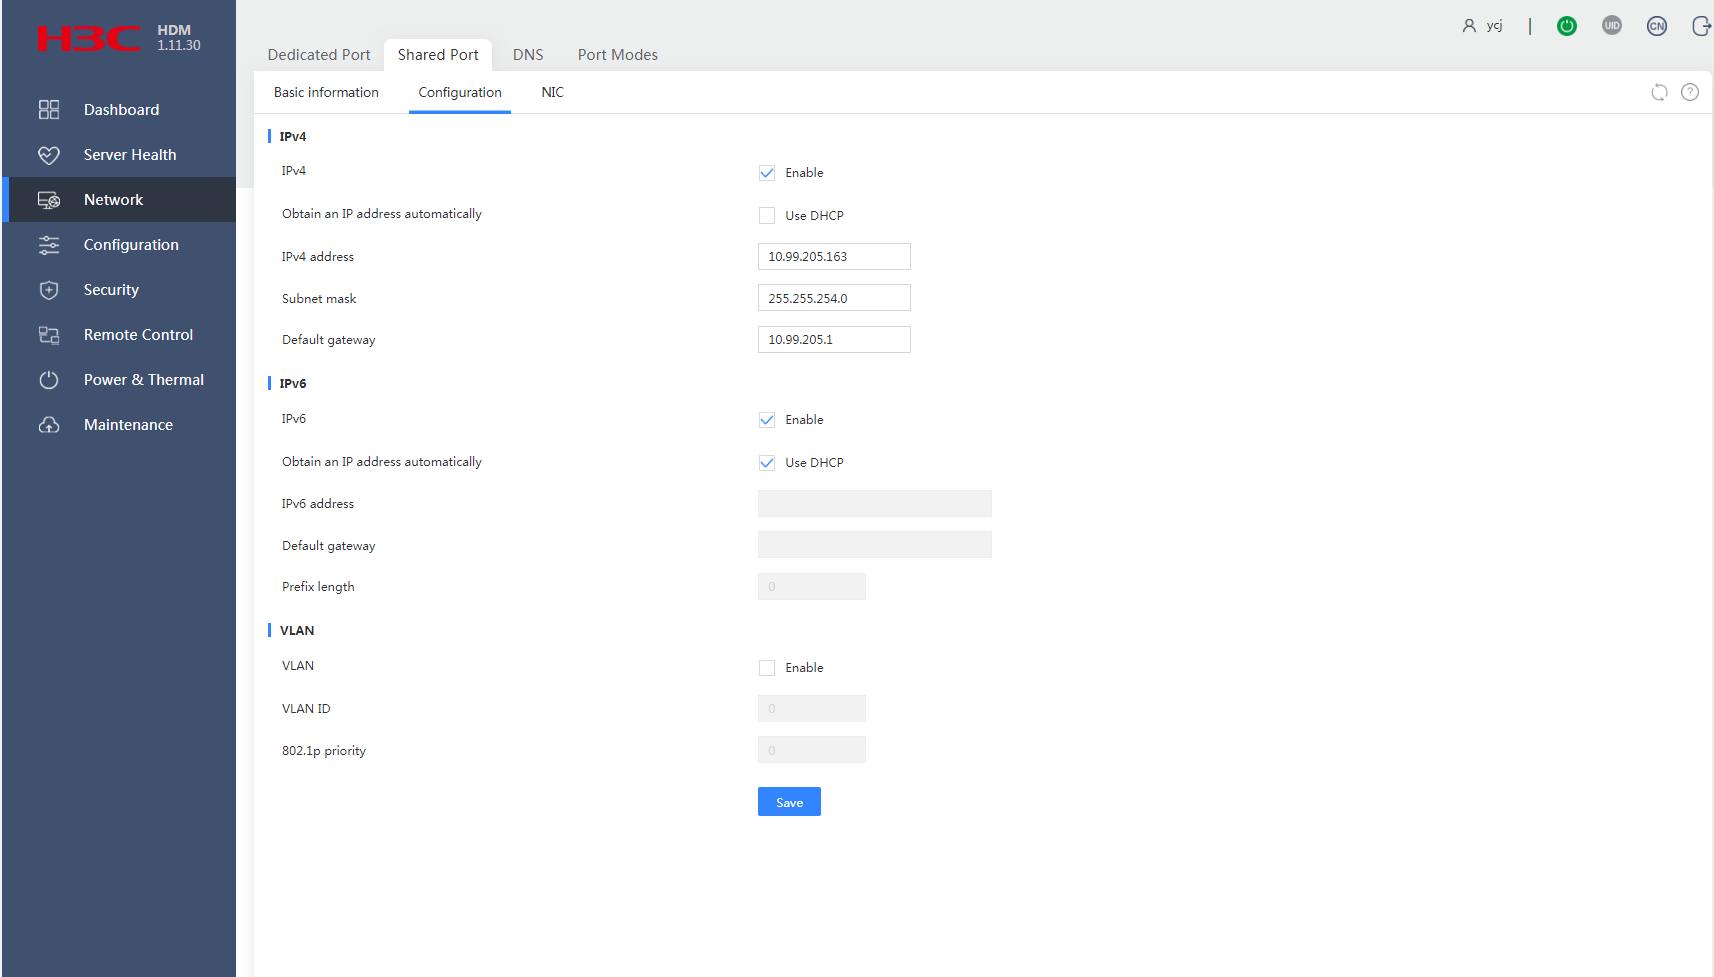
5. Click Save.
Configure IPv6 settings
1. In the navigation pane, select Network > Shared Port.
2. In the work pane, click the Configuration tab, as shown in Figure 126.
3. Select Enable for IPv6 to enable IPv6 network service.
4. Configure IPv6 address settings for the port:
¡ To use the IP address automatically assigned by a DHCP server, select Use DHCP.
¡ To manually configure static IP address settings, clear Use DHCP, and then enter an IPv6 address, the prefix length (in the range of 1 to 127), and default gateway address fe80::9628:2eff:fe9c:ffda.
5. Click Save.
Configure VLAN settings
This feature is available only for the R2700, R2900, R4300, R4700, R4900, R4950, R6700, R6900, R8900, and X10000.
To configure VLAN settings:
1. In the navigation pane, select Network > Shared Port.
2. In the work pane, click the Configuration tab, as shown in Figure 126.
3. Select Enable for VLAN to enable VLAN service.
4. Enter a VLAN ID in the range of 2 to 4094.
5. Enter an 802.1p priority in the range of 0 to 7.
The 802.1p priority determines the transmission priority of the traffic from the VLAN when congestion occurs. The higher the value, the higher the priority.
6. Click Save.
Enable or disable automatic shared port selection
To improve high availability of HDM connectivity, use automatic shared port selection.
Automatic shared port selection enables the system to automatically select the lowest numbered LAN port in up state as the HDM shared network port. When the selected port is down, the system reselects a new port as the HDM shared port from among the remaining LAN ports in up state.
Restrictions and guidelines
This section is available only for the R2700, R2900, R4300, R4700, R4900, R6700, R6900, R8900, and X10000 servers.
sLOM, mLOM, FLOM, OCP, and NCSI-capable PCIe Ethernet adapters support this feature.
Shared port redundancy can operate correctly only if you have a minimum of one LAN port in up state except the primary shared port. However, the LAN port must be on the same Ethernet adapter as the primary shared port.
The system restarts 10 seconds after you change the automatic shared port selection setting for the change to take effect. This restart will disconnect the HDM user session temporarily.
If you are disabling automatic shared port selection, make sure you have manually specified a shared network port and that port is in up state. This operation restores the HDM shared network port to the specified port. If no shared port has been specified or the specified port is in down state, HDM will be inaccessible.
To avoid network errors, do not enable both automatic shared port selection and the active/standby mode.
Procedure
1. In the navigation pane, select Network > Shared Port.
2. In the work pane, click the NIC tab.
3. Select Enable or Disable for Auto-selection, as shown in Figure 127.
Figure 127 Configuring automatic shared port selection
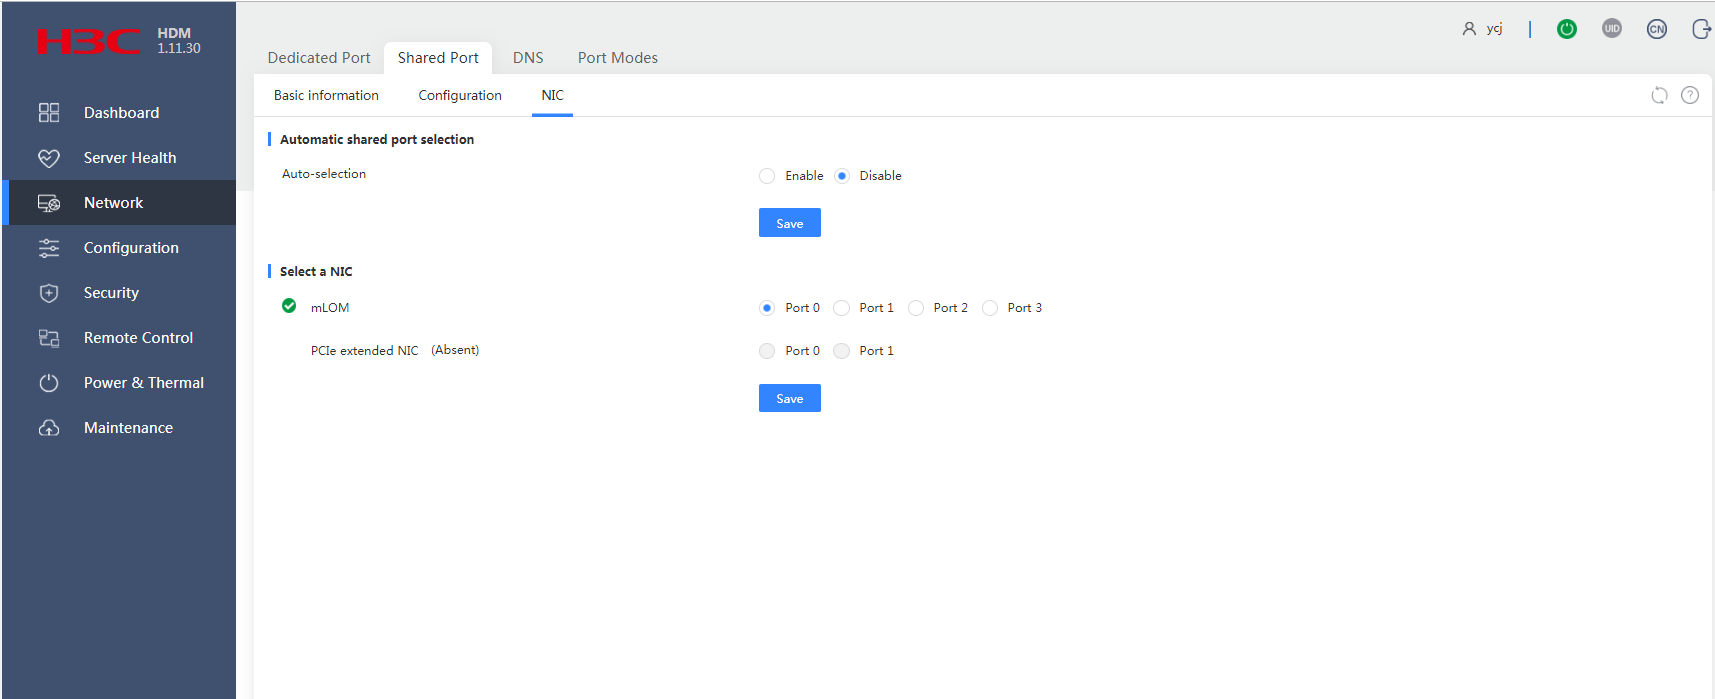
4. Click Save.
Change the shared network port
You can change the network interface used as the shared network port without reconfiguring its network settings. All the network settings except for the IP address obtained through DHCP continue to take effect after the change.
If the IP address of the HDM shared port is obtained through DHCP, the DHCP server re-assigns an IP address to the shared network port after you change it.
Restrictions and guidelines
This section is available only for the R2700, R2900, R4300, R4700, R4900, R6700, R6900, R8900, and X10000 servers.
A transient loss of network connection will occur when you change the shared network port.
Prerequisites
Verify that the network interface to be used as the shared network port is in up state.
Procedure
1. In the navigation pane, select Network > Shared Port.
2. In the work pane, click the NIC tab.
3. Select an interface, as shown in Figure 128.
Figure 128 Selecting an interface

4. Click Save.
DNS
To enable access to HDM by using a domain name instead of the management IP address of HDM, configure DNS.
Configure DNS for HDM
1. Set a host name for HDM.
2. Configure DNS service.
Set a host name for HDM
1. In the navigation pane, select Network > DNS.
2. In the Set host name area, use either of the following methods to configure the host name of HDM, as shown in Figure 129:
¡ To manually configure the host name, select Manual and enter a host name in the Host name field.
The host name is a string of 1 to 63 characters. Hyphens (-) are allowed. However, the string cannot start or end with a hyphen (-).
¡ To enable the HDM to automatically set the host name, select Auto.
The Host name field will be automatically populated with a host name, which is the combination of HDM and the product serial number of the server.
3. Click Save.
Figure 129 Setting a host name for HDM
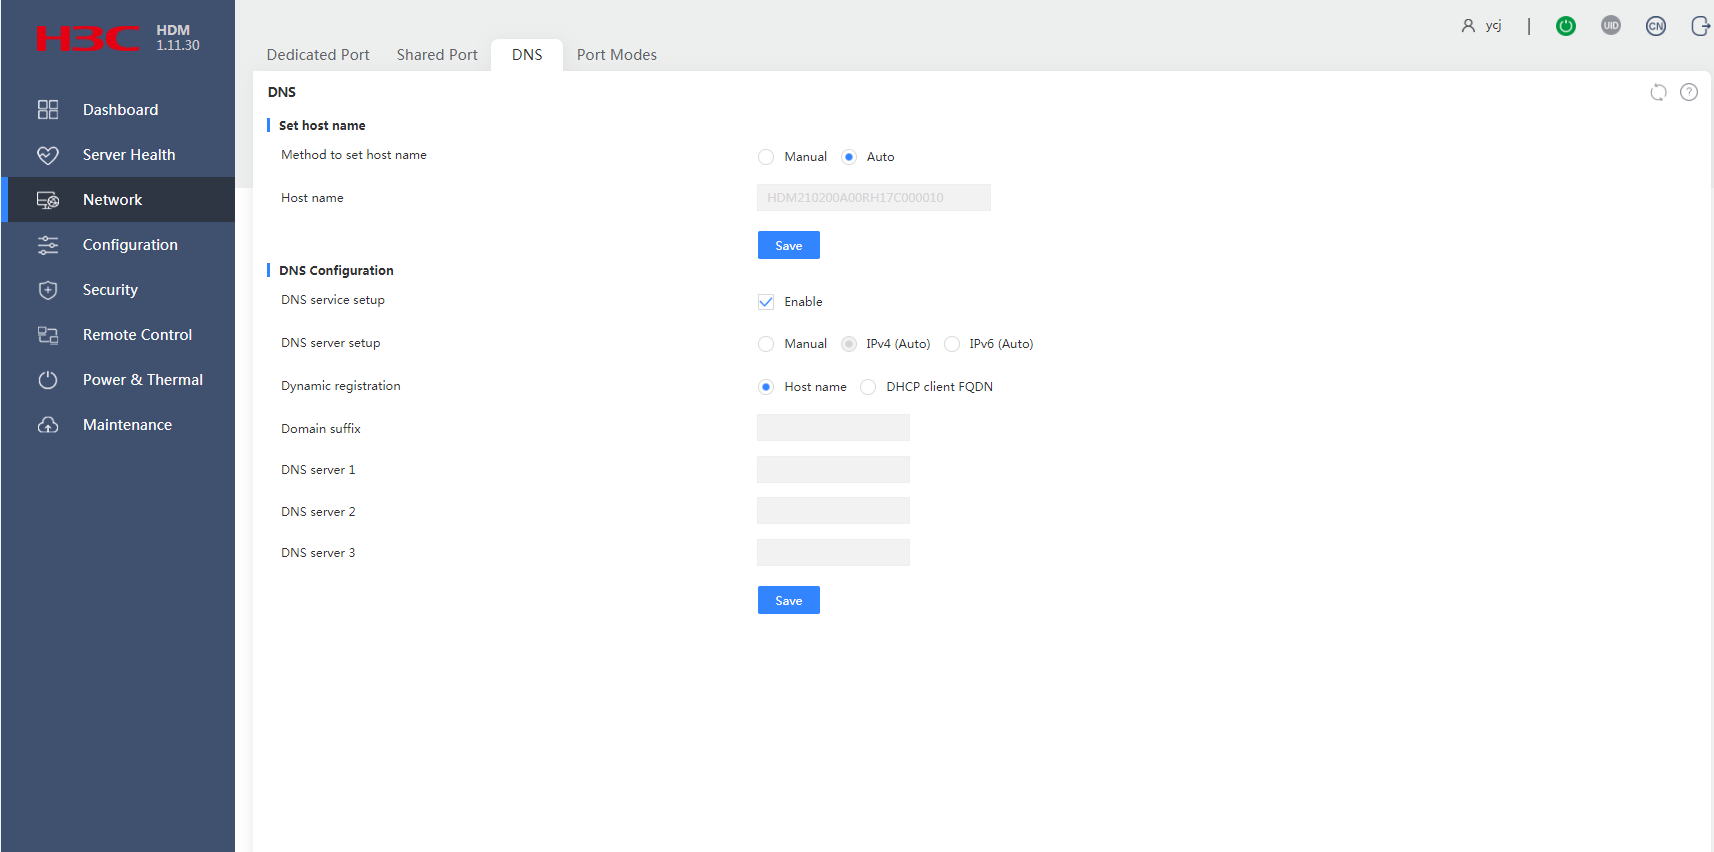
Configure DNS service
Perform this task to specify a domain suffix and specify the IP addresses of DNS servers. Use the domain suffix to specify the top-level and second-level domains. This domain suffix will be automatically combined with the HDM host name to form a fully qualified domain name for HDM access.
Restrictions and guidelines
If all network ports use static IP addresses, specify the IP addresses of DNS servers manually.
If you are manually specifying IPv6 addresses of DNS servers, specify global IPv6 addresses.
Procedure
1. In the navigation pane, select Network > DNS.
2. In the Configure DNS service area, select Enable for DNS service, as shown in Figure 129.
3. Select Manual, IPv4 (Auto), or IPv6 (Auto) from the DNS server setup field.
¡ If you select Manual, enter a domain suffix in the Domain suffix field, and enter the IP addresses of DNS servers. The Domain suffix field is optional.
You can specify a maximum of three DNS servers. The priorities of DNS servers 1, 2, and 3 are in descending order.
¡ If you select IPv4 (Auto) or IPv6 (Auto), select Host name or DHCP client FQDN from the Dynamic registration field and select the network port for registration info obtaining. The Domain suffix field will be automatically populated, and HDM will search for DNS servers automatically.
The Obtain registration info via field is available only when both the dedicated and shared network ports are enabled and use an IP address assigned by the DHCP server.
4. Click Save.
Network port modes
This section is available only for the R2700, R2900, R4300, R4700, R4900, R6700, R6900, R8900, and X10000 servers.
HDM supports the following network port modes:
· Normal mode—The HDM dedicated and shared network ports have separate IP addresses and operate in active/active mode. HDM is accessible at both ports. This is the default mode.
· Bonding mode—The HDM dedicated and shared network ports are aggregated into a logical bond port, which uses the IP address and MAC address of the dedicated port. HDM users can access HDM through the bond port as long as the dedicated or shared network port is up.
· Active/standby mode—The HDM dedicated and shared network ports have separate IP addresses and operate in active/standby mode. In this mode, the dedicated port is the primary port and the shared network is the secondary port. HDM is accessible at the dedicated port as long as the shared port is up and has network connectivity. After the dedicated port fails, HDM is accessible at the shared port. In standby mode, the shared port cannot forward management traffic, but it can still forward data traffic.
In bonding mode, VLAN setting is configurable only on the bond port. The dedicated and shared network ports do not have separate VLAN settings.
In normal and active/standby mode, you can assign the two ports to different VLANs.
General restrictions and guidelines
Changing the network port mode terminates HDM user sessions for a few minutes. You must relog in to HDM after the connection recovers.
Enable or disable bonding mode
Restrictions and guidelines
If you enable the bonding mode, the bond port uses the IP address of the HDM dedicated network port as its own IP. If the dedicated port obtained its IP address through DHCP, it goes down after you enable the bonding mode and then comes up to obtain a new IP. The bond port uses the new IP address.
Prerequisites
Before you enable bonding mode, make sure the following conditions are met:
· Make sure an IP address has been assigned to the dedicated network port. If the dedicated network port has no IP address, HDM might be inaccessible after you enable bonding mode.
· If the ports operate in normal mode, verify that no VLAN settings are configured on the HDM dedicated or shared network ports.
· Make sure the active/standby mode is disabled before you enable network port bonding. The two modes cannot be enabled at the same time.
Procedure
1. In the navigation pane, select Network > Port Modes.
2. In the work pane, select Enable or Disable for Bonding mode, as shown in Figure 130.
Figure 130 Enabling or disabling the bonding mode
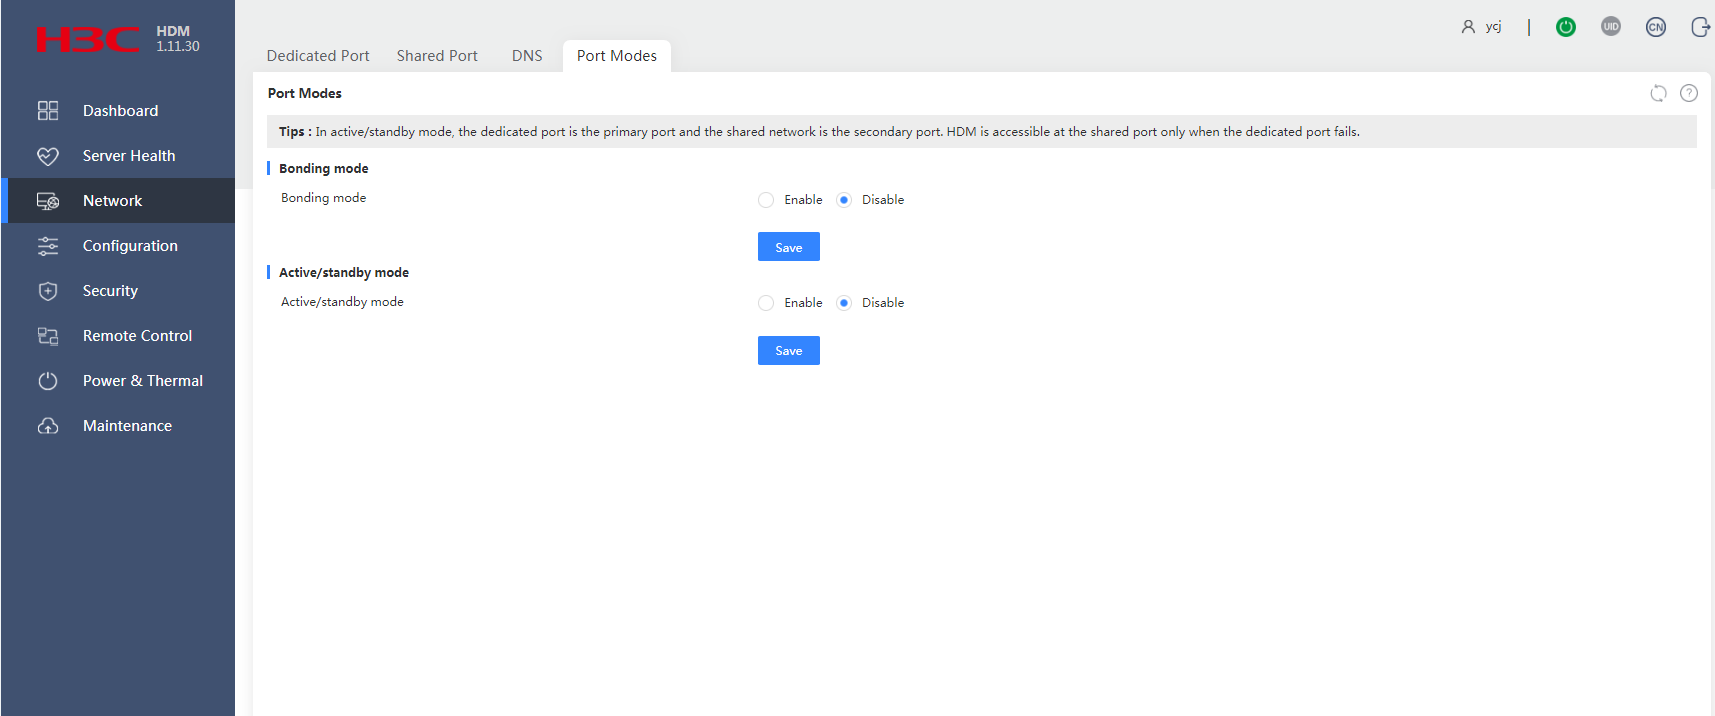
3. Click Save. Your user session will be disconnected at prompt.
4. Wait a few minutes, and then reconnect to HDM.
Enable or disable active/standby mode
Restrictions and guidelines
For the configuration change to take effect, HDM will automatically reset after you save the change.
Make sure the bonding mode is disabled before you enable active/standby mode. The two modes cannot be enabled at the same time.
To avoid network errors, do not enable both automatic shared port selection and the active/standby mode.
Procedure
1. In the navigation pane, select Network > Port Modes.
2. In the work pane, select Enable or Disable for Active/standby mode, as shown in Figure 130.
3. Click Save.
Manage HDM configuration
User accounts
Configure user accounts to control access to HDM and its server management functionalities. A user account defines the password that a user must provide to sign in HDM and the privileges the user has after signing in to HDM.
View user information
Procedure
1. In the navigation pane, select Configuration > User Accounts.
2. In the work pane, view information about HDM users in the user list, as shown in Figure 131.
Figure 131 Viewing HDM user information
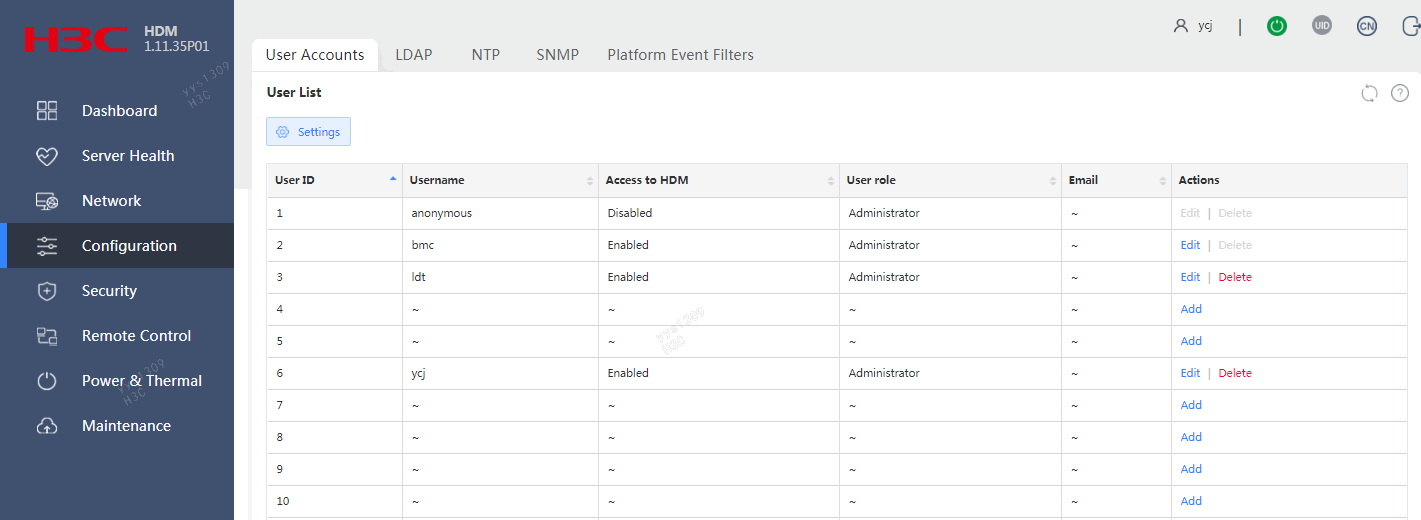
Parameters
· User ID: ID of the user.
· Username: Name of the user.
· Access to HDM: Whether the user can access the HDM Web interface.
¡ Enabled—The user can access the HDM Web interface.
¡ Disabled—The user cannot access the HDM Web interface.
· User role: Role of the user, which determines the network access privileges of the user.
¡ Administrator—The user has read and write permissions to all features.
¡ Operator—The user has read permission to all features and has write permission to some features.
¡ User—The user has read-only permission.
¡ None—The user does not have network access permissions. This role is for special use. Do not assign the role to any users.
For information about privileges that a user role has, see "User accounts."
· Email: Email address at which the user is contacted.
Configure the password policy
Perform this task to enhance HDM access security by setting rules that the passwords of user accounts must follow.
Procedure
1. In the navigation pane, select Configuration > User Accounts.
2. In the work pane, click Settings.
3. In the dialog box that opens, configure the password policy, and then click OK, as shown in Figure 132.
Figure 132 Configuring the password policy
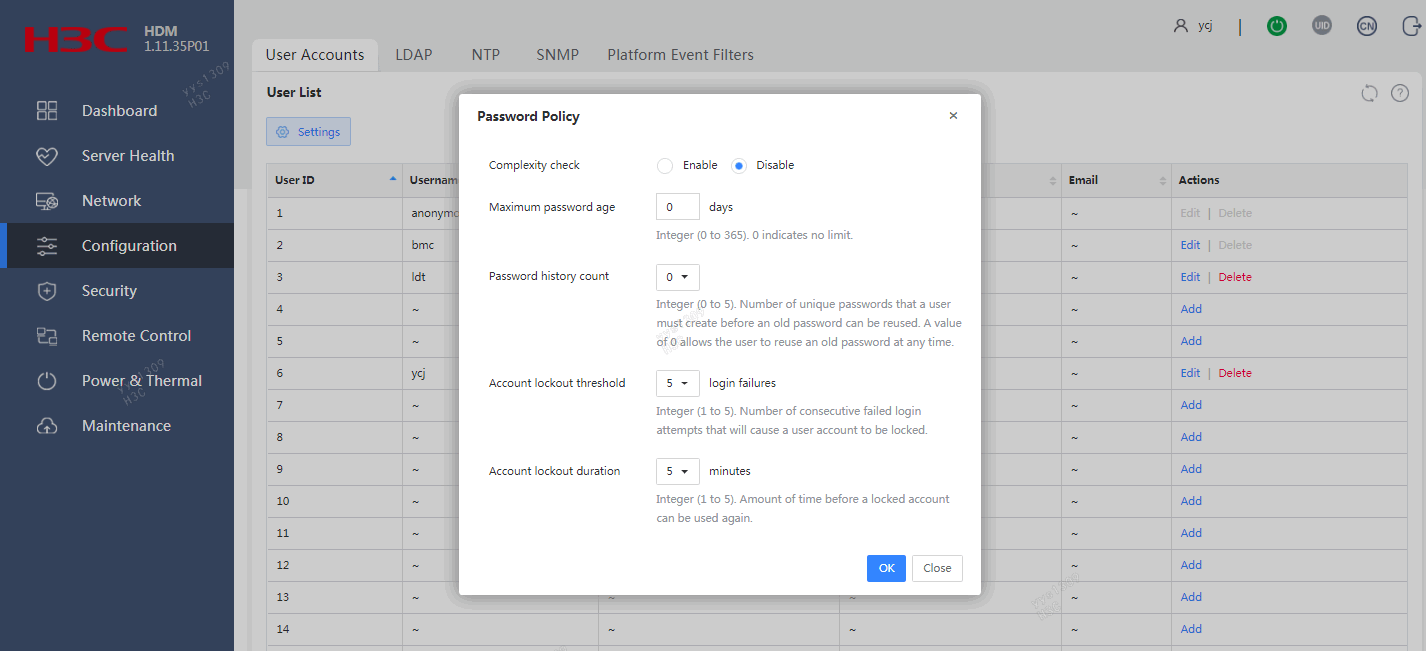
Parameters
· Complexity check: Disable or enable password complexity check.
¡ If this feature is disabled, passwords must meet the following basic complexity requirements:
- 2 to 20 characters in length.
- Case sensitive. Valid characters are letters, digits, spaces, and the following special characters: ` ~ ! @ # $ % ^ & * ( ) _ + - = [ ] \ { } | ; ' : " , . / < > ?
¡ If this feature is enabled, passwords must meet the following enhanced complexity requirements:
- 8 to 20 characters in length.
- Case sensitive. Valid characters are the same as those supported when complexity check is disabled.
- Must contain characters from at least two of the following categories: uppercase letters, lowercase letters, and digits.
- Must contain at least one space or special character.
- Must not be identical to the username or the reverse of the username.
- Must meet the old password reuse requirement.
· Maximum password age: Maximum number of days that a password can be used. When a password is about to expire, HDM prompts the user to change the password.
· Password history count: Number of unique passwords that a user must create before an old password can be reused.
· Account lockout threshold: Number of consecutive login failures that will cause a user account to be locked.
· Account lockout duration: Amount of time before a locked account can be used again.
Manage user accounts
Prerequisites
Make sure you signed in with the administrator role.
Add a user account
1. In the navigation pane, select Configuration > User Accounts.
2. Click Add in the Actions column of an empty account.
3. In the dialog box that opens, configure the user parameters, as shown in Figure 133.
4. Click OK.
Figure 133 Adding a user account
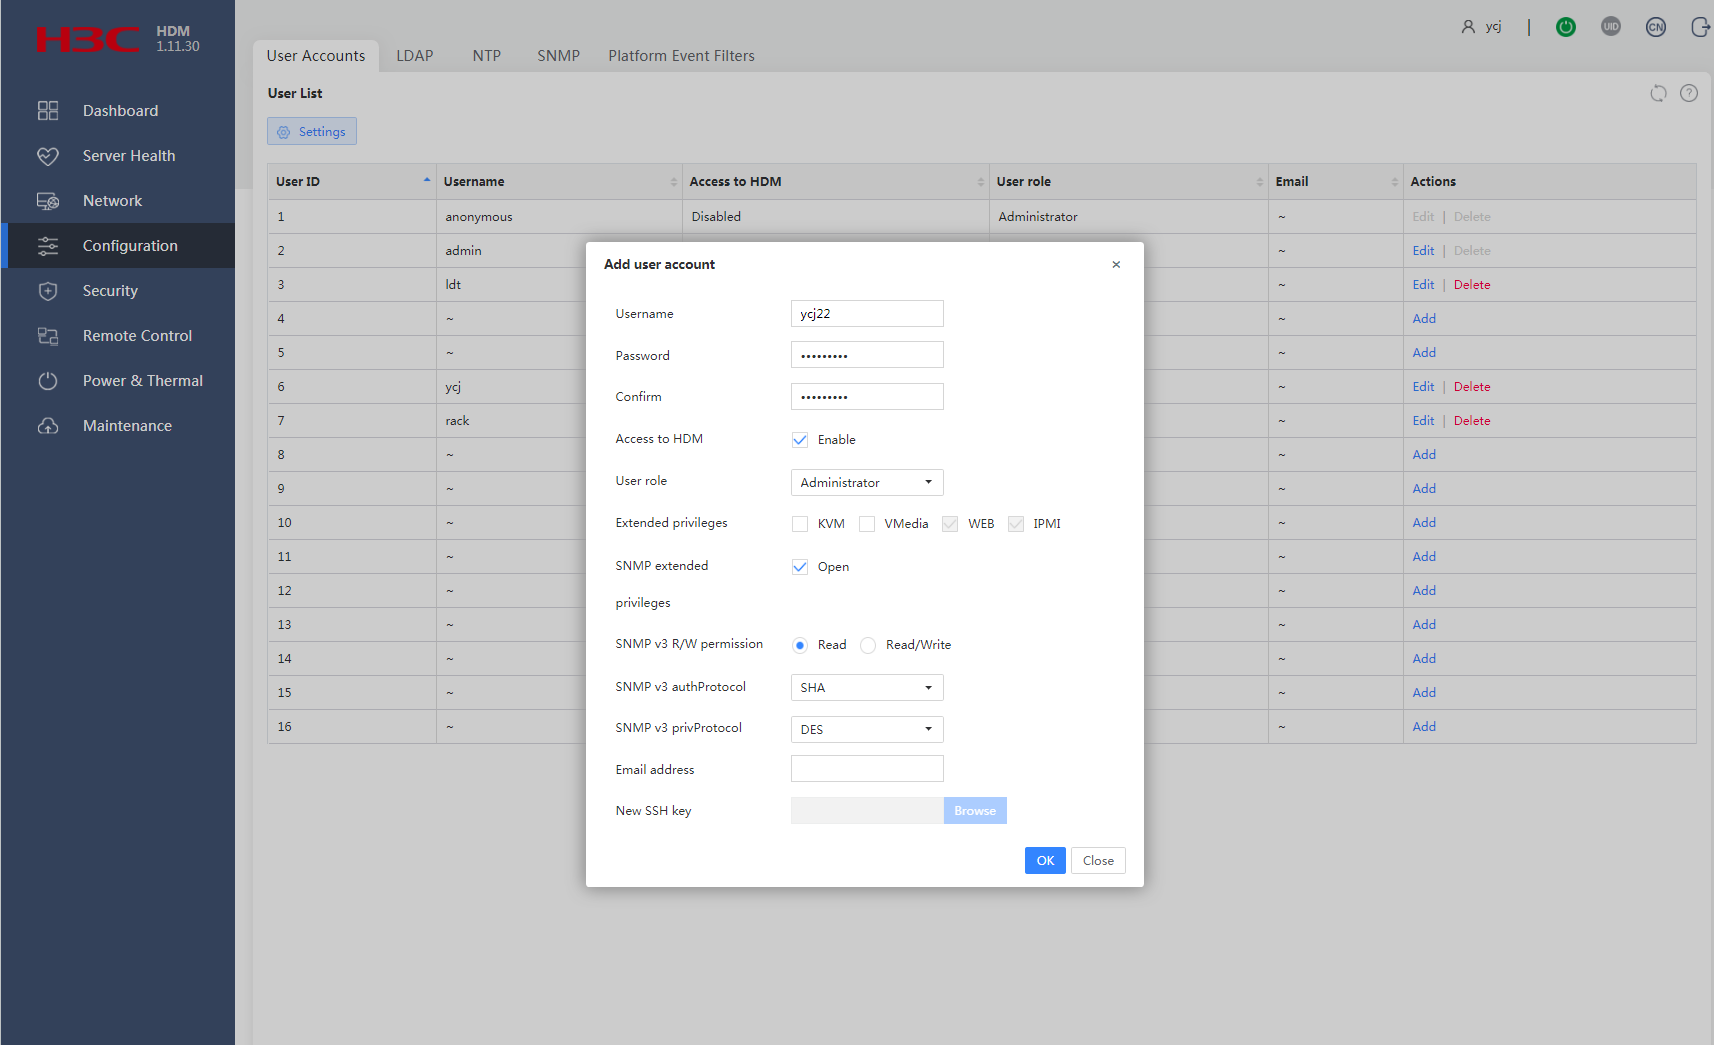
Edit a user account
1. In the navigation pane, select Configuration > User Accounts.
2. Click Edit in the user account entry.
3. In the dialog box that opens, configure the user parameters, as shown in Figure 134.
4. Click OK.
Figure 134 Editing a user account
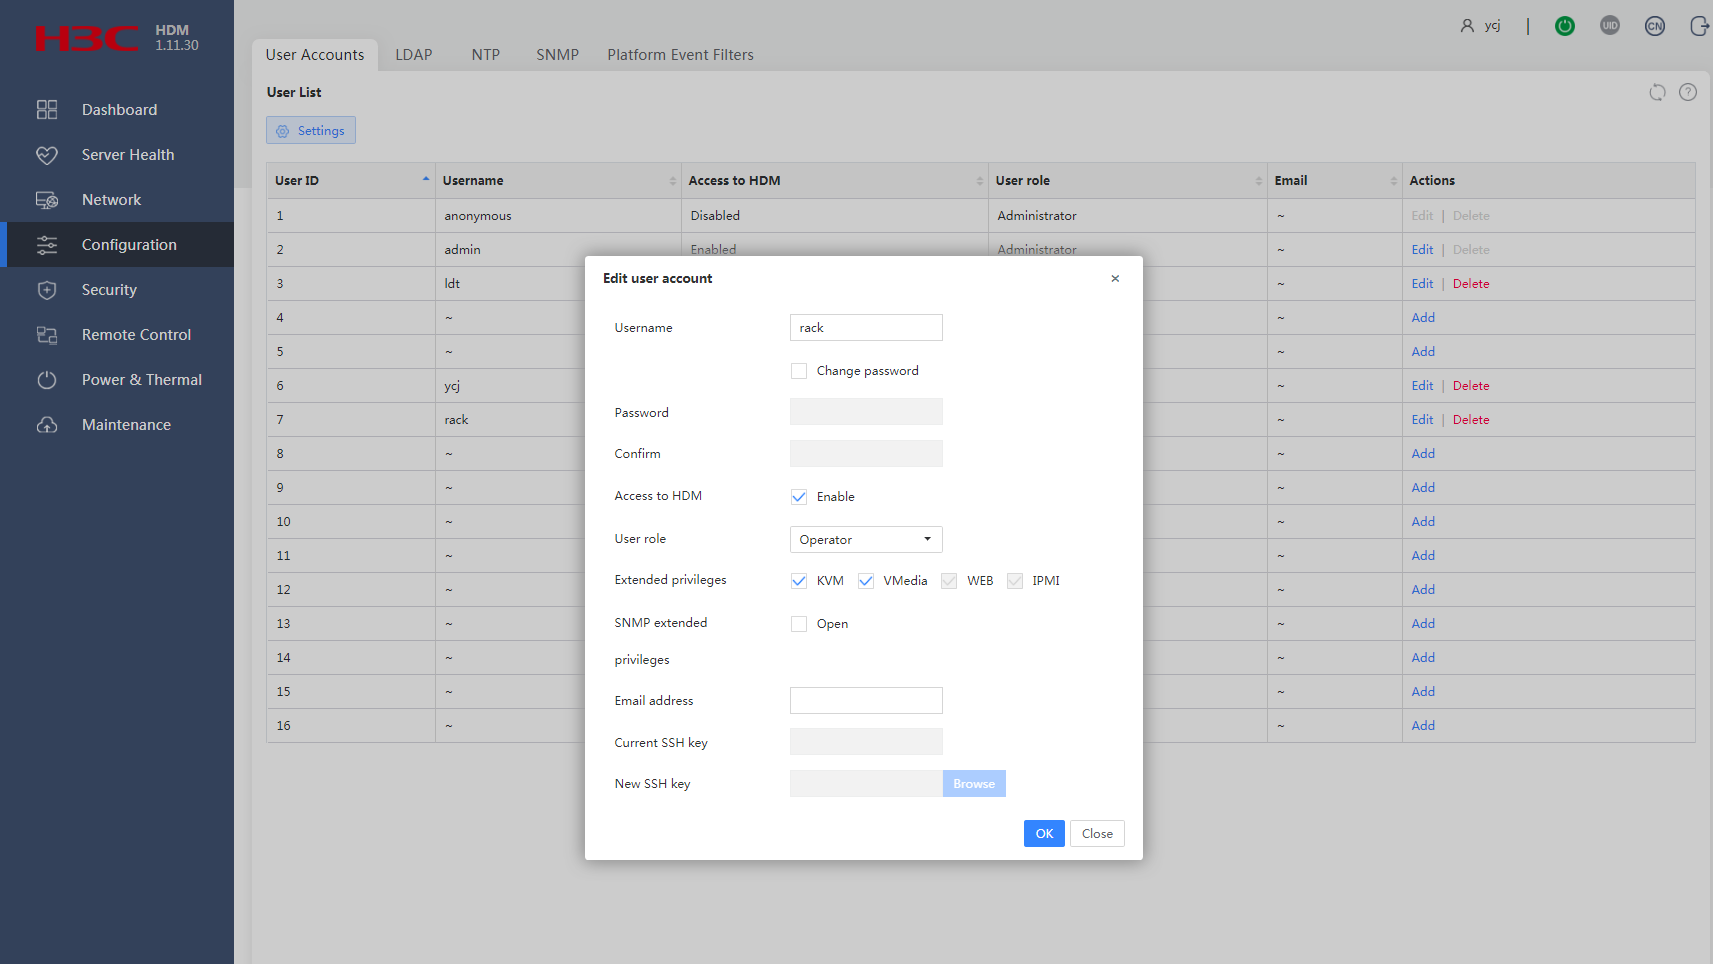
Delete a user account
1. In the navigation pane, select Configuration > User Accounts.
2. Click Delete in the user account entry.
3. In the dialog box that opens, click OK, as shown in Figure 135.
Figure 135 Deleting a user account
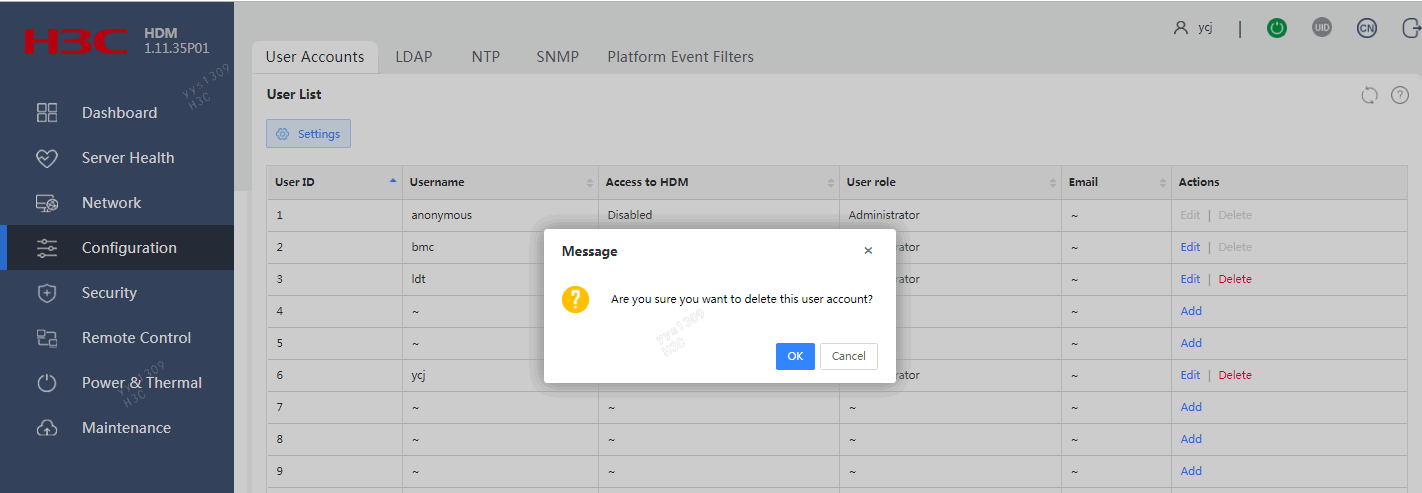
Parameters
· Username: Specify a username for the user account. The username is a case-sensitive string of 1 to 16 characters. Valid characters are letters, digits, dots (.), hyphens (-), and underscores (_).
· Password: Specify a password for the user account, which must comply with the password policy described in "Configure the password policy."
· Confirm: Enter the password again for confirmation.
· Access to HDM: Select Enable to enable the user to access the HDM Web interface. If you do not enable user access, the user cannot access the HDM Web interface.
· User role: Select a user role, which represents a set of network and service access privileges. Available user roles include:
¡ Administrator—The user has read and write permissions to all features.
¡ Operator—The user has read permission to all features and has write permission to some features.
¡ User—The user has read-only permission.
¡ None—The user does not have network access permissions. This role is for special use. Do not assign the role to any users.
For information about privileges that a user role has, see the user roles and privileges matrix in "User accounts."
· Extended privileges: Select the KVM (remote console), VMedia, Web, and IPMI access privileges for the user as needed.
Web and IPMI access are authorized to administrators and operators by default and cannot be revoked.
· SNMP extended privileges: Select whether to grant the user with SNMP extended privileges. To grant the privileges, you must enable user access to HDM and the user password must contain a minimum of eight characters. If you select SNMP extended privileges, select a privilege from the SNMP v3 R/W permission field. Options include:
¡ Read: The user has read-only permission. This enables the user to perform GET operations and receive traps.
¡ Read/Write: The user has read-and-write permission. This enables the user to perform GET and SET operations and receive traps.
· SNMP v3 authProtocol: Select the SNMP v3 authentication protocol. Options include SHA MD5. The default protocol is SHA.
· SNMP v3 privProtocol: Select the SNMP v3 privacy protocol. Options include DES and AES. The default protocol is DES.
· Email address: Enter the email address at which the user is contacted. The address cannot exceed 63 characters. You can use the address to retrieve the password for the user account. To send alert emails to a user, you must specify an email address in the user account for that user. Alert emails are configurable from the Platform Event Filters (PEF) menu.
· New SSH key: This field is reserved for future use.
User roles and privileges matrix
The supported features or feature menus vary by server model.
The following information describes the privileges that a user role has. A feature or feature menu is inaccessible if your user role does not have the privileges to use that feature or feature menu.
|
Menu/Feature |
Administrator |
Operator |
User |
|
Dashboard menu |
|||
|
View basic server information |
√ |
√ |
√ |
|
View basic server status information |
√ |
√ |
√ |
|
View HDM user sessions |
√ |
√ |
× |
|
View hardware information |
√ |
√ |
√ |
|
View FRU information |
√ |
√ |
√ |
|
Set asset tags |
√ |
× |
× |
|
View firmware information |
√ |
√ |
√ |
|
View sensor information |
√ |
√ |
√ |
|
Set the drive UID LED |
√ |
× |
× |
|
View monitoring statistics |
√ |
√ |
√ |
|
View resource summary |
√ |
√ |
√ |
|
Set alarm thresholds |
√ |
× |
× |
|
View log |
√ |
√ |
√ |
|
Download log |
√ |
× |
× |
|
Server Health menu |
|||
|
View event log |
√ |
√ |
√ |
|
Save event log in CSV format |
√ |
√ |
√ |
|
Delete event log entries |
√ |
√ |
× |
|
Configure event log settings |
√ |
√ |
× |
|
View operation log |
√ |
√ |
√ |
|
Save operation log in CSV format |
√ |
√ |
√ |
|
Configure operation log settings |
√ |
√ |
× |
|
View BSoD screenshots |
√ |
√ |
√ |
|
Play videos |
√ |
√ |
√ |
|
Configure advanced settings for video replay |
√ |
√ |
× |
|
Play, download, and delete videos |
√ |
√ |
× |
|
View POST codes |
√ |
√ |
√ |
|
Network menu |
|||
|
View information about the HDM dedicated network port |
√ |
√ |
√ |
|
Configure the HDM dedicated network port |
√ |
× |
× |
|
View information about the HDM shared network port |
√ |
√ |
√ |
|
Specify the HDM shared network port |
√ |
× |
× |
|
View DNS settings |
√ |
√ |
√ |
|
Configure DNS settings |
√ |
× |
× |
|
View network bonding settings |
√ |
√ |
× |
|
Configure network bonding |
√ |
× |
× |
|
View active/standby mode settings |
√ |
√ |
× |
|
Configure active/standby mode settings |
√ |
× |
× |
|
Configuration menu |
|||
|
View user accounts |
√ |
√ |
× |
|
Configure a user account |
√ |
× |
× |
|
Configure the password policy |
√ |
× |
× |
|
View NTP servers |
√ |
√ |
√ |
|
Configure NTP servers |
√ |
× |
× |
|
View LDAP user group configuration |
√ |
√ |
× |
|
Configure LDAP role groups |
√ |
× |
× |
|
View LDAP settings |
√ |
√ |
× |
|
Configure LDAP settings |
√ |
× |
× |
|
View SNMP settings |
√ |
√ |
× |
|
Configure SNMP settings |
√ |
× |
× |
|
View PEF settings |
√ |
√ |
× |
|
Add and edit PEF settings |
√ |
× |
× |
|
Security menu |
|||
|
View service information |
√ |
√ |
× |
|
Configure services |
√ |
× |
× |
|
View firewall settings |
√ |
√ |
× |
|
Configure the firewall |
√ |
× |
× |
|
View the SSL certificate |
√ |
√ |
× |
|
Configure SSL |
√ |
× |
× |
|
Remote Control menu |
|||
|
Use KVM remote console |
|||
|
Use H5 KVM remote console |
This feature is available if the user logs in with a user account that has the extended KVM privilege. |
||
|
View UID LED status |
√ |
√ |
√ |
|
Set the UID LED |
√ |
√ |
× |
|
Display system boot options |
√ |
√ |
√ |
|
Set one-time boot mode |
√ |
√ |
× |
|
View remotely mounted media images |
This feature is available if the user logs in with a user account that has the extended VMedia privilege. |
||
|
Set remote media mounting |
This feature is available if the user logs in with a user account that has the extended VMedia privilege. |
||
|
Configure remote media mounting settings |
This feature is available if the user logs in with a user account that has the extended VMedia privilege. |
||
|
View RAID configuration |
√ |
√ |
√ |
|
Configure RAID settings |
√ |
× |
× |
|
Power & Thermal menu |
|
|
|
|
Display power status |
√ |
√ |
√ |
|
Power status control |
√ |
√ |
× |
|
NMI control |
√ |
× |
× |
|
Display power configuration |
√ |
√ |
√ |
|
Meter power (primary/secondary, power output, automatic power-on) |
√ |
√ |
× |
|
√ |
√ |
√ |
|
|
Start a new power consumption statistics period |
√ |
√ |
× |
|
View fan configuration |
√ |
√ |
√ |
|
Configure fan settings |
√ |
√ |
× |
|
View processor power states |
√ |
√ |
√ |
|
Configure processor power states |
√ |
√ |
× |
|
Maintenance menu |
|||
|
Update firmware |
√ |
× |
× |
|
Import and export configuration |
√ |
× |
× |
|
Reset HDM |
√ |
× |
× |
|
Change between the primary and backup HDM images |
√ |
× |
× |
|
Reset CPLD |
√ |
× |
× |
|
Miscellaneous |
|||
|
View power status of the server |
√ |
√ |
√ |
|
View UID LED status |
√ |
√ |
√ |
|
Toggle between languages |
√ |
√ |
√ |
|
Access online help |
√ |
√ |
√ |
|
Refresh a page |
√ |
√ |
√ |
|
View most recent event notifications |
√ |
√ |
√ |
|
Sign out HDM |
√ |
√ |
√ |
LDAP
Lightweight Directory Access Protocol (LDAP) is an Internet protocol for accessing cross-platform and standard-based directory services. Developed based on X.500, LDAP provides benefits of X.500 as well as optimized reading, browsing, and query performance.
LDAP is suitable for storing data that does not change often and is typically used for storing user information. For example, Windows operating systems use Active Directory Server (LDAP server software) to store user and user group information for authentication and authorization at user logins.
You can enable LDAP authentication and configure an LDAP access policy to allow access to HDM with the user accounts on the LDAP server.
Configure LDAP settings
Procedure
1. In the navigation pane, select Configuration > LDAP.
2. In the work pane, click Settings.
3. Enable LDAP authentication, and then configure the LDAP parameters, as shown in Figure 136.
4. Click OK.
Figure 136 Configuring the LDAP parameters
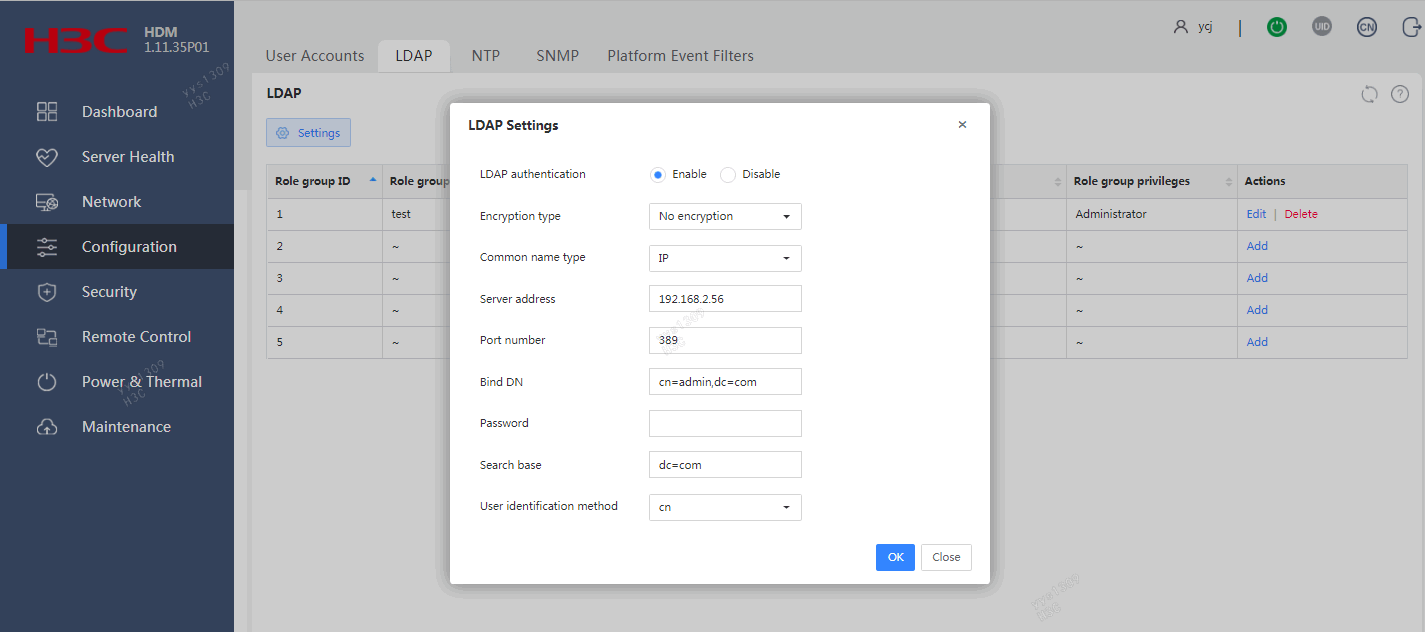
Parameters
· Encryption type: Select the encryption type.
¡ No encryption—Establishes an unencrypted connection with the LDAP server.
¡ SSL—Establishes an SSL encrypted connection with the LDAP server.
· Common name type: IP address or FQDN.
· Server address: IPv4 address, IPv6 address, or domain name of the LDAP server.
· Port number: LDAP service port number, in the range of 1 to 65535. For an SSL connection, the port number is 636 by default. For the remaining types of connections, the port number is 389 by default.
· Bind DN: Distinguished name of the LDAP administrator that is permitted to search the LDAP directory used for HDM user authentication. The maximum length is 255 bytes.
· Password: Directory password of the LDAP administrator.
· Search base: Search base (directory) of the bind DN on the LDAP server. The maximum length is 255 bytes.
· User identification method: User identification method used by the LDAP server. Supported methods are cn and uid.
Manage role groups
Add a role group
1. In the navigation pane, select Configuration > LDAP.
2. In the work pane, click Add in an empty role group entry.
3. Configure the role group parameters, as shown in Figure 137.
4. Click OK.
Figure 137 Adding a role group
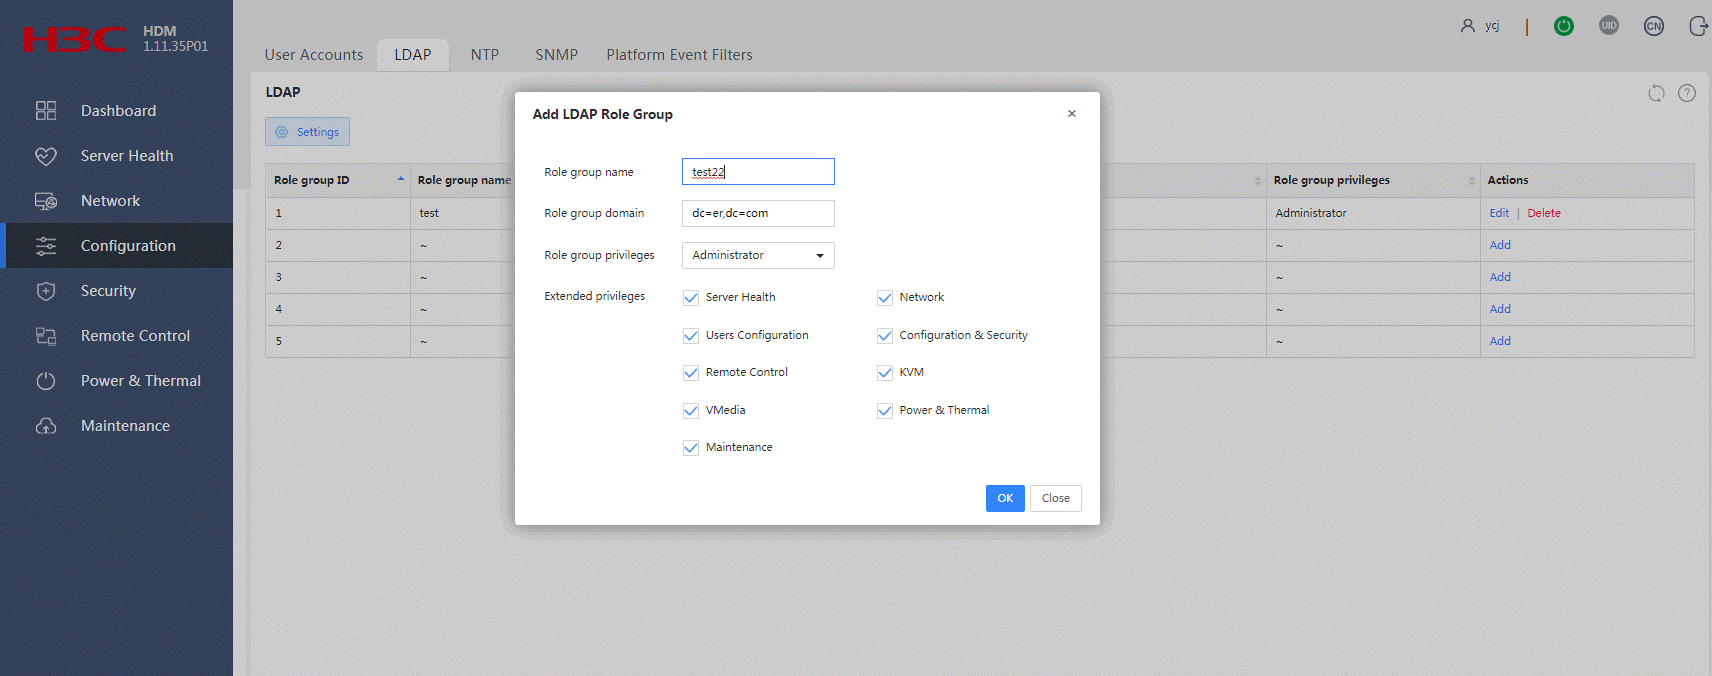
Edit a role group
1. In the navigation pane, select Configuration > LDAP.
2. In the work pane, click the Edit link in the role group entry that you want to modify.
3. Modify the parameters, as shown in Figure 138.
4. Click OK.
Figure 138 Modifying a role group
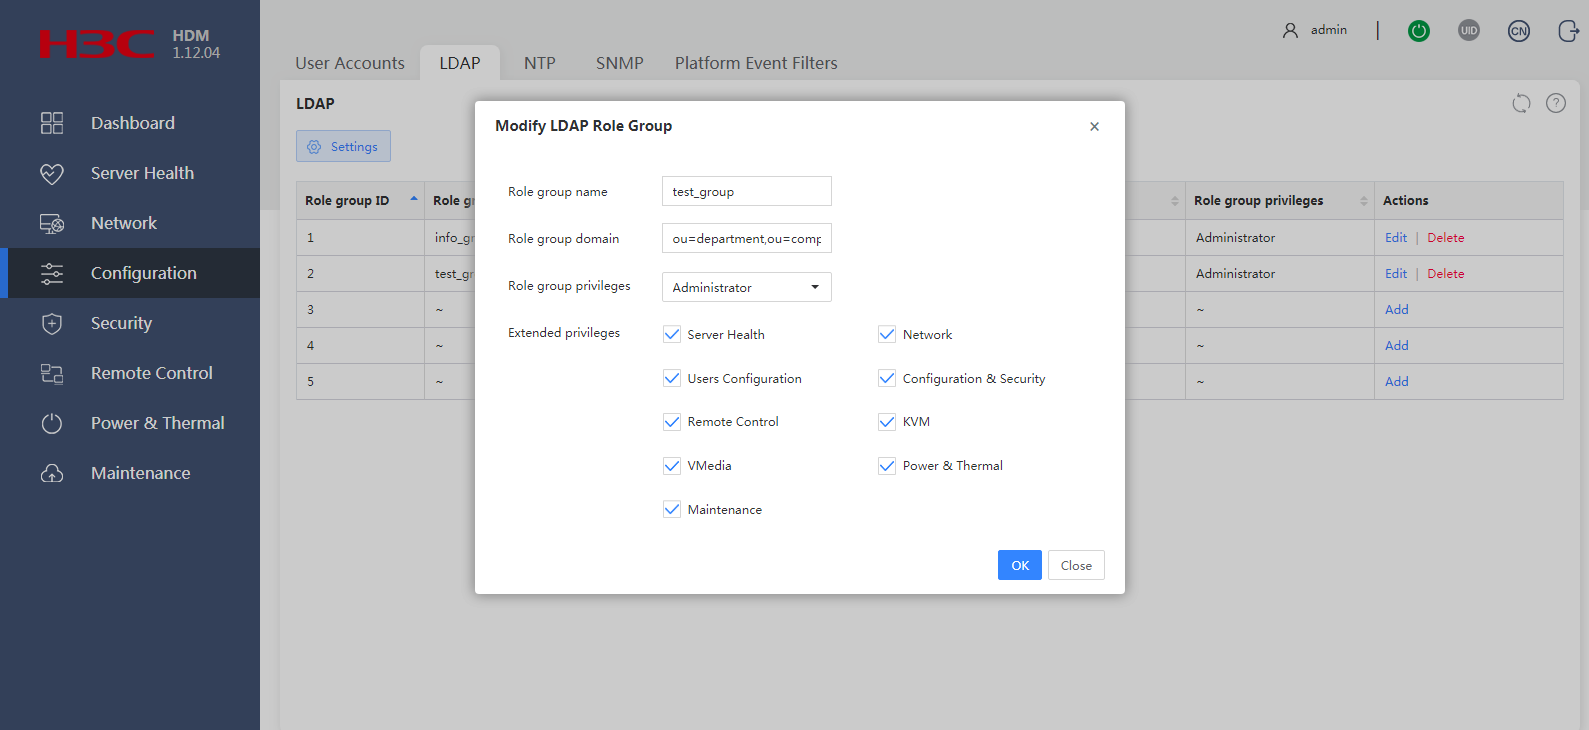
Delete a role group
1. In the navigation pane, select Configuration > LDAP.
2. In the work pane, click Delete in the role group entry that you want to delete.
Parameters
· Role group ID: ID of the role group.
· Role group name: Name of an existing role group on the LDAP server.
· Role group domain: Search base (directory) of the role group on the LDAP server. The maximum length is 255 bytes.
· Role group privileges: HDM user role for the role group.
· Extended privileges: Permissions of the HDM users in the role group.
NTP
Network Time Protocol (NTP) is a protocol used to synchronize clock time of devices in a network.
Use this feature to obtain the correct system date and time from an NTP server.
You can manually specify one primary NTP server and one secondary NTP server. When synchronizing time with NTP, HDM first uses the primary NTP server. If the primary NTP server is not available, HDM uses the secondary NTP server.
With HDM, you can also choose to obtain NTP server settings from the DHCP server when both manually specified NTP servers are unavailable. If the DHCP server is not available, HDM uses the system date and time obtained in the most recent successful NTP time synchronization or uses the local system date and time.
Configure NTP settings
Procedure
1. In the navigation pane, select Configuration > NTP, as shown in Figure 139.
Figure 139 Configuring NTP settings
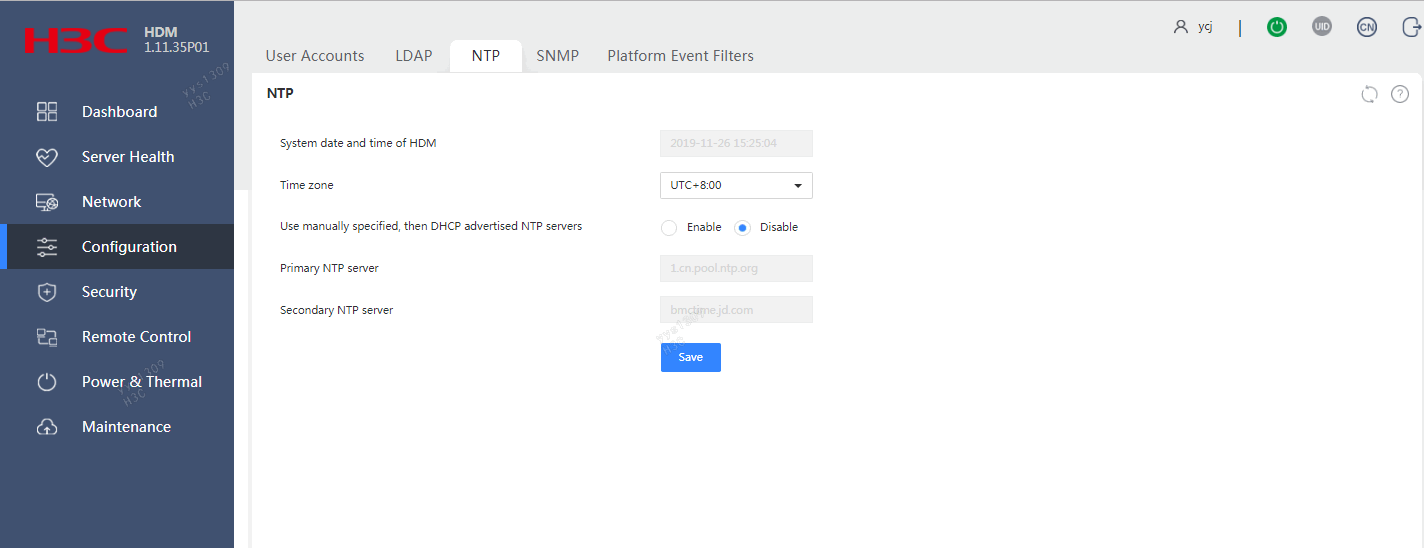
2. In the work pane, select the time zone of the server.
3. Select Enable or Disable for Use manually specified, then DHCP advertised NTP servers.
¡ With this feature enabled, HDM synchronizes time settings with a manually specified NTP server. If the manually specified NTP servers fail, HDM synchronizes settings with the NTP server obtained from the DHCP server. This is the default setting.
¡ With this feature disabled, HDM synchronizes time settings with ME. After the BIOS reboots, HDM starts to synchronize time settings based on the time in the BIOS (UTC time) and the specified time zone. For example, if the specified time zone is UTC+8, HDM uses a time eight hours earlier than the time in the BIOS.
4. If you select Enable for Use manually specified, then DHCP advertised NTP servers, enter the addresses of the primary and secondary NTP servers.
The server addresses can be IPv4 addresses, IPv6 addresses, or domain names. The secondary server is optional. The HDM server uses the secondary NTP server only when the primary NTP server fails.
By default, the primary NTP server address is 1.cn.pool.ntp.org and the secondary NTP server address is 2.cn.pool.ntp.org.
5. Click Save.
HDM attempts to synchronize time.
Remarks
If time synchronization with the NTP server fails because the NTP server is not reachable, the Web interface displays an error message about the failure to obtain date and time from the NTP server. To synchronize with the NTP server after it becomes reachable or to start new time synchronization, you must click Save again. HDM does not perform time synchronization without being triggered by the Save action.
SNMP
Simple Network Management Protocol (SNMP) is an Internet protocol used for remote management and operations. It allows users to manage devices of different vendors with different physical characteristics and interconnection technologies in the network through NMS. For example, monitor device status, collect statistics, and perform troubleshooting.
You can configure and view SNMP settings.
Restrictions and guidelines
The SNMP SET operation is not supported if the read/write community string is empty.
The read/write community string cannot be the same as the read-only community string.
Procedure
1. In the navigation pane, select Configuration > SNMP.
2. In the work pane, configure SNMP settings, as shown in Figure 140.
3. Click Save.
Figure 140 Configuring SNMP settings
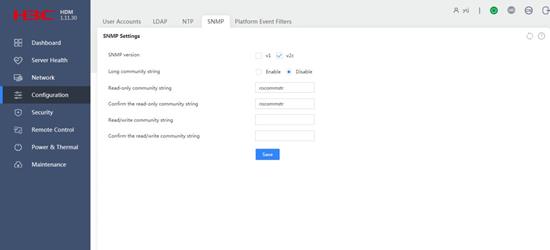
Parameters
· SNMP version: Select an SNMP version available for SNMP GET and SET operations. Options include v1 and v2c. SNMP v3 is supported by default.
· Long community string: Select whether to enable the long community string feature. This feature is disabled by default.
If you enable long community string, the value range for the community strings is 16 to 32 characters. If you disable the long community string feature, the value range for the community strings is 1 to 32 characters. You can leave the read/write community string empty, regardless of whether the long community string feature is enabled.
· Read-only community string: Enter the read-only community string for security authentication. The default read-only SNMP community string is rocommstr. If the long community string feature is enabled, the default string becomes invalid and you must specify a valid read-only community string.
· Read/write community string: Enter the read/write community string for security authentication. The default read/write SNMP community string is empty.
Remarks
The Read-only community string and Read/write community string fields can contain only letters, digits, and the following special characters:
` ~ ! @ $ % ^ & * ( ) _ + - = [ ] { } | : , . / ?
Platform event filters
Platform Event Filtering (PEF) is a platform that monitors event logs generated by the server and filters them based on PEF policies to determine whether to send alarms.
You can configure PEF to send emails or SNMP traps to notify the concerned server administrative staff members of server events for prompt action.
Manage alert emails
HDM sends alert emails through Simple Mail Transfer Protocol (SMTP). To send an alert email to a user, you must configure SMTP, specify that user as an email recipient, and configure the alert policy for that user.
Prerequisites
Make sure you have specified an email address in the user account for the email recipient. For information about adding an email address for a user account, see "User accounts."
Set up SMTP for alert emails
1. In the navigation pane, select Configuration > Platform Event Filters.
2. In the work pane, click the Alert email tab.
3. In the SMTP setup section, configure SMTP, as shown in Figure 141:
¡ Select Enable for SMTP.
¡ Enter the SMTP server address and port number.
¡ To send alert emails as anonymous emails, select Enable for Anonymous email. To send alert emails with sender identity information, clear Enable for Anonymous email and enter the username and password for connecting to the SMTP server.
¡ Enter the sender email address. Make sure the email service uses the SMTP mail server.
4. Click Save.
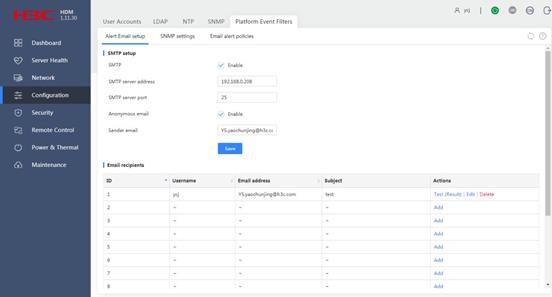
Add an alert email recipient
1. To have a user receive alert emails, you must specify an email address for that user when you set up the user account on the Configuration > User Accounts page.
2. In the navigation pane, select Configuration > Platform Event Filters.
3. In the work pane, click the Alert email tab.
4. Click Add in an empty alert recipient entry.
Each entry has a unique ID, which will be used to identify the recipient in alert policies.
5. Select the username of the recipient and enter the email subject. The email address of the user is automatically populated.
Chinese characters are not supported for the email subject.
6. Click Test to send a test email, and then click Result to view the test result.
Configure SNMP trap settings
You can send server events in SNMP traps to an SNMP management workstation.
To configure SNMP trap settings:
1. In the navigation pane, select Configuration > Platform Event Filters.
2. In the work pane, click the SNMP trap tab.
3. Select Enable for SNMP settings, and then configure SNMP trap parameters, as shown in Figure 142.
4. Click Save.
Figure 142 Configuring SNMP trap settings
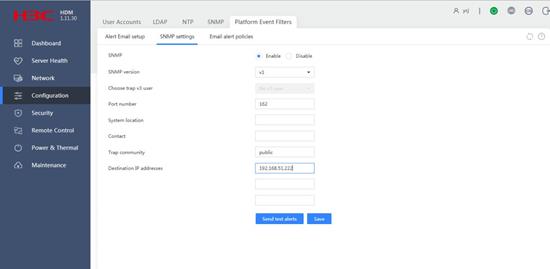
Parameters
· SNMP version: Select an SNMP version. Options include SNMPv1, SNMPv2c, and SNMPv3.
· Choose trap v3 user: Select the username used by the system to send SNMPv3 traps.
· System location: Enter the location of the server, a string of up to 31 bytes.
· Contact: Enter contact information, a string of up to 31 bytes.
· Trap community: Enter the trap community string for authentication on the manager. The value range is 1 to 18 characters. The default value is public.
· Destination IP addresses: Enter the IP addresses of the destination hosts. You must enter a minimum of one destination IP addresses. The server will send SNMP traps to all the specified destination IP addresses.
Remarks
The System location, Contact, and Trap community fields can contain only letters, digits, and the following special characters:
` ~ ! @ $ % ^ & * ( ) _ + - = [ ] { } | : , . / ?
Configure an alert policy
Restrictions and guidelines
For alert policies with the same email recipient, an enabled policy takes precedence over a disabled policy.
Procedure
1. In the navigation pane, select Configuration > Platform Event Filters.
2. In the work pane, click the Alert email policies tab, as shown in Figure 143.
3. Click Add in an empty policy entry.
4. Select Enable for Policy state.
5. Select an email recipient ID from the Email recipient ID list.
Each email recipient ID identifies an email recipient on the Alert Email tab.
6. Click OK.
Figure 143 Configuring an alert policy
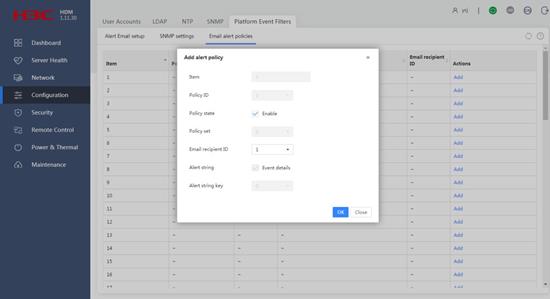
Configure security settings
Access services
HDM provides access services including access to various storage devices (for example, CD/DVD and hard disk drives), remote control, and multiple access methods (for example, SNMP and SSH). With the administrator role, you can control which services HDM offers to users.
View or close HDM user sessions
Restrictions and guidelines
The available services vary by server model.
Procedure
1. In the navigation pane, select Security > Services.
2. In the work pane, click View in an access service entry, as shown in Figure 144.
Figure 144 Viewing access service entries
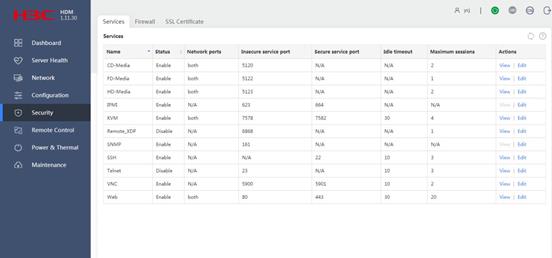
3. On the page that opens, view detailed information about HDM user sessions, as shown in Figure 145.
Figure 145 Viewing detailed information about user sessions
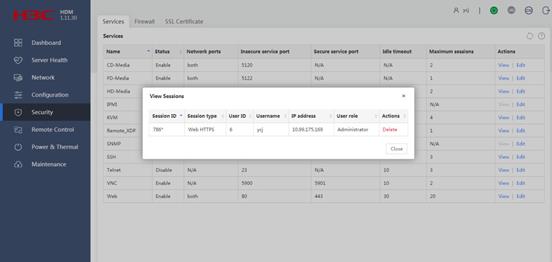
4. To close a session, click the Delete link in that session entry.
5. To return to the previous page, click Close.
Parameters
· Name: Name of the service.
HDM provides the following services:
¡ CD-Media—Access to the virtual CDs and DVDs.
¡ FD-Media—Access to the virtual floppy disk drives.
¡ HD-Media—Access to the virtual disk drives and USB.
¡ IPMI—Remote Management Control Protocol (RMCP) or RMCP+ connections to HDM.
¡ KVM—Access to the server from a remote console.
¡ Remote_XDP—Remote debugging and diagnosis through XDP.
¡ SNMP—SNMP access to HDM.
¡ SSH—SSH access to HDM.
¡ Telnet—Telnet access to HDM.
¡ VNC—Access to the server from a Virtual Network Computing (VNC) client.
¡ Web—Access to the HDM Web interface.
· Status: Status of the service. Options include:
¡ Disabled.
¡ Enabled.
· Network ports: HDM network ports that can be used for the service.
¡ eth0—Shared port.
¡ eth1—HDM dedicated port.
¡ both—Both shared and HDM dedicated ports.
¡ Bond0—HDM Bond port.
· Insecure service port: Port used for unencrypted communication of the service.
· Secure service port: Port used for encrypted communication of the service.
· Idle timeout: Idle timeout time of the user session, in minutes. A user session automatically disconnects when it times out.
· Maximum sessions: Maximum number of sessions supported for the service.
· Session ID: ID that identifies the session among HDM user sessions. An asterisk (*) mark identifies the session established by you.
· Session type: Protocol type or service type of the session.
· User ID: ID of the user account in the user list on the Configuration > User Accounts page.
· Username: Username of the user account.
· IP address: IP address of the user using the service.
· User role: User role of the user account, which represents a set of access privileges.
Edit an access service
Restrictions and guidelines
The available services vary by server model.
If you change the default secure or insecure service port of a service, follow these guidelines when you use that service:
· If you change the default IPMI insecure service port number (623), you must use the -p parameter to explicitly specify the port number when you execute an IPMI command.
· If you change the default secure or insure Web service port number, you must explicitly specify the Web service port when you access HDM from a Web browser. The HDM URL address format is https://ip_address:secure-port.
· If you change the default remote_xdp service port number (6868), you must also update the port number change to the OpenIPC client in the installation directory\OpenIPC\Config\SKX\ SKX_ASD_JTAG.xml directory. The installation directory argument represents the installation directory of the OpenIPC client.
Procedure
1. In the navigation pane, select Security > Access services.
2. In the work pane, click the Edit link in the service entry you want to modify.
3. Edit the service parameters, as shown in Figure 146.
When you change the default service port number, follow the previously described restrictions and guidelines.
4. Click OK.
The service restarts automatically and all active sessions of the service disconnect.
Figure 146 Edit an access service
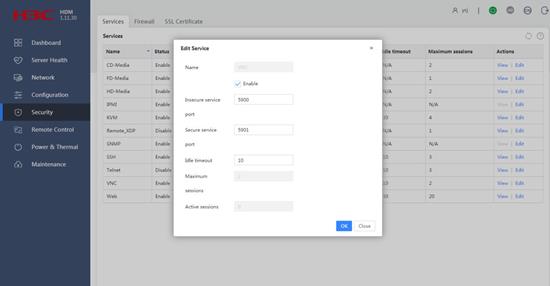
Parameters
· Enable: Select this option to enable the service. To disable the service, clear this option.
· Network ports: Select an HDM network port.
· Insecure service port: Set the service port number for unencrypted communication of the service. The value range is 1 to 65535.
· Secure service port: Set the service port number for encrypted communication of the service. The value range is 1 to 65535.
Table 10 Default port numbers used by the supported access services
|
Service |
Default insecure port |
Default secure port |
|
CD-Media |
5120 |
N/A |
|
FD-Media |
5122 |
N/A |
|
HD-Media |
5123 |
N/A |
|
IPMI |
623 |
664 |
|
KVM(remote console) |
7578 |
7582 |
|
Remote_XDP |
6868 |
N/A |
|
SNMP |
161 |
N/A |
|
SSH |
N/A |
22 |
|
Telnet |
23 |
N/A |
|
VNC |
5900 |
N/A |
|
Web |
80 |
443 |
· Idle timeout: Set the session idle timeout time for the service. You can set the timeout for Web, KVM, SSH, and Telnet services. The SSH and Telnet services use the same idle timeout time. If you set an idle timeout for both SSH and Telnet, the most recent configuration takes effect.
Table 11 Timeout value ranges and default timeout settings of services
|
Service name |
Timeout value range (in minutes) |
Default timeout (in minutes) |
|
Web |
5 to 30 |
30 |
|
KVM (remote console) |
5 to 30 |
30 |
|
SSH |
1 to 30 |
10 |
|
Telnet |
1 to 30 |
10 |
|
VNC |
5 to 30 |
10 |
Firewall
The firewall protects HDM from attacks based on firewall rules that identify accesses to be permitted or blocked.
Types of firewall rules and their priority order
You can create the following firewall rules:
· IP protocol rules—Permit or block accesses to the HDM server based on the IP protocol version (IPv4 or IPv6).
· IP address rules—Permit or block accesses to the HDM server from the specified IP addresses.
· Service port rules—Permit or block accesses to the HDM server from the specified service ports.
· MAC address rules—Permit or block accesses to the HDM server from the specified MAC addresses.
The IP protocol rules have the highest priority. The priorities of the IP address rules, service port rules, and MAC address rules depend on their configuration order. The rule configured later has higher priority.
Firewall rule configuration guidelines
To effectively protect HDM server from illegitimate accesses, follow these guidelines when you create firewall rules:
· Use permit rules in conjunction with block rules. By default, the firewall permits all accesses. You do not need to create permit rules if there are no block rules.
· To block the accesses from an IP address range or a service port except for the access from a particular IP or MAC address, add the permit rule after you add the block rule. For example, to block an IP range (1.1.1.1 to 1.1.1.5) but permit one IP in the range (1.1.1.3), you can first create an IP rule to block the IP address range (1.1.1.1 to 1.1.1.5), and then create a rule to permit the IP address 1.1.1.3.
Manage IP protocol rules
Use IP protocol rules to block accesses from all IPv4 or IPv6 addresses.
Prerequisites
An IP protocol rule bocks accesses from all IPv4 addresses, all IPv6 addresses, or both. Make sure you understand its impact when you add an IP protocol rule.
Add an IP protocol rule
1. In the navigation pane, select Security > Firewall, as shown in Figure 147.
Figure 147 Accessing the firewall configuration page
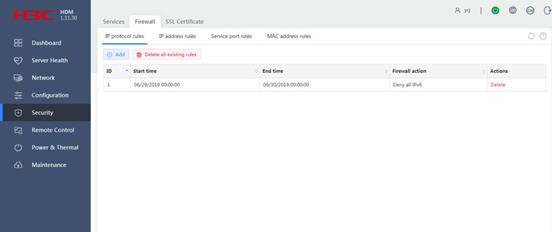
2. In the work pane, click the IP protocol rules tab.
3. Click Add, as shown in Figure 148.
4. From the Block list, select the IP protocol version to be blocked:
¡ To block accesses from all IPv4 addresses, select IPv4.
¡ To block accesses from all IPv6 addresses, select IPv6.
¡ To block all accesses, whether they are from IPv4 or IPv6 addresses, select Both.
5. (Optional.) To specify a time range in which the rule takes effect, select the Time-based option, and then select the start and end date and time settings.
The firewall uses the system time in the HDM server as a reference when it executes the time range setting. However, the time selectors for the Start time and End time fields use the system time in the HDM client. The selectors might display different current date and time from the HDM server. To identify the current time in the HDM server for manual time adjustment when you specify the time range, navigate to Dashboard > Summary.
6. Click OK.
Figure 148 Configuring an IP protocol rule
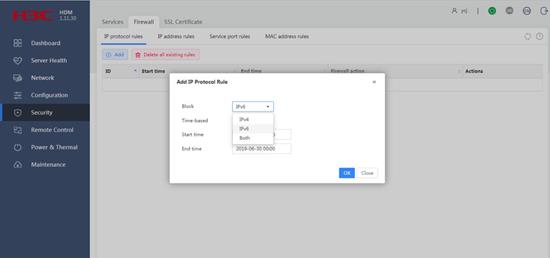
Delete an IP protocol rule
1. In the navigation pane, select Security > Firewall.
2. In the work pane, click the IP protocol rules tab.
3. In the firewall rule list, click Delete in the rule entry, as shown in Figure 149.
Figure 149 Deleting an IP protocol rule
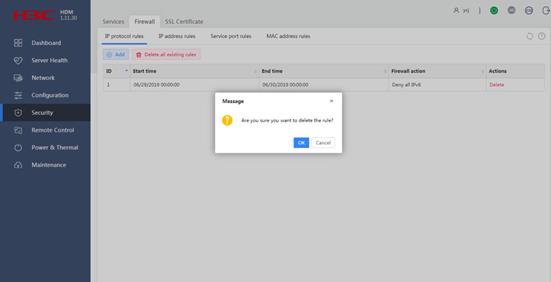
Delete all IP protocol rules
1. In the navigation pane, select Security > Firewall.
2. In the work pane, click the IP protocol rules tab.
3. In the firewall rule list, click Delete all existing rules.
4. In the confirmation dialog box that opens, click OK, as shown in Figure 150.
Figure 150 Deleting all IP protocol rules

Manage IP address rules
An IP address rule permits or blocks accesses from the specified IP addresses to the HDM server.
IP address rule restrictions and guidelines
The IP rules with block action do not take effect on Web accesses that use a Web proxy.
Add an IP address rule
1. In the navigation pane, select Security > Firewall.
2. Click the IP address rules tab.
3. Click Add, as shown in Figure 151.
4. In the dialog box that opens, enter an IP address or address range in the IP/IP range field for the rule.
5. (Optional.) To specify a time range in which the rule takes effect, select the Time-based option, and then select the start and end date and time settings.
The firewall uses the system time in the HDM server as a reference when it executes the time range setting. However, the time selectors for the Start time and End time fields use the system time in the HDM client. The selectors might display different current date and time from the HDM server. To identify the current time in the HDM server for manual time adjustment when you specify the time range, go to Dashboard > Summary.
6. Select a firewall action:
¡ To permit access to the HDM server, select Permit.
¡ To block access to the HDM server, select Block.
7. Click OK.
Figure 151 Configuring an IP address rule
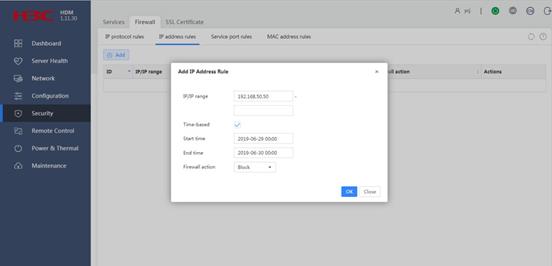
Delete an IP address rule
1. In the navigation pane, select Security > Firewall.
2. In the work pane, click the IP address rules tab.
3. Click Delete in the IP rule entry you want to delete, as shown in Figure 152.
Figure 152 Deleting an IP address rule
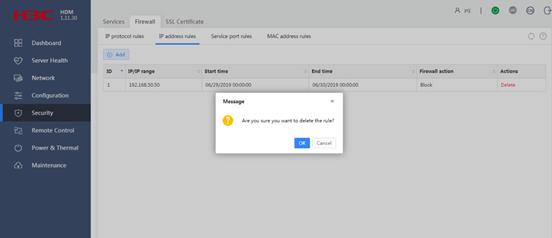
Manage service port rules
A service port rule permits or blocks accesses from the specified service port numbers to the HDM server.
Add a port rule
1. In the navigation pane, select Security > Firewall.
2. In the work pane, click the Service port rules tab.
3. Click Add, as shown in Figure 153.
4. In the dialog box that opens, enter a port number or port number range in the Port/Port range field for the rule.
The value range for the port numbers is 1 to 65535.
5. Select a protocol. The default protocol is TCP.
6. (Optional.) To specify a time range in which the rule takes effect, select the Time-based option, and then select the start and end date and time settings.
The firewall uses the system time in the HDM server as a reference when it executes the time range setting. However, the time selectors for the Start time and End time fields use the system time in the HDM client. The selectors might display different current date and time from the HDM server. To identify the current time in the HDM server for manual time adjustment when you specify the time range, go to Dashboard > Summary.
7. Select a firewall action:
¡ To permit access to the HDM server, select Permit.
¡ To block access to the HDM server, select Block.
8. Click OK.
Figure 153 Configuring a port rule
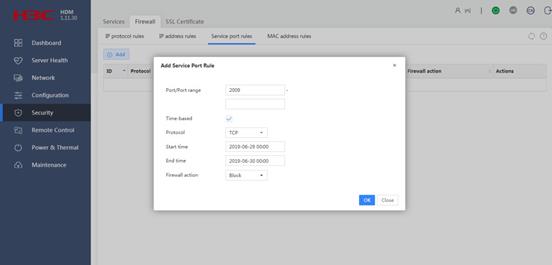
Delete a port rule
1. In the navigation pane, select Security > Firewall.
2. In the work pane, select the Service port rules tab.
3. Click Delete in the rule entry you want to delete, as shown in Figure 154.
Figure 154 Deleting a port rule
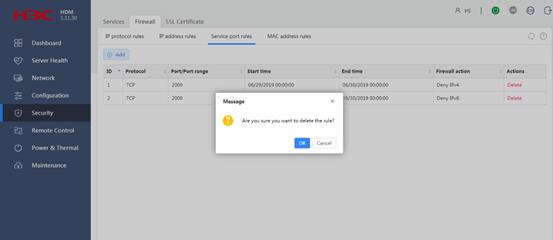
Manage MAC address rules
A MAC address rule permits or denies accesses from the specified MAC addresses to the HDM server.
Add a MAC address rule
1. In the navigation pane, select Security > Firewall.
2. In the work pane, click the MAC address rules tab.
3. Click Add, as shown in Figure 155.
4. In the dialog box that opens, enter a MAC address in the MAC address field.
5. (Optional.) To specify a time range in which the rule takes effect, select the Time-based option, and then select the start and end date and time settings.
The firewall uses the system time in the HDM server as a reference when it executes the time range setting. However, the time selectors for the Start time and End time fields use the system time in the HDM client. The selectors might display different current date and time from the HDM server. To identify the current time in the HDM server for manual time adjustment when you specify the time range, go to Dashboard > Summary.
6. Select a firewall action (permit or block).
7. Click OK.
Figure 155 Configuring a MAC address rule
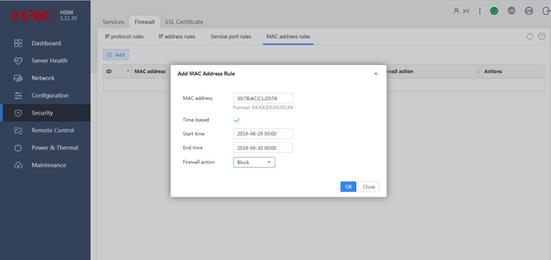
Delete a MAC address rule
1. In the navigation pane, select Security > Firewall.
2. In the work pane, click the MAC address rules tab.
3. Click Delete in the rule entry that you want to delete, as shown in Figure 156.
Figure 156 Deleting a MAC address rule
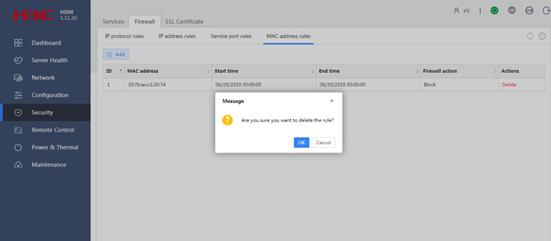
SSL certificate
Secure Sockets Layer (SSL) is a protocol for securely transmitting private data over the Internet. It uses keys to encrypt and decrypt data on the Web server and client. After an SSL certificate is uploaded or generated, the Web server and client can have secure data transmission. Other users cannot view or modify the data during the transmission.
SSL protects HDM accesses from eavesdropping and data tampering and enables HDM users to authenticate the HDM server through SSL certificate authentication.
Upload an SSL certificate and key to HDM
Prerequisites
Before you upload an SSL certificate, perform the following tasks:
· Make sure you signed in with the administrator role.
· Identify the date and time in HDM on the Dashboard > Summary page, and verify that the HDM system time is in the validity period of the certificate. If the HDM system time is not in the validity period of the certificate, SSL authentication will fail.
· Make sure the certificate file and the private key files are in PEM format.
Procedure
1. In the navigation pane, select Security > SSL Certificate.
2. In the work pane, click the Upload certificate tab, as shown in Figure 157.
Figure 157 Uploading an SSL certificate and key
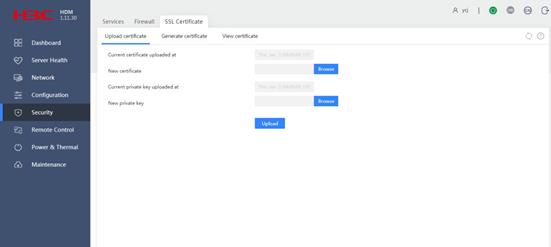
3. Examine information about the current certificate and private key to decide whether a new set of certificate and private key is needed:
¡ Current certificate uploaded at—Date and time when the current certificate was uploaded.
¡ Current private key uploaded at—Date and time when the current private key was uploaded.
4. Click Browse next to the New certificate field, and then select an SSL certificate file.
You can obtain an SSL certificate from the certification authority or use a tool to generate an SSL certificate yourself.
5. Click Browse next to the New private key field, and then select a private key file.
6. Click Upload to upload the SSL certificate file and private key file to the HDM server.
After the certificate is uploaded, your user session will be disconnected. The HDM server will use the new SSL certificate for authentication during subsequent sign ins.
7. If you uploaded an SSL certificate generated by yourself, verify that the corresponding root certificate already exists in the client browser. This section uses IE 11.0 to illustrate how to view and add the root certificate of the certification authority to the browser.
a. Open the browser.
b. From the toolbar, click Tools. Then, select Internet options.
c. In the dialog box that opens, click the Content tab and then click Certificates.
d. Click the Trusted Root Certification Authorities tab to view the trusted root certification authorities and root certificate expiration date.
e. If the certification authority is not in the list, click Import to import the root certificate.
Figure 158 Viewing and adding the root certificate
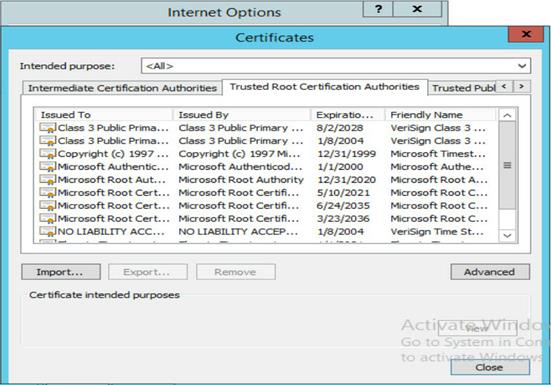
Generate an SSL certificate
Prerequisites
To generate an SSL certificate, you must have the administrator role.
Procedure
1. In the navigation pane, select Security > SSL Certificate.
2. In the work pane, click the Generate certificate tab.
3. Configure the certificate parameters, as shown in Figure 159.
Figure 159 Configuring an SSL certificate
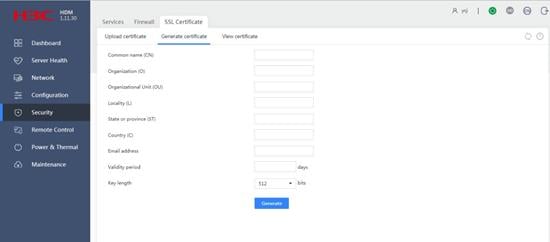
4. Click Generate.
5. In the confirmation dialog box that opens, click OK.
If the certificate is generated, you receive a success result message.
The HDM server will use the new SSL certificate for authentication during subsequent sign-ins.
Parameters
· Common name (CN): Full domain name of the HDM server, a string of 1 to 64 characters. Only letters, digits, spaces, underscores (_), hyphens (-), and dots (.) are allowed. The common name cannot be a digits-only string.
· Organization (O): Name of the organization that owns the HDM server, a string of 1 to 64 characters. Only letters, digits, spaces, underscores (_), hyphens (-), and dots (.) are allowed. The organization name cannot be a digits-only string.
· Organizational Unit (OU): Name of the unit that owns the HDM server in the organization, a string of 1 to 64 characters. Only letters, digits, spaces, underscores (_), hyphens (-), and dots (.) are allowed. The organizational unit name cannot be a digits-only string.
· Locality (L): City or county where the HDM server resides, a string of 1 to 128 characters. Only letters, digits, spaces, underscores (_), hyphens (-), and dots (.) are allowed. The locality name cannot be a digits-only string.
· State or province (ST): State or province where the HDM server resides, a string of 1 to 128 characters. Only letters, digits, spaces, underscores (_), hyphens (-), and dots (.) are allowed. The state or province name cannot be a digits-only string.
· Country (C): Country or region where the HDM server resides. The country/region is represented as a two-letter code.
· Email address: Email address at which the HDM server owner can be contacted.
· Validity period: Validity period of the SSL certificate, in the range of 1 to 5475 days.
· Key length: Key length of the certificate.
View SSL certificate
Procedure
1. In the navigation pane, select Security > SSL Certificate.
2. In the work pane, click the View certificate tab.
3. View information about the current SSL certificate, as shown in Figure 160.
Figure 160 Viewing information about the current SSL certificate
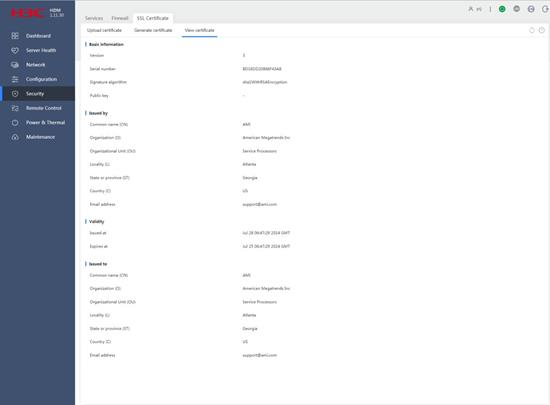
Parameters
· Basic information: Basic information about the current SSL certificate.
¡ Version—Version number of the certificate.
¡ Serial number—Serial number of the certificate. This number is assigned by the certification authority (CA).
¡ Signature algorithm—Signature algorithm of the certificate.
¡ Public key—Public key information of the certificate.
· Issued by: Certification authority that issued the certificate.
· Validity: Validity period of the certificate.
¡ Issued at—First valid day of the certificate.
¡ Expires at—Expiration day of the certificate.
· Issued to: Entity to whom the certificate is issued.
Remote control
Use remote control to operate and manage the server remotely.
Remote console
You can configure and manage the server from a remote console, including:
· Access the BIOS and operating system of the server to configure the server.
· Power on or shut down the operating system of the server.
· Capture screenshots of the remote console.
· Record videos on the remote console and save the videos locally on the PC.
· Mount virtual media to install operating systems or transfer files.
HDM supports a maximum of four remote control sessions. If you establish the first session, you are the primary user. All subsequent remote console users are secondary users and must obtain access permissions from the primary user.
HDM supports KVM, H5 KVM, and VNC remote consoles.
Restrictions and guidelines
To use the VNC remote console, you must first install the VNC client. H5 KVM requires no client.
Launch a remote console
Perform this task to launch KVM or H5 KVM.
Restrictions and guidelines
Follow these restrictions and guidelines when you use a remote console:
· Do not use KVM and H5 KVM at the same time or start the remote console in multiple browsers on one PC.
· For security purposes, grant full permission to a trustworthy secondary user when you close the remote console session as the primary user.
· You can launch H5 KVM in encrypted mode to encrypt data for better security performance or launch H5 KVM in unencrypted mode for higher transmission speed. KVM supports only the encrypted mode.
Prerequisites
Before you can launch a remote control console, you must perform the following tasks:
· Make sure the KVM service has been enabled for your user account from the Security > Services page. If KVM is not enabled, contact the administrator.
· Make sure your user account has the KVM extended privilege. If you do not have the KVM privilege, contact the administrator.
Procedure
1. In the navigation pane, select Remote Control > Remote Console, as shown in Figure 161.
Figure 161 Entering remote console page
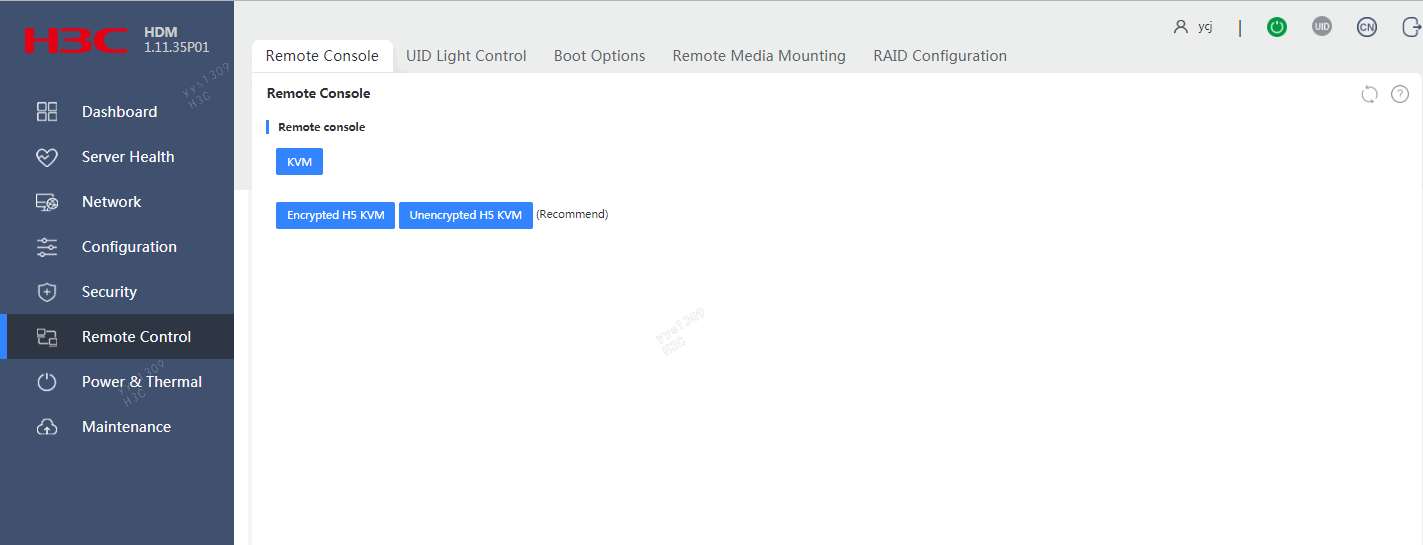
2. Launch KVM.
¡ To launch KVM, click KVM to download the JNLP file, and then open the file.
¡ To launch H5 KVM, click Encrypted H5 KVM or Unencrypted H5 KVM.
The remote console sign-in page opens, as shown in Figure 162.
Figure 162 Remote console sign-in page (H5 KVM)
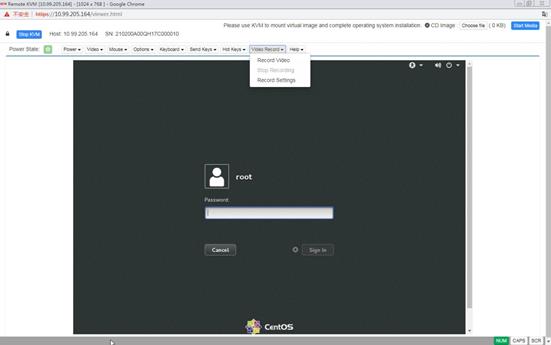
3. If you are a secondary user, wait for the access authorization from the primary user, as shown in Figure 163.
¡ If you are granted full access permission, you can display information and configure the server. In this situation, the primary user will have read-only access.
¡ If you are granted read-only permission, you can only view videos and screenshots, and record videos. You cannot perform any configuration tasks.
¡ If you are denied access, the KVM window closes.
¡ If the primary user does not respond in 30 seconds, you are granted read-only permission.
Figure 163 Authorizing remote console access
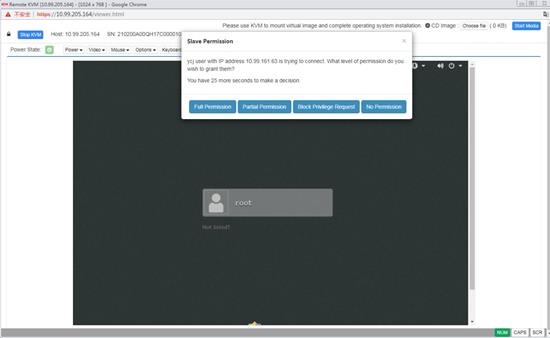
Operate the server from KVM
Prerequisites
1. Launch a KVM remote console.
2. To perform any server tasks except for viewing videos and screenshots and recording videos, make sure you have full permission.
Block full permission requests
If you are the primary user (the user that established the first console session), you might receive full permission requests from remote console users who have only read-permission.
To block full permission requests, select Options > Block Privilege Request from the top menu bar.
Access the server
You can use the keyboard, mouse, and monitor of the local PC to access the server.
Start up or shut down the server
|
|
WARNING! The Force Power-Off and Graceful Power-Off options only put the server in standby mode by removing power from most circuits. To maintain the server with all power removed, you must remove all power cords from the server. |
1. Select the Power menu from the top menu bar.
2. Select a menu option as needed.
|
Power menu option |
Purpose |
|
Force System Reset |
Warm reboots the server without power cycling the server. |
|
Force Power-Off |
Shuts down the server immediately by force. This action is equivalent to pressing the power button on the server for five seconds to put the server in standby mode. |
|
Graceful Power-Off |
Shuts down the operating system first, and then removes power from the server to put it in standby mode. |
|
Power On |
Starts up the server. |
|
Force Power-Cycle |
Powers off and then powers on the server. |
3. Use the power icon in the lower right corner of the console to verify the power state of the server.
¡ If
the server is up, the icon is in green (![]() ).
).
¡ If
the server is down, the icon is in red (![]() ).
).
Capture the screen
1. Select Options > Capture Screen from the top menu bar.
2. In the dialog box that opens, select the screenshot file storage path, enter the file name, and then click Save, as shown in Figure 164.
Figure 164 Capturing the screen
Record a video
1. Select Video Record > Settings from the top menu bar.
2. Set the video recording parameters, as shown in Figure 165:
¡ Video Length—Enter the maximum time length of the video. The value range is 1 to 1800 seconds.
¡ Video to be Saved—Click Browse to select the video file storage path.
¡ Normalized video resolution to 1024 × 768—To use the 1024 × 768 resolution, select this option. If you do not select this resolution, the screen resolution of the server monitor is used.
Figure 165 Setting video recording parameters
3. Select Video Record > Start Record to start video recording, as shown in Figure 166.
4. Select Video Record > Stop Record to stop video recording, as shown in Figure 166.
Figure 166 Starting or stopping video recording
Mount virtual storage media
1. Select Media > Virtual Media Wizard from the top menu bar.
2. Mount a virtual storage medium, as shown in Figure 167:
¡ To mount a virtual CD/DVD, click the CD/DVD tab, click Browse next to a CD Image field to select a CD/DVD file or CD/DVD drive of the local PC, and then click Connect.
¡ To mount a virtual floppy disk, click the Floppy tab, click Browse next to the Floppy Image field, select a floppy disk file from the local PC, and then click Connect.
¡ To mount a virtual hard disk drive or USB, click the Hard disk/USB tab, and perform one of the following tasks:
- If the image already exists in the hard drive or USB, select HD/USB Image, click Browse next to the HD/USB Image field, select a disk file or USB device of the local PC, and then click Connect.
- If the image does not exist in the hard drive or USB but the files to be mounted exist in the local PC, select Folder Path, click Browse next to the Folder Path field to select the folder from the local PC. Then, click Browse next to the Image Path field to select a path from the hard drive or USB for saving the image generated by using the selected folder, and then click Connect.
Make sure the folder is not larger than 600 M.
Figure 167 Mounting a virtual storage medium
3. To unmount a virtual storage medium, access the tab appropriate to the type of that medium, and click Disconnect.
Change the language in the KVM console
1. Select Options > GUI Languages from the top menu bar.
2. Change the language to Chinese or English.
Configure the peripherals in the KVM console
· To configure keyboard settings, select the Keyboard menu from the top menu bar, and then select the desired menu option.
|
Keyboard menu option |
Task |
|
Ctrl+Alt+Del |
Perform an action equivalent to pressing the Ctrl, Alt, and Delete keys simultaneously on the keyboard. |
|
Hot Keys |
Define and use hot keys. You can define a maximum of 20 hot keys, each being a combination of up to six keys. |
|
SoftKeyboard |
Open the soft keyboard. Only American English soft keyboard is supported. |
· To configure the mouse settings, select the Mouse menu from the top menu bar, and then select the desired menu option.
|
Mouse menu option |
Task |
|
Show Cursor |
· Select this option to display mouse pointer trails. · Clear this option to hide mouse pointer trails. |
|
Mouse Calibration |
Calibrates the mouse location in relative mouse mode. |
|
Mouse Mode |
The mouse mode is used to calculate the current location of the mouse. Options include: · Absolute mouse mode—Calculates the mouse location according to the screen's absolute coordinates. · Relative mouse mode—Calculates the mouse location according to the offset of the mouse movement. · Other mouse mode—Calculates the mouse location according to the distance from the mouse to the screen center. Mouse mode recommendations for server operating systems: · Use absolute mouse mode in CentOS 6.5, CentOS 7.1, Redhat 6.5, Redhat 7.0, SLES 11, SLES 13, Ubuntu 12.04, Ubuntu 15.04, Windows 2008, and Windows 2012. · Use relative mouse mode for CentOS 6, Fedora 14, Redhat 6, or their lower versions. · Use other mouse mode in SLES 11 installation interface. · Use absolute mouse mode in any operating systems that are not mentioned above.
· As a best practice, do not change the mouse mode frequently. · The Show Cursor feature will be enabled automatically if you change the mouse mode from relative or other to absolute. |
Obtain version and copyright information
To obtain version and copyright right information, select Help > About HDM KVM from the top menu bar.
Quit the remote console
To quit the remote console and disconnect from HDM, use one of the following methods:
· Click the close button ![]() of
the remote console window.
of
the remote console window.
· As the best practice to quit the H5 KVM remote console, click Stop KVM in the upper left corner of the remote console.
· If no virtual storage media have been mounted
from the remote console, you can also click the Sign out
button ![]() on the HDM Web interface.
on the HDM Web interface.
Operate the server from H5 KVM
Prerequisites
1. Launch an H5 KVM remote console.
2. To perform any server tasks except viewing videos and screenshots and recording videos, make sure you have full permission.
Block full permission requests
If you are the primary user (the user that established the first console session), you might receive full permission requests from remote console users who have only read-permission.
To block full permission requests, select Options > Block Privilege Request from the top menu bar.
Change the language in the H5 KVM console
1. Select Options > GUI Languages from the top menu bar.
2. Change the language to Chinese or English.
Access the server
You can use the keyboard, mouse, and monitor of the local PC to access the server.
Start up or shut down the server
|
|
WARNING! The Force Power Off and Graceful Power Off options only put the server in standby mode by removing power from most circuits. To maintain the server with all power removed, you must remove all power cords from the server. |
1. Select the Power menu from the top menu bar.
2. Select a menu option as needed.
|
Power menu option |
Purpose |
|
Immediate Reset |
Warm reboots the server without power cycling the server. |
|
Force Power Off |
Shuts down the server immediately by force. This action is equivalent to pressing the power button on the server for five seconds to put the server in standby mode. |
|
Graceful Power Off |
Shuts down the operating system first, and then removes power from the server to put it in standby mode. |
|
Power On |
Starts up the server. |
|
Power Cycle |
Powers off and then powers on the server. |
3. Use the power icon in the upper left corner of the console to verify the power state of the server.
¡ If
the server is up, the icon is in green (![]() ).
).
¡ If
the server is down, the icon is in red (![]() ).
).
Record a video
1. Select Video Record > Record Settings from the top menu bar.
2. Set the video recording parameters, as shown in Figure 168:
¡ Video Length—Enter the maximum time length of the video. The value range is 1 to 1800 seconds.
¡ Video Compression—Set the view compression ratio. The value range is 0.1 to 1.0.
¡ Normalized video resolution to 1024 × 768—To use the 1024 × 768 resolution, select this option. If you do not select this resolution, the screen resolution of the server monitor is used.
Figure 168 Setting video recording parameters
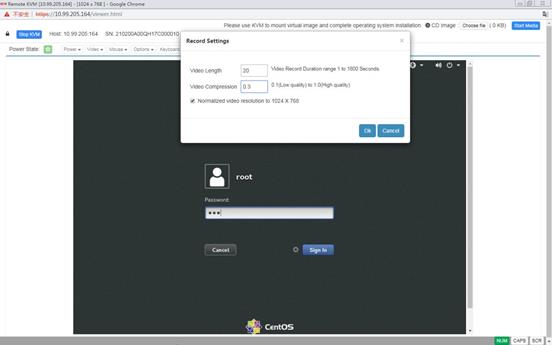
3. Select Video Record > Record Video to start video recording, as shown in Figure 169.
4. Select Video Record > Stop Record to stop video recording, as shown in Figure 169.
Figure 169 Starting or stopping video recording
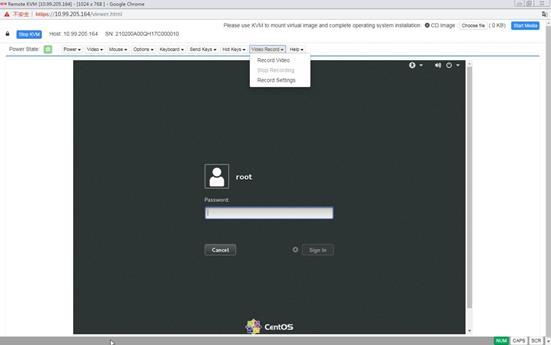
Play a video
1. Select the Video menu from the top menu bar.
2. Select a menu option as needed:
¡ To pause the video while it is playing, select Pause Video.
¡ To resume video playing, select Resume Redirection.
¡ To refresh the video displayed on the remote console, select Refresh Video.
Capture the screen
Select Video > Capture Screen from the top menu bar, as shown in Figure 170.
Figure 170 Capturing the screen
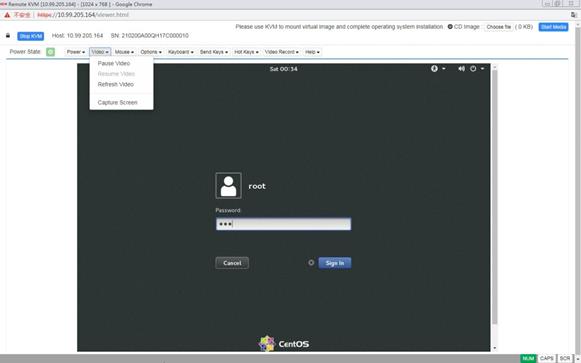
Configure the peripherals in the H5 KVM console
· To configure keyboard settings, select the Keyboard menu from the top menu bar, and then select the desired menu option.
|
Keyboard menu option |
Task |
|
English U.S |
Use the U.S. English keyboard layout. |
· To perform Send Keys operations, select the Send Keys menu from the top menu bar, and then select the desired menu option.
|
Send Keys menu option |
Description |
|
Hold Down section |
|
|
Right Ctrl Key |
Perform an action equivalent to pressing the right Ctrl key on the keyboard. |
|
Right Alt Key |
Perform an action equivalent to pressing the right Alt key on the keyboard. |
|
Right Windows Key |
Perform an action equivalent to pressing the right Windows key on the keyboard. |
|
Left Ctrl Key |
Perform an action equivalent to pressing the left Ctrl key on the keyboard. |
|
Left Alt Key |
Perform an action equivalent to pressing the left Alt key on the keyboard. |
|
Left Windows Key |
Perform an action equivalent to pressing the left Windows key on the keyboard. |
|
Press and Release section |
|
|
Ctrl+Alt+Del |
Perform an action equivalent to pressing and releasing the Ctrl, Alt, and Delete keys simultaneously on the keyboard. |
|
Left Windows Key |
Perform an action equivalent to pressing and releasing the left Windows key on the keyboard. |
|
Right Windows Key |
Perform an action equivalent to pressing and releasing the right Windows key on the keyboard. |
|
Context Menu Key |
Perform an action equivalent to pressing and releasing the context menu key on the keyboard. |
|
Print Screen Key |
Perform an action equivalent to pressing and releasing the PrScrn key on the keyboard. |
· To define and use hot keys, select the Hot Keys menu from the top menu bar, and then select Add Hot Keys.
· To configure the mouse settings, select the Mouse menu from the top menu bar, and then select the desired menu option.
|
Mouse menu option |
Task |
|
Show Client Cursor |
· Select this option to display mouse pointer trails. · Clear this option to hide mouse pointer trails. |
|
Mouse Mode |
The mouse mode is used to calculate the current location of the mouse. Options include: · Absolute Mouse Mode—Calculates the mouse location according to the screen's absolute coordinates. · Other Mouse Mode—Calculates the mouse location according to the distance from the mouse to the screen center. As a best practice, use KVM if you are using one of the following operating systems, with which the absolute mouse mode does not work well: · CentOS 6, Fedora 14, Redhat 6, or their lower versions. · SLES 11 installation interface.
· As a best practice, do not change the mouse mode frequently. · The Show Client Cursor feature will be enabled automatically if you change the mouse mode from other to absolute. |
Obtain version and copyright information
To obtain version and copyright right information, select Help > About H5Viewer from the top menu bar.
Mount virtual media
H5 KVM only supports mounting an .iso image.
1. Click Browse File in the upper right corner of the remote console.
2. Select an .iso image file.
3. Click Start Media.
To unmount the virtual media, click Stop Media.
Use keyboard buttons
The remote console provides the following keyboard buttons at the bottom right:
· NUM—Perform an action equivalent to pressing the Num key on the keyboard.
· CAPS—Perform an action equivalent to pressing the Caps key on the keyboard.
· SCR—Perform an action equivalent to pressing the Scroll key on the keyboard.
Quit the remote console
To quit the remote console and disconnect from HDM, use one of the following methods:
· Click the close button ![]() of
the remote console window.
of
the remote console window.
· As the best practice to quit the H5 KVM remote console, click Stop KVM in the upper left corner of the remote console.
· If no virtual storage media have been mounted
from the remote console, you can also click the Sign out
button ![]() on the HDM Web interface.
on the HDM Web interface.
Operate the server from VNC
About VNC
VNC is a technology for remote desktop sharing. In a VNC system, the client can connect to the server and control the remote desktop of the server by using the Remote Frame Buffer (RFB) protocol. VNC allows you to access and manage the server from a local PC without logging to HDM.
HDM supports both IPv4 and IPv6 VNC sessions. The following session modes are available:
· Shared mode—Supports a maximum of two concurrent VNC sessions. Both of the sessions have access to the mouse and keyboard and have the control of the server's OS.
· Exclusive mode—Supports only one VNC session.
The session mode used in a VNC system is determined by the VNC client.
Prerequisites
Before you use VNC to operate the server, you must complete the following tasks:
· Log in to HDM, and enable the VNC service on the Security > Services page.
· Install a VNC client (RealVNC or TightVNC). This example uses RealVNC.
Procedure
1. Open the VNC client, enter the HDM management IP address in the address bar, and click Connect to address or hostname …, as shown in Figure 171.
Figure 171 Entering the login page
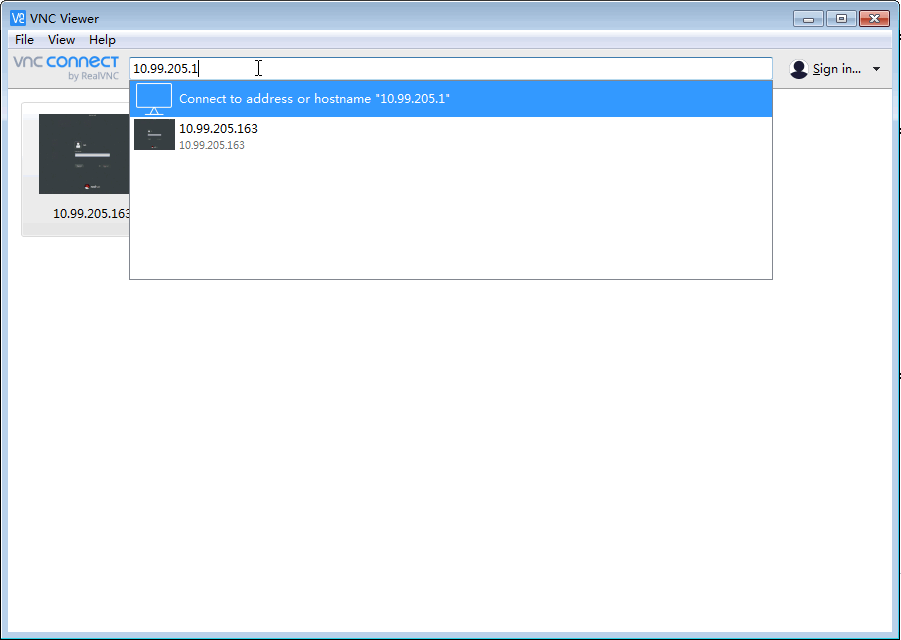
2. In the window that opens, enter the VNC password (the default is root), and then click OK, as shown in Figure 172 or Figure 173.
Figure 172 Authenticating to VNC server (IPv4)
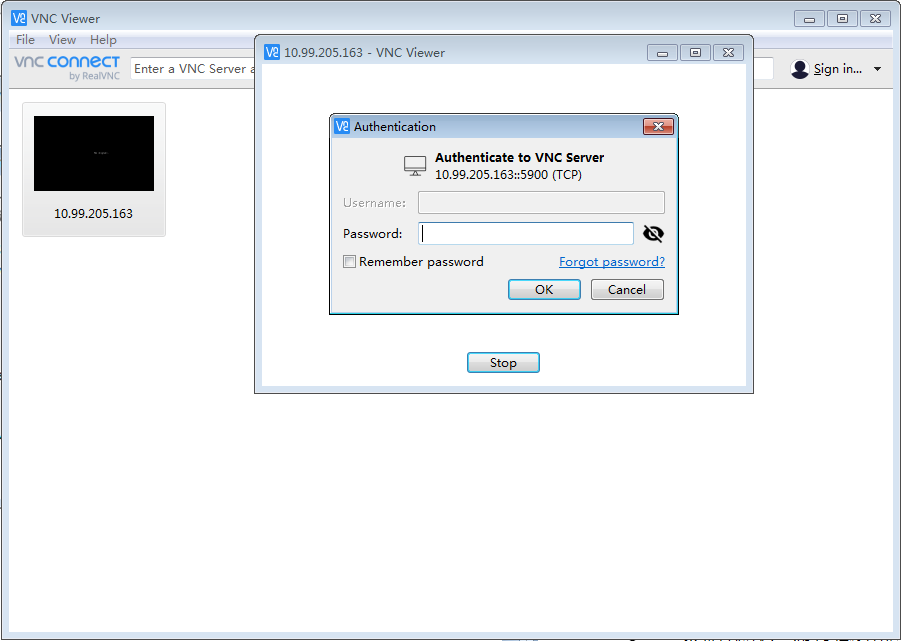
Figure 173 Authenticating to VNC server (IPv6)
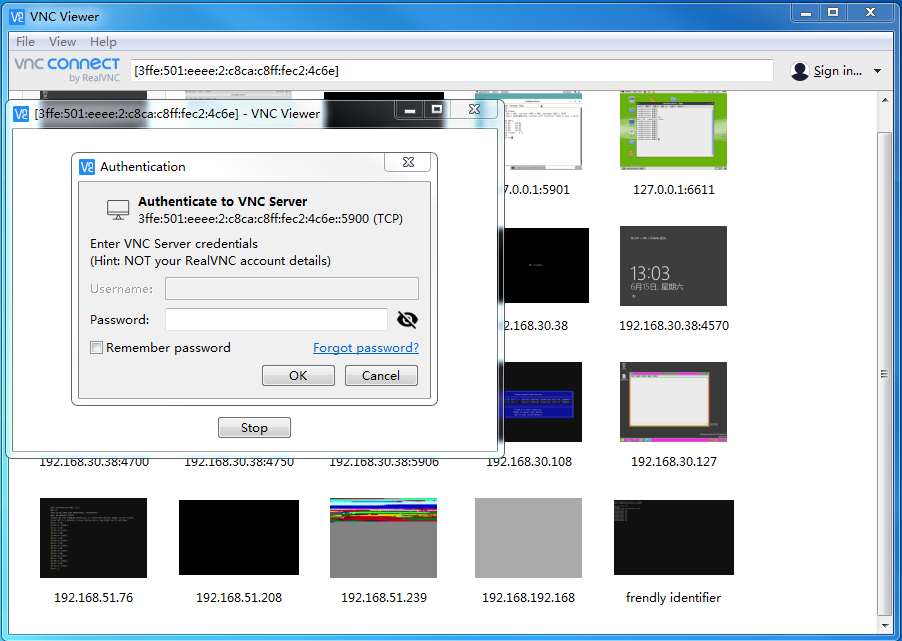
A VNC session is established between the VNC client and VNC server. The VNC client displays the server screen.
You can view the established VNC session from the Security > Services page of HDM. The IP address for the VNC session is the IP address of the VNC client.
Figure 174 VNC session information
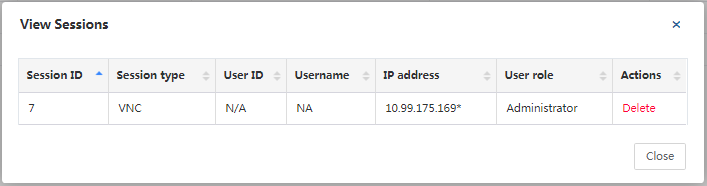
3. Operate the server as needed.
Set the UID LED
The unique identification (UID) LED helps identify the server you are operating.
Turn on or turn off the UID LED of the server
Procedure
1. In the navigation pane, select Remote Control > Set the UID LED.
2. Click On to turn on the UID LED, or click Off to turn off the UID LED, as shown in Figure 175.
Figure 175 Turning on or turn off the UID LED
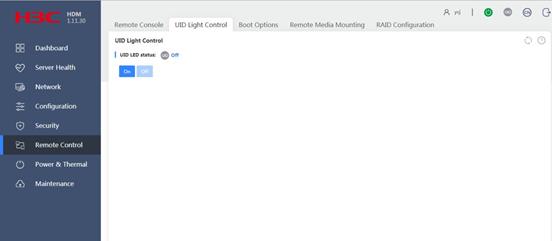
Parameters
UID LED status: UID LED status of the current server.
· On—The UID LED of the server is steady blue.
· Flashing—The UID LED of the server is flashing blue. The server is upgrading its firmware, or its remote console has been opened.
· Off—The UID LED of the server is off.
Remarks
When the UID LED is steady blue or flashing blue, you cannot turn on or turn off the LED.
Boot options
The boot options specify one-time boot mode and boot device settings for the server to use at the next reboot.
Configure boot options for the next reboot
Prerequisites
Verify that the hard disk drive supports legacy mode if you are configuring the server to boot from a hard disk drive in legacy mode.
Procedure
1. In the navigation pane, select Remote Control > Boot Options, as shown in Figure 176.
2. Select a validity period for the next boot mode and option.
¡ To have the settings take effect only for the next reboot, select One time.
¡ To have the settings take effect for all subsequent reboots, select Permanent.
This feature is not available for the AE100, B5700, B5800, and B7800.
3. In the work pane, select a next boot mode.
¡ To boot to a UEFI compatible operating system, select UEFI.
¡ To boot to a traditional operating system in Legacy BIOS compatibility mode, select Legacy BIOS.
The legacy mode is not supported by the AE100.
4. Select the boot device for the next reboot from the Next boot option list. The BIOS option is not available if the validity period is Permanent.
To use the BIOS settings at the next reboot, select No override.
5. Click Save.
Figure 176 Configuring boot options for the next reboot
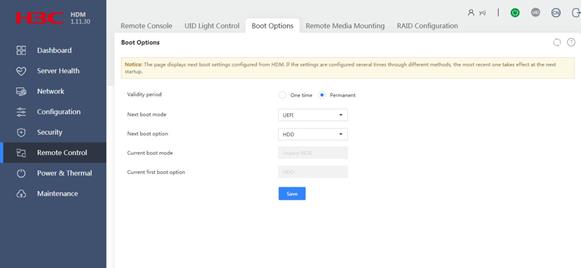
Parameters
· Next boot mode: Selects the boot mode for the next startup.
· Next boot option: Selects the boot device for the next startup.
· Current boot mode: Displays the boot mode for the most recent startup.
· Current first boot option: Displays the first boot device for the most recent startup.
Remote media mounting
You can mount virtual media by using the remote console (see "Remote console") or the image mounting feature. The following describes how to use image mounting to mount remote media images files.
About remote media mounting
Image mounting mounts image files from a remote device to the operating system of the server. With this feature, you do not need to copy image files to the server before you can mount them.
Mount remote media
Perform this task to mount remote media to the server's operating system.
Prerequisites
Before you configure remote media image mounting, perform the following tasks:
1. Verify that the image files to be mounted are in correct format.
A CD/DVD image file must use the .iso extension, and a disk image file (for example, floppy disk, HDD or SSD) must use the .img or .ima extension.
A floppy disk image file cannot exceed 1.44 MB.
2. Make sure your user account has the VMedia extended privilege. If you do not have the VMedia privilege, contact the administrator.
3. Make sure the desired virtual media services have been enabled for your user account. If they are not enabled, contact the administrator.
Procedure
1. In the navigation pane, select Remote Control > Remote Media Mounting, as shown in Figure 177.
Figure 177 Accessing the remote media mounting page
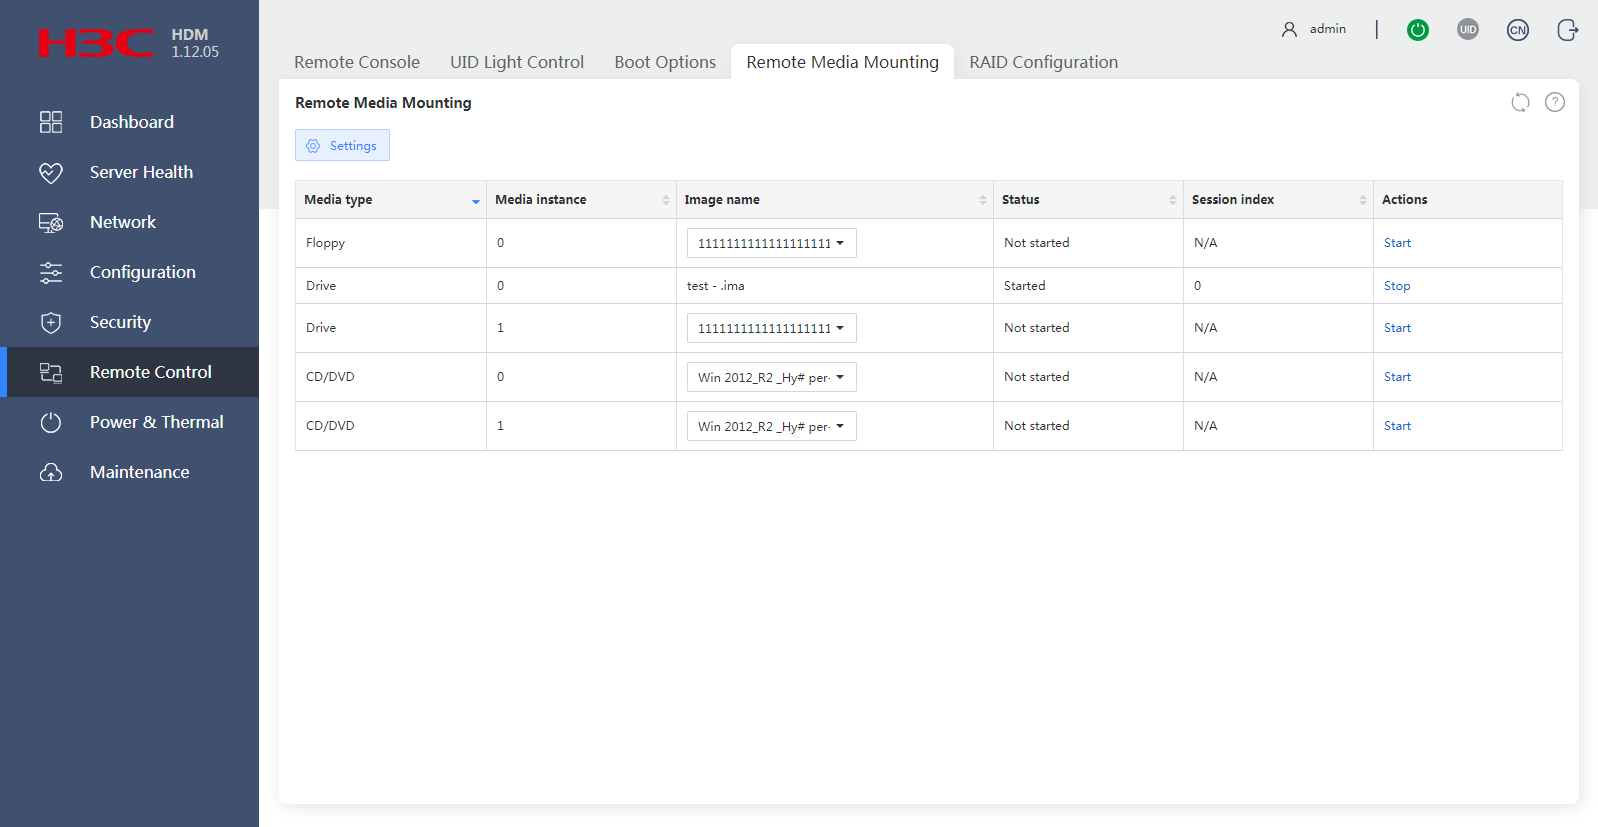
2. In the work pane, click Settings.
3. In the dialog box that opens, enable remote media, select media types, and then click OK, as shown in Figure 178.
¡ If you select NFS as the shared file system, you must enter the server address and source path.
¡ If you select CIFS (Samba) as the shared file system, you must enter the server address, source path, username, password, and optionally, the domain name.
As a best practice to avoid image mounting failure, do not enter unnecessary special characters, such as pound signs (#).
|
|
IMPORTANT: If remote media mounting has already been enabled, the media settings cannot be modified unless you stop all remote media mountings. |
Figure 178 Configuring media mounting settings
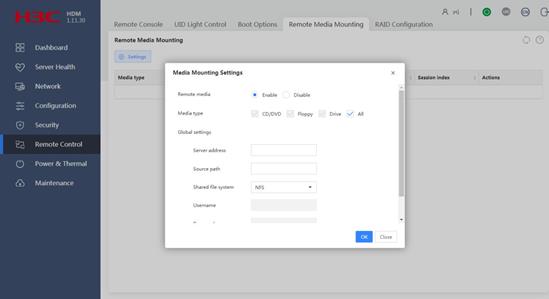
4. In the navigation pane, select Remote Control > Remote Media Mounting.
5. Select an image file from the remote media list, and then click Start.
If you want to unmount the image file, click Stop.
Parameters
· Media type: Type of the remote media, including CD/DVD, floppy, and disk (which includes both HDD and SSD).
· Status: Remote media mounting status, including Started and Not started. Common reasons for the Not started status include the following:
¡ Opening error—The image file is invalid.
¡ Connection in use—The maximum number of mounting sessions has reached.
¡ Connection lost—The virtual media service has failed.
¡ Access error—The virtual media service is not enabled.
· Session index: Index of the remote media mounting session.
Disable remote media
1. In the navigation pane, select Remote Control > Remote Media Mounting.
2. In the work pane, click Settings.
3. In the dialog box that opens, select Disable for the remote media, and then click OK, as shown in Figure 178.
RAID configuration
Use the RAID configuration feature to change the state of physical drives and manage logical drives.
Only the following storage controllers support RAID configuration from HDM:
· HBA-H5408-Mf-8i.
· HBA-LSI-9440-8i.
· RAID-L460-M4.
· RAID-LSI-9361-8i(1G)-A1-X.
· RAID-LSI-9361-8i(2G)-1-X.
· RAID-LSI-9460-8i.
· RAID-P5408-Ma-8i-4G.
· RAID-P5408-Mf-8i-4GB.
Restrictions and guidelines
After you create or delete a logical drive, wait a few moments for the system to complete the operation before you refresh the page to verify the operation result.
A physical drive can be used to create only one logical drive.
View information about a logical drive (a RAID array) or delete a logical drive
Perform this task to view logical drives or delete logical drives.
Procedure
1. In the navigation pane, select Remote Control > RAID Configuration.
2. In the work pane, click the RAID info tab.
3. In a logical drive entry, click View or Delete to view its information or delete it, as shown in Figure 179.
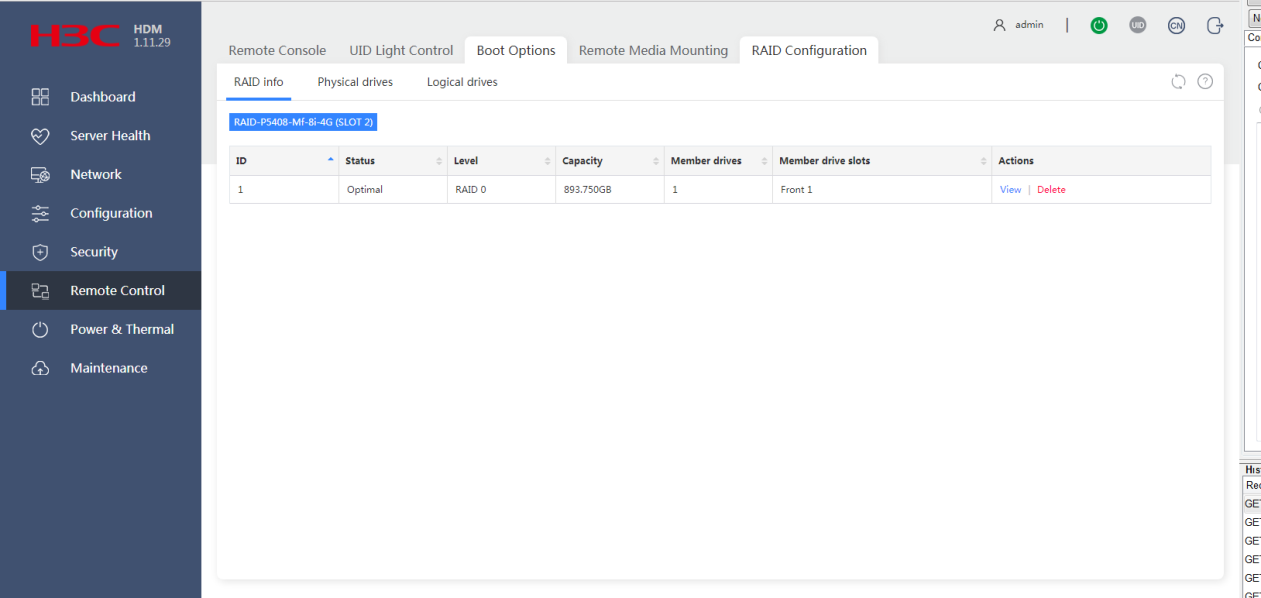
Parameters
· ID: Logical drive ID.
· Status: Logical drive state. State options include:
¡ Optimal—The logical drive is operating correctly.
¡ Degraded—A member drive of the logical drive is faulty and requires a replacement.
¡ Rebuild—RAID array is rebuilding after a failed physical drive is replaced.
¡ Offline—The logical drive is corrupt and inaccessible.
Manage physical drives
Perform this task to view physical drive information and change the state of a physical drive.
Restrictions and guidelines
You cannot change the state of the following physical drives:
· Faulty physical drives with an unrecoverable error.
· Physical drives in Unconfigured Good (Foreign) or Unconfigured Bad (Foreign) state.
Procedure
1. In the navigation pane, select Remote Control > RAID Configuration.
2. In the work pane, click the Physical drives tab, as shown in Figure 180.
Figure 180 Managing physical drives
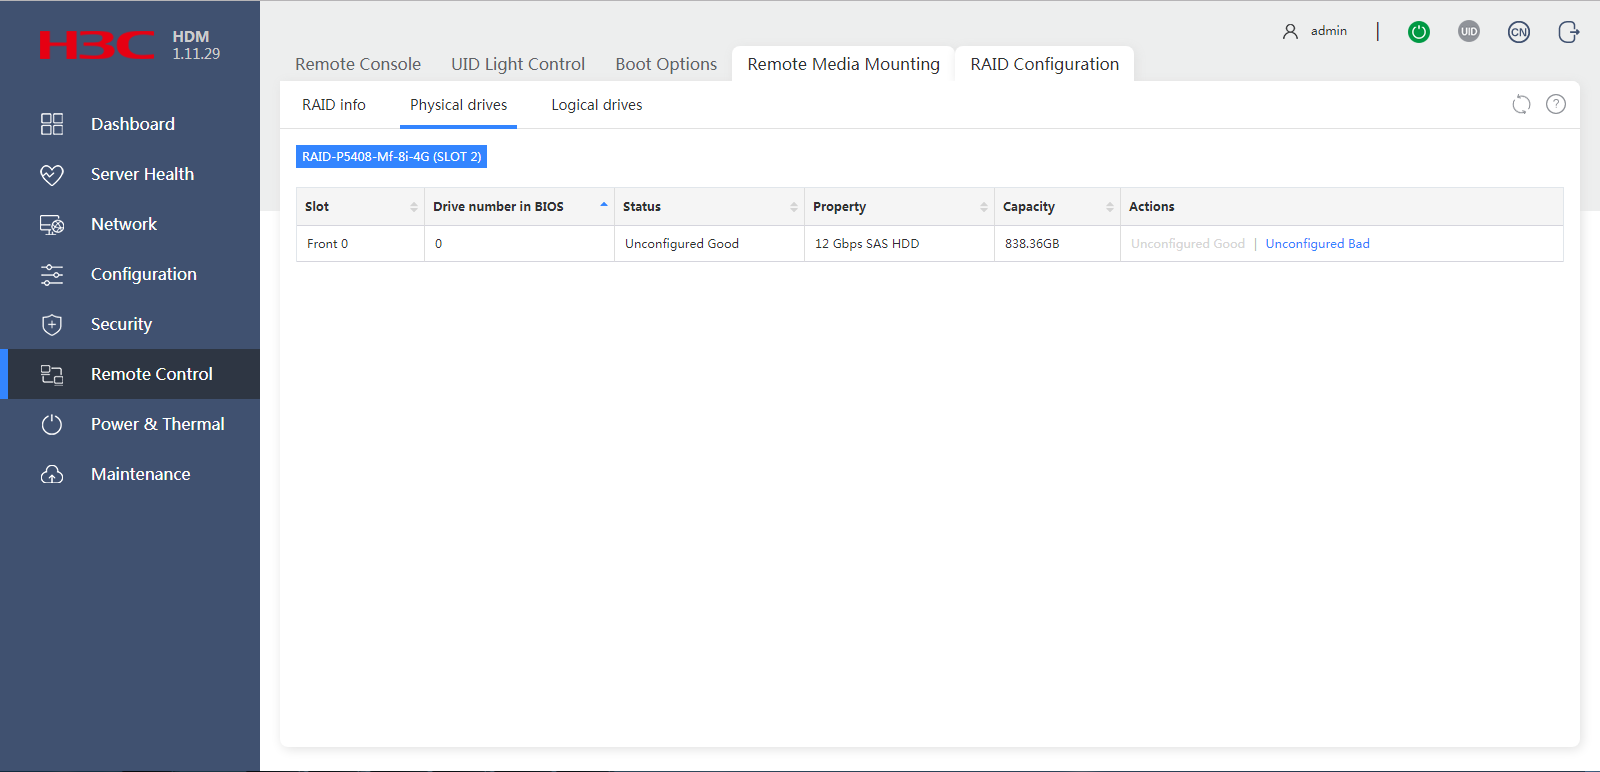
3. If multiple storage controllers are available, click the name of a storage controller.
The page that opens displays information about physical drives attached to the controller. For an LSI storage controller, the gray-colored item in the Actions column represents the state of physical drives.
4. To change the state of a physical drive attached to an LSI storage controller, click the Unconfigured Good or Unconfigured Bad link from the Actions column.
Parameters
· Unconfigured Good: The physical drive can be used to create a logical drive or used as a hot spare drive.
· Unconfigured Bad: The physical drive is not initialized or contains an unrecoverable error.
Create a logical drive
Perform this task to create a logical drive.
Procedure
1. In the navigation pane, select Remote Control > RAID Configuration.
2. In the work pane, click the Logical drives tab.
3. If multiple storage controllers are available, click the name of a storage controller.
4. Configure logical drive parameters, select physical drives, and then click Save, as shown in Figure 181.
Figure 181 Creating a logical drive
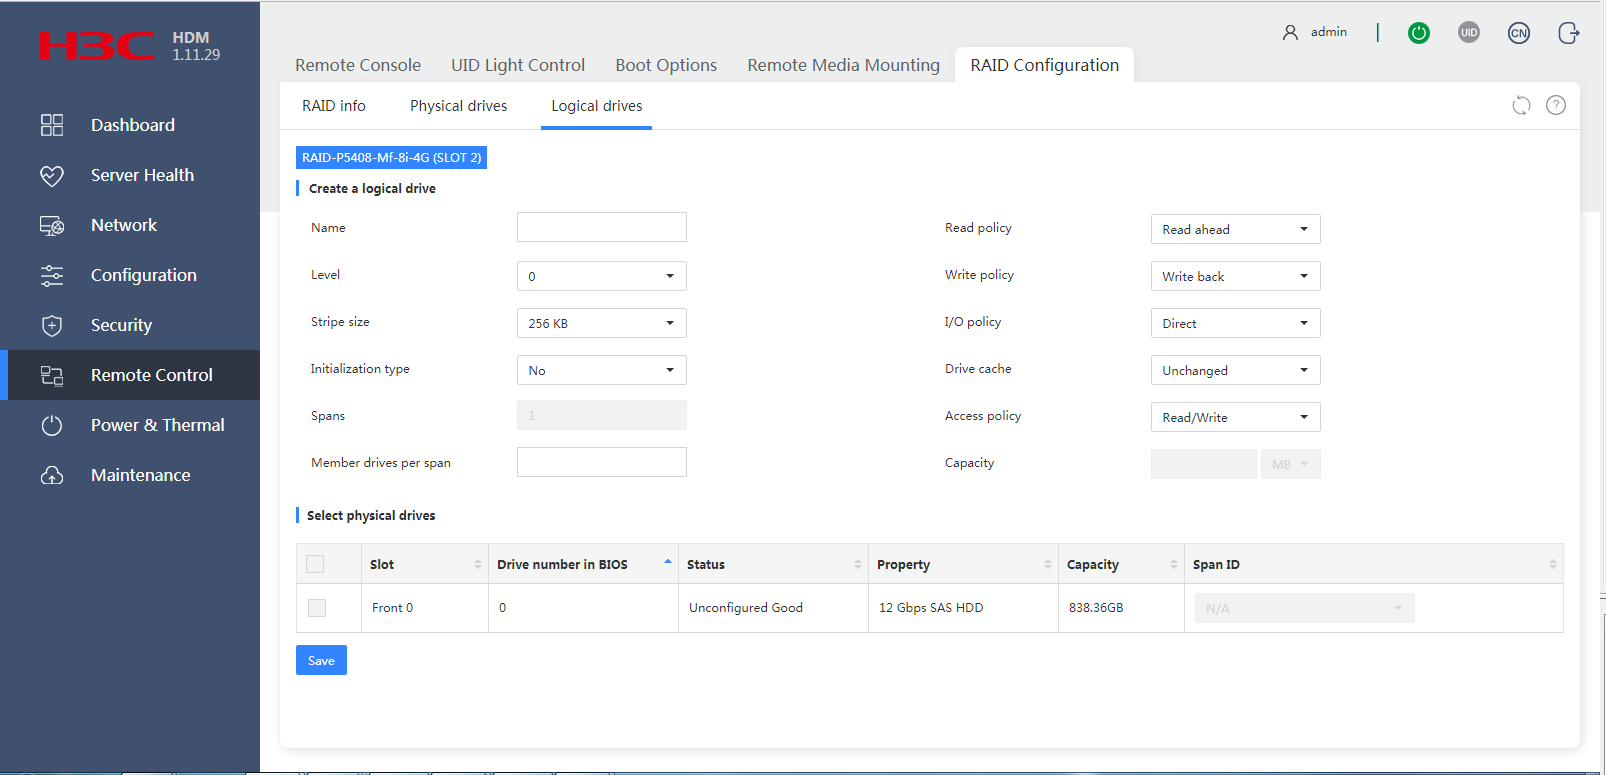
Parameters
· Name: Enter the drive name, a string of 0 to 15 characters. As a best practice, do not use special characters, such as exclamation points (!), at signs (@), and pound signs (#).
· RAID level: Select a RAID level.
· Stripe size: Select a stripe size.
· Initialization type: Select an initialization type. Options include:
¡ No—Does not initialize the logical drive.
¡ Fast—Initializes the first and last 8 MB of the logical drive for data write upon drive creation, and then initializes the remaining space in background.
¡ Full—Initializes all space in the logical drive.
· Spans—Enter the number of spans.
· Member drives per span: Enter the number of member drives per span.
· Read policy: Select a read policy for the logical drive. Options are:
¡ No read ahead—Disables read ahead capability.
¡ Read ahead—Enables read ahead capability. When this capability is enabled, the controller reads sequentially ahead of requested data and stores the additional data in cache memory.
· Write policy: Select a write policy for the logical drive. Options are:
¡ Write through—Enables the controller to send a data transfer completion signal to the host when the drive subsystem has received all data in a transaction.
¡ Write back—Enables the controller to send a data transfer completion signal to the host when the controller cache receives all data in a transaction. If the storage controller is not installed with a supercapacitor or if the supercapacitor is faulty, the Write through policy is used.
¡ Always write back—Enables the controller to send a data transfer completion signal to the host when the controller cache receives all data in a transaction.
· I/O policy: Select an I/O policy for the logical drive. Options include:
¡ Direct—Disables the cache module from processing any read or write operations on the storage controller.
¡ Cached—Enables the cache module to process all read and write operations of the storage controller.
· Drive cache: Select a cache policy for the logical drive. Options include:
¡ Unchanged—Uses the default drive cache policy.
¡ Enable—Enables the controller to write data in the cache of physical drives during the write process to improve write performance. If this policy is used without a protection method in place, data will get lost upon an unexpected power failure.
¡ Disable—Disables the controller from writing data in the cache of physical drives during the write process. If this policy is used, data will not get lost upon an unexpected power failure, but the write performance will not as high as when drive caching is enabled.
· Access policy: Select an access policy for the logical drive. Options include:
¡ Read/Write.
¡ Read only.
¡ Blocked.
· Capacity: Enter the drive capacity. The minimum capacity of a logical drive is 100 M. If you do not specify a capacity, the maximum capacity is used.
Manage power and power consumption
Use the Power & Thermal menu to control the power status of the server, debug software lock-up issues, and meter power for power reliability and energy efficiency.
Power control
Use power control features to view and change the server's power status remotely and debug software lock-up issues by using the non-maskable interrupt (NMI) debug feature.
View the power status of the server
1. In the navigation pane, select Power & Thermal > Power Control.
2. In the work pane, view the server power status in the Power status field, as shown in Figure 182.
Figure 182 Viewing the power status of the server
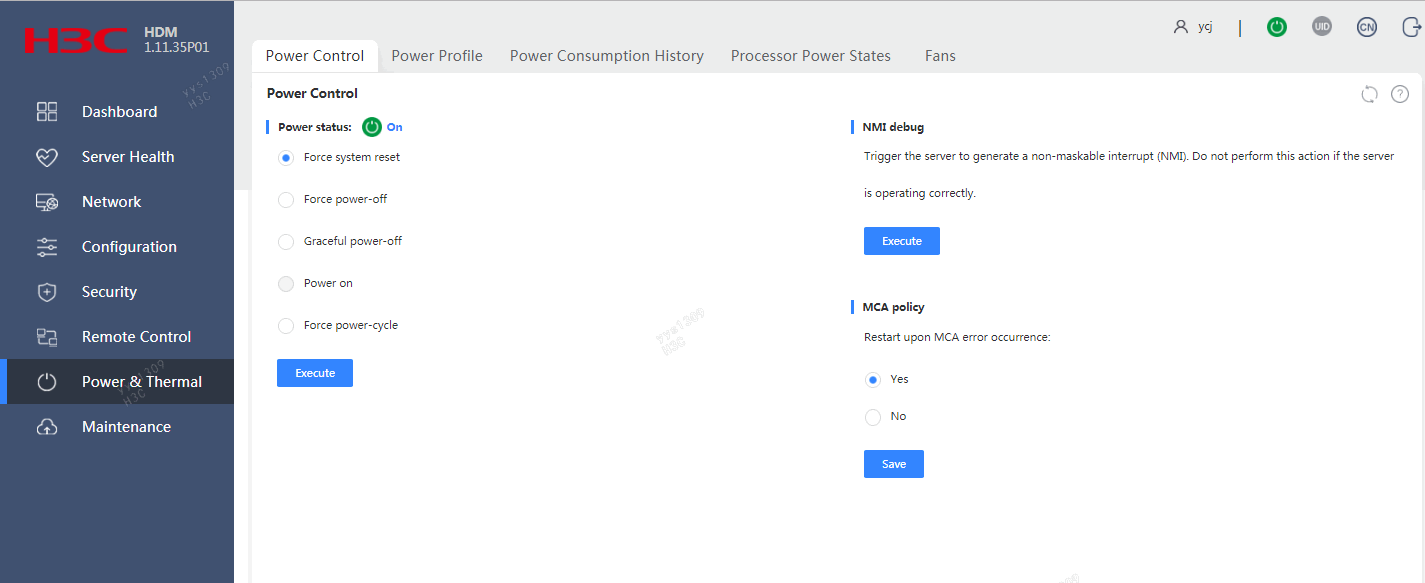
Change the power status of the server
|
|
CAUTION: The force power-off, force system reset, and force power-cycle actions might cause corruption or loss of data. When you perform these actions, make sure you fully understand their impact on the services. |
1. In the navigation pane, select Power & Thermal > Power Control.
2. In the Power status section of the work pane, select the desired action, as shown in Figure 182:
¡ To start up the server, select Power on.
¡ To power off the server gracefully, select Graceful power-off.
¡ To force a server power-off, select Force power-off.
¡ To reset the server, select Force system reset.
¡ To power cycle the server, select Force power-cycle.
3. Click Execute.
Enable NMI debug
This feature enables the operating system debugger to help you debug software lock-up issues by generating non-maskable interrupts.
Restrictions and guidelines
The NMI debug feature is intended for debugging only. Do not use this feature if the server is operating correctly.
Prerequisites
Verify that the operating system can handle NMIs. If the operating system cannot handle NMIs, using NMI debug might cause the operating system to crash.
Procedure
1. In the navigation pane, select Power & Thermal > Power Control.
2. In the NMI debug section of the work pane, click Execute, as shown in Figure 183.

Set the MCA policy
Machine Check Architecture (MCA) is an Intel mechanism that enables error reporting and error recovery. MCA errors include processor errors, memory errors, and PCIe errors. Perform this task to configure whether to restart the server automatically when an unrecoverable MCA error occurs.
Restrictions and guidelines
This feature is available only for the R2700, R2900, R4300, R4700, R4900, R6700, R6900, R8900, and X10000 servers.
The MCA policy does not affect the OS restart policy.
Procedure
1. In the navigation pane, select Power & Thermal > Power Control.
2. In the MCA policy section of the work pane, select Yes or No from the Restart upon MCA error occurrence field, as shown in Figure 184.
3. Click Save.
Figure 184 Setting the MCA policy

Power profile
Use the power profile to manage power module settings, including power module redundancy, power capping, and automatic power-on.
View summary information about power supplies
1. In the navigation pane, select Power & Thermal > Power Profile.
2. As shown in Figure 185, in the work pane, click the Summary tab to view information about power, including:
¡ Total power on the server. If multiple power supplies are present, HDM displays the sum of the power input from all power supplies.
¡ Summary of the power supplies, including their presence status, models, serial numbers, maximum power, and primary/backup mode.
Figure 185 Viewing summary information about power supplies
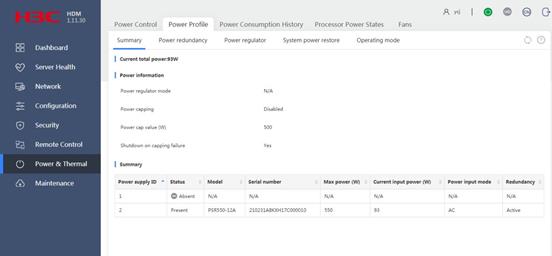
Manage redundant power supplies
About redundant power supplies
The server supports N + N power supply redundancy. You can place a minimum of one power supply in active state and place the remaining power supplies in standby state. Power is supplied mainly by the active power supplies. If more than one power supply is in active state, these active power supplies provide power in a balanced way.
The system has a predefined power supply redundancy mode. Users can change the default redundancy mode to place the specified power supplies in active state. The user-defined redundancy mode takes effect after the server is powered on. If the system fails to initiate the user-defined mode, the predefined mode is used.
The standby power supplies automatically become active in the following cases:
· An active power fails.
· The power consumption of the active power supplies exceeds 62% of their rated output power. The system will not attempt to restore the previous power supply state after the power consumption drops below 62% of the rated output power.
If an active power supply is hot swapped, the user-defined mode is restored. If the system fails to restore the user-defined mode, the predefined mode is used.
The power supplies operate in active mode when the server is powered off with the power cord connected.
Restrictions and guidelines
The server must have a minimum of one active power supply. If the server has only one active power supply, the Set as standby option for the active power supply is unavailable. To place the active power supply in standby state, you must first place a current standby power supply in active state.
Procedure
1. In the navigation pane, select Power & Thermal > Power Profile.
2. In the work pane, click the Power redundancy tab.
Information about the power supplies is displayed, as shown in Figure 186. A field displays N/A if no value can be obtained.
3. Manage the power supplies, as shown in Figure 186:
¡ To ensure power performance, verify that the power supplies on the server are the same model and are not from a third-party vendor.
¡ To place a power supply in active state, click Set as active.
¡ To place a power supply in standby state, click Set as standby.
Figure 186 Managing power redundancy
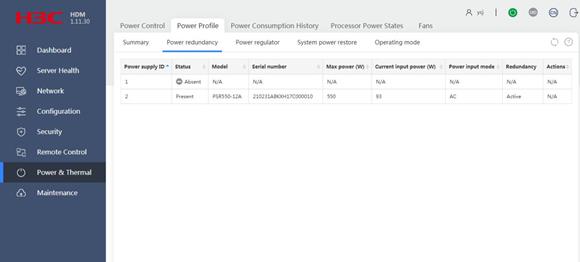
Parameters
Power input mode
· No input: The server is not connected to the power source.
· AC: The server is connected to an AC power source.
· HVDC: The server is connected to a high-voltage DC power source. The voltage is in the range of 192 V to 400 V.
· LVDC: The server is connected to a low-voltage DC power source. The voltage is in the range of 12 V to 72 V.
Enable power capping
This feature is available only for the R2700, R2900, R4300, R4700, R4900, R6700, R6900, R8900, and X10000 servers.
Perform this task to limit the power consumption of the server to a power cap value that is lower or equal to the maximum rated power of the server.
When the power cap value is exceeded, the server attempts to decrease power consumption by automatically decreasing the operating frequency of system components such as processors. Power capping fails if the power consumption cannot drop below the power cap value in 30 seconds.
You can configure the server to shut down or continue to run on power capping failure.
Procedure
1. In the navigation pane, select Power & Thermal > Power Profile.
2. In the work pane, click the Power regulator tab, as shown in Figure 187.
3. Select Enable for Power capping to enable power capping.
4. Set the power cap value.
Power capping is at the expense of system performance. Select the power cap value carefully to avoid undesirable decrease in performance, especially when the server contains power intensive components, such as GPUs and SSDs.
5. (Optional.) Set the action to take on a power capping failure:
¡ To have the server continue to run, select No for Shutdown on capping failure.
¡ To have the server shut down, select Yes for Shutdown on capping failure.
6. Click Save.
Figure 187 Configuring power capping
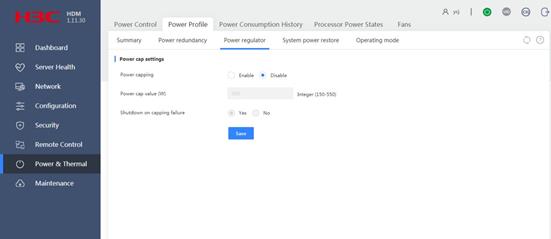
Configure automatic power-on
This feature is available only for the R2700, R2900, R4300, R4700, R4900, R4950, R6700, R6900, R8900, and X10000 servers.
Perform this task to configure the power-on policy of the server when the server is connected to the power source.
Procedure
1. In the navigation pane, select Power & Thermal > Power Profile.
2. In the work pane, click the System power restore tab, as shown in Figure 188.
3. Select the power-on policy and set the power-on delay:
¡ Power-on policy—Select whether to start the server when the server is connected to the power source. Options are Always power on, Always remain off, and Restore last power state.
- To have the server always automatically start up when it is connected to the power source, select Always power on.
- To have the server stay off when it is connected to the power source, select Always remain off.
- To have the server return to the power state on the previous power-off, select Restore last power state.
¡ Power-on delay—Set the power-on delay time. Options are No delay, 15 seconds, 30 seconds, 45 seconds, 60 seconds, and Random (max. 120 seconds).
4. Click Save.
Figure 188 Configuring automatic power-on
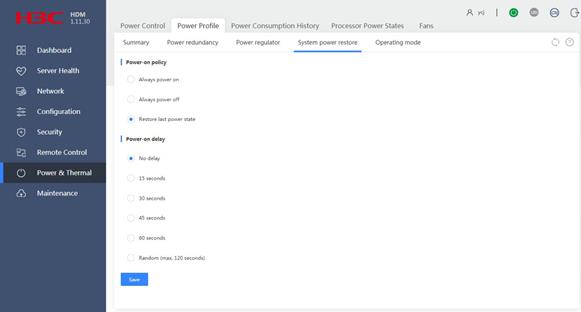
Set the operating mode of power supplies
This feature is available only for the R2700, R2900, R4300, R4700, R4900, R6700, R6900, R8900 G3, and X10000 servers.
Perform this task to set the operating mode of power supplies.
Restrictions and guidelines
Before performing this task, select Socket Configuration > Advanced Power Management Configuration > CPU Advanced PM Tuning > Energy Perf BIAS from the BIOS and set the value of the Power Performance Tuning field to BIOS Controls EPB.
Procedure
1. In the navigation pane, select Power & Thermal > Power Profile.
2. In the work pane, click the Operating mode tab.
3. Select an operating mode from the Power supply operating mode field, as shown in Figure 189. Options include:
¡ Performance—Indicates the performance first mode.
¡ Balanced performance.
¡ Balanced power.
¡ Power—Indicates the power saving mode.
Figure 189 Selecting an operating mode
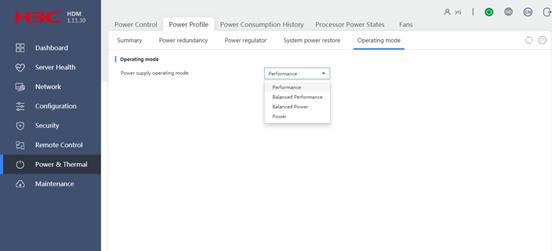
4. Click Save.
5. Restart the server for the configuration to take effect.
Power consumption history
This feature is available only for the R2700, R2900, R4300, R4700, R4900, R6700, R6900, R8900, and X10000 servers.
Use this feature to view the power consumption history statistics and chart for the server.
Restrictions and guidelines
HDM cannot obtain server power consumption statistics while HDM is being reset.
Restoring the HDM factory defaults clears power consumption history statistics.
View the power consumption history statistics
1. In the navigation pane, select Power & Thermal > Power Consumption History.
2. In the work pane, view the history power consumption statistics in the History power consumption statistics section, as shown in Figure 190:
¡ Max power consumption updated in real time—By default, HDM displays the highest amount of power consumed in the time span from server startup to the present. To clear the history data and start a new real-time statistics period, click Restart. When you click this button, this field updates with the power at the current time.
¡ Real-time max value appeared at—Date and time at which the maximum power consumption appeared in the real-time statistics collection period.
¡ Start time of real-time statistics period—Start date and time of the real-time statistics collection period.
¡ Power consumption data for past 24 hours—Maximum, minimum, and average power consumption statistics for the past 24 hours.
¡ Power consumption data for past 7 days—Maximum, minimum, and average power consumption statistics for the past 7 days.
Figure 190 Viewing history power consumption statistics
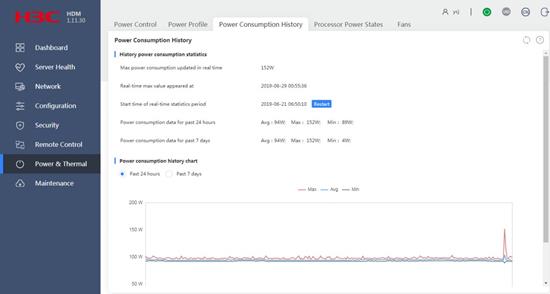
View the power consumption history chart
Use this feature to view the 5-minute server power consumption statistics for the past 24 hours or seven days, including the maximum, average, and minimum power consumption.
To view the power consumption history chart:
1. In the navigation pane, select Power & Thermal > Power Consumption History.
2. In the work pane, hover over the lines in the power consumption history chart to view power statistics for a monitoring period, as shown in Figure 191.
To view only the maximum, average, or minimum power consumption, click the Max, Avg, or Min icon, respectively.
Figure 191 Viewing power consumption history chart
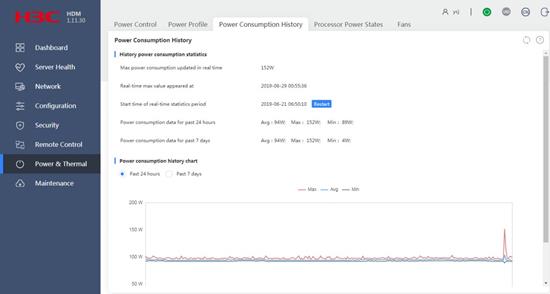
Processor power states
This feature is available only for the R2700, R2900, R4300, R4700, R4900, R4950, R6700, R6900, R8900, and X10000 servers.
You can adjust the power consumption of processors by changing the processor power states.
Prerequisites
For the power states to take effect, set EIST (P-States) and Software Controlled T-State to Enabled, and Hardware P-States to Disable on the Socket Configuration > Advanced Power Management Configuration screen from the BIOS.
Procedure
1. In the navigation pane, select Power & Thermal > Processor Power States.
2. In the work pane, move the slider to select the preferred P-state or T-state value, as shown in Figure 192.
The available state values vary by processor model.
3. Click Save.
Figure 192 Configuring processor power states
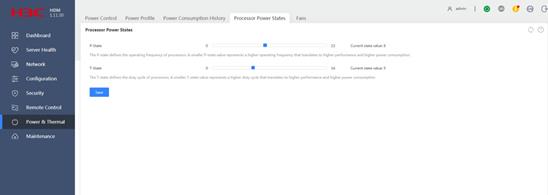
Parameters
· P-state: Defines the operating frequency of processors. A smaller P-state value represents a higher operating frequency, which translates to higher performance and higher power consumption.
· T-state: Defines the duty cycle of processors. A smaller T-state value represents a higher duty cycle, which translates to higher performance and higher power consumption.
Fans
You can adjust the fan speed of the server to optimize its cooling, noise control, and energy efficiency performance.
· To improve cooling performance, increase the fan speed.
· To decrease noise and save power, decrease the fan speed.
Set the preferred fan speed mode
1. In the navigation pane, select Power & Thermal > Fans.
2. In the work pane, move the slider to select the preferred fan speed mode between Lowest (Min. Cooling) and Highest (Max. Cooling), as shown in Figure 193.
3. Click Save.
Figure 193 Setting the preferred fan speed mode
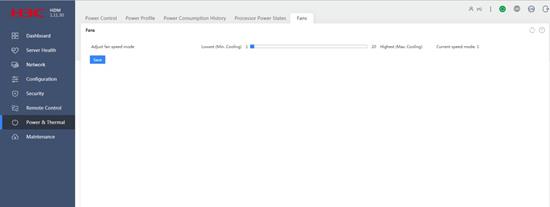
Maintenance
Import and export configuration
Perform this task to import and export HDM, BIOS, or RAID configuration, and restore factory default HDM settings.
Restrictions and guidelines
To avoid HDM and operating system anomalies, do not power on or power off the server during the import process.
Do not refresh the webpage when configuration is being imported or the factory default is being restored. If you refresh the page, HDM might fail to be accessed.
If configuration import fails, troubleshoot the issue that leads to the failure as instructed and then import the configuration again.
Configuration import overwrites the existing configuration with the configuration in the imported file.
To avoid import failure, when you modify the configuration file, please be cautious and make sure the configurations are valid.
Support for configuration that can be imported or exported varies by device model.
Export HDM, BIOS, or RAID configuration
Restrictions and guidelines
Make sure the storage controller has been initialized before you export the RAID configuration.
Procedure
1. In the navigation pane, select Maintenance > Import/Export Config.
2. In the work pane, click Export from the HDM configuration, BIOS configuration, or RAID configuration field to export the specific configuration, as shown in Figure 194.
Figure 194 Exporting HDM, BIOS, or RAID configuration
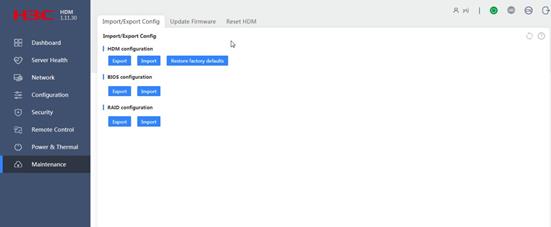
Import HDM configuration
Restrictions and guidelines
Make sure the server model in the configuration file to import is consistent with the actual server model.
Make sure you have deleted all the comment statements in the configuration file before the import.
Make sure the user passwords are stored in plain text in the configuration file.
After an HDM configuration import, HDM restarts automatically for the imported file to take effect.
Procedure
1. In the navigation pane, select Maintenance > Import/Export Config.
2. In the work pane, click Import from the HDM configuration field.
3. In the dialog box that opens, select the target configuration file.
4. Click OK.
HDM restarts automatically after the import.
Import BIOS configuration
Restrictions and guidelines
Make sure the server model and hardware configuration (for example, storage controller and drive configuration) in the configuration file is consistent with the actual configuration.
Procedure
1. In the navigation pane, select Maintenance > Import/Export Config.
2. In the work pane, click Import from the BIOS configuration field.
3. In the dialog box that opens, select the target configuration file.
4. Click OK.
5. Restart the server for the file to take effect.
Import RAID configuration
Restrictions and guidelines
Make sure the server is powered on and the storage controller is in RAID mode before you import RAID configuration.
Make sure the server model and hardware configuration (for example, storage controller and drive configuration) in the configuration file is consistent with the actual configuration.
To avoid import failure, clear existing RAID configuration from the BIOS before you import RAID configuration.
After a RAID configuration import, it takes about 40 seconds for the imported file to take effect.
Procedure
1. In the navigation pane, select Maintenance > Import/Export Config.
2. In the work pane, click Import from the RAID configuration field.
3. In the dialog box that opens, select the target configuration file.
4. Click OK.
Restore factory default HDM settings
|
|
CAUTION: After the factory default settings are restored, you can access HDM only with the default username and password. Please use this function with caution. |
Restrictions and guidelines
After the factory default restoration, HDM restarts automatically to load the default settings.
Procedure
1. In the navigation pane, select Maintenance > Import/Export Config.
2. In the work pane, click Restore factory default from the HDM configuration field.
3. In the confirmation dialog box that opens, click OK.
HDM restarts after the factory default is restored.
Update firmware
You can update the firmware of HDM, BIOS, CPLD, or power supplies. The supported firmware varies by server model. Use Table 12 to determine the firmware that can be updated from HDM for each server.
Table 12 Supported firmware types for each server model
|
Server model |
Firmware |
|
· AE100 · H3C UniServer B5700 G3 · H3C UniServer B5800 G3 · H3C UniServer R2700 G3 · H3C UniServer R2900 G3 · H3C UniServer R4300 G3 · H3C UniServer R4700 G3 · H3C UniServer R4900 G3 · H3C UniServer R4950 G3 · H3C UniStor X10000 G3 |
HDM, BIOS, CPLD |
|
H3C UniServer R6700 G3 |
HDM, BIOS, CPLD, DBCPLD, STBCPLD |
|
H3C UniServer R6900 G3 |
HDM, BIOS, CPLD, PDBCPLD, NDCPLD |
|
H3C UniServer R8900 G3 |
HDM, BIOS, CPLD, PDBCPLD, NDCPLD, PDBSCPLD |
|
H3C UniServer B7800 G3 |
HDM, BIOS, CPLD, AUXCPLD |
Firmware update restrictions and guidelines
To ensure a successful firmware update, follow these restrictions and guidelines during the update:
· You can update HDM, BIOS, CPLD, or power supply firmware while the server is in power-on or power-off state. However, do not power on, power off, or power cycle the server during the update. Doing so might result in HDM or operating system errors.
· Do not refresh the HDM webpage during the update unless you are instructed to do so. Doing so will reset the update process.
· Do not leave the webpage during the update.
Only one user can update firmware at a time. If multiple users attempt to update firmware, only the one who first started the update can perform this operation. When you successfully start a firmware update, HDM automatically signs out all other users that try to start a firmware update.
Firmware update might fail if the update image file does not contain a vendor signature or is corrupt. In this situation, obtain the desired firmware image file and try again.
For the firmware to be updated successfully, do not perform the following tasks from the Web interface during the update process:
· Change network settings, including dedicated and shared network ports, VLAN, network port mode, Ethernet adapter, and DNS.
· Configure NTP settings.
· Configure security settings, including access service, firewall, and SSL.
· View the server power status or change power capping settings.
· Perform the following maintenance tasks:
¡ Import or export configuration.
¡ Restore the factory default.
¡ Reset HDM.
¡ Perform primary/backup switchover.
¡ Reset CPLD.
The following remote console menus are not available during the update:
· Keyboard menu in the KVM console.
· Send Keys and Hot Keys menus in the H5 KVM console.
For firmware update examples, see H3C Servers Firmware Update Guide.
Prerequisites for firmware update
Before a firmware update, perform the following tasks:
1. Obtain the up-to-date server firmware image. Make sure the image matches the firmware type.
2. To avoid the loss of configuration due to inadvertent mistakes, back up the configuration. You can export the HDM configuration for backup.
3. Make sure no user is updating firmware. You cannot update firmware if there is an ongoing firmware update.
Update HDM firmware
HDM supports one primary firmware image and one backup firmware image, and it always runs the primary image. This ensures HDM service continuity during the update process.
The update operation updates only the primary firmware image. After an update, you must perform a primary/backup image switchover, and then update HDM firmware again to ensure that both primary and backup images are updated to the same version.
Restrictions and guidelines
See "Firmware update restrictions and guidelines."
Prerequisites
See "Prerequisites for firmware update."
Procedure
1. In the navigation pane, select Maintenance > Update Firmware.
2. In the work pane, perform the following tasks, as shown in Figure 195:
a. Select an image upload method.
- If you select Local, select HDM as the firmware type. Then, browse to the update image file and select it.
- If you select TFTP, enter the IP address of the interface used for file upload and enter the image name. Then, select HDM as the firmware type. The image name must include the suffix and cannot exceed 45 characters in length.
b. Select the HDM reset method after the update is complete. You can have HDM automatically reset when the update is complete or manually reset HDM later.
c. (Optional.) To remove all user-configured settings after you update HDM firmware, select Enabled for Restore factory default.
d. Click Next.
|
|
CAUTION: The Restore factory default option removes all user configured settings when HDM starts up with the new firmware. When you select this option, make sure you understand its impact on the services. If this option is selected, you must use the default user account settings at the first sign-in to HDM after its firmware is updated. |
Figure 195 Updating HDM firmware
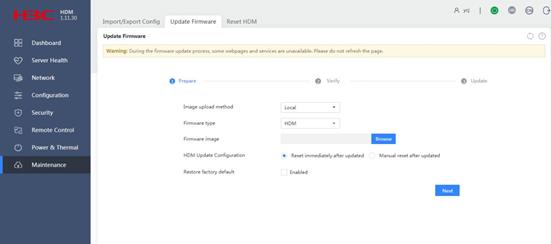
3. Verify that the new firmware image version is correct, and then click Next.
The firmware update starts and the system displays the update progress.
4. Follow the system instructions to complete the update.
5. If you selected manual reset, use one of the following methods to have the new firmware image take effect:
¡ Reset HDM.
¡ Switch over between primary and backup HDM firmware images.
If you selected automatic reset, HDM resets automatically.
6. (Optional.) Clear the browser cache, and then re-sign in to HDM.
Clearing the browser cache ensures the correct display of webpage contents after you re-sign in to HDM.
7. Verify the update:
a. In the navigation pane, select Dashboard > Summary.
b. In the Basic information section of the work pane, verify that the HDM firmware is updated.
Update BIOS firmware
Restrictions and guidelines
mLOM Ethernet adapter settings will get lost after a BIOS update because these settings are stored in the BIOS.
All user-configured BIOS settings will get lost if you downgrade the BIOS firmware.
For more restrictions and guidelines, see "Firmware update restrictions and guidelines."
Prerequisites
See "Prerequisites for firmware update."
Procedure
1. In the navigation pane, select Maintenance > Update Firmware.
2. In the work pane, perform the following tasks, as shown in Figure 196:
a. Select an image upload method.
- If you select Local, select BIOS as the firmware type. Then, browse to the update image file and select it.
- If you select TFTP, enter the IP address of the interface used for image upload and enter the image name. Then, select BIOS as the firmware type. The image name must include the suffix.
b. If the server is up, select the method to reboot the server after the update is complete.
You can have the server automatically reboot immediately or at a scheduled time. Alternatively, you can choose Manual restart to manually reboot the server.
c. Select whether to restore default BIOS settings after the update.
- To retain the user-configured BIOS settings, select Retain.
- To remove the user-configured BIOS settings, select Restore or Forcedly restore. The Forcedly restore option enables the BMC to rewrite the BIOS flash and can be used when BIOS is operating incorrectly and cannot be updated in any other ways.
d. Click Next.
|
|
CAUTION: The Restore factory default option removes all user-configured BIOS settings when the server starts up with the new firmware. When you select this option, make sure you understand its impact on the services. |
Figure 196 Updating BIOS firmware
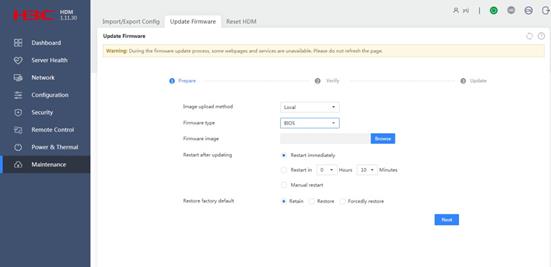
3. Verify that the new firmware image version is correct, and then click Next.
The firmware update starts and the system displays the update progress.
4. Follow the system instructions to complete the update.
5. Power cycle the server.
If the server is up and you selected an automatic restart option, the server will reboot automatically.
After the reboot, the boot mode in the BIOS changes to the default (UEFI).
6. If the previous boot mode in the BIOS is legacy, access the BIOS menu during startup to change the boot mode to Legacy mode, and then continue with the server startup.
The boot mode in BIOS automatically restores to the default (UEFI) after each firmware update. This step is required for a successful reboot of the operating system installed in Legacy mode.
7. After the POST phase finishes successfully, re-sign in to HDM to verify the update:
a. In the navigation pane, select Dashboard > Summary.
b. In the Basic information section of the work pane, verify that the BIOS firmware is updated.
Update CPLD firmware
Restrictions and guidelines
See "Firmware update restrictions and guidelines."
Prerequisites
See "Prerequisites for firmware update."
Procedure
1. In the navigation pane, select Maintenance > Update Firmware.
2. In the work pane, perform the following tasks, as shown in Figure 197:
a. Select an image upload method.
- If you select Local, select CPLD as the firmware type. Then, browse to the update image file and select it.
- If you select TFTP, enter the IP address of the interface used for image upload and enter the image name. Then, select CPLD as the firmware type. The image name must include the suffix.
b. Click Next.
Figure 197 Updating CPLD firmware
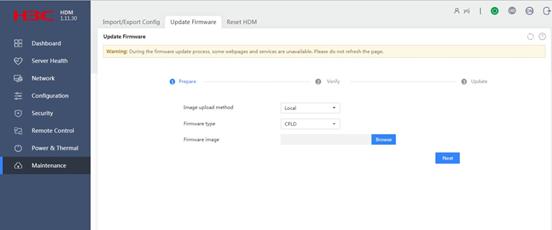
3. Verify that the new firmware image version is correct, and then click Next.
The firmware update starts and the system displays the update progress.
4. Perform one of the following tasks for the new CPLD firmware version to take effect:
¡ For an R2700, R2900, R4700, or R4900 server, reset CPLD.
¡ For a B5700, B5800, or B7800 server, or the AE100 module, remove and then re-install the blade server or AE module.
¡ For a server of other models, power off the server, disconnect and then reconnect its power cables, and then power on the server.
Reset HDM
You can reset HDM to have the new firmware image take effect after a firmware update or when HDM is malfunctioning.
When HDM resets, all HDM user sessions are closed. However, these sessions will be automatically re-established after HDM starts up.
HDM reset does not remove the HDM configuration.
Restrictions and guidelines
Do not power on, power off, or power cycle the server during an HDM reset operation. Doing so might cause malfunctioning of some HDM features or operating system errors.
Procedure
1. In the navigation pane, select Maintenance > Reset HDM.
2. Click Reset HDM and then click OK to confirm the operation, as shown in Figure 198.
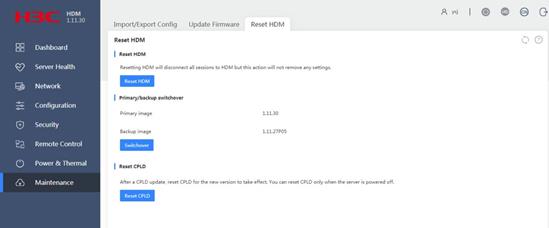
Switch over between primary and backup HDM firmware images
HDM supports one primary firmware image and one backup firmware image, which are stored in different storage areas. When the primary firmware image is corrupt, you can perform an image switchover to have the backup firmware image take over the primary role.
For more information about the switchover methods, see HDM online help.
Restrictions and guidelines
The switchover operation resets HDM. Do not power on, power off, or power cycle the server during an HDM reset operation. Doing so might cause malfunctioning of some HDM features or operating system errors.
The firmware update operation updates only the primary firmware image. After an HDM update, you must perform a primary/backup switchover, and then perform the update again to update both images to the same version.
Procedure
1. In the navigation pane, select Maintenance > Reset HDM.
2. In the work pane, click Switchover, as shown in Figure 199.
Figure 199 Switching over between primary and backup firmware images

Reset CPLD
This feature is available only for the R2700, R2900, R4700, and R4900 servers.
You can reset CPLD to have the new CPLD firmware image take effect after a firmware update. Support for this feature depends on device model.
Restrictions and guidelines
You can reset CPLD only when the server is powered off.
Resetting CPLD will cause HDM to reset immediately.
Procedure
1. In the navigation pane, select Maintenance > Reset HDM.
2. Click Reset CPLD and then click OK to confirm the operation, as shown in Figure 200.
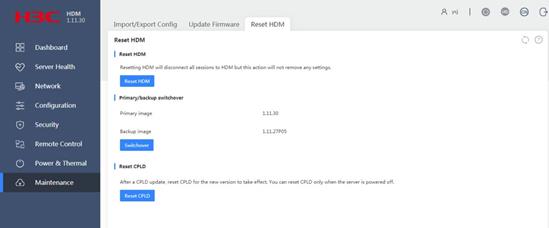
FAQ
I allowed the browser to remember the password at the first login, but at consecutive logins, the system prompts login failure after I press Enter on the login page. What should I do?
You must click the Login button at logins because Chrome security settings forbid remembered password obtaining unless you click the button manually.
When the server is powered off, removing a fan generates an event log. Why do the health status displayed on HDM and health LED indicate no errors?
When the server is powered off, the fan status sensor can still detect the fan removal operation and reports a warning event. In this situation, the absence of the fan does affect heat dissipation, so the system health status is normal.
The network cable is removed from the PC during BIOS configuration import. Why an HDM operation log entry indicates that the import succeeded, but the HDM Web interface prompts operation failure?
The network disconnection might interrupt information exchange between the front end and the back end. In this case, it is normal that the operation log synchronized from the back end indicates operation success but the Web interface prompts operation failure.
I mounted a CD image file through KVM and then removed or deleted the image file, but why does HDM still indicate that the image file is connected?
HDM cannot synchronize the state of a mounted image file in real time, because once mounted, the floppy and hard drive image files are locked.
Why does KVM request me to enter a username and password?
This is because a proxy is set on the PC. You can enter the proxy username and password to access KVM. If the system still prompts access failure, cancel the proxy settings.
Why is the shared network port in disabled state after I reconnect the network cable during the shared network port change?
Before changing the shared network port, HDM disables all the ports first, and then enables only the specified shared network port. To prevent AEN packets on the disabled ports from affecting port status, HDM discards AEN packets on the disabled ports.
If you reconnect the network cable during the shared network port change, the port state might switch between disabled and enabled, which affects AEN packet processing and thus affects port status.
Why can't I save the configuration if I specify only IPv4 or IPv6 address for the server from HDM?
If you specify static IP addresses for the server, HDM requires you to specify both IPv4 and IPv6 addresses because the addresses will be issued at the same time to the server. If you specify only one address, the system prompts invalid input.
The processor power states settings configured from HDM are restored to the default after I refresh the page, but the same settings configured from the OS can take effect successfully. Why?
The processor power state settings are configured on the server through standard ME commands issued by the BMC. Currently, the ME commands used for processor power state configuration take effect only in the OS, which is determined by the ME.
With an LSI storage controller, the same group of drives can be used to create multiple RAID arrays from the BIOS, but only one RAID array from HDM. Why?
In HDM, only drives in Unconfigured state can be used to create RAID arrays. Once used, the drive enters Configured state and is unavailable for RAID array creation. This is because BMC does not support using one physical drive for multiple RAID arrays.
Appendix Downloaded log files
|
Level 1 |
Level 2 |
Level 3 |
Level 4 |
Level 5 |
File name |
Description |
|
dump |
app_info |
cim |
|
|
(Not supported) |
N/A |
|
kvm_vmm |
|
|
lmedia |
Local image mounting information |
||
|
rmedia |
Remote image mounting information |
|||||
|
redfish |
|
|
(Not supported) |
N/A |
||
|
Snmp |
|
|
snmpd.bkup |
SNMP configuration backup information |
||
|
snmpd.conf |
SNMP configuration |
|||||
|
bios_info |
|
|
|
bios.cfg |
BIOS configuration |
|
|
biosBootOptions.conf |
BIOS boot option configuration |
|||||
|
biosNextBootOptions.conf |
BIOS next-boot option configuration |
|||||
|
biosNextBootOptionsFlag.conf |
BIOS next-boot option flag configuration |
|||||
|
PostCode.info |
POST code raw data |
|||||
|
PostCode |
POST code information |
|||||
|
smbios.dmp |
smBIOS configuration raw data |
|||||
|
smbios |
smBIOS configuration |
|||||
|
bmcsys_info |
conf |
BMC1 |
SEL |
000000000n.dat |
SEL raw data |
|
|
|
|
amicfg |
SEL rotation information |
|||
|
BondCfg |
Bond mode information |
|||||
|
bridgecfg |
ICMB protocol configuration |
|||||
|
chassiscfg |
Chassis information |
|||||
|
CpuPpinInfo |
Processor PPIN information |
|||||
|
DCMIConfig |
DCMI configuration |
|||||
|
DimmStatusRes.conf |
Memory ERR status |
|||||
|
fwfirewallcfg |
Firewall (IPMI commands) information |
|||||
|
gencfg |
Time zone synchronization information |
|||||
|
IpmbChCfg |
IPMB configuration |
|||||
|
IPMIConfig.dat |
IPMI shared memory data |
|||||
|
lancfg0 |
LAN port 0 (shared network port) information |
|||||
|
lancfg1 |
LAN port 1 (dedicated network port) information |
|||||
|
LanChcfg1 |
Shared network port channel configuration |
|||||
|
LanChcfg2 |
Dedicated network port channel configuration |
|||||
|
LanIfccfg |
Overall LAN configuration |
|||||
|
loginadtcfg |
Session login configuration |
|||||
|
MemoryInfo.bin |
Memory information |
|||||
|
MemoryInfo.ini |
Memory information |
|||||
|
misccfg |
Syslog configuration |
|||||
|
ntp |
NTP information |
|||||
|
PCIe_info |
PCIe information |
|||||
|
PCIe_info.ini.bak |
PCIe information backup |
|||||
|
PCIE_NAME |
PCIe device name |
|||||
|
pefcfg |
PEF configuration |
|||||
|
pefrecorddetailscfg |
PEF detailed configuration |
|||||
|
PortInfo |
Ethernet adapter information |
|||||
|
PowerAction |
Power actions triggered by PEF or fan behavior |
|||||
|
ProcessorInfo |
Processor information |
|||||
|
psucfg |
Power supply primary/backup configuration |
|||||
|
rmcpcfg0 |
RMCP protocol configuration |
|||||
|
rmcpcfg1 |
RMCP protocol configuration |
|||||
|
selreclaiminfo |
SEL recording information |
|||||
|
serialcfg |
Serial port configuration |
|||||
|
Smlinkipmbchcfg |
SMlink channel configuration |
|||||
|
Smmchcfg |
SMM channel configuration |
|||||
|
smtpcfg0 |
SMTP protocol configuration |
|||||
|
smtpcfg1 |
SMTP protocol configuration |
|||||
|
solcfg0 |
SOL configuration |
|||||
|
solcfg1 |
SOL configuration |
|||||
|
SysifcChCfg |
System channel information |
|||||
|
SysSource |
System resource usage |
|||||
|
systeminfo |
System information |
|||||
|
ThirdIpmbChCfg |
Third-party IPMB channel configuration |
|||||
|
TriggerEvtConfig |
Trigger event record |
|||||
|
UserConfig |
User configuration |
|||||
|
UserEncPswd |
User password encryption information |
|||||
|
wdogcfg |
Watchdog configuration |
|||||
|
compbook |
|
003_Hdr.dat |
Storage controller and drive information |
|||
|
conf_static |
hosts |
FwVersion |
Firmware version information |
|||
|
BIOSConf |
BIOS configuration |
|||||
|
biossetuptime |
BIOS boot time |
|||||
|
Hardware.info |
Hardware information |
|||||
|
PostCode.info |
POST code information |
|||||
|
poststate |
POST stage information |
|||||
|
snmp |
|
snmpd.conf |
SNMP configuration |
|||
|
syslog |
|
rotate.conf |
Syslog configuration file |
|||
|
rsyslog.conf |
Rsyslog information |
|||||
|
syslog.conf |
Syslog information |
|||||
|
|
|
activedir.conf |
AD configuration |
|||
|
adjtime |
Time calibration information |
|||||
|
adviserd.conf |
KVM configuration |
|||||
|
autorecord.conf |
Video recording configuration |
|||||
|
backup_cfg_list-AMI |
AMI original service configuration |
|||||
|
BMC.conf |
BMC configuration |
|||||
|
bond.conf |
Bond configuration |
|||||
|
console_tty |
Console TTY configuration |
|||||
|
crontab |
Periodic task configuration |
|||||
|
dcmi.conf |
DCMI configuration |
|||||
|
default_sh |
Serial console information |
|||||
|
dhcp6c.conf |
DHCP configuration |
|||||
|
dhcp6c_duid |
DHCP configuration |
|||||
|
DimmRes.conf |
Memory presence and authentication information |
|||||
|
dns.conf |
DNS configuration |
|||||
|
Fwversion |
BMC firmware information |
|||||
|
hostname |
Host name information |
|||||
|
hostname.conf |
Host name configuration |
|||||
|
hosts |
Host name information |
|||||
|
hosts.allow |
Host name whitelist |
|||||
|
hosts.deny |
Host name blacklist |
|||||
|
hpm.conf |
HPM protocol configuration |
|||||
|
interfaces |
IP address information |
|||||
|
ip6tables.conf |
IPv6 firewall information |
|||||
|
iptables.conf |
IPv4 firewall information |
|||||
|
ldap.conf |
LDAP configuration |
|||||
|
lighttpd.conf |
Lighttpd configuration |
|||||
|
lighttpd_ext.conf |
Lighttpd service configuration |
|||||
|
localtime |
Time and time zone information |
|||||
|
mod_websocket.conf |
Information about sockets used by Lighttpd |
|||||
|
mountall_dual |
Script |
|||||
|
ncml.conf |
Service configuration |
|||||
|
ncsicfg.conf |
NCSI configuration |
|||||
|
nsswitch.conf |
NSS configuration |
|||||
|
ntp.conf |
NTP configuration |
|||||
|
ntp.stat |
NTP state information |
|||||
|
openLdapGroup.conf |
LDAP role group information |
|||||
|
phycfg.conf |
Phy configuration |
|||||
|
radius.conf.disabled |
RADIUS configuration |
|||||
|
radiuspriv |
RADIUS configuration |
|||||
|
resolv.conf |
Domain name resolution information |
|||||
|
rmedia.conf |
Remote media mounting information |
|||||
|
rt_tables |
Routing table |
|||||
|
singleport.conf |
Whether external connections to the BMC use the same port |
|||||
|
stunnel.conf |
Security tunnel configuration |
|||||
|
Tadj.conf |
Fan speed mode information |
|||||
|
timeouts |
User login timeout information |
|||||
|
timezone.conf |
Time zone configuration |
|||||
|
TPMRes.conf |
TPM presence information |
|||||
|
updatefirmware.conf |
Firmware update configuration |
|||||
|
UpdateIptablesconf |
Firewall script update |
|||||
|
usermacro.conf |
KVM user configuration |
|||||
|
vlaninterfaces |
VLAN interface information |
|||||
|
vlansetting.conf |
VLAN configuration |
|||||
|
vmedia.conf |
VMedia configuration |
|||||
|
coredump |
|
|
(Not supported) |
BMC internal error coredump record |
||
|
etc |
|
|
host.conf |
Host name configuration |
||
|
hostname |
Host name information |
|||||
|
hosts.allow |
Host name whitelist |
|||||
|
hosts.deny |
Host name blacklist |
|||||
|
login |
|
|
pam_withunix |
PAM module information |
||
|
pam_wounix |
PAM module information |
|||||
|
ssh_server_config |
SSH configuration |
|||||
|
network |
|
|
ifconfig |
Ifconfig information |
||
|
ip_addr |
IP command address output |
|||||
|
ip_link |
IP command link output |
|||||
|
ip_neigh |
IP command neigh output |
|||||
|
ip_route |
IP command route output |
|||||
|
netstat |
BMC netstat output |
|||||
|
route |
BMC route output |
|||||
|
proc |
ractrends |
Helper |
FwInfo |
BMC version information |
||
|
kcs |
KCS |
KCS device information |
||||
|
usbe |
status |
USB device state |
||||
|
videocap |
jpeg_enable |
Compression algorithm enabling state |
||||
|
regs |
Graphics card configuration |
|||||
|
status |
Graphics card state |
|||||
|
watchdog |
TimerValue |
Watchdog timeout |
||||
|
sysvipc |
|
msg |
Message queue |
|||
|
sem |
Semaphore |
|||||
|
shm |
Shared memory |
|||||
|
|
|
bigphysarea |
Bigphysarea information |
|||
|
buddyinfo |
Buddy memory information |
|||||
|
cmdline |
Kernel startup command line information |
|||||
|
config |
Kernel configuration |
|||||
|
consoles |
BMC serial information |
|||||
|
cpuinfo |
BMC processor information |
|||||
|
crypto |
Driver information |
|||||
|
dedicate_linkstate |
Dedicated network port connection state |
|||||
|
devices |
Device information |
|||||
|
diskstats |
Disk information |
|||||
|
execdomains |
Execution domain information |
|||||
|
fb |
Framebuffer device table |
|||||
|
filesystems |
File system type |
|||||
|
interrupts |
Information about resources in use |
|||||
|
iomem |
Memory mapping information |
|||||
|
ioports |
I/O port range information |
|||||
|
key-users |
User information |
|||||
|
loadavg |
System average load information |
|||||
|
locks |
File lock information |
|||||
|
meminfo |
BMC memory information |
|||||
|
misc |
Device driver program information |
|||||
|
modules |
Information about kernel modules that can be loaded |
|||||
|
mounts |
File system information |
|||||
|
mtd |
MTD partition table |
|||||
|
partitions |
Disk partition information |
|||||
|
sched_debug |
Scheduler information |
|||||
|
slabinfo |
Slab allocation information |
|||||
|
softirqs |
Software interruption information |
|||||
|
stat |
BMC system kernel-related statistics |
|||||
|
sysrq-trigger |
SysRq event information |
|||||
|
timer_list |
Timer list |
|||||
|
uptime |
BMC operation and time information |
|||||
|
version |
BMC Linux version |
|||||
|
vmallocinfo |
Vmalloc-allocated virtual memory information |
|||||
|
vmstat |
Vmstat statistics |
|||||
|
zoneinfo |
Time zone information |
|||||
|
runtime |
|
|
disk |
Disk usage |
||
|
dmesg |
System debug log |
|||||
|
export |
BMC environment variables |
|||||
|
free |
free command output |
|||||
|
lsmod |
System-loaded module information |
|||||
|
mount |
System mounting information |
|||||
|
ps_aux |
PS command aux output |
|||||
|
ps_eLf |
PS command eLf output |
|||||
|
run_lock |
Lock usage during system operation |
|||||
|
sdmmc0p4 |
NAND flash fourth partition information |
|||||
|
top |
Processor usage |
|||||
|
uptime |
BMC operation and time information |
|||||
|
static |
|
|
BIOS_fm_raw |
BIOS firmware information |
||
|
BIOSConf |
BIOS configuration |
|||||
|
BMC_nextStart_info |
BIOS next-boot configuration |
|||||
|
ChassisSerialNumber |
System board or mainboard serial number |
|||||
|
CpuPpinInfo |
Processor PPIN information |
|||||
|
dd_version.bin |
BMC version information |
|||||
|
dd_version2.bin |
BMC version information |
|||||
|
DimmRes.conf |
Memory presence and authentication information |
|||||
|
FwVersion |
Firmware information |
|||||
|
hostname.conf |
Host name configuration |
|||||
|
hostname |
Host name information |
|||||
|
MemoryInfo.bin |
Host memory information (in binary notation) |
|||||
|
MemoryInfo |
Host memory information (in text format) |
|||||
|
PCIe_info |
PCIe module information |
|||||
|
PortInfo |
Port information |
|||||
|
ProcessorInfo |
Processor information |
|||||
|
ProductSerialNumber |
Product serial number information |
|||||
|
server_device |
Basic device information |
|||||
|
sys |
|
|
sys |
System information |
||
|
time |
|
|
adjtime |
Time calibration information |
||
|
|
|
|
date_now |
Current time information |
||
|
Localtime |
Time zone information |
|||||
|
timezone.conf |
Time zone configuration |
|||||
|
tmp |
|
|
dhcp.eth0 |
DHCP file for port eth0 |
||
|
var |
|
|
debug_rsynclog |
Rsync process synchronization log |
||
|
var |
Information about files in the /var folder |
|||||
|
hw_info |
bus_reg |
|
|
cpldreg |
Hardware register information |
|
|
conf |
|
|
dd_uboot_env.bin |
Uboot environment variables |
||
|
diag |
|
|
ncsi |
Result returned from the NCSI command interface |
||
|
history_data |
|
|
cpu_curve.dat |
Processor usage curve |
||
|
cpu_curve.temp |
Processor usage curve |
|||||
|
InletTemp_curve.dat |
Air inlet temperature curve |
|||||
|
InletTemp_curve.temp |
Air inlet temperature curve |
|||||
|
mem_curve.dat |
Memory usage curve |
|||||
|
mem_curve.temp |
Memory usage curve |
|||||
|
power_curve.dat |
History power information |
|||||
|
power_curve.temp |
History power information |
|||||
|
state |
|
|
BMC_session_info |
BMC session information |
||
|
BMC_usr_list |
BMC user list |
|||||
|
chassis_info |
Chassis information |
|||||
|
power_status |
Power state |
|||||
|
sdr_elist |
Sensor list |
|||||
|
sel_list |
SEL list |
|||||
|
server_UID_status |
UID LED state |
|||||
|
log_info |
bmcsys |
proj |
|
debug_adviserd |
Debug log for the adviserd process |
|
|
debug_arping |
Debug log for the arping process |
|||||
|
debug_cdserverapp |
Debug log for the cdserver process |
|||||
|
debug_compmanager |
Debug log for the compmanager process |
|||||
|
debug_dhcpmonitor |
Debug log for the dhcpmonitor process |
|||||
|
debug_fdserverapp |
Debug log for the fdserverapp process |
|||||
|
debug_flasher |
Debug log for the flasher process |
|||||
|
debug_hdserverapp |
Debug log for the hdserverapp process |
|||||
|
debug_IPMIMain |
Debug log for the IPMIMain process |
|||||
|
debug_luajit |
Debug log for the luajit process |
|||||
|
debug_MCTPMain |
Debug log for the MCTPMain process |
|||||
|
debug_ncsicfg |
Debug log for the ncsicfg process |
|||||
|
debug_pam_helperd |
Debug log for the pam_helperd process |
|||||
|
debug_phycfg |
Debug log for the phycfg process |
|||||
|
debug_processmanager |
Debug log for the processmanager process |
|||||
|
debug_rsyslogd |
Debug log for the rsyslogd process |
|||||
|
debug_shdmain |
Debug log for the shdmain process |
|||||
|
debug_spx_restservice |
Debug log for the spx_restservice process |
|||||
|
debug_spx_restservice_ext |
Debug log for the spx_restservice_ext process |
|||||
|
debug_syslogmonitord |
Debug log for the syslogmonitord process |
|||||
|
debug_upnp |
Debug log for the upnp process |
|||||
|
debug_vncserver |
Debug log for the vncserver process |
|||||
|
debug_xdpsrv.bin.log |
Debug log for the Remote-XDP process |
|||||
|
|
|
auth |
HDM login authentication log |
|||
|
btmp |
Login information log |
|||||
|
cron |
Guard process log |
|||||
|
debug |
Debug log |
|||||
|
debug_daemon |
Debug log for the daemon process |
|||||
|
debug_kernel |
Debug log for the kernel process |
|||||
|
debug_rsynclog |
Debug log for the Rsynclog process |
|||||
|
diag_debug |
Acceptance test log information |
|||||
|
dmesg |
Dmesg information |
|||||
|
emerg |
System restart record |
|||||
|
messages |
Messages information |
|||||
|
operate |
Operation log |
|||||
|
REBOOT_CAUSE_DONE_FLAG |
Abnormal restart reason record |
|||||
|
redis-server |
Redis information |
|||||
|
slpd |
Slpd information |
|||||
|
storelibdebug |
Storelib information |
|||||
|
syslog |
Syslog information |
|||||
|
update |
Update log |
|||||
|
visible |
Audit log |
|||||
|
wtmp |
Login information record |
|||||
|
hw_oper |
|
|
(Not supported) |
Hardware operation log |
||
|
ipmi |
|
|
(Not supported) |
IPMI operation log |
||
|
redfish |
|
|
(Not supported) |
Redfish operation log |
||
|
sel |
|
|
(Not supported) |
System event log (SEL) |
||
|
snmp |
|
|
(Not supported) |
SNMP operation log |
||
|
storage |
|
|
storelibdebug |
Storelib debug log |
||
|
upgrade |
|
|
(Not supported) |
Update operation log |
||
|
os_info |
screen |
|
|
(Not supported) |
Screenshot information |
|
|
sol |
|
|
host_serial_log |
BIOS serial port log |
||
|
Shd |
init |
|
|
result.rst |
Faults reported by BMC, including PSU, MCA, and storage controller faults |
|
|
|
timer |
|
|
result.rst |
Faults detected by BMC routine check, including system board and PCIe module faults |
|
|
|
|
|
|
dump_end |
Dump end time |
|
|
dump_start |
Dump start time |
|||||
|
sds_contactinfo |
SDS contact information |
|||||
|
event |
|
|
|
|
*.sbe |
Internal record for event log |
|
*.csv |
Internal record for event log |
|||||
|
hdm |
|
|
|
|
pack.info |
SDS log compression information |
|
sdmmc0p4 |
log |
proj |
|
|
debug_adviserd |
Debug log for the adviserd process |
|
debug_arping |
Debug log for the arping process |
|||||
|
debug_cdserverapp |
Debug log for the cdserverapp process |
|||||
|
debug_compmanager |
Debug log for the compmanager process |
|||||
|
debug_dhcpmonitor |
Debug log for the dhcpmonitor process |
|||||
|
debug_fdserverapp |
Debug log for the fdserverapp process |
|||||
|
debug_flasher |
Debug log for the flasher process |
|||||
|
debug_hdserverapp |
Debug log for the hdserverapp process |
|||||
|
debug_IPMIMain |
Debug log for the IPMIMain process |
|||||
|
debug_luajit |
Debug log for the luajit process |
|||||
|
debug_MCTPMain |
Debug log for the MCTPMain process |
|||||
|
debug_ncsicfg |
Debug log for the ncsicfg process |
|||||
|
debug_pam_helperd |
Debug log for the pam_helperd process |
|||||
|
debug_phycfg |
Debug log for the phycfg process |
|||||
|
debug_preservecfg |
Debug log for the preservecfg process |
|||||
|
debug_processmanager |
Debug log for the processmanager process |
|||||
|
debug_rsyslogd |
Debug log for the rsyslogd process |
|||||
|
debug_shdmain |
Debug log for the shdmain process |
|||||
|
debug_spx_restservice |
Debug log for the spx_restservice process |
|||||
|
debug_spx_restservice_ext |
Debug log for the spx_restservice_ext process |
|||||
|
debug_syslogmonitord |
Debug log for the syslogmonitord process |
|||||
|
debug_upnp |
Debug log for the upnp process |
|||||
|
debug_vncserver |
Debug log for the vncserver process |
|||||
|
debug_xdpsrv.bin |
Debug log for the Remote-XDP process |
|||||
|
redfish_debug |
|
|
Attribute_File |
BIOS dependence information |
||
|
cur_fut_File |
BIOS dependence information |
|||||
|
|
|
|
auth |
HDM login authentication information |
||
|
bmc_reboot |
BMC restart reason |
|||||
|
debug |
Debug log |
|||||
|
debug_daemon |
Debug log for the daemon process |
|||||
|
debug_kernel |
Debug log for the kernel process |
|||||
|
emerg |
Restart record |
|||||
|
operate |
Operation log |
|||||
|
update |
Update log |
|||||
|
visible |
Audit log |
|||||
|
static |
|
|
|
|
board_cfg |
System board or mainboard information |
|
conf.bak |
BMC system configuration |
|||||
|
firmware_version |
System firmware version information |
|||||
|
FruInfo |
FRU information |
|||||
|
hardware.info |
Hardware information |
|||||
|
hardware_info |
Hardware information |
|||||
|
net_cfg |
Net configuration |
|||||
|
nvme_info |
NVMe drive information |
|||||
|
psu_cfg |
Power configuration |
|||||
|
sensor_info |
Sensor list |
|||||
|
user |
|
|
|
|
result.rst |
Hardware fault diagnosis result |
|
test |
SDS log |
