H3C SeerAnalyzer-WAN
04-08-2021Product overview
Traditional O&M faces great challenges as the network grows rapidly in scale and complexity and services are more demanding for network availability and minimized downtime. SeerAnalyzer is developed at this right moment to deliver a big data and AI-powered analytics solution that enables automated and streamlined O&M.
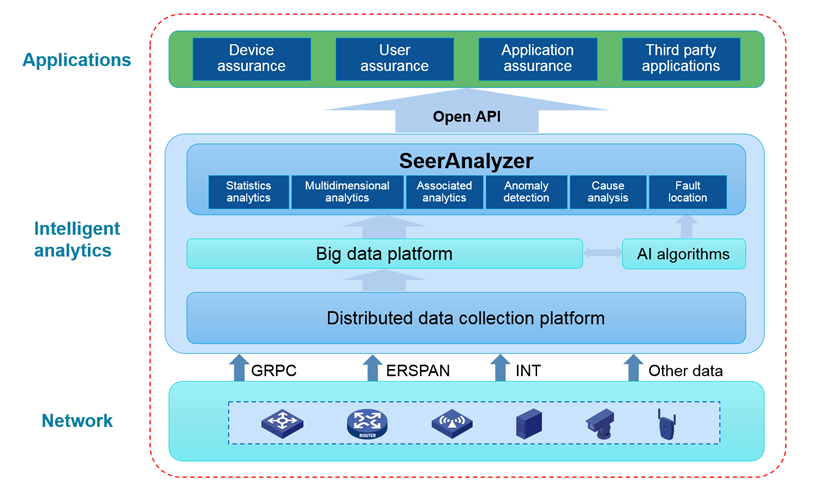
Embracing Telemetry, big data technologies and big data distributed computing engines, expert knowledge, and scenario-based AI algorithms, SeerAnalyzer automates network data collection and analytics and provides insights into the overall network conditions. It also helps identify root causes of issues and can predict failures for key components or modules. It has open APIs through which it provides the collected data and analytics results to the upper layer applications.
Incorporating the high-speed data acquisition and real-time fault identification capabilities of Telemetry and in combination with network O&M technologies and experiences, SeerAnalyzer enables fast issue location and isolation, which minimizes the network downtime and ensures service continuity.
Architecture

Features and benefits
All-round data acquisition
With the distributed deployment architecture, SeerAnalyzer can expand data collection flexibly. The data analysis platform built with components such as Kafka and Flink meets data collection needs of networks of any size, and delivers analytics capability of up to millions of streams per minute.
Incorporating second-level data collection capacity of gRPC Telemetry, SeerAnalyzer provides visibility to the network operating status in real time.
SeerAnalyzer can use Telemetry to collect and record network performance data during the user access process and allow you to trackback the data at any historical moment.
Embracing new application data stream collection technologies such as ERSPAN and INT, SeerAnalyzer can collect data about network transmission quality for insights into application traffic and analytics about application quality.
In addition to traditional network management data collection protocols, SeerAnalyzer supports varieties of advanced data collection technologies, allowing comprehensive or specific data collection as needed.
Big data-powered
SeerAnalyzer uses big data technologies to implement massive data collection and distributed storage calculation that provides real-time visibility into network operating status and enables refined operation and maintenance.
Relying on big data technologies, SeerAnalyzer can trackback historical network running state, which is helpful for locating faults and implementing operation and maintenance tasks such as performance analytics and behavior audit.
AI analytics
Using distributed computing engines such as Spark and Flink as well as AI algorithms, SeerAnalyzer can provide data analytics online and offline, to meet intelligent O&M analytics requirements in any scenarios.
SeerAnalyzer enables visibility into the entire network status by all-round collection and analytics of data including network device status data, protocol message data, traffic forwarding data, user access data, and log data. By virtue of machine learning (ML) algorithms and the expert system, SeerAnalyzer can detect network faults in real time, locate fault causes intelligently, and guide administrators to fix issues.
SeerAnalyzer can evaluate the quality of networks, user experiences, and applications based on AI analytics of massive data, and enhance network optimization and assurance.
High-performance data acquisition, real-time expert system, and AI algorithm calculation enable fault isolation environment verification, fault detection, impact verification, and isolation guidance.
Through continuous AI analytics on historical network data, SeerAnalyzer can predict network faults and performance bottlenecks, and guide O&M personnel to intervene and plan in advance.
Collaborative analytics of network and service data
SeerAnalyzer provides visibility into overall network health status through collaborative analysis of network device status data and network performance data.
Provides full visibility into analytics on the operating status, faults, and risks of devices in the system plane, control plane, and data forwarding plane based on comprehensive, precise, and real-time metrics about the network devices.
Collects TCP/IP traffic statistics to get insights into the network performance and find out the issues and risks existing in the network, network usage characteristics of applications, and abnormal access to network applications.
SeerAnalyzer collects data about the processes of users accessing the network and analyzes a large amount of user data by groups for further analysis of network quality and issues.
Application scenarios
Data analytics | ERSPAN TCP session analytics

Mechanism
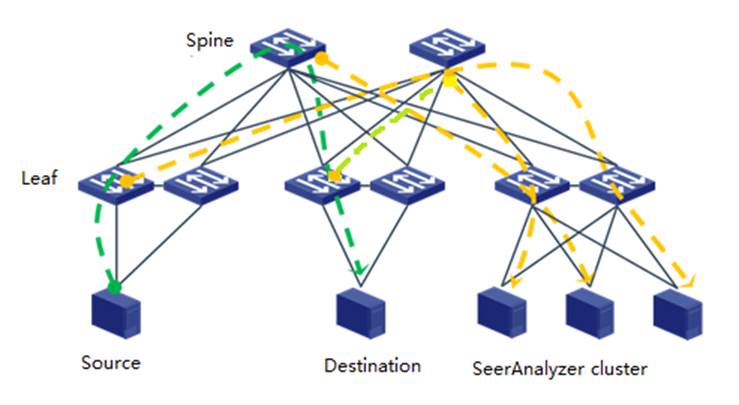
1. The client/server initiates a TCP connection establishment request and sends a TCP SYN message to the peer end.
2. The switches along the path capture the SYN message and encapsulate it as an ERSPAN message and send it to SeerAnalyzer.
3. SeerAnalyzer decapsulates the ERSPAN messages to get information about the message path and the forwarding delay of each switch along the way.
4. The switches along the path capture subsequent TCP control messages (SYN/FIN/RST messages) and send them to SeerAnalyzer. SeerAnalyzer reconstructs the TCP session interaction process and provides insights into the TCP connection quality according to the message information.
Benefits
1. Obtain the traffic forwarding path through analysis of ERSPAN messages sent from switches along the path.
2. Obtain the time consumed for an application to establish the TCP connection and the forwarding time consumed by each switch along the path through analysis of the ERSPAN message timestamps, to easily identify whether the poor user experience is resulted from a slow network speed or an application-related issue.
3. Locate the cause of the poor user experience intelligently through collaborative analysis of real-time interface queue information and packet loss information obtained through Telemetry.
4. Assist in locating illegal network behaviors such as Synflood attacks.
Intelligent prediction | Transceiver module fault and link quality prediction

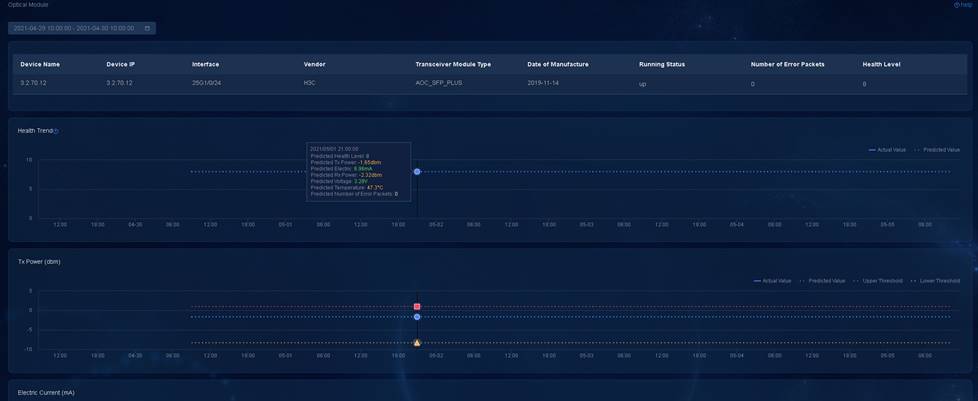
Transceiver module fault prediction

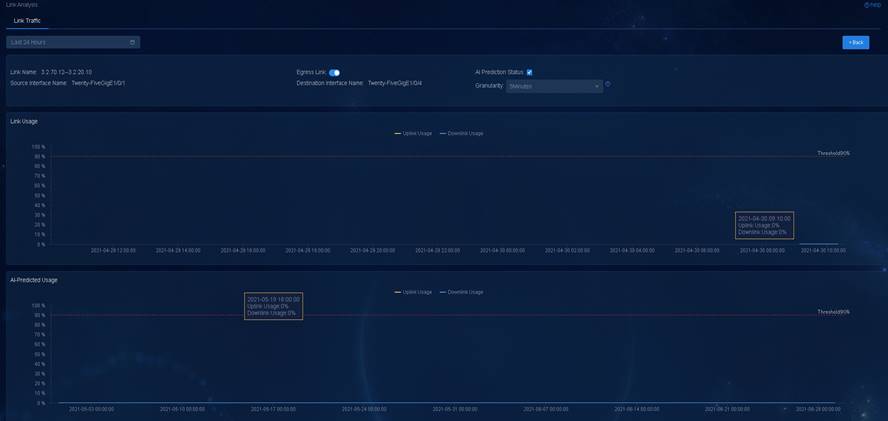
Link traffic prediction
Mechanism
1. Use distributed collectors to collect data about the interface bandwidth utilization and transceiver module status of the devices across the network, and store them in the data warehouse after data cleaning and standardization.
2. Use ML algorithms to learn historical data about interface bandwidth utilization and transceiver module status continuously to predict traffic trends and potential transceiver module failures for a future period.
Benefits
1. Predict future link traffic trends based on historical traffic data for early warning of network congestions and capacity planning.
2. Provide early warning for transceiver module failures and use human interventions to eliminate potential failures, improve service availability, and reduce network maintenance costs.
Feature list
Feature | Description | |
Application analysis | NetStream flow analysis | Display information about the devices and links that traffic flow classified by quintuples passed and information about the traffic in a specific time span. |
Userlog flow analysis | Collect and analyzes the flow session log statistics of all devices in the network, displays the applications and their traffic information in the network, and thus monitors and analyzes the user log traffic quality. | |
URL audit | Monitor the URLs accessed by users through collecting and analyzing network device logs in order to regulate the user network access behaviors. | |
RIR | Analyze the link adjustment events reported by the flow log mechanism to identify the reasons of link adjustments. | |
Network | Net health | Display the overall health status trend of network devices, current status of network devices, operating status of APs, and a list of network devices in the current system. |
Area analysis | Display the numbers of areas in different health states. | |
Changes analysis | Compare network devices' data snapshots and display the statistics and analysis on the changes. | |
Network business analysis | Display the tunnel topology at the specified time and the overall analysis on all tunnels in the specified period of time. | |
Link analysis | Display usage information about network links in a specific period of time. It also predicts the future link usage and speed on the details page. | |
Optical module | Display the health assessment of and predictions about H3C transceiver modules within the specified time span. | |
Service quality analysis | On-path flow analysis | Intelligent Network Quality Analyzer (iNQA) allows you to measure network performance quickly in large-scale IP networks. |
Fault analysis | Issue analysis | Display statistics about all problems that have occurred on devices in the system. |
Predict analysis | AI task | Intelligent prediction uses statistical learning and machine learning methods to conduct regular analysis of time series data. It can predict the future data, trend, generate baselines and prediction results, and locate faults. |
Report | Report templates | Show all report templates that can be operated by the current operator. |
Report tasks | Based on the report template, statistical data can be calculated at a certain frequency and periodic report files can be automatically generated. | |
Ordering information
Item | Description |
LIS-SeerAnalyzer-WAN-APP | H3C SeerAnalyzer Software WAN Edition Activation License |
LIS-SeerAnalyzer-WAN-Analyzer | H3C SeerAnalyzer Software WAN Edition 1-Analyzer License |
LIS-SeerAnalyzer-WAN-NTA-VAR | H3C SeerAnalyzer Software WAN Edition Network Traffic Analyzer License for 1 Device |
