- Table of Contents
- Related Documents
-
| Title | Size | Download |
|---|---|---|
| 01-Text | 3.52 MB |
Using ping, tracert, and system debugging
Using a ping command to test network connectivity
Using a tracert command to identify failed or all nodes in a path
Debugging information control switches
Configuring NQA operations on the NQA client
NQA operation configuration task list
Configuring the ICMP echo operation
Configuring the ICMP jitter operation
Configuring the DHCP operation
Configuring the HTTP operation
Configuring the UDP jitter operation
Configuring the SNMP operation
Configuring the UDP echo operation
Configuring the UDP tracert operation
Configuring the voice operation
Configuring the DLSw operation
Configuring the path jitter operation
Configuring optional parameters for the NQA operation
Configuring the collaboration feature
Configuring threshold monitoring
Configuring the NQA statistics collection feature
Configuring the saving of NQA history records
Scheduling the NQA operation on the NQA client
Displaying and maintaining NQA
ICMP echo operation configuration example
ICMP jitter operation configuration example
DHCP operation configuration example
DNS operation configuration example
FTP operation configuration example
HTTP operation configuration example
UDP jitter operation configuration example
SNMP operation configuration example
TCP operation configuration example
UDP echo operation configuration example
UDP tracert operation configuration example
Voice operation configuration example
DLSw operation configuration example
Path jitter operation configuration example
NQA collaboration configuration example
Configuration restrictions and guidelines
Configuring NTP association mode
Configuring NTP in client/server mode
Configuring NTP in symmetric active/passive mode
Configuring NTP in broadcast mode
Configuring NTP in multicast mode
Configuring access control rights
Configuring NTP authentication
Configuring NTP authentication in client/server mode
Configuring NTP authentication in symmetric active/passive mode
Configuring NTP authentication in broadcast mode
Configuring NTP authentication in multicast mode
Configuring NTP optional parameters
Specifying the source interface for NTP messages
Disabling an interface from receiving NTP messages
Configuring the maximum number of dynamic associations
Setting a DSCP value for NTP packets
Configuring the local clock as a reference source
Displaying and maintaining NTP
NTP client/server mode configuration example
IPv6 NTP client/server mode configuration example
NTP symmetric active/passive mode configuration example
IPv6 NTP symmetric active/passive mode configuration example
NTP broadcast mode configuration example
NTP multicast mode configuration example
IPv6 NTP multicast mode configuration example
Configuration example for NTP client/server mode with authentication
Configuration example for NTP broadcast mode with authentication
Configuration example for MPLS VPN time synchronization in client/server mode
Configuration example for MPLS VPN time synchronization in symmetric active/passive mode
Configuration restrictions and guidelines
Specifying an NTP server for the device
Configuring SNTP authentication
Displaying and maintaining SNTP
Feature and hardware compatibility
Command and hardware compatibility
Enabling nonstandard PD detection
Configuring a PD disconnection detection mode
Configuring the maximum PSE power
Configuring the maximum PI power
Configuring PoE power management
Configuring PSE power management
Configuring PI power management
Configuring a PI by using a PoE profile
Upgrading PSE firmware in service
Displaying and maintaining PoE
Failure to set the priority of a PI to critical
Failure to apply a PoE profile to a PI
MIB and view-based MIB access control
Configuring SNMP basic parameters
Configuring SNMPv1 or SNMPv2c basic parameters
Configuring SNMPv3 basic parameters
Configuring SNMP notifications
Configuring the SNMP agent to send notifications to a host
SNMPv1/SNMPv2c configuration example
Sample types for the alarm group and the private alarm group
Feature and hardware compatibility
Configuring the RMON statistics function
Creating an RMON Ethernet statistics entry
Creating an RMON history control entry
Configuring the RMON alarm function
Displaying and maintaining RMON settings
Ethernet statistics group configuration example
History group configuration example
Alarm function configuration example
Event MIB configuration task list
Configuring Event MIB sampling
Configuring Event MIB object lists
Configuring a set action for an event
Configuring a notification action for an event
Configuring a Boolean trigger test
Configuring an existence trigger test
Configuring a threshold trigger test
Enabling SNMP notifications for Event MIB
Displaying and maintaining the Event MIB
Event MIB configuration examples
Existence trigger test configuration example
Boolean trigger test configuration example
Threshold trigger test configuration example
NETCONF configuration task list
Configuring NETCONF to use module-specific namespaces
Establishing a NETCONF session
Setting the NETCONF session idle timeout time
Subscribing to event notifications
Example for subscribing to event notifications
Locking/unlocking the configuration
Example for locking the configuration
Performing the <get>/<get-bulk> operation
Performing the <get-config>/<get-bulk-config> operation
Performing the <edit-config> operation
All-module configuration data retrieval example
Syslog configuration data retrieval example
Example for retrieving a data entry for the interface table
Example for changing the value of a parameter
Saving, rolling back, and loading the configuration
Rolling back the configuration based on a configuration file
Rolling back the configuration based on a rollback point
Example for saving the configuration
Example for filtering data with regular expression match
Example for filtering data by conditional match
Performing CLI operations through NETCONF
Retrieving NETCONF session information
Terminating another NETCONF session
Displaying and maintaining NETCONF
Appendix A Supported NETCONF operations
Configuring the preferred ACS attributes
Configuring the default ACS attributes from the CLI
Configuring ACS authentication parameters
Configuring the provision code
Configuring the CWMP connection interface
Configuring autoconnect parameters
Enabling NAT traversal for the CPE
Specifying an SSL client policy for HTTPS connection to ACS
Displaying and maintaining CWMP
Command and hardware compatibility
Configuring a user-defined EAA environment variable
Configuration restrictions and guidelines
Configuring a monitor policy from the CLI
Configuring a monitor policy by using Tcl
Displaying and maintaining EAA settings
CLI event CLI-defined policy configuration example
Track event CLI-defined monitor policy configuration example
CLI event with EAA environment variables CLI-defined policy configuration example
CLI event Tcl-defined policy configuration example
Monitoring and maintaining processes
Command and hardware compatibility
Displaying and maintaining processes
Displaying and maintaining user processes
Starting or stopping a third-party process
Feature and hardware compatibility
Starting a third-party process
Stopping a third-party process
Configuring kernel thread deadloop detection
Configuring kernel thread starvation detection
Displaying and maintaining kernel threads
Feature and hardware compatibility
Command and hardware compatibility
Displaying and maintaining a sampler
Local port mirroring implementation
Feature and hardware compatibility
Configuring local port mirroring
Local port mirroring configuration task list
Creating a local mirroring group
Configuring source ports for the local mirroring group
Configuring the monitor port for the local mirroring group
Displaying and maintaining port mirroring
Local port mirroring configuration example
Feature and hardware compatibility
Flow mirroring configuration task list
Configuring a traffic behavior
Applying a QoS policy to an interface
Applying a QoS policy to the control plane
Flow mirroring configuration example
Command and hardware compatibility
NetStream configuration task list
Enabling NetStream on an interface
Configuring NetStream filtering
Configuring NetStream sampling
Enabling NetStream for outgoing packets before IPsec encapsulation
Configuring attributes of the NetStream data export
Configuring the NetStream data export format
Configuring the refresh rate for NetStream version 9 templates
Configuring MPLS-aware NetStream
Configuring NetStream flow aging
Configuring the NetStream data export
Configuring the NetStream traditional data export
Configuring the NetStream aggregation data export
Displaying and maintaining NetStream
NetStream configuration examples
NetStream traditional data export configuration example
NetStream aggregation data export configuration example
Command and hardware compatibility
IPv6 NetStream configuration task list
Enabling IPv6 NetStream on an interface
Configuring IPv6 NetStream filtering
Configuring IPv6 NetStream sampling
Enabling IPv6 NetStream for outgoing IPsec packets before IPsec encapsulation
Configuring attributes of the IPv6 NetStream data export
Configuring the IPv6 NetStream data export format
Configuring the refresh rate for IPv6 NetStream version 9 templates
Configuring MPLS-aware NetStream
Configuring IPv6 NetStream flow aging
Configuring the IPv6 NetStream data export
Configuring the IPv6 NetStream traditional data export
Configuring the IPv6 NetStream aggregation data export
Displaying and maintaining IPv6 NetStream
IPv6 NetStream configuration examples
IPv6 NetStream traditional data export configuration example
IPv6 NetStream aggregation data export configuration example
Feature and hardware compatibility
Configuring the sFlow agent and sFlow collector information
Displaying and maintaining sFlow
Troubleshooting sFlow configuration
The remote sFlow collector cannot receive sFlow packets
Configuring the information center
Default output rules for diagnostic logs
Default output rules for security logs
Default output rules for hidden logs
Default output rules for trace logs
Command and hardware compatibility
Information center configuration task list
Outputting logs to the console
Outputting logs to the monitor terminal
Outputting logs to the log buffer
Saving security logs to the security log file
Managing the security log file
Saving diagnostic logs to the diagnostic log file
Configuring the maximum size of the trace log file
Setting the minimum storage period for log files and logs in the log buffer
Enabling synchronous information output
Enabling duplicate log suppression
Disabling an interface from generating link up or link down logs
Enabling SNMP notifications for system logs
Displaying and maintaining information center
Information center configuration examples
Configuration example for outputting logs to the console
Configuration example for outputting logs to a UNIX log host
Configuration example for outputting logs to a Linux log host
Feature and hardware compatibility
Flow log configuration task list
Specifying a flow log export destination
Configuration restrictions and guidelines
Specifying a log host as the flow log export destination
Specifying the information center as the flow log export destination
Configuring the flow log version
Specifying a source IP address for flow log packets
Configuring the timestamp of flow log entries
Enabling load balancing for flow log entries
Configuring flow log host groups
Prerequisites for configuring flow log host groups
Configuring an IPv4 flow log host group
Configuring an IPv6 flow log host group
Displaying and maintaining flow log
Flow log configuration examples
Configuring flow log export to a flow log host group
Configuring the packet capture
Packet capture configuration task list
Configuring local packet capture (on wired devices)
Configuring local packet capture (on ACs)
Configuring local packet capture (on fat APs)
Configuring remote packet capture (on wired devices)
Configuring remote packet capture (on ACs)
Configuring remote packet capture (on fat APs)
Displaying the contents in a packet file (on wired devices)
Displaying and maintaining packet capture
Packet capture configuration examples
Remote packet capture configuration example (on wired devices)
Local packet capture configuration example (on ACs)
Remote packet capture configuration example (on ACs)
Local packet capture configuration example (on fat APs)
Remote packet capture configuration example (on fat APs)
Feature image-based packet capture configuration example
SmartMC configuration task list
Setting the FTP server information
Modifying the password of the default user for TCs
Backing up configuration files
Upgrading the startup software and configuration file on TCs
About upgrading the startup software and configuration file on TCs
Restrictions and guidelines for startup software and configuration file upgrade
Upgrading the startup software and configuration file on TCs
Upgrading the startup software and configuration file on all TCs in SmartMC groups
Refreshing the network topology
Displaying and maintaining SmartMC
SmartMC configuration examples
Using ping, tracert, and system debugging
This chapter covers ping, tracert, and information about debugging the system.
Ping
Use the ping utility to determine if an address is reachable.
Ping sends ICMP echo requests (ECHO-REQUEST) to the destination device. Upon receiving the requests, the destination device responds with ICMP echo replies (ECHO-REPLY) to the source device. The source device outputs statistics about the ping operation, including the number of packets sent, number of echo replies received, and the round-trip time. You can measure the network performance by analyzing these statistics.
Using a ping command to test network connectivity
Execute ping commands in any view.
|
Task |
Command |
|
Determine if an address in an IP network is reachable. |
When you configure the ping command for a low-speed network, set a larger value for the timeout timer (indicated by the -t keyword in the command). ·
For IPv4 networks: ·
For IPv6 networks: |
For more information about the ping mpls command, see MPLS Command Reference.
Ping example
Network requirements
As shown in Figure 1, determine if Device A and Device C can reach each other. If they can reach each other, get detailed information about routes from Device A to Device C.
Configuration procedure
# Use the ping command on Device A to test connectivity to Device C.
Ping 1.1.2.2 (1.1.2.2): 56 data bytes, press CTRL_C to break
56 bytes from 1.1.2.2: icmp_seq=0 ttl=254 time=2.137 ms
56 bytes from 1.1.2.2: icmp_seq=1 ttl=254 time=2.051 ms
56 bytes from 1.1.2.2: icmp_seq=2 ttl=254 time=1.996 ms
56 bytes from 1.1.2.2: icmp_seq=3 ttl=254 time=1.963 ms
56 bytes from 1.1.2.2: icmp_seq=4 ttl=254 time=1.991 ms
--- Ping statistics for 1.1.2.2 ---
5 packet(s) transmitted, 5 packet(s) received, 0.0% packet loss
round-trip min/avg/max/std-dev = 1.963/2.028/2.137/0.062 ms
The output shows that:
· Device A sends five ICMP packets to Device C and Device A receives five ICMP packets.
· No ICMP packet is lost.
· The route is reachable.
# Get detailed information about routes from Device A to Device C.
<DeviceA> ping -r 1.1.2.2
Ping 1.1.2.2 (1.1.2.2): 56 data bytes, press CTRL_C to break
56 bytes from 1.1.2.2: icmp_seq=0 ttl=254 time=4.685 ms
RR: 1.1.2.1
1.1.2.2
1.1.1.2
1.1.1.1
56 bytes from 1.1.2.2: icmp_seq=1 ttl=254 time=4.834 ms (same route)
56 bytes from 1.1.2.2: icmp_seq=2 ttl=254 time=4.770 ms (same route)
56 bytes from 1.1.2.2: icmp_seq=3 ttl=254 time=4.812 ms (same route)
56 bytes from 1.1.2.2: icmp_seq=4 ttl=254 time=4.704 ms (same route)
--- Ping statistics for 1.1.2.2 ---
5 packet(s) transmitted, 5 packet(s) received, 0.0% packet loss
round-trip min/avg/max/std-dev = 4.685/4.761/4.834/0.058 ms
The test procedure of ping –r is as shown in Figure 1:
1. The source device (Device A) sends an ICMP echo request to the destination device (Device C) with the RR option blank.
2. The intermediate device (Device B) adds the IP address of its outbound interface (1.1.2.1) to the RR option of the ICMP echo request, and forwards the packet.
3. Upon receiving the request, the destination device copies the RR option in the request and adds the IP address of its outbound interface (1.1.2.2) to the RR option. Then the destination device sends an ICMP echo reply.
4. The intermediate device adds the IP address of its outbound interface (1.1.1.2) to the RR option in the ICMP echo reply, and then forwards the reply.
5. Upon receiving the reply, the source device adds the IP address of its inbound interface (1.1.1.1) to the RR option. The detailed information of routes from Device A to Device C is formatted as: 1.1.1.1 <-> {1.1.1.2; 1.1.2.1} <-> 1.1.2.2.
Tracert
Tracert (also called Traceroute) enables retrieval of the IP addresses of Layer 3 devices in the path to a destination. In the event of network failure, use tracert to test network connectivity and identify failed nodes.
Figure 2 Tracert operation
Tracert uses received ICMP error messages to get the IP addresses of devices. Tracert works as shown in Figure 2:
1. The source device sends a UDP packet with a TTL value of 1 to the destination device. The destination UDP port is not used by any application on the destination device.
2. The first hop (Device B, the first Layer 3 device that receives the packet) responds by sending a TTL-expired ICMP error message to the source, with its IP address (1.1.1.2) encapsulated. This way, the source device can get the address of the first Layer 3 device (1.1.1.2).
3. The source device sends a packet with a TTL value of 2 to the destination device.
4. The second hop (Device C) responds with a TTL-expired ICMP error message, which gives the source device the address of the second Layer 3 device (1.1.2.2).
5. This process continues until a packet sent by the source device reaches the ultimate destination device. Because no application uses the destination port specified in the packet, the destination device responds with a port-unreachable ICMP message to the source device, with its IP address encapsulated. This way, the source device gets the IP address of the destination device (1.1.3.2).
6. The source device determines that:
? The packet has reached the destination device after receiving the port-unreachable ICMP message.
? The path to the destination device is 1.1.1.2 to 1.1.2.2 to 1.1.3.2.
Prerequisites
Before you use a tracert command, perform the tasks in this section.
For an IPv4 network:
· Enable sending of ICMP timeout packets on the intermediate devices (devices between the source and destination devices). If the intermediate devices are H3C devices, execute the ip ttl-expires enable command on the devices. For more information about this command, see Layer 3—IP Services Command Reference.
· Enable sending of ICMP destination unreachable packets on the destination device. If the destination device is an H3C device, execute the ip unreachables enable command. For more information about this command, see Layer 3—IP Services Command Reference.
For an IPv6 network:
· Enable sending of ICMPv6 timeout packets on the intermediate devices (devices between the source and destination devices). If the intermediate devices are H3C devices, execute the ipv6 hoplimit-expires enable command on the devices. For more information about this command, see Layer 3—IP Services Command Reference.
· Enable sending of ICMPv6 destination unreachable packets on the destination device. If the destination device is an H3C device, execute the ipv6 unreachables enable command. For more information about this command, see Layer 3—IP Services Command Reference.
Using a tracert command to identify failed or all nodes in a path
Execute tracert commands in any view.
|
Task |
Command
|
|
Display the routes from source to destination. |
·
For IPv4 networks: ·
For IPv6 networks: |
For more information about the tracert mpls ipv4 command, see MPLS Command Reference.
Tracert example
Network requirements
As shown in Figure 3, Device A failed to Telnet to Device C.
Test the network connectivity between Device A and Device C. If they cannot reach each other, locate the failed nodes in the network.
Configuration procedure
1. Configure the IP addresses for devices as shown in Figure 3.
2. Configure a static route on Device A.
<DeviceA> system-view
[DeviceA] ip route-static 0.0.0.0 0.0.0.0 1.1.1.2
3. Use the ping command to test connectivity between Device A and Device C.
[DeviceA] ping 1.1.2.2
Ping 1.1.2.2(1.1.2.2): 56 -data bytes, press CTRL_C to break
Request time out
Request time out
Request time out
Request time out
Request time out
--- Ping statistics for 1.1.2.2 ---
5 packet(s) transmitted,0 packet(s) received,100.0% packet loss
The output shows that Device A and Device C cannot reach each other.
4. Use the tracert command to identify failed nodes:
# Enable sending of ICMP timeout packets on Device B.
<DeviceB> system-view
[DeviceB] ip ttl-expires enable
# Enable sending of ICMP destination unreachable packets on Device C.
<DeviceC> system-view
[DeviceC] ip unreachables enable
# Execute the tracert command on Device A.
[DeviceA] tracert 1.1.2.2
traceroute to 1.1.2.2 (1.1.2.2) 30 hops at most,40 bytes each packet, press CTRL_C to break
1 1.1.1.2 (1.1.1.2) 1 ms 2 ms 1 ms
2 * * *
3 * * *
4 * * *
5
[DeviceA]
The output shows that Device A can reach Device B but cannot reach Device C. An error has occurred on the connection between Device B and Device C.
5. To identify the cause of the problem, execute the following commands on Device A and Device C:
? Execute the debugging ip icmp command and verify that Device A and Device C can send and receive the correct ICMP packets.
? Execute the display ip routing-table command to verify that Device A and Device C have a route to each other.
System debugging
The device supports debugging for the majority of protocols and features, and provides debugging information to help users diagnose errors.
Debugging information control switches
The following switches control the display of debugging information:
· Module debugging switch—Controls whether to generate the module-specific debugging information.
· Screen output switch—Controls whether to display the debugging information on a certain screen. Use terminal monitor and terminal logging level commands to turn on the screen output switch. For more information about these two commands, see Network Management and Monitoring Command Reference.
As shown in Figure 4, the device can provide debugging for the three modules 1, 2, and 3. The debugging information can be output on a terminal only when both the module debugging switch and the screen output switch are turned on.
Debugging information is typically displayed on a console. You can also send debugging information to other destinations. For more information, see "Configuring the information center."
Figure 4 Relationship between the module and screen output switch
Debugging a feature module
Output of debugging commands is memory intensive. To guarantee system performance, enable debugging only for modules that are in an exceptional condition. When debugging of a module is complete, use the undo debugging command to disable debugging for the module.
To debug a feature module:
|
Step |
Command |
Remarks |
|
1. Enable debugging for a module in user view. |
debugging module-name [ option ] |
By default, debugging is disabled for all modules. |
|
2. (Optional.) Display the enabled debugging in any view. |
display debugging [ module-name ] |
N/A |
Configuring NQA
Overview
Network quality analyzer (NQA) allows you to measure network performance, verify the service levels for IP services and applications, and troubleshoot network problems. It provides the following types of operations:
· ICMP echo.
· ICMP jitter.
· DHCP.
· DLSw.
· DNS.
· FTP.
· HTTP.
· Path jitter.
· SNMP.
· TCP.
· UDP echo.
· UDP jitter.
· UDP tracert.
· Voice.
As shown in Figure 5, the NQA source device (NQA client) sends data to the NQA destination device by simulating IP services and applications to measure network performance. The obtained performance metrics include the one-way latency, jitter, packet loss, voice quality, application performance, and server response time.
All types of NQA operations require the NQA client, but only the TCP, UDP echo, UDP jitter, and voice operations require the NQA server. The NQA operations for services that are already provided by the destination device such as FTP do not need the NQA server.
You can configure the NQA server to listen and respond to specific IP addresses and ports to meet various test needs.

NQA operation
The following describes how NQA performs different types of operations:
· A TCP or DLSw operation sets up a connection.
· A UDP jitter or a voice operation sends a number of probe packets. The number of probe packets is set by using the probe packet-number command.
· An FTP operation uploads or downloads a file.
· An HTTP operation gets a Web page.
· A DHCP operation gets an IP address through DHCP.
· A DNS operation translates a domain name to an IP address.
· An ICMP echo operation sends an ICMP echo request.
· A UDP echo operation sends a UDP packet.
· An SNMP operation sends one SNMPv1 packet, one SNMPv2c packet, and one SNMPv3 packet.
· A path jitter operation is accomplished in the following steps:
a. The operation uses tracert to obtain the path from the NQA client to the destination. A maximum of 64 hops can be detected.
b. The NQA client sends ICMP echo requests to each hop along the path. The number of ICMP echo requests is set by using the probe packet-number command.
· A UDP tracert operation determines the routing path from the source to the destination. The number of the probe packets sent to each hop is set by using the probe count command.
Collaboration
NQA can collaborate with the Track module to notify application modules of state or performance changes so that the application modules can take predefined actions.
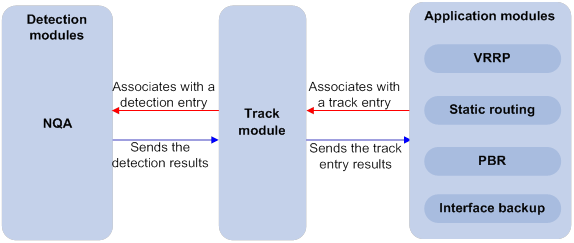
The following describes how a static route destined for 192.168.0.88 is monitored through collaboration:
1. NQA monitors the reachability to 192.168.0.88.
2. When 192.168.0.88 becomes unreachable, NQA notifies the Track module of the change.
3. The Track module notifies the static routing module of the state change.
4. The static routing module sets the static route to invalid according to a predefined action.
For more information about collaboration, see High Availability Configuration Guide.
Threshold monitoring
Threshold monitoring enables the NQA client to take a predefined action when the NQA operation performance metrics violate the specified thresholds.
Table 1 describes the relationships between performance metrics and NQA operation types.
Table 1 Performance metrics and NQA operation types
|
Performance metric |
NQA operation types that can gather the metric |
|
Probe duration |
All NQA operation types except UDP jitter, UDP tracert, path jitter, and voice |
|
Number of probe failures |
All NQA operation types except UDP jitter, UDP tracert, path jitter, and voice |
|
Round-trip time |
ICMP jitter, UDP jitter, and voice |
|
Number of discarded packets |
ICMP jitter, UDP jitter, and voice |
|
One-way jitter (source-to-destination or destination-to-source) |
ICMP jitter, UDP jitter, and voice |
|
One-way delay (source-to-destination or destination-to-source) |
ICMP jitter, UDP jitter, and voice |
|
Calculated Planning Impairment Factor (ICPIF) (see "Configuring the voice operation") |
Voice |
|
Mean Opinion Scores (MOS) (see "Configuring the voice operation") |
Voice |
NQA configuration task list
|
Tasks at a glance |
Remarks |
|
Required for TCP, UDP echo, UDP jitter, and voice operations. |
|
|
(Required.) Enabling the NQA client |
N/A |
|
(Required.) Configuring NQA operations on the NQA client |
N/A |
Configuring the NQA server
To perform TCP, UDP echo, UDP jitter, and voice operations, you must enable the NQA server on the destination device. The NQA server listens and responds to requests on the specified IP addresses and ports.
You can configure multiple TCP or UDP listening services on an NQA server, where each corresponds to a specific IP address and port number. The IP address and port number for a listening service must be unique on the NQA server and match the configuration on the NQA client.
To configure the NQA server:
|
Step |
Command |
Remarks |
|
1. Enter system view. |
system-view |
N/A |
|
2. Enable the NQA server. |
nqa server enable |
By default, the NQA server is disabled. |
|
3. Configure a TCP or UDP listening service. |
·
TCP listening service: ·
UDP listening service: |
The default ToS value is 0. You can set the ToS value in the IP header of reply packets sent by the NQA server. |
Enabling the NQA client
|
Step |
Command |
Remarks |
|
1. Enter system view. |
system-view |
N/A |
|
2. Enable the NQA client. |
nqa agent enable |
By default, the NQA client is enabled. The NQA client configuration takes effect after you enable the NQA client. |
Configuring NQA operations on the NQA client
NQA operation configuration task list
|
Tasks at a glance |
|
(Required.) Perform at least one of the following tasks: · Configuring the ICMP echo operation · Configuring the ICMP jitter operation · Configuring the DHCP operation · Configuring the DNS operation · Configuring the FTP operation · Configuring the HTTP operation · Configuring the UDP jitter operation · Configuring the SNMP operation · Configuring the TCP operation · Configuring the UDP echo operation · Configuring the UDP tracert operation · Configuring the voice operation |
|
(Optional.) Configuring optional parameters for the NQA operation |
|
(Optional.) Configuring the collaboration feature |
|
(Optional.) Configuring threshold monitoring |
|
(Optional.) Configuring the NQA statistics collection feature |
|
(Optional.) Configuring the saving of NQA history records |
|
(Required.) Scheduling the NQA operation on the NQA client |
Configuring the ICMP echo operation
The ICMP echo operation measures the reachability of a destination device. It has the same function as the ping command, but provides more output information. In addition, if multiple paths exist between the source and destination devices, you can specify the next hop for the ICMP echo operation.
To configure the ICMP echo operation:
|
Step |
Command |
Remarks |
|
1. Enter system view. |
system-view |
N/A |
|
2. Create an NQA operation and enter NQA operation view. |
nqa entry admin-name operation-tag |
By default, no NQA operations exist. |
|
3. Specify the ICMP echo type and enter its view. |
type icmp-echo |
N/A |
|
4. Specify the destination IP address for ICMP echo requests. |
·
IPv4 address: ·
IPv6 address: |
By default, no destination IP address is specified. |
|
5. (Optional.) Set the payload size for each ICMP echo request. |
data-size size |
The default setting is 100 bytes. |
|
6. (Optional.) Specify the payload fill string for ICMP echo requests. |
data-fill string |
The default payload fill string is 0123456789. |
|
7. (Optional.) Specify the output interface for ICMP echo requests. |
By default, the output interface for ICMP echo requests is not specified. The NQA client determines the output interface based on the routing table lookup. |
|
|
8. (Optional.) Specify the source IP address for ICMP echo requests. |
·
Use the IP address of the specified interface
as the source IP address: ·
Specify the source IPv4 address: ·
Specify the source IPv6 address: |
By default, the source IP address of the requests is the IP address of their output interface. If you execute the source interface, source ip, and source ipv6 commands multiple times, the most recent configuration takes effect. The specified source interface must be up. The specified source IP address must be the IP address of a local interface, and the interface must be up. Otherwise, no probe packets can be sent out. |
|
9. (Optional.) Specify the next hop IP address for ICMP echo requests. |
·
IPv4 address: ·
IPv6 address: |
By default, no next hop IP address is configured. |
Configuring the ICMP jitter operation
The ICMP jitter operation measures unidirectional and bidirectional jitters. The operation result helps you to determine whether the network can carry jitter-sensitive services such as real-time voice and video services.
The ICMP jitter operation works as follows:
1. The NQA client sends ICMP packets to the destination device.
2. The destination device time stamps each packet it receives, and then sends the packet back to the NQA client.
3. Upon receiving the responses, the NQA client calculates the jitter according to the timestamps.
Before starting the operation, make sure the network devices are time synchronized by using NTP. For more information about NTP, see "Configuring NTP."
To configure the ICMP jitter operation:
|
Step |
Command |
Remarks |
|
1. Enter system view. |
system-view |
N/A |
|
2. Create an NQA operation and enter NQA operation view. |
nqa entry admin-name operation-tag |
By default, no NQA operations exist. |
|
3. Specify the ICMP jitter type and enter its view. |
type icmp-jitter |
N/A |
|
4. Specify the destination address of ICMP packets. |
destination ip ip-address |
By default, no destination IP address is specified. |
|
5. (Optional.) Specify the source IP address for ICMP packets. |
source ip ip-address |
By default, the source IP address of the ICMP packets is the primary IP address of their output interface. The specified source IP address must be the IP address of a local interface, and the interface must be up. Otherwise, no probe packets can be sent out. |
|
6. (Optional.) Set the number of ICMP packets sent in one ICMP jitter operation. |
probe packet-number packet-number |
The default setting is 10. |
|
7. (Optional.) Set the interval for sending ICMP packets. |
probe packet-interval interval |
The default setting is 20 milliseconds. |
|
8. (Optional.) Specify how long the NQA client waits for a response from the server before it regards the response times out. |
probe packet-timeout timeout |
The default setting is 3000 milliseconds. |
|
|
NOTE: Use the display nqa result or display nqa statistics command to verify the ICMP jitter operation. The display nqa history command does not display the ICMP jitter operation results or statistics. |
Configuring the DHCP operation
The DHCP operation measures whether or not the DHCP server can respond to client requests. DHCP also measures the amount of time it takes the NQA client to obtain an IP address from a DHCP server.
The NQA client simulates the DHCP relay agent to forward DHCP requests for IP address acquisition from the DHCP server. The interface that performs the DHCP operation does not change its IP address. When the DHCP operation completes, the NQA client sends a packet to release the obtained IP address.
To configure the DHCP operation:
|
Step |
Command |
Remarks |
|
1. Enter system view. |
system-view |
N/A |
|
2. Create an NQA operation and enter NQA operation view. |
nqa entry admin-name operation-tag |
By default, no NQA operations exist. |
|
3. Specify the DHCP type and enter its view. |
type dhcp |
N/A |
|
4. Specify the IP address of the DHCP server as the destination IP address of DHCP packets. |
destination ip ip-address |
By default, no destination IP address is specified. |
|
5. (Optional.) Specify an output interface for DHCP request packets. |
By default, the output interface for DHCP request packets is not specified. The NQA client determines the output interface based on the routing table lookup. |
|
|
6. (Optional.) Specify the source IP address of DHCP request packets. |
source ip ip-address |
By default, the source IP address of the DHCP request packets is the primary IP address of their output interface. The specified source IP address must be the IP address of a local interface, and the local interface must be up. Otherwise, no probe packets can be sent out. The NQA client adds the source IP address to the giaddr field in DHCP requests to be sent to the DHCP server. For more information about the giaddr field, see DHCP overview in Layer 3—IP Services Configuration Guide. |
Configuring the DNS operation
The DNS operation measures the time for the NQA client to translate a domain name into an IP address through a DNS server.
A DNS operation simulates domain name resolution and does not save the obtained DNS entry.
To configure the DNS operation:
|
Step |
Command |
Remarks |
|
1. Enter system view. |
system-view |
N/A |
|
2. Create an NQA operation and enter NQA operation view. |
nqa entry admin-name operation-tag |
By default, no NQA operations exist. |
|
3. Specify the DNS type and enter its view. |
type dns |
N/A |
|
4. Specify the IP address of the DNS server as the destination address of DNS packets. |
destination ip ip-address |
By default, no destination IP address is specified. |
|
5. Specify the domain name to be translated. |
resolve-target domain-name |
By default, no domain name is specified. |
Configuring the FTP operation
The FTP operation measures the time for the NQA client to transfer a file to or download a file from an FTP server.
When you configure the FTP operation, follow these restrictions and guidelines:
· When you perform the put operation with the filename command configured, make sure the file exists on the NQA client.
· If you get a file from the FTP server, make sure the file specified in the URL exists on the FTP server.
· The NQA client does not save the file obtained from the FTP server.
· Use a small file for the FTP operation. A big file might result in transfer failure because of timeout, or might affect other services because of the amount of network bandwidth it occupies.
To configure the FTP operation:
|
Step |
Command |
Remarks |
|
1. Enter system view. |
system-view |
N/A |
|
2. Create an NQA operation and enter NQA operation view. |
nqa entry admin-name operation-tag |
By default, no NQA operations exist. |
|
3. Specify the FTP type and enter its view. |
type ftp |
N/A |
|
4. Specify the URL of the destination FTP server. |
url url |
By default, no URL is specified for the destination FTP server. Enter the URL in one of the following formats: · ftp://host/filename. · ftp://host:port/filename. When you perform the get operation, the file name is required. |
|
5. (Optional.) Specify the source IP address of FTP request packets. |
source ip ip-address |
By default, the source IP address of the FTP request packets is the primary IP address of their output interface. The source IP address must be the IP address of a local interface, and the interface must be up. Otherwise, no FTP requests can be sent out. |
|
6. (Optional.) Specify the FTP operation type. |
operation { get | put } |
By default, the FTP operation type is get, which means obtaining files from the FTP server. |
|
7. Specify an FTP login username. |
username username |
By default, no FTP login username is configured. |
|
8. Specify an FTP login password. |
password { cipher | simple } string |
By default, no FTP login password is configured. |
|
9. (Optional.) Specify the name of a file to be transferred. |
filename file-name |
By default, no file is specified. This step is required if you perform the put operation. |
|
10. Set the data transmission mode. |
mode { active | passive } |
The default mode is active. |
Configuring the HTTP operation
An HTTP operation measures the time for the NQA client to obtain data from an HTTP server.
To configure an HTTP operation:
|
Step |
Command |
Remarks |
|
1. Enter system view. |
system-view |
N/A |
|
2. Create an NQA operation and enter NQA operation view. |
nqa entry admin-name operation-tag |
By default, no NQA operations exist. |
|
3. Specify the HTTP type and enter its view. |
type http |
N/A |
|
4. Specify the URL of the destination HTTP server. |
url url |
By default, no URL is specified for the destination HTTP server. Enter the URL in one of the following formats: · http://host/resource. · http://host:port/resource. |
|
5. Specify an HTTP login username. |
username username |
By default, no HTTP login username is specified. |
|
6. Specify an HTTP login password. |
password { cipher | simple } string |
By default, no HTTP login password is specified. |
|
7. (Optional.) Specify the source IP address of request packets. |
source ip ip-address |
By default, the source IP address of the request packets is the primary IP address of their output interface. The source IP address must be the IP address of a local interface, and the interface must be up. Otherwise, no request packets can be sent out. |
|
8. (Optional.) Specify the HTTP version. |
By default, HTTP 1.0 is used. |
|
|
9. (Optional.) Specify the HTTP operation type. |
operation { get | post | raw } |
By default, the HTTP operation type is get, which means obtaining data from the HTTP server. If you set the HTTP operation type to raw, configure the content of the HTTP request to be sent to the HTTP server in raw request view. |
|
10. (Optional.) Enter raw request view. |
raw-request |
Every time you enter raw request view, the previously configured content of the HTTP request is removed. |
|
11. (Optional.) Specify the HTTP request content. |
Enter or paste the content. |
By default, no contents are specified. This step is required for the raw operation. |
|
12. Save the input and return to HTTP operation view. |
quit |
N/A |
Configuring the UDP jitter operation
|
|
CAUTION: To ensure successful UDP jitter operations and avoid affecting existing services, do not perform the operations on well-known ports from 1 to 1023. |
Jitter means inter-packet delay variance. A UDP jitter operation measures unidirectional and bidirectional jitters. You can verify whether the network can carry jitter-sensitive services such as real-time voice and video services through the UDP jitter operation.
The UDP jitter operation works as follows:
1. The NQA client sends UDP packets to the destination port.
2. The destination device time stamps each packet it receives, and then sends the packet back to the NQA client.
3. Upon receiving the responses, the NQA client calculates the jitter according to the timestamps.
The UDP jitter operation requires both the NQA server and the NQA client. Before you perform the UDP jitter operation, configure the UDP listening service on the NQA server. For more information about UDP listening service configuration, see "Configuring the NQA server."
Before starting the operation, make sure the network devices are time synchronized by using NTP. For more information about NTP, see "Configuring NTP."
To configure a UDP jitter operation:
|
Step |
Command |
Remarks |
|
1. Enter system view. |
system-view |
N/A |
|
2. Create an NQA operation and enter NQA operation view. |
nqa entry admin-name operation-tag |
By default, no NQA operations exist. |
|
3. Specify the UDP jitter type and enter its view. |
type udp-jitter |
N/A |
|
4. Specify the destination address of UDP packets. |
destination ip ip-address |
By default, no destination IP address is specified. The destination IP address must be the same as the IP address of the listening service on the NQA server. |
|
5. Specify the destination port of UDP packets. |
destination port port-number |
By default, no destination port number is specified. The destination port number must be the same as the port number of the listening service on the NQA server. |
|
6. (Optional.) Specify the source IP address for UDP packets. |
source ip ip-address |
By default, the source IP address of the UDP packets is the primary IP address of their output interface. The source IP address must be the IP address of a local interface, and the interface must be up. Otherwise, no UDP packets can be sent out. |
|
7. (Optional.) Specify the source port number of UDP packets. |
source port port-number |
By default, no source port number is specified. |
|
8. (Optional.) Specify an output interface for UDP packets. |
out interface interface-type interface-number |
By default, the output interface for UDP packets is not specified. The NQA client determines the output interface based on the routing table lookup. |
|
9. (Optional.) Set the payload size for each UDP packet. |
data-size size |
The default setting is 100 bytes. |
|
10. (Optional.) Specify the payload fill string for UDP packets. |
data-fill string |
The default payload fill string is 0123456789. |
|
11. (Optional.) Set the number of UDP packets sent in one UDP jitter operation. |
probe packet-number packet-number |
The default setting is 10. |
|
12. (Optional.) Set the interval for sending UDP packets. |
probe packet-interval interval |
The default setting is 20 milliseconds. |
|
13. (Optional.) Specify how long the NQA client waits for a response from the server before it regards the response times out. |
probe packet-timeout timeout |
The default setting is 3000 milliseconds. |
|
|
NOTE: Use the display nqa result or display nqa statistics command to verify the UDP jitter operation. The display nqa history command does not display the UDP jitter operation results or statistics. |
Configuring the SNMP operation
The SNMP operation measures the time for the NQA client to get a response packet from an SNMP agent.
To configure the SNMP operation:
|
Step |
Command |
Remarks |
|
1. Enter system view. |
system-view |
N/A |
|
2. Create an NQA operation and enter NQA operation view. |
nqa entry admin-name operation-tag |
By default, no NQA operations exist. |
|
3. Specify the SNMP type and enter its view. |
type snmp |
N/A |
|
4. Specify the destination address of SNMP packets. |
destination ip ip-address |
By default, no destination IP address is specified. |
|
5. (Optional.) Specify the destination port number for the probe packets. |
destination port port-number |
The default destination port number is 161. |
|
6. (Optional.) Specify the source port of SNMP packets. |
source port port-number |
By default, no source port number is specified. |
|
7. (Optional.) Specify the source IP address of SNMP packets. |
source ip ip-address |
By default, the source IP address of the SNMP packets is the primary IP address of their output interface. The source IP address must be the IP address of a local interface, and the interface must be up. Otherwise, no SNMP packets can be sent out. |
|
8. (Optional.) Specify the community name for SNMPv1 or SNMPv2c probe packet. |
community read { cipher | simple } community-name |
By default, the SNMP operation uses community name public. Make sure the specified community name is the same as the community name configured on the SNMP agent. |
Configuring the TCP operation
The TCP operation measures the time for the NQA client to establish a TCP connection to a port on the NQA server.
The TCP operation requires both the NQA server and the NQA client. Before you perform a TCP operation, configure a TCP listening service on the NQA server. For more information about the TCP listening service configuration, see "Configuring the NQA server."
To configure the TCP operation:
|
Step |
Command |
Remarks |
|
1. Enter system view. |
system-view |
N/A |
|
2. Create an NQA operation and enter NQA operation view. |
nqa entry admin-name operation-tag |
By default, no NQA operations exist. |
|
3. Specify the TCP type and enter its view. |
type tcp |
N/A |
|
4. Specify the destination address of TCP packets. |
destination ip ip-address |
By default, no destination IP address is specified. The destination address must be the same as the IP address of the listening service configured on the NQA server. |
|
5. Specify the destination port of TCP packets. |
destination port port-number |
By default, no destination port number is configured. The destination port number must be the same as the port number of the listening service on the NQA server. |
|
6. (Optional.) Specify the source IP address of TCP packets. |
source ip ip-address |
By default, the source IP address of the TCP packets is the primary IP address of their output interface. The source IP address must be the IP address of a local interface, and the interface must be up. Otherwise, no TCP packets can be sent out. |
Configuring the UDP echo operation
The UDP echo operation measures the round-trip time between the client and a UDP port on the NQA server.
The UDP echo operation requires both the NQA server and the NQA client. Before you perform a UDP echo operation, configure a UDP listening service on the NQA server. For more information about the UDP listening service configuration, see "Configuring the NQA server."
To configure the UDP echo operation:
|
Step |
Command |
Remarks |
|
1. Enter system view. |
system-view |
N/A |
|
2. Create an NQA operation and enter NQA operation view. |
nqa entry admin-name operation-tag |
By default, no NQA operations exist. |
|
3. Specify the UDP echo type and enter its view. |
type udp-echo |
N/A |
|
4. Specify the destination address of UDP packets. |
destination ip ip-address |
By default, no destination IP address is specified. The destination address must be the same as the IP address of the listening service configured on the NQA server. |
|
5. Specify the destination port of UDP packets. |
destination port port-number |
By default, no destination port number is specified. The destination port number must be the same as the port number of the listening service on the NQA server. |
|
6. (Optional.) Set the payload size for each UDP packet. |
data-size size |
The default setting is 100 bytes. |
|
7. (Optional.) Specify the payload fill string for UDP packets. |
data-fill string |
The default payload fill string is 0123456789. |
|
8. (Optional.) Specify the source port of UDP packets. |
source port port-number |
By default, no source port number is specified. |
|
9. (Optional.) Specify the source IP address of UDP packets. |
source ip ip-address |
By default, the source IP address of the UDP packets is the primary IP address of their output interface. The source IP address must be the IP address of a local interface, and the interface must be up. Otherwise, no UDP packets can be sent out. |
Configuring the UDP tracert operation
The UDP tracert operation determines the routing path from the source device to the destination device.
Before you configure the UDP tracert operation, perform the following tasks:
· Enable sending ICMP time exceeded messages on the intermediate devices between the source and destination devices. If the intermediate devices are H3C devices, use the ip ttl-expires enable command.
· Enable sending ICMP destination unreachable messages on the destination device. If the destination device is an H3C device, use the ip unreachables enable command.
For more information about the ip ttl-expires enable and ip unreachables enable commands, see Layer 3—IP Services Command Reference.
The UDP tracert operation is not supported in IPv6 networks. To determine the routing path that the IPv6 packets traverse from the source to the destination, use the tracert ipv6 command. For more information about the command, see Network Management and Monitoring Command Reference.
To configure the UDP tracert operation:
|
Step |
Command |
Remarks |
|
1. Enter system view. |
system-view |
N/A |
|
2. Create an NQA operation and enter NQA operation view. |
nqa entry admin-name operation-tag |
By default, no NQA operations exist. |
|
3. Specify the UDP tracert operation type and enter its view. |
N/A |
|
|
4. Specify the destination address of UDP packets. |
destination ip ip-address |
By default, no destination IP address is configured. |
|
5. (Optional.) Specify the destination port of UDP packets. |
destination port port-number |
By default, the destination port number is 33434. This port number must be an unused number on the destination device, so that the destination device can reply with ICMP port unreachable messages. |
|
6. (Optional.) Set the payload size for each UDP packet. |
data-size size |
The default setting is 100 bytes. |
|
7. (Optional.) Enable the no-fragmentation feature. |
By default, the no-fragmentation feature is disabled. |
|
|
8. (Optional.) Set the maximum number of consecutive probe failures. |
max-failure times |
The default setting is 5. |
|
9. (Optional.) Set the TTL value for UDP packets in the start round of the UDP tracert operation. |
The default setting is 1. |
|
|
10. (Optional.) Specify an output interface for UDP packets. |
By default, the output interface for UDP packets is not specified. The NQA client determines the output interface based on the routing table lookup. |
|
|
11. (Optional.) Specify the source port of UDP packets. |
By default, no source port number is specified. |
|
|
12. (Optional.) Specify the source IP address of UDP packets. |
·
Specify the IP address of the specified
interface as the source IP address: ·
Specify the source IP address: |
By default, the source IP address of the UDP packets is the IP address of their output interface. If you execute the source ip and source interface commands multiple times, the most recent configuration takes effect. The specified source interface must be up. The source IP address must be the IP address of a local interface, and the local interface must be up. Otherwise, no probe packets can be sent out. |
Configuring the voice operation
|
|
CAUTION: To ensure successful voice operations and avoid affecting existing services, do not perform the operations on well-known ports from 1 to 1023. |
The voice operation measures VoIP network performance.
The voice operation works as follows:
1. The NQA client sends voice packets at sending intervals to the destination device (NQA server).
The voice packets are of one of the following codec types:
? G.711 A-law.
? G.711 μ-law.
? G.729 A-law.
2. The destination device time stamps each voice packet it receives and sends it back to the source.
3. Upon receiving the packet, the source device calculates the jitter and one-way delay based on the timestamp.
The following parameters that reflect VoIP network performance can be calculated by using the metrics gathered by the voice operation:
· Calculated Planning Impairment Factor (ICPIF)—Measures impairment to voice quality in a VoIP network. It is decided by packet loss and delay. A higher value represents a lower service quality.
· Mean Opinion Scores (MOS)—A MOS value can be evaluated by using the ICPIF value, in the range of 1 to 5. A higher value represents a higher service quality.
The evaluation of voice quality depends on users' tolerance for voice quality. For users with higher tolerance for voice quality, use the advantage-factor command to set an advantage factor. When the system calculates the ICPIF value, it subtracts the advantage factor to modify ICPIF and MOS values for voice quality evaluation.
The voice operation requires both the NQA server and the NQA client. Before you perform a voice operation, configure a UDP listening service on the NQA server. For more information about UDP listening service configuration, see "Configuring the NQA server."
The voice operation cannot repeat.
To configure the voice operation:
|
Step |
Command |
Remarks |
|
1. Enter system view. |
system-view |
N/A |
|
2. Create an NQA operation and enter NQA operation view. |
nqa entry admin-name operation-tag |
By default, no NQA operations exist. |
|
3. Specify the voice type and enter its view. |
type voice |
N/A |
|
4. Specify the destination address of voice packets. |
destination ip ip-address |
By default, no destination IP address is configured. The destination IP address must be the same as the IP address of the listening service on the NQA server. |
|
5. Specify the destination port of voice packets. |
destination port port-number |
By default, no destination port number is configured. The destination port number must be the same as the port number of the listening service on the NQA server. |
|
6. (Optional.) Specify the codec type. |
codec-type { g711a | g711u | g729a } |
By default, the codec type is G.711 A-law. |
|
7. (Optional.) Set the advantage factor for calculating MOS and ICPIF values. |
advantage-factor factor |
By default, the advantage factor is 0. |
|
8. (Optional.) Specify the source IP address of voice packets. |
source ip ip-address |
By default, the source IP address of the voice packets is the primary IP address of their output interface. The source IP address must be the IP address of a local interface, and the interface must be up. Otherwise, no voice packets can be sent out. |
|
9. (Optional.) Specify the source port number of voice packets. |
source port port-number |
By default, no source port number is specified. |
|
10. (Optional.) Set the payload size for each voice packet. |
data-size size |
By default, the voice packet size varies by codec type. The default packet size is 172 bytes for G.711A-law and G.711 μ-law codec type, and 32 bytes for G.729 A-law codec type. |
|
11. (Optional.) Specify the payload fill string for voice packets. |
data-fill string |
The default payload fill string is 0123456789. |
|
12. (Optional.) Set the number of voice packets to be sent in a voice probe. |
probe packet-number packet-number |
The default setting is 1000. |
|
13. (Optional.) Set the interval for sending voice packets. |
probe packet-interval interval |
The default setting is 20 milliseconds. |
|
14. (Optional.) Specify how long the NQA client waits for a response from the server before it regards the response times out. |
probe packet-timeout timeout |
The default setting is 5000 milliseconds. |
|
|
NOTE: Use the display nqa result or display nqa statistics command to verify the voice operation. The display nqa history command does not display the voice operation results or statistics. |
Configuring the DLSw operation
The DLSw operation measures the response time of a DLSw device.
To configure the DLSw operation:
|
Step |
Command |
Remarks |
|
1. Enter system view. |
system-view |
N/A |
|
2. Create an NQA operation and enter NQA operation view. |
nqa entry admin-name operation-tag |
By default, no NQA operations exist. |
|
3. Specify the DLSw type and enter its view. |
type dlsw |
N/A |
|
4. Specify the destination IP address of probe packets. |
destination ip ip-address |
By default, no destination IP address is specified. |
|
5. (Optional.) Specify the source IP address of probe packets. |
source ip ip-address |
By default, the source IP address of the probe packets is the primary IP address of their output interface. The source IP address must be the IP address of a local interface, and the interface must be up. Otherwise, no probe packets can be sent out. |
Configuring the path jitter operation
The path jitter operation measures the jitter, negative jitters, and positive jitters from the NQA client to each hop on the path to the destination.
Before you configure the path jitter operation, perform the following tasks:
· Enable sending ICMP time exceeded messages on the intermediate devices between the source and destination devices. If the intermediate devices are H3C devices, use the ip ttl-expires enable command.
· Enable sending ICMP destination unreachable messages on the destination device. If the destination device is an H3C device, use the ip unreachables enable command.
For more information about the ip ttl-expires enable and ip unreachables enable commands, see Layer 3—IP Services Command Reference.
To configure the path jitter operation:
|
Step |
Command |
Remarks |
|
1. Enter system view. |
system-view |
N/A |
|
2. Create an NQA operation and enter NQA operation view. |
nqa entry admin-name operation-tag |
By default, no NQA operations exist. |
|
3. Specify the path jitter type and enter its view. |
type path-jitter |
N/A |
|
4. Specify the destination address of ICMP echo requests. |
destination ip ip-address |
By default, no destination IP address is specified. |
|
5. (Optional.) Set the payload size for each ICMP echo request. |
data-size size |
The default setting is 100 bytes. |
|
6. (Optional.) Specify the payload fill string for ICMP echo requests. |
data-fill string |
The default payload fill string is 0123456789. |
|
7. Specify the source IP address of ICMP echo requests. |
source ip ip-address |
By default, the source IP address of the ICMP echo requests is the primary IP address of their output interface. The source IP address must be the IP address of a local interface, and the interface must be up. Otherwise, no ICMP echo requests can be sent out. |
|
8. (Optional.) Set the number of ICMP echo requests to be sent in a path jitter operation. |
probe packet-number packet-number |
The default setting is 10. |
|
9. (Optional.) Set the interval for sending ICMP echo requests. |
probe packet-interval interval |
The default setting is 20 milliseconds. |
|
10. (Optional.) Specify how long the NQA client waits for a response from the server before it regards the response times out. |
probe packet-timeout timeout |
The default setting is 3000 milliseconds. |
|
11. (Optional.) Specify an LSR path. |
lsr-path ip-address&<1-8> |
By default, no LSR path is specified. The path jitter operation uses the tracert to detect the LSR path to the destination, and sends ICMP echo requests to each hop on the LSR. |
|
12. (Optional.) Perform the path jitter operation only on the destination address. |
target-only |
By default, the path jitter operation is performed on each hop on the path to the destination. |
Configuring optional parameters for the NQA operation
Unless otherwise specified, the following optional parameters apply to all types of NQA operations.
The parameter settings take effect only on the current operation.
To configure optional parameters for an NQA operation:
|
Step |
Command |
Remarks |
|
1. Enter system view. |
system-view |
N/A |
|
2. Enter the view of an existing NQA operation. |
nqa entry admin-name operation-tag |
N/A |
|
3. Configure a description. |
description text |
By default, no description is configured. |
|
4. Set the interval at which the NQA operation repeats. |
frequency interval |
For a voice or path jitter operation, the default setting is 60000 milliseconds. For other types of operations, the default setting is 0 milliseconds, and only one operation is performed. If the operation is not completed when the interval expires, the next operation does not start. |
|
5. Specify the probe times. |
probe count times |
By default: · In an UDP tracert operation, the NQA client performs three probes to each hop to the destination. · In other types of operations, the NQA client performs one probe to the destination per operation. This command is not available for the path jitter and voice operations. Each of these operations performs only one probe. |
|
6. Set the probe timeout time. |
probe timeout timeout |
The default setting is 3000 milliseconds. This command is not available for the ICMP jitter, path jitter, UDP jitter, and voice operations. |
|
7. Set the maximum number of hops that the probe packets can traverse. |
ttl value |
The default setting is 30 for probe packets of the UDP tracert operation, and is 20 for probe packets of other types of operations. This command is not available for the DHCP or path jitter operation. |
|
8. Set the ToS value in the IP header of probe packets. |
tos value |
The default setting is 0. |
|
9. Enable the routing table bypass feature. |
route-option bypass-route |
By default, the routing table bypass feature is disabled. This command is not available for the DHCP and path jitter operations. |
|
10. Specify the VPN where the operation is performed. |
vpn-instance vpn-instance-name |
By default, the operation is performed on the public network. |
Configuring the collaboration feature
Collaboration is implemented by associating a reaction entry of an NQA operation with a track entry. The reaction entry monitors the NQA operation. If the number of operation failures reaches the specified threshold, the configured action is triggered.
The collaboration feature is not available for the following types of operations:
· ICMP jitter operation.
· UDP jitter operation.
· UDP tracert operation.
· Voice operation.
· Path jitter operation.
To configure the collaboration feature:
|
Step |
Command |
Remarks |
|
1. Enter system view. |
system-view |
N/A |
|
2. Enter the view of an existing NQA operation. |
nqa entry admin-name operation-tag |
N/A |
|
3. Configure a reaction entry. |
reaction item-number checked-element probe-fail threshold-type consecutive consecutive-occurrences action-type trigger-only |
By default, no reaction entry is configured. You cannot modify the content of an existing reaction entry. |
|
4. Return to system view. |
quit |
N/A |
|
5. Associate Track with NQA. |
See High Availability Configuration Guide. |
N/A |
|
6. Associate Track with an application module. |
See High Availability Configuration Guide. |
N/A |
Configuring threshold monitoring
This feature allows you to monitor the NQA operation running status.
Threshold types
An NQA operation supports the following threshold types:
· average—If the average value for the monitored performance metric either exceeds the upper threshold or goes below the lower threshold, a threshold violation occurs.
· accumulate—If the total number of times that the monitored performance metric is out of the specified value range reaches or exceeds the specified threshold, a threshold violation occurs.
· consecutive—If the number of consecutive times that the monitored performance metric is out of the specified value range reaches or exceeds the specified threshold, a threshold violation occurs.
Threshold violations for the average or accumulate threshold type are determined on a per NQA operation basis. The threshold violations for the consecutive type are determined from the time the NQA operation starts.
Triggered actions
The following actions might be triggered:
· none—NQA displays results only on the terminal screen. It does not send traps to the NMS.
· trap-only—NQA displays results on the terminal screen, and meanwhile it sends traps to the NMS.
· trigger-only—NQA displays results on the terminal screen, and meanwhile triggers other modules for collaboration.
The DNS operation does not support the action of sending trap messages.
Reaction entry
In a reaction entry, configure a monitored element, a threshold type, and an action to be triggered to implement threshold monitoring.
The state of a reaction entry can be invalid, over-threshold, or below-threshold.
· Before an NQA operation starts, the reaction entry is in invalid state.
· If the threshold is violated, the state of the entry is set to over-threshold. Otherwise, the state of the entry is set to below-threshold.
If the action is trap-only for a reaction entry, a trap message is sent to the NMS when the state of the entry changes.
Configuration procedure
Before you configure threshold monitoring, configure the destination address of the trap messages by using the snmp-agent target-host command. For more information about the command, see Network Management and Monitoring Command Reference.
The threshold monitoring feature is not available for the path jitter operation.
To configure threshold monitoring:
|
Step |
Command |
Remarks |
|
1. Enter system view. |
system-view |
N/A |
|
2. Enter the view of an existing NQA operation. |
nqa entry admin-name operation-tag |
N/A |
|
3. Enable sending traps to the NMS when specific conditions are met. |
reaction trap { path-change | probe-failure consecutive-probe-failures | test-complete | test-failure [ accumulate-probe-failures ] } |
By default, no traps are sent to the NMS. The ICMP jitter, UDP jitter, and voice operations support only the test-complete keyword. The following parameters are not available for the UDP tracert operation: · The probe-failure consecutive-probe-failures option. · The accumulate-probe-failures argument. |
|
4. Configure threshold monitoring. |
·
Monitor the operation duration (not
supported in the ICMP jitter, UDP jitter, UDP tracert, and voice operations): ·
Monitor failure times (not supported in the
ICMP jitter, UDP jitter, UDP tracert, and voice operations): ·
Monitor the round-trip time (only for the ICMP
jitter, UDP jitter, and voice operations): ·
Monitor packet loss (only for the ICMP jitter,
UDP jitter, and voice operations): ·
Monitor the one-way jitter (only for the ICMP
jitter, UDP jitter, and voice operations): ·
Monitor the one-way delay (only for the ICMP
jitter, UDP jitter, and voice operations): ·
Monitor the ICPIF value (only for the voice
operation): ·
Monitor the MOS value (only for the voice
operation): |
N/A |
Configuring the NQA statistics collection feature
NQA forms statistics within the same collection interval as a statistics group. To display information about the statistics groups, use the display nqa statistics command.
NQA does not generate any statistics group for the operation that runs once. To set the NQA operation to run only once, use the frequency command to set the interval to 0 milliseconds.
The NQA statistics collection feature is not available for the UDP tracert operation.
To configure the NQA statistics collection feature:
|
Step |
Command |
Remarks |
|
1. Enter system view. |
system-view |
N/A |
|
2. Enter the view of an existing NQA operation. |
nqa entry admin-name operation-tag |
N/A |
|
3. (Optional.) Set the interval for collecting the statistics. |
statistics interval interval |
The default setting is 60 minutes. |
|
4. (Optional.) Set the maximum number of statistics groups that can be saved. |
statistics max-group number |
The default setting is two groups. To disable the NQA statistics collection feature, set the maximum number to 0. When the maximum number of statistics groups is reached, to save a new statistics group, the oldest statistics group is deleted. |
|
5. (Optional.) Set the hold time of statistics groups. |
statistics hold-time hold-time |
The default setting is 120 minutes. A statistics group is deleted when its hold time expires. |
Configuring the saving of NQA history records
The NQA history record saving feature is not available for the following types of operations:
· ICMP jitter operation.
· UDP jitter operation.
· Voice operation.
· Path jitter operation.
To configure the saving of NQA history records:
|
Step |
Command |
Remarks |
|
|
1. Enter system view. |
system-view |
N/A |
|
|
2. Enter the view of an existing NQA operation. |
nqa entry admin-name operation-tag |
N/A |
|
|
3. Enable the saving of history records for the NQA operation. |
history-record enable |
By default, this feature is enabled only for the UDP tracert operation. |
|
|
4. (Optional.) Set the lifetime of history records. |
history-record keep-time keep-time |
The default setting is 120 minutes. A record is deleted when its lifetime is reached. |
|
|
5. (Optional.) Set the maximum number of history records that can be saved. |
history-record number number |
The default setting is 50. If the maximum number of history records for an NQA operation is reached, the earliest history records are deleted. |
|
|
6. (Optional.) Display NQA history records. |
display nqa history |
N/A |
|
Scheduling the NQA operation on the NQA client
The NQA operation works between the specified start time and the end time (the start time plus operation duration). If the specified start time is ahead of the system time, the operation starts immediately. If both the specified start and end time are ahead of the system time, the operation does not start. To display the current system time, use the display clock command.
When you schedule an NQA operation, follow these restrictions and guidelines:
· You cannot enter the operation type view or the operation view of a scheduled NQA operation.
· A system time adjustment does not affect started or completed NQA operations. It affects only the NQA operations that have not started.
To schedule the NQA operation on the NQA client:
|
Step |
Command |
|
1. Enter system view. |
system-view |
|
2. Specify the scheduling parameters for an NQA operation. |
nqa schedule admin-name operation-tag start-time { hh:mm:ss [ yyyy/mm/dd | mm/dd/yyyy ] | now } lifetime { lifetime | forever } [ recurring ] |
Displaying and maintaining NQA
Execute display commands in any view.
|
Task |
Command |
|
Display history records of NQA operations. |
display nqa history [ admin-name operation-tag ] |
|
Display the current monitoring results of reaction entries. |
display nqa reaction counters [ admin-name operation-tag [ item-number ] ] |
|
Display the most recent result of the NQA operation. |
display nqa result [ admin-name operation-tag ] |
|
Display NQA statistics. |
display nqa statistics [ admin-name operation-tag ] |
|
Display NQA server status. |
display nqa server status |
NQA configuration examples
ICMP echo operation configuration example
Network requirements
As shown in Figure 7, configure an ICMP echo operation on the NQA client (Device A) to test the round-trip time to Device B. The next hop of Device A is Device C.
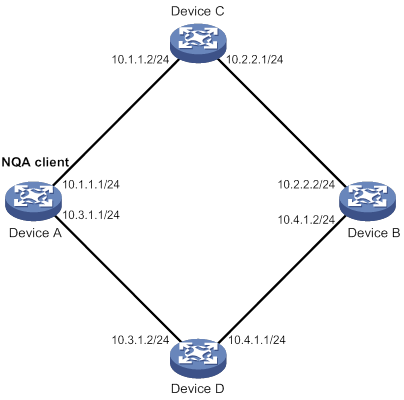
Configuration procedure
# Assign IP addresses to interfaces, as shown in Figure 7. (Details not shown.)
# Configure static routes or a routing protocol to make sure the devices can reach each other. (Details not shown.)
# Create an ICMP echo operation.
<DeviceA> system-view
[DeviceA] nqa entry admin test1
[DeviceA-nqa-admin-test1] type icmp-echo
# Specify 10.2.2.2 as the destination IP address of ICMP echo requests.
[DeviceA-nqa-admin-test1-icmp-echo] destination ip 10.2.2.2
# Specify 10.1.1.2 as the next hop. The ICMP echo requests are sent through Device C to Device B.
[DeviceA-nqa-admin-test1-icmp-echo] next-hop ip 10.1.1.2
# Configure the ICMP echo operation to perform 10 probes.
[DeviceA-nqa-admin-test1-icmp-echo] probe count 10
# Set the probe timeout time to 500 milliseconds for the ICMP echo operation.
[DeviceA-nqa-admin-test1-icmp-echo] probe timeout 500
# Configure the ICMP echo operation to repeat every 5000 milliseconds.
[DeviceA-nqa-admin-test1-icmp-echo] frequency 5000
# Enable saving history records.
[DeviceA-nqa-admin-test1-icmp-echo] history-record enable
# Set the maximum number of history records to 10.
[DeviceA-nqa-admin-test1-icmp-echo] history-record number 10
[DeviceA-nqa-admin-test1-icmp-echo] quit
# Start the ICMP echo operation.
[DeviceA] nqa schedule admin test1 start-time now lifetime forever
# After the ICMP echo operation runs for a period of time, stop the operation.
[DeviceA] undo nqa schedule admin test1
# Display the most recent result of the ICMP echo operation.
[DeviceA] display nqa result admin test1
NQA entry (admin admin, tag test1) test results:
Send operation times: 10 Receive response times: 10
Min/Max/Average round trip time: 2/5/3
Square-Sum of round trip time: 96
Last succeeded probe time: 2011-08-23 15:00:01.2
Extended results:
Packet loss ratio: 0%
Failures due to timeout: 0
Failures due to internal error: 0
Failures due to other errors: 0
# Display the history records of the ICMP echo operation.
[DeviceA] display nqa history admin test1
NQA entry (admin admin, tag test) history records:
Index Response Status Time
370 3 Succeeded 2007-08-23 15:00:01.2
369 3 Succeeded 2007-08-23 15:00:01.2
368 3 Succeeded 2007-08-23 15:00:01.2
367 5 Succeeded 2007-08-23 15:00:01.2
366 3 Succeeded 2007-08-23 15:00:01.2
365 3 Succeeded 2007-08-23 15:00:01.2
364 3 Succeeded 2007-08-23 15:00:01.1
363 2 Succeeded 2007-08-23 15:00:01.1
362 3 Succeeded 2007-08-23 15:00:01.1
361 2 Succeeded 2007-08-23 15:00:01.1
The output shows that the packets sent by Device A can reach Device B through Device C. No packet loss occurs during the operation. The minimum, maximum, and average round-trip times are 2, 5, and 3 milliseconds, respectively.
ICMP jitter operation configuration example
Network requirements
As shown in Figure 8, configure an ICMP jitter operation to test the jitter between Device A and Device B.

Configuration procedure
1. Assign IP addresses to interfaces, as shown in Figure 8. (Details not shown.)
2. Configure static routes or a routing protocol to make sure the devices can reach each other. (Details not shown.)
3. Configure Device A:
# Create an ICMP jitter operation.
<DeviceA> system-view
[DeviceA] nqa entry admin test1
[DeviceA-nqa-admin-test1] type icmp-jitter
# Specify 10.2.2.2 as the destination address for the operation.
[DeviceA-nqa-admin-test1-icmp-jitter] destination ip 10.2.2.2
# Configure the operation to repeat every 1000 milliseconds.
[DeviceA-nqa-admin-test1-icmp-jitter] frequency 1000
[DeviceA-nqa-admin-test1-icmp-jitter] quit
# Start the ICMP jitter operation.
[DeviceA] nqa schedule admin test1 start-time now lifetime forever
# After the ICMP jitter operation runs for a period of time, stop the operation.
[DeviceA] undo nqa schedule admin test1
# Display the most recent result of the ICMP jitter operation.
[DeviceA] display nqa result admin test1
NQA entry (admin admin, tag test1) test results:
Send operation times: 10 Receive response times: 10
Min/Max/Average round trip time: 15/32/17
Square-Sum of round trip time: 3235
Last packet received time: 2011-05-29 13:56:17.6
Extended results:
Packet loss ratio: 0%
Failures due to timeout: 0
Failures due to internal error: 0
Failures due to other errors: 0
Packets out of sequence: 0
Packets arrived late: 0
ICMP-jitter results:
RTT number: 10
Min positive SD: 4 Min positive DS: 1
Max positive SD: 21 Max positive DS: 28
Positive SD number: 5 Positive DS number: 4
Positive SD sum: 52 Positive DS sum: 38
Positive SD average: 10 Positive DS average: 10
Positive SD square-sum: 754 Positive DS square-sum: 460
Min negative SD: 1 Min negative DS: 6
Max negative SD: 13 Max negative DS: 22
Negative SD number: 4 Negative DS number: 5
Negative SD sum: 38 Negative DS sum: 52
Negative SD average: 10 Negative DS average: 10
Negative SD square-sum: 460 Negative DS square-sum: 754
One way results:
Max SD delay: 15 Max DS delay: 16
Min SD delay: 7 Min DS delay: 7
Number of SD delay: 10 Number of DS delay: 10
Sum of SD delay: 78 Sum of DS delay: 85
Square-Sum of SD delay: 666 Square-Sum of DS delay: 787
Lost packets for unknown reason: 0
# Display the statistics of the ICMP jitter operation.
[DeviceA] display nqa statistics admin test1
NQA entry (admin admin, tag test1) test statistics:
NO. : 1
Start time: 2015-07-10 13:56:14.0
Life time: 47 seconds
Send operation times: 410 Receive response times: 410
Min/Max/Average round trip time: 1/93/19
Square-Sum of round trip time: 206176
Extended results:
Packet loss ratio: 0%
Failures due to timeout: 0
Failures due to internal error: 0
Failures due to other errors: 0
Packets out of sequence: 0
Packets arrived late: 0
ICMP-jitter results:
RTT number: 410
Min positive SD: 3 Min positive DS: 1
Max positive SD: 30 Max positive DS: 79
Positive SD number: 186 Positive DS number: 158
Positive SD sum: 2602 Positive DS sum: 1928
Positive SD average: 13 Positive DS average: 12
Positive SD square-sum: 45304 Positive DS square-sum: 31682
Min negative SD: 1 Min negative DS: 1
Max negative SD: 30 Max negative DS: 78
Negative SD number: 181 Negative DS number: 209
Negative SD sum: 181 Negative DS sum: 209
Negative SD average: 13 Negative DS average: 14
Negative SD square-sum: 46994 Negative DS square-sum: 3030
One way results:
Max SD delay: 46 Max DS delay: 46
Min SD delay: 7 Min DS delay: 7
Number of SD delay: 410 Number of DS delay: 410
Sum of SD delay: 3705 Sum of DS delay: 3891
Square-Sum of SD delay: 45987 Square-Sum of DS delay: 49393
Lost packets for unknown reason: 0
DHCP operation configuration example
Network requirements
As shown in Figure 9, configure a DHCP operation to test the time required for Router A to obtain an IP address from the DHCP server.
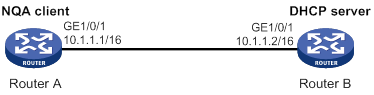
Configuration procedure
# Create a DHCP operation.
<RouterA> system-view
[RouterA] nqa entry admin test1
[RouterA-nqa-admin-test1] type dhcp
# Specify the DHCP server IP address (10.1.1.2) as the destination address.
[RouterA-nqa-admin-test1-dhcp] destination ip 10.1.1.2
# Enable the saving of history records.
[RouterA-nqa-admin-test1-dhcp] history-record enable
[RouterA-nqa-admin-test1-dhcp] quit
# Start the DHCP operation.
[RouterA] nqa schedule admin test1 start-time now lifetime forever
# After the DHCP operation runs for a period of time, stop the operation.
[RouterA] undo nqa schedule admin test1
# Display the most recent result of the DHCP operation.
[RouterA] display nqa result admin test1
NQA entry (admin admin, tag test) test results:
Send operation times: 1 Receive response times: 1
Min/Max/Average round trip time: 512/512/512
Square-Sum of round trip time: 262144
Last succeeded probe time: 2007-11-22 09:54:03.8
Extended results:
Packet loss ratio: 0%
Failures due to timeout: 0
Failures due to internal error: 0
Failures due to other errors: 0
# Display the history records of the DHCP operation.
[RouterA] display nqa history admin test1
NQA entry (admin admin, tag test) history records:
Index Response Status Time
1 512 Succeeded 2007-11-22 09:54:03.8
The output shows that it took Router A 512 milliseconds to obtain an IP address from the DHCP server.
DNS operation configuration example
Network requirements
As shown in Figure 10, configure a DNS operation to test whether Device A can perform address resolution through the DNS server and test the resolution time.
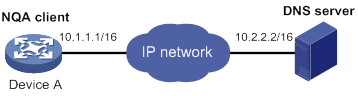
Configuration procedure
# Assign IP addresses to interfaces, as shown in Figure 10. (Details not shown.)
# Configure static routes or a routing protocol to make sure the devices can reach each other. (Details not shown.)
# Create a DNS operation.
<DeviceA> system-view
[DeviceA] nqa entry admin test1
[DeviceA-nqa-admin-test1] type dns
# Specify the IP address of the DNS server (10.2.2.2) as the destination address.
[DeviceA-nqa-admin-test1-dns] destination ip 10.2.2.2
# Specify host.com as the domain name to be translated.
[DeviceA-nqa-admin-test1-dns] resolve-target host.com
# Enable the saving of history records.
[DeviceA-nqa-admin-test1-dns] history-record enable
[DeviceA-nqa-admin-test1-dns] quit
# Start the DNS operation.
[DeviceA] nqa schedule admin test1 start-time now lifetime forever
# After the DNS operation runs for a period of time, stop the operation.
[DeviceA] undo nqa schedule admin test1
# Display the most recent result of the DNS operation.
[DeviceA] display nqa result admin test1
NQA entry (admin admin, tag test1) test results:
Send operation times: 1 Receive response times: 1
Min/Max/Average round trip time: 62/62/62
Square-Sum of round trip time: 3844
Last succeeded probe time: 2011-11-10 10:49:37.3
Extended results:
Packet loss ratio: 0%
Failures due to timeout: 0
Failures due to internal error: 0
Failures due to other errors: 0
# Display the history records of the DNS operation.
[DeviceA] display nqa history admin test1
NQA entry (admin admin, tag test) history records:
Index Response Status Time
1 62 Succeeded 2011-11-10 10:49:37.3
The output shows that it took Device A 62 milliseconds to translate domain name host.com into an IP address.
FTP operation configuration example
Network requirements
As shown in Figure 11, configure an FTP operation to test the time required for Device A to upload a file to the FTP server. The login username and password are admin and systemtest, respectively. The file to be transferred to the FTP server is config.txt.
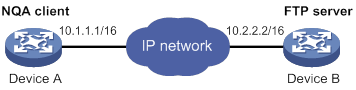
Configuration procedure
# Assign IP addresses to interfaces, as shown in Figure 11. (Details not shown.)
# Configure static routes or a routing protocol to make sure the devices can reach each other. (Details not shown.)
# Create an FTP operation.
<DeviceA> system-view
[DeviceA] nqa entry admin test1
[DeviceA-nqa-admin-test1] type ftp
# Specify the URL of the FTP server.
[DeviceA-nqa-admin-test-ftp] url ftp://10.2.2.2
# Specify 10.1.1.1 as the source IP address.
[DeviceA-nqa-admin-test1-ftp] source ip 10.1.1.1
# Configure the device to upload file config.txt to the FTP server.
[DeviceA-nqa-admin-test1-ftp] operation put
[DeviceA-nqa-admin-test1-ftp] filename config.txt
# Set the username to admin for the FTP operation.
[DeviceA-nqa-admin-test1-ftp] username admin
# Set the password to systemtest for the FTP operation.
[DeviceA-nqa-admin-test1-ftp] password simple systemtest
# Enable the saving of history records.
[DeviceA-nqa-admin-test1-ftp] history-record enable
[DeviceA-nqa-admin-test1-ftp] quit
# Start the FTP operation.
[DeviceA] nqa schedule admin test1 start-time now lifetime forever
# After the FTP operation runs for a period of time, stop the operation.
[DeviceA] undo nqa schedule admin test1
# Display the most recent result of the FTP operation.
[DeviceA] display nqa result admin test1
NQA entry (admin admin, tag test1) test results:
Send operation times: 1 Receive response times: 1
Min/Max/Average round trip time: 173/173/173
Square-Sum of round trip time: 29929
Last succeeded probe time: 2011-11-22 10:07:28.6
Extended results:
Packet loss ratio: 0%
Failures due to timeout: 0
Failures due to disconnect: 0
Failures due to no connection: 0
Failures due to internal error: 0
Failures due to other errors: 0
# Display the history records of the FTP operation.
[DeviceA] display nqa history admin test1
NQA entry (admin admin, tag test1) history records:
Index Response Status Time
1 173 Succeeded 2011-11-22 10:07:28.6
The output shows that it took Device A 173 milliseconds to upload a file to the FTP server.
HTTP operation configuration example
Network requirements
As shown in Figure 12, configure an HTTP operation on the NQA client to test the time required to obtain data from the HTTP server.
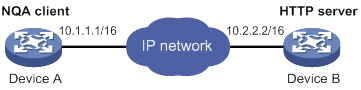
Configuration procedure
# Assign IP addresses to interfaces, as shown in Figure 12. (Details not shown.)
# Configure static routes or a routing protocol to make sure the devices can reach each other. (Details not shown.)
# Create an HTTP operation.
<DeviceA> system-view
[DeviceA] nqa entry admin test1
[DeviceA-nqa-admin-test1] type http
# Specify the URL of the HTTP server.
[DeviceA-nqa-admin-test-http] url http://10.2.2.2/index.htm
# Configure the HTTP operation to get data from the HTTP server.
[DeviceA-nqa-admin-test1-http] operation get
# Configure the operation to use HTTP version 1.0.
[DeviceA-nqa-admin-test1-http] version v1.0
# Enable the saving of history records.
[DeviceA-nqa-admin-test1-http] history-record enable
[DeviceA-nqa-admin-test1-http] quit
# Start the HTTP operation.
[DeviceA] nqa schedule admin test1 start-time now lifetime forever
# After the HTTP operation runs for a period of time, stop the operation.
[DeviceA] undo nqa schedule admin test1
# Display the most recent result of the HTTP operation.
[DeviceA] display nqa result admin test1
NQA entry (admin admin, tag test1) test results:
Send operation times: 1 Receive response times: 1
Min/Max/Average round trip time: 64/64/64
Square-Sum of round trip time: 4096
Last succeeded probe time: 2011-11-22 10:12:47.9
Extended results:
Packet loss ratio: 0%
Failures due to timeout: 0
Failures due to disconnect: 0
Failures due to no connection: 0
Failures due to internal error: 0
Failures due to other errors: 0
# Display the history records of the HTTP operation.
[DeviceA] display nqa history admin test1
NQA entry (admin admin, tag test1) history records:
Index Response Status Time
1 64 Succeeded 2011-11-22 10:12:47.9
The output shows that it took Device A 64 milliseconds to obtain data from the HTTP server.
UDP jitter operation configuration example
Network requirements
As shown in Figure 13, configure a UDP jitter operation to test the jitter, delay, and round-trip time between Device A and Device B.
Configuration procedure
1. Assign IP addresses to interfaces, as shown in Figure 13. (Details not shown.)
2. Configure static routes or a routing protocol to make sure the devices can reach each other. (Details not shown.)
3. Configure Device B:
# Enable the NQA server.
<DeviceB> system-view
[DeviceB] nqa server enable
# Configure a listening service to listen to UDP port 9000 on IP address 10.2.2.2.
[DeviceB] nqa server udp-echo 10.2.2.2 9000
4. Configure Device A:
# Create a UDP jitter operation.
<DeviceA> system-view
[DeviceA] nqa entry admin test1
[DeviceA-nqa-admin-test1] type udp-jitter
# Specify 10.2.2.2 as the destination address of the operation.
[DeviceA-nqa-admin-test1-udp-jitter] destination ip 10.2.2.2
# Set the destination port number to 9000.
[DeviceA-nqa-admin-test1-udp-jitter] destination port 9000
# Configure the operation to repeat every 1000 milliseconds.
[DeviceA-nqa-admin-test1-udp-jitter] frequency 1000
[DeviceA-nqa-admin-test1-udp-jitter] quit
# Start the UDP jitter operation.
[DeviceA] nqa schedule admin test1 start-time now lifetime forever
# After the UDP jitter operation runs for a period of time, stop the operation.
[DeviceA] undo nqa schedule admin test1
# Display the most recent result of the UDP jitter operation.
[DeviceA] display nqa result admin test1
NQA entry (admin admin, tag test1) test results:
Send operation times: 10 Receive response times: 10
Min/Max/Average round trip time: 15/32/17
Square-Sum of round trip time: 3235
Last packet received time: 2011-05-29 13:56:17.6
Extended results:
Packet loss ratio: 0%
Failures due to timeout: 0
Failures due to internal error: 0
Failures due to other errors: 0
Packets out of sequence: 0
Packets arrived late: 0
UDP-jitter results:
RTT number: 10
Min positive SD: 4 Min positive DS: 1
Max positive SD: 21 Max positive DS: 28
Positive SD number: 5 Positive DS number: 4
Positive SD sum: 52 Positive DS sum: 38
Positive SD average: 10 Positive DS average: 10
Positive SD square-sum: 754 Positive DS square-sum: 460
Min negative SD: 1 Min negative DS: 6
Max negative SD: 13 Max negative DS: 22
Negative SD number: 4 Negative DS number: 5
Negative SD sum: 38 Negative DS sum: 52
Negative SD average: 10 Negative DS average: 10
Negative SD square-sum: 460 Negative DS square-sum: 754
One way results:
Max SD delay: 15 Max DS delay: 16
Min SD delay: 7 Min DS delay: 7
Number of SD delay: 10 Number of DS delay: 10
Sum of SD delay: 78 Sum of DS delay: 85
Square-Sum of SD delay: 666 Square-Sum of DS delay: 787
SD lost packets: 0 DS lost packets: 0
Lost packets for unknown reason: 0
# Display the statistics of the UDP jitter operation.
[DeviceA] display nqa statistics admin test1
NQA entry (admin admin, tag test1) test statistics:
NO. : 1
Start time: 2011-05-29 13:56:14.0
Life time: 47 seconds
Send operation times: 410 Receive response times: 410
Min/Max/Average round trip time: 1/93/19
Square-Sum of round trip time: 206176
Extended results:
Packet loss ratio: 0%
Failures due to timeout: 0
Failures due to internal error: 0
Failures due to other errors: 0
Packets out of sequence: 0
Packets arrived late: 0
UDP-jitter results:
RTT number: 410
Min positive SD: 3 Min positive DS: 1
Max positive SD: 30 Max positive DS: 79
Positive SD number: 186 Positive DS number: 158
Positive SD sum: 2602 Positive DS sum: 1928
Positive SD average: 13 Positive DS average: 12
Positive SD square-sum: 45304 Positive DS square-sum: 31682
Min negative SD: 1 Min negative DS: 1
Max negative SD: 30 Max negative DS: 78
Negative SD number: 181 Negative DS number: 209
Negative SD sum: 181 Negative DS sum: 209
Negative SD average: 13 Negative DS average: 14
Negative SD square-sum: 46994 Negative DS square-sum: 3030
One way results:
Max SD delay: 46 Max DS delay: 46
Min SD delay: 7 Min DS delay: 7
Number of SD delay: 410 Number of DS delay: 410
Sum of SD delay: 3705 Sum of DS delay: 3891
Square-Sum of SD delay: 45987 Square-Sum of DS delay: 49393
SD lost packets: 0 DS lost packets: 0
Lost packets for unknown reason: 0
SNMP operation configuration example
Network requirements
As shown in Figure 14, configure an SNMP operation to test the time the NQA client uses to get a response from the SNMP agent.
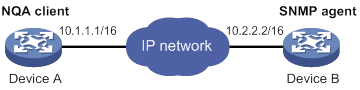
Configuration procedure
1. Assign IP addresses to interfaces, as shown in Figure 14. (Details not shown.)
2. Configure static routes or a routing protocol to make sure the devices can reach each other. (Details not shown.)
3. Configure the SNMP agent (Device B):
# Set the SNMP version to all.
<DeviceB> system-view
[DeviceB] snmp-agent sys-info version all
# Set the read community to public.
[DeviceB] snmp-agent community read public
# Set the write community to private.
[DeviceB] snmp-agent community write private
4. Configure Device A:
# Create an SNMP operation.
<DeviceA> system-view
[DeviceA] nqa entry admin test1
[DeviceA-nqa-admin-test1] type snmp
# Specify 10.2.2.2 as the destination IP address of the SNMP operation.
[DeviceA-nqa-admin-test1-snmp] destination ip 10.2.2.2
# Enable the saving of history records.
[DeviceA-nqa-admin-test1-snmp] history-record enable
[DeviceA-nqa-admin-test1-snmp] quit
# Start the SNMP operation.
[DeviceA] nqa schedule admin test1 start-time now lifetime forever
# After the SNMP operation runs for a period of time, stop the operation.
[DeviceA] undo nqa schedule admin test1
# Display the most recent result of the SNMP operation.
[DeviceA] display nqa result admin test1
NQA entry (admin admin, tag test1) test results:
Send operation times: 1 Receive response times: 1
Min/Max/Average round trip time: 50/50/50
Square-Sum of round trip time: 2500
Last succeeded probe time: 2011-11-22 10:24:41.1
Extended results:
Packet loss ratio: 0%
Failures due to timeout: 0
Failures due to internal error: 0
Failures due to other errors: 0
# Display the history records of the SNMP operation.
[DeviceA] display nqa history admin test1
NQA entry (admin admin, tag test1) history records:
Index Response Status Time
1 50 Succeeded 2011-11-22 10:24:41.1
The output shows that it took Device A 50 milliseconds to receive a response from the SNMP agent.
TCP operation configuration example
Network requirements
As shown in Figure 15, configure a TCP operation to test the time required for Device A to establish a TCP connection with Device B.
Configuration procedure
1. Assign IP addresses to interfaces, as shown in Figure 15. (Details not shown.)
2. Configure static routes or a routing protocol to make sure the devices can reach each other. (Details not shown.)
3. Configure Device B:
# Enable the NQA server.
<DeviceB> system-view
[DeviceB] nqa server enable
# Configure a listening service to listen to TCP port 9000 on IP address 10.2.2.2.
[DeviceB] nqa server tcp-connect 10.2.2.2 9000
4. Configure Device A:
# Create a TCP operation.
<DeviceA> system-view
[DeviceA] nqa entry admin test1
[DeviceA-nqa-admin-test1] type tcp
# Specify 10.2.2.2 as the destination IP address.
[DeviceA-nqa-admin-test1-tcp] destination ip 10.2.2.2
# Set the destination port number to 9000.
[DeviceA-nqa-admin-test1-tcp] destination port 9000
# Enable the saving of history records.
[DeviceA-nqa-admin-test1-tcp] history-record enable
[DeviceA-nqa-admin-test1-tcp] quit
# Start the TCP operation.
[DeviceA] nqa schedule admin test1 start-time now lifetime forever
# After the TCP operation runs for a period of time, stop the operation.
[DeviceA] undo nqa schedule admin test1
# Display the most recent result of the TCP operation.
[DeviceA] display nqa result admin test1
NQA entry (admin admin, tag test1) test results:
Send operation times: 1 Receive response times: 1
Min/Max/Average round trip time: 13/13/13
Square-Sum of round trip time: 169
Last succeeded probe time: 2011-11-22 10:27:25.1
Extended results:
Packet loss ratio: 0%
Failures due to timeout: 0
Failures due to disconnect: 0
Failures due to no connection: 0
Failures due to internal error: 0
Failures due to other errors: 0
# Display the history records of the TCP operation.
[DeviceA] display nqa history admin test1
NQA entry (admin admin, tag test1) history records:
Index Response Status Time
1 13 Succeeded 2011-11-22 10:27:25.1
The output shows that it took Device A 13 milliseconds to establish a TCP connection to port 9000 on the NQA server.
UDP echo operation configuration example
Network requirements
As shown in Figure 16, configure a UDP echo operation on the NQA client to test the round-trip time to Device B. The destination port number is 8000.
Configuration procedure
1. Assign IP addresses to interfaces, as shown in Figure 16. (Details not shown.)
2. Configure static routes or a routing protocol to make sure the devices can reach each other. (Details not shown.)
3. Configure Device B:
# Enable the NQA server.
<DeviceB> system-view
[DeviceB] nqa server enable
# Configure a listening service to listen to UDP port 8000 on IP address 10.2.2.2.
[DeviceB] nqa server udp-echo 10.2.2.2 8000
4. Configure Device A:
# Create a UDP echo operation.
<DeviceA> system-view
[DeviceA] nqa entry admin test1
[DeviceA-nqa-admin-test1] type udp-echo
# Specify 10.2.2.2 as the destination IP address.
[DeviceA-nqa-admin-test1-udp-echo] destination ip 10.2.2.2
# Set the destination port number to 8000.
[DeviceA-nqa-admin-test1-udp-echo] destination port 8000
# Enable the saving of history records.
[DeviceA-nqa-admin-test1-udp-echo] history-record enable
[DeviceA-nqa-admin-test1-udp-echo] quit
# Start the UDP echo operation.
[DeviceA] nqa schedule admin test1 start-time now lifetime forever
# After the UDP echo operation runs for a period of time, stop the operation.
[DeviceA] undo nqa schedule admin test1
# Display the most recent result of the UDP echo operation.
[DeviceA] display nqa result admin test1
NQA entry (admin admin, tag test1) test results:
Send operation times: 1 Receive response times: 1
Min/Max/Average round trip time: 25/25/25
Square-Sum of round trip time: 625
Last succeeded probe time: 2011-11-22 10:36:17.9
Extended results:
Packet loss ratio: 0%
Failures due to timeout: 0
Failures due to internal error: 0
Failures due to other errors: 0
# Display the history records of the UDP echo operation.
[DeviceA] display nqa history admin test1
NQA entry (admin admin, tag test1) history records:
Index Response Status Time
1 25 Succeeded 2011-11-22 10:36:17.9
The output shows that the round-trip time between Device A and port 8000 on Device B is 25 milliseconds.
UDP tracert operation configuration example
Network requirements
As shown in Figure 17, configure a UDP tracert operation to determine the routing path from Device A to Device B.
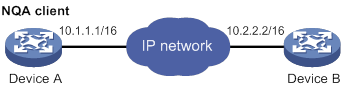
Configuration procedure
1. Assign IP addresses to interfaces, as shown in Figure 17. (Details not shown.)
2. Configure static routes or a routing protocol to make sure the devices can reach each other. (Details not shown.)
3. Execute the ip ttl-expires enable command on the intermediate devices and execute the ip unreachables enable command on Device B.
4. Configure Device A:
# Create a UDP tracert operation.
[DeviceA] nqa entry admin test1
[DeviceA-nqa-admin-test1] type udp-tracert
# Specify 10.2.2.2 as the destination IP address.
[DeviceA-nqa-admin-test1-udp-tracert] destination ip 10.2.2.2
# Set the destination port number to 33434.
[DeviceA-nqa-admin-test1-udp-tracert] destination port 33434
# Configure Device A to perform three probes to each hop.
[DeviceA-nqa-admin-test1-udp-tracert] probe count 3
# Set the probe timeout time to 500 milliseconds.
[DeviceA-nqa-admin-test1-udp-tracert] probe timeout 500
# Configure the UDP tracert operation to repeat every 5000 milliseconds.
[DeviceA-nqa-admin-test1-udp-tracert] frequency 5000
# Specify GigabitEthernet 1/0/1 as the output interface for UDP packets.
[DeviceA-nqa-admin-test1-udp-tracert] out interface gigabitethernet 1/0/1
# Enable the no-fragmentation feature.
[DeviceA-nqa-admin-test1-udp-tracert] no-fragment enable
# Set the maximum number of consecutive probe failures to 6.
[DeviceA-nqa-admin-test1-udp-tracert] max-failure 6
# Set the TTL value to 1 for UDP packets in the start round of the UDP tracert operation.
[DeviceA-nqa-admin-test1-udp-tracert] init-ttl 1
# Start the UDP tracert operation.
[DeviceA] nqa schedule admin test1 start-time now lifetime forever
# After the UDP tracert operation runs for a period of time, stop the operation.
[DeviceA] undo nqa schedule admin test1
# Display the most recent result of the UDP tracert operation.
[DeviceA] display nqa result admin test1
NQA entry (admin admin, tag test1) test results:
Send operation times: 6 Receive response times: 6
Min/Max/Average round trip time: 1/1/1
Square-Sum of round trip time: 1
Last succeeded probe time: 2013-09-09 14:46:06.2
Extended results:
Packet loss in test: 0%
Failures due to timeout: 0
Failures due to internal error: 0
Failures due to other errors: 0
UDP-tracert results:
TTL Hop IP Time
1 3.1.1.1 2013-09-09 14:46:03.2
2 10.2.2.2 2013-09-09 14:46:06.2
# Display the history records of the UDP tracert operation.
[DeviceA] display nqa history admin test1
NQA entry (admin admin, tag test1) history records:
Index TTL Response Hop IP Status Time
1 2 2 10.2.2.2 Succeeded 2013-09-09 14:46:06.2
1 2 1 10.2.2.2 Succeeded 2013-09-09 14:46:05.2
1 2 2 10.2.2.2 Succeeded 2013-09-09 14:46:04.2
1 1 1 3.1.1.1 Succeeded 2013-09-09 14:46:03.2
1 1 2 3.1.1.1 Succeeded 2013-09-09 14:46:02.2
1 1 1 3.1.1.1 Succeeded 2013-09-09 14:46:01.2
Voice operation configuration example
Network requirements
As shown in Figure 18, configure a voice operation to test jitters, delay, MOS, and ICPIF between Device A and Device B.
Configuration procedure
1. Assign IP addresses to interfaces, as shown in Figure 18. (Details not shown.)
2. Configure static routes or a routing protocol to make sure the devices can reach each other. (Details not shown.)
3. Configure Device B:
# Enable the NQA server.
<DeviceB> system-view
[DeviceB] nqa server enable
# Configure a listening service to listen to UDP port 9000 on IP address 10.2.2.2.
[DeviceB] nqa server udp-echo 10.2.2.2 9000
4. Configure Device A:
# Create a voice operation.
<DeviceA> system-view
[DeviceA] nqa entry admin test1
[DeviceA-nqa-admin-test1] type voice
# Specify 10.2.2.2 as the destination IP address.
[DeviceA-nqa-admin-test1-voice] destination ip 10.2.2.2
# Set the destination port number to 9000.
[DeviceA-nqa-admin-test1-voice] destination port 9000
[DeviceA-nqa-admin-test1-voice] quit
# Start the voice operation.
[DeviceA] nqa schedule admin test1 start-time now lifetime forever
# After the voice operation runs for a period of time, stop the operation.
[DeviceA] undo nqa schedule admin test1
# Display the most recent result of the voice operation.
[DeviceA] display nqa result admin test1
NQA entry (admin admin, tag test1) test results:
Send operation times: 1000 Receive response times: 1000
Min/Max/Average round trip time: 31/1328/33
Square-Sum of round trip time: 2844813
Last packet received time: 2011-06-13 09:49:31.1
Extended results:
Packet loss ratio: 0%
Failures due to timeout: 0
Failures due to internal error: 0
Failures due to other errors: 0
Packets out of sequence: 0
Packets arrived late: 0
Voice results:
RTT number: 1000
Min positive SD: 1 Min positive DS: 1
Max positive SD: 204 Max positive DS: 1297
Positive SD number: 257 Positive DS number: 259
Positive SD sum: 759 Positive DS sum: 1797
Positive SD average: 2 Positive DS average: 6
Positive SD square-sum: 54127 Positive DS square-sum: 1691967
Min negative SD: 1 Min negative DS: 1
Max negative SD: 203 Max negative DS: 1297
Negative SD number: 255 Negative DS number: 259
Negative SD sum: 759 Negative DS sum: 1796
Negative SD average: 2 Negative DS average: 6
Negative SD square-sum: 53655 Negative DS square-sum: 1691776
One way results:
Max SD delay: 343 Max DS delay: 985
Min SD delay: 343 Min DS delay: 985
Number of SD delay: 1 Number of DS delay: 1
Sum of SD delay: 343 Sum of DS delay: 985
Square-Sum of SD delay: 117649 Square-Sum of DS delay: 970225
SD lost packets: 0 DS lost packets: 0
Lost packets for unknown reason: 0
Voice scores:
MOS value: 4.38 ICPIF value: 0
# Display the statistics of the voice operation.
[DeviceA] display nqa statistics admin test1
NQA entry (admin admin, tag test1) test statistics:
NO. : 1
Start time: 2011-06-13 09:45:37.8
Life time: 331 seconds
Send operation times: 4000 Receive response times: 4000
Min/Max/Average round trip time: 15/1328/32
Square-Sum of round trip time: 7160528
Extended results:
Packet loss ratio: 0%
Failures due to timeout: 0
Failures due to internal error: 0
Failures due to other errors: 0
Packets out of sequence: 0
Packets arrived late: 0
Voice results:
RTT number: 4000
Min positive SD: 1 Min positive DS: 1
Max positive SD: 360 Max positive DS: 1297
Positive SD number: 1030 Positive DS number: 1024
Positive SD sum: 4363 Positive DS sum: 5423
Positive SD average: 4 Positive DS average: 5
Positive SD square-sum: 497725 Positive DS square-sum: 2254957
Min negative SD: 1 Min negative DS: 1
Max negative SD: 360 Max negative DS: 1297
Negative SD number: 1028 Negative DS number: 1022
Negative SD sum: 1028 Negative DS sum: 1022
Negative SD average: 4 Negative DS average: 5
Negative SD square-sum: 495901 Negative DS square-sum: 5419
One way results:
Max SD delay: 359 Max DS delay: 985
Min SD delay: 0 Min DS delay: 0
Number of SD delay: 4 Number of DS delay: 4
Sum of SD delay: 1390 Sum of DS delay: 1079
Square-Sum of SD delay: 483202 Square-Sum of DS delay: 973651
SD lost packets: 0 DS lost packets: 0
Lost packets for unknown reason: 0
Voice scores:
Max MOS value: 4.38 Min MOS value: 4.38
Max ICPIF value: 0 Min ICPIF value: 0
DLSw operation configuration example
Network requirements
As shown in Figure 19, configure a DLSw operation to test the response time of the DLSw device.
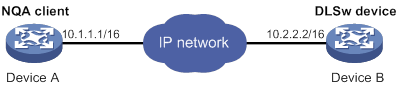
Configuration procedure
# Assign IP addresses to interfaces, as shown in Figure 19. (Details not shown.)
# Configure static routes or a routing protocol to make sure the devices can reach each other. (Details not shown.)
# Create a DLSw operation.
<DeviceA> system-view
[DeviceA] nqa entry admin test1
[DeviceA-nqa-admin-test1] type dlsw
# Specify 10.2.2.2 as the destination IP address.
[DeviceA-nqa-admin-test1-dlsw] destination ip 10.2.2.2
# Enable the saving of history records.
[DeviceA-nqa-admin-test1-dlsw] history-record enable
[DeviceA-nqa-admin-test1-dlsw] quit
# Start the DLSw operation.
[DeviceA] nqa schedule admin test1 start-time now lifetime forever
# After the DLSw operation runs for a period of time, stop the operation.
[DeviceA] undo nqa schedule admin test1
# Display the most recent result of the DLSw operation.
[DeviceA] display nqa result admin test1
NQA entry (admin admin, tag test1) test results:
Send operation times: 1 Receive response times: 1
Min/Max/Average round trip time: 19/19/19
Square-Sum of round trip time: 361
Last succeeded probe time: 2011-11-22 10:40:27.7
Extended results:
Packet loss ratio: 0%
Failures due to timeout: 0
Failures due to disconnect: 0
Failures due to no connection: 0
Failures due to internal error: 0
Failures due to other errors: 0
# Display the history records of the DLSw operation.
[DeviceA] display nqa history admin test1
NQA entry (admin admin, tag test1) history records:
Index Response Status Time
1 19 Succeeded 2011-11-22 10:40:27.7
The output shows that the response time of the DLSw device is 19 milliseconds.
Path jitter operation configuration example
Network requirements
As shown in Figure 20, configure a path jitter operation to test the round trip time and jitters from Device A to Device B and Device C.
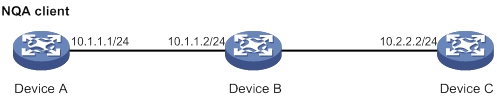
Configuration procedure
# Assign IP addresses to interfaces, as shown in Figure 20. (Details not shown.)
# Configure static routes or a routing protocol to make sure the devices can reach each other. (Details not shown.)
# Execute the ip ttl-expires enable command on Device B and execute the ip unreachables enable command on Device C.
# Create a path jitter operation.
<DeviceA> system-view
[DeviceA] nqa entry admin test1
[DeviceA-nqa-admin-test1] type path-jitter
# Specify 10.2.2.2 as the destination IP address of ICMP echo requests.
[DeviceA-nqa-admin-test1-path-jitter] destination ip 10.2.2.2
# Configure the path jitter operation to repeat every 10000 milliseconds.
[DeviceA-nqa-admin-test1-path-jitter] frequency 10000
[DeviceA-nqa-admin-test1-path-jitter] quit
# Start the path jitter operation.
[DeviceA] nqa schedule admin test1 start-time now lifetime forever
# After the path jitter operation runs for a period of time, stop the operation.
[DeviceA] undo nqa schedule admin test1
# Display the most recent result of the path jitter operation.
[DeviceA] display nqa result admin test1
NQA entry (admin admin, tag test1) test results:
Hop IP 10.1.1.2
Basic Results
Send operation times: 10 Receive response times: 10
Min/Max/Average round trip time: 9/21/14
Square-Sum of round trip time: 2419
Extended Results
Failures due to timeout: 0
Failures due to internal error: 0
Failures due to other errors: 0
Packets out of sequence: 0
Packets arrived late: 0
Path-Jitter Results
Jitter number: 9
Min/Max/Average jitter: 1/10/4
Positive jitter number: 6
Min/Max/Average positive jitter: 1/9/4
Sum/Square-Sum positive jitter: 25/173
Negative jitter number: 3
Min/Max/Average negative jitter: 2/10/6
Sum/Square-Sum positive jitter: 19/153
Hop IP 10.2.2.2
Basic Results
Send operation times: 10 Receive response times: 10
Min/Max/Average round trip time: 15/40/28
Square-Sum of round trip time: 4493
Extended Results
Failures due to timeout: 0
Failures due to internal error: 0
Failures due to other errors: 0
Packets out of sequence: 0
Packets arrived late: 0
Path-Jitter Results
Jitter number: 9
Min/Max/Average jitter: 1/10/4
Positive jitter number: 6
Min/Max/Average positive jitter: 1/9/4
Sum/Square-Sum positive jitter: 25/173
Negative jitter number: 3
Min/Max/Average negative jitter: 2/10/6
Sum/Square-Sum positive jitter: 19/153
NQA collaboration configuration example
Network requirements
As shown in Figure 21, configure a static route to Router C with Router B as the next hop on Router A. Associate the static route, a track entry, and an ICMP echo operation to monitor the state of the static route.
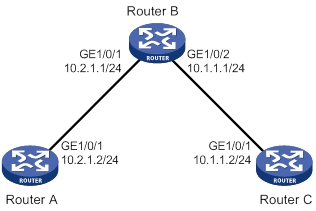
Configuration procedure
1. Assign IP addresses to interfaces, as shown in Figure 21. (Details not shown.)
2. On Router A, configure a static route, and associate the static route with track entry 1.
<RouterA> system-view
[RouterA] ip route-static 10.1.1.2 24 10.2.1.1 track 1
3. On Router A, configure an ICMP echo operation:
# Create an NQA operation with administrator name admin and operation tag test1.
[RouterA] nqa entry admin test1
# Set the NQA operation type to ICMP echo.
[RouterA-nqa-admin-test1] type icmp-echo
# Specify 10.2.1.1 as the destination IP address.
[RouterA-nqa-admin-test1-icmp-echo] destination ip 10.2.1.1
# Configure the operation to repeat every 100 milliseconds.
[RouterA-nqa-admin-test1-icmp-echo] frequency 100
# Create reaction entry 1. If the number of consecutive probe failures reaches 5, collaboration is triggered.
[RouterA-nqa-admin-test1-icmp-echo] reaction 1 checked-element probe-fail threshold-type consecutive 5 action-type trigger-only
[RouterA-nqa-admin-test1-icmp-echo] quit
# Start the ICMP echo operation.
[RouterA] nqa schedule admin test1 start-time now lifetime forever
4. On Router A, create track entry 1, and associate it with reaction entry 1 of the NQA operation.
[RouterA] track 1 nqa entry admin test1 reaction 1
Verifying the configuration
# Display information about all the track entries on Router A.
[RouterA] display track all
Track ID: 1
State: Positive
Duration: 0 days 0 hours 0 minutes 0 seconds
Notification delay: Positive 0, Negative 0 (in seconds)
Tracked object:
NQA entry: admin test1
Reaction: 1
Remote IP/URL: 10.2.1.1
Local IP: --
Interface: --
# Display brief information about active routes in the routing table on Router A.
[RouterA] display ip routing-table
Destinations : 13 Routes : 13
Destination/Mask Proto Pre Cost NextHop Interface
0.0.0.0/32 Direct 0 0 127.0.0.1 InLoop0
10.1.1.0/24 Static 60 0 10.2.1.1 GE1/0/1
10.2.1.0/24 Direct 0 0 10.2.1.2 GE1/0/1
10.2.1.0/32 Direct 0 0 10.2.1.2 GE1/0/1
10.2.1.2/32 Direct 0 0 127.0.0.1 InLoop0
10.2.1.255/32 Direct 0 0 10.2.1.2 GE1/0/1
127.0.0.0/8 Direct 0 0 127.0.0.1 InLoop0
127.0.0.0/32 Direct 0 0 127.0.0.1 InLoop0
127.0.0.1/32 Direct 0 0 127.0.0.1 InLoop0
127.255.255.255/32 Direct 0 0 127.0.0.1 InLoop0
224.0.0.0/4 Direct 0 0 0.0.0.0 NULL0
224.0.0.0/24 Direct 0 0 0.0.0.0 NULL0
255.255.255.255/32 Direct 0 0 127.0.0.1 InLoop0
The output shows that the static route with the next hop 10.2.1.1 is active, and the status of the track entry is positive.
# Remove the IP address of GigabitEthernet 1/0/1 on Router B.
<RouterB> system-view
[RouterB] interface gigabitethernet 1/0/1
[RouterB-GigabitEthernet1/0/1] undo ip address
# Display information about all the track entries on Router A.
[RouterA] display track all
Track ID: 1
State: Negative
Duration: 0 days 0 hours 0 minutes 0 seconds
Notification delay: Positive 0, Negative 0 (in seconds)
Tracked object:
NQA entry: admin test1
Reaction: 1
Remote IP/URL: 10.2.1.1
Local IP: --
Interface: --
# Display brief information about active routes in the routing table on Router A.
[RouterA] display ip routing-table
Destinations : 12 Routes : 12
Destination/Mask Proto Pre Cost NextHop Interface
0.0.0.0/32 Direct 0 0 127.0.0.1 InLoop0
10.2.1.0/24 Direct 0 0 10.2.1.2 GE1/0/1
10.2.1.0/32 Direct 0 0 10.2.1.2 GE1/0/1
10.2.1.2/32 Direct 0 0 127.0.0.1 InLoop0
10.2.1.255/32 Direct 0 0 10.2.1.2 GE1/0/1
127.0.0.0/8 Direct 0 0 127.0.0.1 InLoop0
127.0.0.0/32 Direct 0 0 127.0.0.1 InLoop0
127.0.0.1/32 Direct 0 0 127.0.0.1 InLoop0
127.255.255.255/32 Direct 0 0 127.0.0.1 InLoop0
224.0.0.0/4 Direct 0 0 0.0.0.0 NULL0
224.0.0.0/24 Direct 0 0 0.0.0.0 NULL0
255.255.255.255/32 Direct 0 0 127.0.0.1 InLoop0
The output shows that the static route does not exist, and the status of the track entry is negative.
Configuring NTP
Synchronize your device with a trusted time source by using the Network Time Protocol (NTP) or changing the system time before you run it on a live network. Various tasks, including network management, charging, auditing, and distributed computing depend on an accurate system time setting, because the timestamps of system messages and logs use the system time.
Overview
NTP is typically used in large networks to dynamically synchronize time among network devices. It guarantees higher clock accuracy than manual system clock setting. In a small network that does not require high clock accuracy, you can keep time synchronized among devices by changing their system clocks one by one.
NTP runs over UDP and uses UDP port 123.
How NTP works
Figure 22 shows how NTP synchronizes the system time between two devices (Device A and Device B, in this example). Assume that:
· Prior to the time synchronization, the time is set to 10:00:00 am for Device A and 11:00:00 am for Device B.
· Device B is used as the NTP server. Device A is to be synchronized to Device B.
· It takes 1 second for an NTP message to travel from Device A to Device B, and from Device B to Device A.
· It takes 1 second for Device B to process the NTP message.
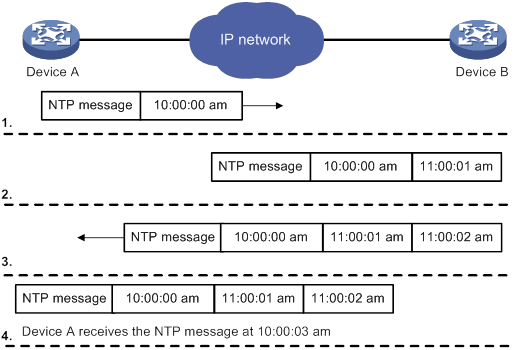
The synchronization process is as follows:
1. Device A sends Device B an NTP message, which is timestamped when it leaves Device A. The time stamp is 10:00:00 am (T1).
2. When this NTP message arrives at Device B, Device B adds a timestamp showing the time when the message arrived at Device B. The timestamp is 11:00:01 am (T2).
3. When the NTP message leaves Device B, Device B adds a timestamp showing the time when the message left Device B. The timestamp is 11:00:02 am (T3).
4. When Device A receives the NTP message, the local time of Device A is 10:00:03 am (T4).
Up to now, Device A can calculate the following parameters based on the timestamps:
· The roundtrip delay of the NTP message: Delay = (T4 – T1) – (T3 – T2) = 2 seconds.
· Time difference between Device A and Device B: Offset = [ (T2 – T1) + (T3 – T4) ] /2 = 1 hour.
Based on these parameters, Device A can be synchronized to Device B.
This is only a rough description of the work mechanism of NTP. For more information, see the related protocols and standards.
NTP architecture
NTP uses stratums 1 to 16 to define clock accuracy, as shown in Figure 23. A lower stratum value represents higher accuracy. Clocks at stratums 1 through 15 are in synchronized state, and clocks at stratum 16 are not synchronized.
A stratum 1 NTP server gets its time from an authoritative time source, such as an atomic clock. It provides time for other devices as the primary NTP server. A stratum 2 time server receives its time from a stratum 1 time server, and so on.
To ensure time accuracy and availability, you can specify multiple NTP servers for a device. The device selects an optimal NTP server as the clock source based on parameters such as stratum. The clock that the device selects is called the reference source. For more information about clock selection, see the related protocols and standards.
If the devices in a network cannot synchronize to an authoritative time source, you can perform the following tasks:
· Select a device that has a relatively accurate clock from the network.
· Use the local clock of the device as the reference clock to synchronize other devices in the network.
Association modes
NTP supports the following association modes:
· Client/server mode
· Symmetric active/passive mode
· Broadcast mode
· Multicast mode
Table 2 NTP association mode
|
Mode |
Working process |
Principle |
Application scenario |
|
Client/server |
On the client, specify the IP address of the NTP server. A client sends a clock synchronization message to the NTP servers. Upon receiving the message, the servers automatically operate in server mode and send a reply. If the client can be synchronized to multiple time servers, it selects an optimal clock and synchronizes its local clock to the optimal reference source after receiving the replies from the servers. |
A client can synchronize to a server, but a server cannot synchronize to a client. |
As Figure 23 shows, this mode is intended for configurations where devices of a higher stratum synchronize to devices with a lower stratum. |
|
Symmetric active/passive |
On the symmetric active peer, specify the IP address of the symmetric passive peer. A symmetric active peer periodically sends clock synchronization messages to a symmetric passive peer. The symmetric passive peer automatically operates in symmetric passive mode and sends a reply. If the symmetric active peer can be synchronized to multiple time servers, it selects an optimal clock and synchronizes its local clock to the optimal reference source after receiving the replies from the servers. |
A symmetric active peer and a symmetric passive peer can be synchronized to each other. If both of them are synchronized, the peer with a higher stratum is synchronized to the peer with a lower stratum. |
As Figure 23 shows, this mode is most often used between servers with the same stratum to operate as a backup for one another. If a server fails to communicate with all the servers of a lower stratum, the server can still synchronize to the servers of the same stratum. |
|
Broadcast |
A server periodically sends clock synchronization messages to the broadcast address 255.255.255.255. Clients listen to the broadcast messages from the servers to synchronize to the server according to the broadcast messages. When a client receives the first broadcast message, the client and the server start to exchange messages to calculate the network delay between them. Then, only the broadcast server sends clock synchronization messages. |
A broadcast client can synchronize to a broadcast server, but a broadcast server cannot synchronize to a broadcast client. |
A broadcast server sends clock synchronization messages to synchronize clients in the same subnet. As Figure 23 shows, broadcast mode is intended for configurations involving one or a few servers and a potentially large client population. The broadcast mode has a lower time accuracy than the client/server and symmetric active/passive modes because only the broadcast servers send clock synchronization messages. |
|
Multicast |
A multicast server periodically sends clock synchronization messages to the user-configured multicast address. Clients listen to the multicast messages from servers and synchronize to the server according to the received messages. |
A multicast client can synchronize to a multicast server, but a multicast server cannot synchronize to a multicast client. |
A multicast server can provide time synchronization for clients in the same subnet or in different subnets. The multicast mode has a lower time accuracy than the client/server and symmetric active/passive modes. |
In this document, an "NTP server" or a "server" refers to a device that operates as an NTP server in client/server mode. Time servers refer to all the devices that can provide time synchronization, including NTP servers, NTP symmetric peers, broadcast servers, and multicast servers.
NTP security
To improve time synchronization security, NTP provides the access control and authentication functions.
NTP access control
You can control NTP access by using an ACL. The access rights are in the following order, from least restrictive to most restrictive:
· Peer—Allows time requests and NTP control queries (such as alarms, authentication status, and time server information) and allows the local device to synchronize itself to a peer device.
· Server—Allows time requests and NTP control queries, but does not allow the local device to synchronize itself to a peer device.
· Synchronization—Allows only time requests from a system whose address passes the access list criteria.
· Query—Allows only NTP control queries from a peer device to the local device.
The device processes an NTP request, as follows:
· If no NTP access control is configured, peer is granted to the local device and peer devices.
· If the IP address of the peer device matches a permit statement in an ACL for more than one access right, the least restrictive access right is granted to the peer device. If a deny statement or no ACL is matched, no access right is granted.
· If no ACL is created for an access right, the associated access right is not granted.
· If no ACL is created for any access right, peer is granted.
This feature provides minimal security for a system running NTP. A more secure method is NTP authentication.
NTP authentication
Use this feature to authenticate the NTP messages for security purposes. If an NTP message passes authentication, the device can receive it and get time synchronization information. If not, the device discards the message. This function makes sure the device does not synchronize to an unauthorized time server.
Figure 24 NTP authentication
As shown in Figure 24, NTP authentication works as follows:
1. The sender uses the key identified by the key ID to calculate a digest for the NTP message through the MD5 algorithm. Then it sends the calculated digest together with the NTP message and key ID to the receiver.
2. Upon receiving the message, the receiver performs the following tasks:
a. Finds the key according to the key ID in the message.
b. Uses the key and the MD5 algorithm to calculate the digest for the message.
c. Compares the digest with the digest contained in the NTP message.
- If they are different, the receiver discards the message.
- If they are the same, the receiver determines whether the sender is allowed to use the authentication ID. If the sender is allowed to use the authentication ID, the receiver accepts the message. If the sender is not allowed to use the authentication ID, the receiver discards the message.
NTP for MPLS L3VPNs
In an MPLS L3VPN network, the device supports multiple VPN instances when:
· It functions as an NTP client to synchronize with the NTP server.
· It functions as a symmetric active peer to synchronize with the symmetric passive peer.
Only the client/server and symmetric active/passive modes support VPN instances. For more information about MPLS L3VPN, VPN instance, and PE, see MPLS Configuration Guide.
As shown in Figure 25, users in VPN 1 and VPN 2 are connected to the MPLS backbone network through provider edge (PE) devices, and services of the two VPNs are isolated. Time synchronization between PEs and devices of the two VPNs can be realized if you perform the following tasks:
· Configure the PEs to operate in NTP client or symmetric active mode.
· Specify the VPN to which the NTP server or NTP symmetric passive peer belongs.
Protocols and standards
· RFC 1305, Network Time Protocol (Version 3) Specification, Implementation and Analysis
· RFC 5905, Network Time Protocol Version 4: Protocol and Algorithms Specification
Configuration restrictions and guidelines
When you configure NTP, follow these restrictions and guidelines:
· You cannot configure both NTP and SNTP on the same device.
· NTP is supported only on the following Layer 3 interfaces:
? Layer 3 Ethernet interfaces.
? Layer 3 aggregate interfaces.
? VLAN interfaces.
? Tunnel interfaces.
· Do not configure NTP on an aggregate member port.
· The NTP service and SNTP service are mutually exclusive. You can only enable either NTP service or SNTP service at a time.
· To ensure time synchronization accuracy, do not specify more than one reference source. Doing so might cause frequent time changes or even synchronization failures.
· Make sure you use the clock protocol command to specify the time protocol as NTP. For more information about the clock protocol command, see Fundamentals Command Reference.
Configuration task list
|
Tasks at a glance |
|
(Required.) Enabling the NTP service |
|
(Required.) Perform one or both of the following tasks: |
|
(Optional.) Configuring access control rights |
|
(Optional.) Configuring NTP authentication |
|
(Optional.) Configuring NTP optional parameters |
Enabling the NTP service
|
Step |
Command |
Remarks |
|
1. Enter system view. |
system-view |
N/A |
|
2. Enable the NTP service. |
ntp-service enable |
By default, the NTP service is disabled. |
Configuring NTP association mode
This section describes how to configure NTP association mode.
Configuring NTP in client/server mode
When the device operates in client/server mode, specify the IP address for the server on the client.
Follow these guidelines when you configure an NTP client:
· A server must be synchronized by other devices or use its local clock as a reference source before synchronizing an NTP client. Otherwise, the client will not be synchronized to the NTP server.
· If the stratum level of a server is higher than or equal to a client, the client will not synchronize to that server.
· You can configure multiple servers by repeating the ntp-service unicast-server and ntp-service ipv6 unicast-server commands.
To configure an NTP client:
|
Step |
Command |
Remarks |
|
1. Enter system view. |
system-view |
N/A |
|
·
Specify an NTP server for the device: ·
Specify an IPv6 NTP server for the device: |
By default, no NTP server is specified. |
Configuring NTP in symmetric active/passive mode
When the device operates in symmetric active/passive mode, specify on a symmetric-active peer the IP address for a symmetric-passive peer.
Follow these guidelines when you configure a symmetric-active peer:
· Execute the ntp-service enable command on a symmetric passive peer to enable NTP. Otherwise, the symmetric-passive peer will not process NTP messages from a symmetric-active peer.
· Either the symmetric-active peer, or the symmetric-passive peer, or both of them must be in synchronized state. Otherwise, their time cannot be synchronized.
· You can configure multiple symmetric-passive peers by repeating the ntp-service unicast-peer or ntp-service ipv6 unicast-peer command.
To configure a symmetric-active peer:
|
Step |
Command |
Remarks |
|
1. Enter system view. |
system-view |
N/A |
|
2. Specify a symmetric-passive peer for the device. |
·
Specify a symmetric-passive peer: ·
Specify an IPv6 symmetric-passive peer: |
By default, no symmetric-passive peer is specified. |
Configuring NTP in broadcast mode
A broadcast server must be synchronized by other devices or use its local clock as a reference source before synchronizing a broadcast client. Otherwise, the broadcast client will not be synchronized to the broadcast server.
Configure NTP in broadcast mode on both broadcast server and client.
Configuring a broadcast client
|
Step |
Command |
Remarks |
|
1. Enter system view. |
system-view |
N/A |
|
2. Enter interface view. |
interface interface-type interface-number |
Enter the interface for receiving NTP broadcast messages. |
|
3. Configure the device to operate in broadcast client mode. |
ntp-service broadcast-client |
By default, the device does not operate in any NTP association mode. After you execute the command, the device receives NTP broadcast messages from the specified interface. |
Configuring the broadcast server
|
Step |
Command |
Remarks |
|
1. Enter system view. |
system-view |
N/A |
|
2. Enter interface view. |
interface interface-type interface-number |
Enter the interface for sending NTP broadcast messages. |
|
3. Configure the device to operate in NTP broadcast server mode. |
ntp-service broadcast-server [ authentication-keyid keyid | version number ] * |
By default, the device does not operate in any NTP association mode. After you execute the command, the device sends NTP broadcast messages from the specified interface. |
Configuring NTP in multicast mode
A multicast server must be synchronized by other devices or use its local clock as a reference source before synchronizing a multicast client. Otherwise, the multicast client will not be synchronized to the multicast server.
Configure NTP in multicast mode on both a multicast server and client.
Configuring a multicast client
|
Step |
Command |
Remarks |
|
1. Enter system view. |
system-view |
N/A |
|
2. Enter interface view. |
interface interface-type interface-number |
Enter the interface for receiving NTP multicast messages. |
|
3. Configure the device to operate in multicast client mode. |
·
Configure the device to operate in multicast
client mode: ·
Configure the device to operate in IPv6 multicast
client mode: |
By default, the device does not operate in any NTP association mode. After you execute the command, the device receives NTP multicast messages from the specified interface. |
Configuring the multicast server
|
Step |
Command |
Remarks |
|
1. Enter system view. |
system-view |
N/A |
|
2. Enter interface view. |
interface interface-type interface-number |
Enter the interface for sending NTP multicast message. |
|
3. Configure the device to operate in multicast server mode. |
·
Configure the device to operate in multicast
server mode: ·
Configure the device to operate in multicast
server mode: |
By default, the device does not operate in any NTP association mode. After you execute the command, the device receives NTP multicast messages from the specified interface. |
Configuring access control rights
|
Step |
Command |
Remarks |
|
1. Enter system view. |
system-view |
N/A |
|
2. Configure the NTP service access control right for a peer device to access the local device. |
·
Configure the NTP service access
control right for a peer device to access the local device ·
Configure the IPv6 NTP service access control
right for a peer device to access the local device |
By default, the NTP service access control right for a peer device to access the local device is peer. |
Before you configure the NTP service access control right to the local device, create and configure an ACL associated with the access control right. For more information about ACL, see ACL and QoS Configuration Guide.
Configuring NTP authentication
This section provides instructions for configuring NTP authentication.
Configuring NTP authentication in client/server mode
To ensure a successful NTP authentication, configure the same key ID, authentication algorithm, and key on the server and client. Make sure the peer device is allowed to use the key ID for authentication on the local device.
To configure NTP authentication for a client:
|
Step |
Command |
Remarks |
|
1. Enter system view. |
system-view |
N/A |
|
2. Enable NTP authentication. |
ntp-service authentication enable |
By default, NTP authentication is disabled. |
|
3. Configure an NTP authentication key. |
ntp-service authentication-keyid keyid authentication-mode md5 { cipher | simple } string [ acl ipv4-acl-number | ipv6 acl ipv6-acl-number ] * |
By default, no NTP authentication key is configured. |
|
4. Configure the key as a trusted key. |
ntp-service reliable authentication-keyid keyid |
By default, no authentication key is configured as a trusted key. |
|
5. Associate the specified key with an NTP server. |
·
Associate the specified key with an NTP
server: ·
Associate the specified key with an IPv6 NTP
server: |
N/A |
To configure NTP authentication for a server:
|
Step |
Command |
Remarks |
|
1. Enter system view. |
system-view |
N/A |
|
2. Enable NTP authentication. |
ntp-service authentication enable |
By default, NTP authentication is disabled. |
|
3. Configure an NTP authentication key. |
ntp-service authentication-keyid keyid authentication-mode md5 { cipher | simple } string [ acl ipv4-acl-number | ipv6 acl ipv6-acl-number ] * |
By default, no NTP authentication key is configured. |
|
4. Configure the key as a trusted key. |
ntp-service reliable authentication-keyid keyid |
By default, no authentication key is configured as a trusted key. |
NTP authentication results differ when different configurations are performed on client and server. For more information, see Table 3. (N/A in the table means that whether the configuration is performed does not make any difference.)
Table 3 NTP authentication results
|
Client |
Server |
Authentication result |
|||
|
Enable NTP authentication |
Configure a key and configure it as a trusted key |
Associate the key with an NTP server |
Enable NTP authentication |
Configure a key and configure it as a trusted key |
|
|
Yes |
Yes |
Yes |
Yes |
Yes |
Succeeded |
|
Yes |
Yes |
Yes |
Yes |
No |
Failed |
|
Yes |
Yes |
Yes |
No |
N/A |
Failed |
|
Yes |
No |
Yes |
N/A |
N/A |
Failed |
|
Yes |
N/A |
No |
N/A |
N/A |
No authentication |
|
No |
N/A |
N/A |
N/A |
N/A |
No authentication |
Configuring NTP authentication in symmetric active/passive mode
To ensure a successful NTP authentication, configure the same key ID, authentication algorithm, and key on the active peer and passive peer. Make sure the peer device is allowed to use the key ID for authentication on the local device.
To configure NTP authentication for an active peer:
|
Step |
Command |
Remarks |
|
1. Enter system view. |
system-view |
N/A |
|
2. Enable NTP authentication. |
ntp-service authentication enable |
By default, NTP authentication is disabled. |
|
3. Configure an NTP authentication key. |
ntp-service authentication-keyid keyid authentication-mode md5 { cipher | simple } string [ acl ipv4-acl-number | ipv6 acl ipv6-acl-number ] * |
By default, no NTP authentication key is configured. |
|
4. Configure the key as a trusted key. |
ntp-service reliable authentication-keyid keyid |
By default, no authentication key is configured as a trusted key. |
|
5. Associate the specified key with a passive peer. |
·
Associate the specified key with a
passive peer: ·
Associate the specified key with a passive
peer: |
N/A |
To configure NTP authentication for a passive peer:
|
Step |
Command |
Remarks |
|
1. Enter system view. |
system-view |
N/A |
|
2. Enable NTP authentication. |
ntp-service authentication enable |
By default, NTP authentication is disabled. |
|
3. Configure an NTP authentication key. |
ntp-service authentication-keyid keyid authentication-mode md5 { cipher | simple } string [ acl ipv4-acl-number | ipv6 acl ipv6-acl-number ] * |
By default, no NTP authentication key is configured. |
|
4. Configure the key as a trusted key. |
ntp-service reliable authentication-keyid keyid |
By default, no authentication key is configured as a trusted key. |
NTP authentication results differ when different configurations are performed on active peer and passive peer. For more information, see Table 4. (N/A in the table means that whether the configuration is performed does not make any difference.)
Table 4 NTP authentication results
|
Active peer |
Passive peer |
Authentication result |
|||||||||||
|
Enable NTP authentication |
Configure a key and configure it as a trusted key |
Associate the key with a passive peer |
Enable NTP authentication |
Configure a key and configure it as a trusted key |
|||||||||
|
Stratum level of the active and passive peers is not considered. |
|||||||||||||
|
Yes |
Yes |
Yes |
Yes |
Yes |
Succeeded |
||||||||
|
Yes |
Yes |
Yes |
Yes |
No |
Failed |
||||||||
|
Yes |
Yes |
Yes |
No |
N/A |
Failed |
||||||||
|
Yes |
N/A |
No |
Yes |
N/A |
Failed |
||||||||
|
Yes |
N/A |
No |
No |
N/A |
No authentication |
||||||||
|
No |
N/A |
N/A |
Yes |
N/A |
Failed |
||||||||
|
No |
N/A |
N/A |
No |
N/A |
No authentication |
||||||||
|
The active peer has a higher stratum than the passive peer. |
|||||||||||||
|
Yes |
No |
Yes |
N/A |
N/A |
Failed |
||||||||
|
The passive peer has a higher stratum than the active peer. |
|||||||||||||
|
Yes |
No |
Yes |
Yes |
N/A |
Failed |
||||||||
|
Yes |
No |
Yes |
No |
N/A |
No authentication |
||||||||
Configuring NTP authentication in broadcast mode
To ensure a successful NTP authentication, configure the same key ID, authentication algorithm, and key on the broadcast server and client. Make sure the peer device is allowed to use the key ID for authentication on the local device.
To configure NTP authentication for a broadcast client:
|
Step |
Command |
Remarks |
|
1. Enter system view. |
system-view |
N/A |
|
2. Enable NTP authentication. |
ntp-service authentication enable |
By default, NTP authentication is disabled. |
|
3. Configure an NTP authentication key. |
ntp-service authentication-keyid keyid authentication-mode md5 { cipher | simple } string [ acl ipv4-acl-number | ipv6 acl ipv6-acl-number ] * |
By default, no NTP authentication key is configured. |
|
4. Configure the key as a trusted key. |
ntp-service reliable authentication-keyid keyid |
By default, no authentication key is configured as a trusted key. |
To configure NTP authentication for a broadcast server:
|
Step |
Command |
Remarks |
|
1. Enter system view. |
system-view |
N/A |
|
2. Enable NTP authentication. |
ntp-service authentication enable |
By default, NTP authentication is disabled. |
|
3. Configure an NTP authentication key. |
ntp-service authentication-keyid keyid authentication-mode md5 { cipher | simple } string [ acl ipv4-acl-number | ipv6 acl ipv6-acl-number ] * |
By default, no NTP authentication key is configured. |
|
4. Configure the key as a trusted key. |
ntp-service reliable authentication-keyid keyid |
By default, no authentication key is configured as a trusted key. |
|
5. Enter interface view. |
interface interface-type interface-number |
N/A |
|
6. Associate the specified key with the broadcast server. |
ntp-service broadcast-server authentication-keyid keyid |
By default, the broadcast server is not associated with any key. |
NTP authentication results differ when different configurations are performed on broadcast client and server. For more information, see Table 5. (N/A in the table means that whether the configuration is performed does not make any difference.)
Table 5 NTP authentication results
|
Broadcast server |
Broadcast client |
Authentication result |
|||
|
Enable NTP authentication |
Configure a key and configure it as a trusted key |
Associate the key with a broadcast server |
Enable NTP authentication |
Configure a key and configure it as a trusted key |
|
|
Yes |
Yes |
Yes |
Yes |
Yes |
Succeeded |
|
Yes |
Yes |
Yes |
Yes |
No |
Failed |
|
Yes |
Yes |
Yes |
No |
N/A |
Failed |
|
Yes |
No |
Yes |
Yes |
N/A |
Failed |
|
Yes |
No |
Yes |
No |
N/A |
No authentication |
|
Yes |
N/A |
No |
Yes |
N/A |
Failed |
|
Yes |
N/A |
No |
No |
N/A |
No authentication |
|
No |
N/A |
N/A |
Yes |
N/A |
Failed |
|
No |
N/A |
N/A |
No |
N/A |
No authentication |
Configuring NTP authentication in multicast mode
To ensure a successful NTP authentication, configure the same key ID, authentication algorithm, and key on the multicast server and client. Make sure the peer device is allowed to use the key ID for authentication on the local device.
To configure NTP authentication for a multicast client:
|
Step |
Command |
Remarks |
|
1. Enter system view. |
system-view |
N/A |
|
2. Enable NTP authentication. |
ntp-service authentication enable |
By default, NTP authentication is disabled. |
|
3. Configure an NTP authentication key. |
ntp-service authentication-keyid keyid authentication-mode md5 { cipher | simple } string [ acl ipv4-acl-number | ipv6 acl ipv6-acl-number ] * |
By default, no NTP authentication key is configured. |
|
4. Configure the key as a trusted key. |
ntp-service reliable authentication-keyid keyid |
By default, no authentication key is configured as a trusted key. |
To configure NTP authentication for a multicast server:
|
Step |
Command |
Remarks |
|
1. Enter system view. |
system-view |
N/A |
|
2. Enable NTP authentication. |
ntp-service authentication enable |
By default, NTP authentication is disabled. |
|
3. Configure an NTP authentication key. |
ntp-service authentication-keyid keyid authentication-mode md5 { cipher | simple } string [ acl ipv4-acl-number | ipv6 acl ipv6-acl-number ] * |
By default, no NTP authentication key is configured. |
|
4. Configure the key as a trusted key. |
ntp-service reliable authentication-keyid keyid |
By default, no authentication key is configured as a trusted key. |
|
5. Enter interface view. |
interface interface-type interface-number |
N/A |
|
6. Associate the specified key with the multicast server. |
·
Associate the specified key with a
multicast server: ·
Associate the specified key with an
IPv6 multicast server: |
By default, no multicast server is associated with the specified key. |
NTP authentication results differ when different configurations are performed on broadcast client and server. For more information, see Table 6. (N/A in the table means that whether the configuration is performed does not make any difference.)
Table 6 NTP authentication results
|
Multicast server |
Multicast client |
Authentication result |
|||
|
Enable NTP authentication |
Configure a key and configure it as a trusted key |
Associate the key with a multicast server |
Enable NTP authentication |
Configure a key and configure it as a trusted key |
|
|
Yes |
Yes |
Yes |
Yes |
Yes |
Succeeded |
|
Yes |
Yes |
Yes |
Yes |
No |
Failed |
|
Yes |
Yes |
Yes |
No |
N/A |
Failed |
|
Yes |
No |
Yes |
Yes |
N/A |
Failed |
|
Yes |
No |
Yes |
No |
N/A |
No authentication |
|
Yes |
N/A |
No |
Yes |
N/A |
Failed |
|
Yes |
N/A |
No |
No |
N/A |
No authentication |
|
No |
N/A |
N/A |
Yes |
N/A |
Failed |
|
No |
N/A |
N/A |
No |
N/A |
No authentication |
Configuring NTP optional parameters
The configuration tasks in this section are optional tasks. Configure them to improve NTP security, performance, or reliability.
Specifying the source interface for NTP messages
To prevent interface status changes from causing NTP communication failures, configure the device to use the IP address of an interface that is always up. For example, you can configure the device to use a loopback interface as the source IP address for the NTP messages to be sent.
When the device responds to an NTP request, the source IP address of the NTP response is always the IP address of the interface that has received the NTP request.
Follow these guidelines when you specify the source interface for NTP messages:
· If you have specified the source interface for NTP messages in the ntp-service [ ipv6 ] unicast-server or ntp-service [ ipv6 ] unicast-peer command, the interface specified in the ntp-service [ ipv6 ] unicast-server or ntp-service [ ipv6 ] unicast-peer command works as the source interface for NTP messages.
· If you have configured the ntp-service broadcast-server or ntp-service [ ipv6 ] multicast-server command, the source interface for the broadcast or multicast NTP messages is the interface configured with the respective command.
To specify the source interface for NTP messages:
|
Step |
Command |
Remarks |
|
1. Enter system view. |
system-view |
N/A |
|
2. Specify the source interface for NTP messages. |
·
Specify the source interface for NTP
messages: ·
Specify the source interface for IPv6 NTP
messages: |
By default, no source interface is specified for NTP messages. |
Disabling an interface from receiving NTP messages
When NTP is enabled, all interfaces by default can receive NTP messages. For security purposes, you can disable some of the interfaces from receiving NTP messages.
To disable an interface from receiving NTP messages:
|
Step |
Command |
Remarks |
|
1. Enter system view. |
system-view |
N/A |
|
2. Enter interface view. |
interface interface-type interface-number |
N/A |
|
3. Disable the interface from receiving NTP messages. |
·
For IPv4: ·
For IPv6: |
By default, an interface receives NTP messages. |
Configuring the maximum number of dynamic associations
NTP has the following types of associations:
· Static association—A manually created association.
· Dynamic association—Temporary association created by the system during NTP operation. A dynamic association is removed if no messages are exchanged within about 12 minutes.
The following describes how an association is established in different association modes:
· Client/server mode—After you specify an NTP server, the system creates a static association on the client. The server simply responds passively upon the receipt of a message, rather than creating an association (static or dynamic).
· Symmetric active/passive mode—After you specify a symmetric-passive peer on a symmetric active peer, static associations are created on the symmetric-active peer, and dynamic associations are created on the symmetric-passive peer.
· Broadcast or multicast mode—Static associations are created on the server, and dynamic associations are created on the client.
A single device can have a maximum of 128 concurrent associations, including static associations and dynamic associations.
Perform this task to restrict the number of dynamic associations to prevent dynamic associations from occupying too many system resources.
To configure the maximum number of dynamic associations:
|
Step |
Command |
Remarks |
|
1. Enter system view. |
system-view |
N/A |
|
2. Configure the maximum number of dynamic sessions allowed to be established. |
ntp-service max-dynamic-sessions number |
By default, the command can establish up to 100 dynamic sessions. |
Setting a DSCP value for NTP packets
The DSCP value determines the sending precedence of a packet.
To set a DSCP value for NTP packets:
|
Step |
Command |
Remarks |
|
1. Enter system view. |
system-view |
N/A |
|
2. Set a DSCP value for NTP packets. |
·
IPv4 packets: ·
IPv6 packets: |
The default DSCP value is 48 for IPv4 packets and 56 for IPv6 packets. |
Configuring the local clock as a reference source
Follow these guidelines when you configure the local clock as a reference source:
· Make sure the local clock can provide the time accuracy required for the network. After you configure the local clock as a reference source, the local clock is synchronized, and can operate as a time server to synchronize other devices in the network. If the local clock is incorrect, timing errors occur.
· Before you configure this feature, adjust the local system time to make sure it is accurate.
· If the factory-default system time of the device always restores at a reboot, do not configure the local clock as a reference source or configure the device as a time server.
To configure the local clock as a reference source:
|
Step |
Command |
Remarks |
|
1. Enter system view. |
system-view |
N/A |
|
2. Configure the local clock as a reference source. |
ntp-service refclock-master [ ip-address ] [ stratum ] |
By default, the device does not use the local clock as a reference source. |
Displaying and maintaining NTP
Execute display commands in any view.
|
Task |
Command |
|
Display information about IPv6 NTP associations. |
display ntp-service ipv6 sessions [ verbose ] |
|
Display information about IPv4 NTP associations. |
display ntp-service sessions [ verbose ] |
|
Display information about NTP service status. |
display ntp-service status |
|
Display brief information about the NTP servers from the local device back to the primary reference source. |
display ntp-service trace [ source interface-type interface-number ] |
NTP configuration examples
NTP client/server mode configuration example
Network requirements
As shown in Figure 26:
· Configure the local clock of Device A as a reference source, with stratum level 2.
· Configure Device B to operate in client mode and Device A to be used as the NTP server for Device B.
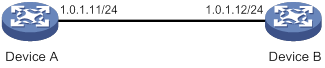
Configuration procedure
1. Assign an IP address to each interface, and make sure Device A and Device B can reach each other, as shown in Figure 26. (Details not shown.)
2. Configure Device A:
# Enable the NTP service.
<DeviceA> system-view
[DeviceA] ntp-service enable
# Specify the local clock as the reference source, with stratum level 2.
[DeviceA] ntp-service refclock-master 2
3. Configure Device B:
# Enable the NTP service.
<DeviceB> system-view
[DeviceB] ntp-service enable
# Specify the time protocol as NTP.
[DeviceB] clock protocol ntp
# Specify Device A as the NTP server of Device B so that Device B is synchronized to Device A.
[DeviceB] ntp-service unicast-server 1.0.1.11
4. Verify the configuration:
# Verify that Device B has synchronized to Device A, and the clock stratum level is 3 on Device B and 2 on Device A.
[DeviceB] display ntp-service status
Clock status: synchronized
Clock stratum: 3
System peer: 1.0.1.11
Local mode: client
Reference clock ID: 1.0.1.11
Leap indicator: 00
Clock jitter: 0.000977 s
Stability: 0.000 pps
Clock precision: 2^-10
Root delay: 0.00383 ms
Root dispersion: 16.26572 ms
Reference time: d0c6033f.b9923965 Wed, Dec 29 2010 18:58:07.724
# Verify that an IPv4 NTP association has been established between Device B and Device A.
[DeviceB] display ntp-service sessions
source reference stra reach poll now offset delay disper
********************************************************************************
[12345]1.0.1.11 127.127.1.0 2 1 64 15 -4.0 0.0038 16.262
Notes: 1 source(master), 2 source(peer), 3 selected, 4 candidate, 5 configured.
Total sessions: 1
IPv6 NTP client/server mode configuration example
Network requirements
As shown in Figure 27:
· Configure the local clock of Device A as a reference source, with stratum level 2.
· Configure Device B to operate in client mode and Device A to be used as the IPv6 NTP server for Device B.
Configuration procedure
1. Assign an IP address to each interface, and make sure Device A and Device B can reach each other, as shown in Figure 27. (Details not shown.)
2. Configure Device A:
# Enable the NTP service.
<DeviceA> system-view
[DeviceA] ntp-service enable
# Specify the local clock as the reference source, with stratum level 2.
[DeviceA] ntp-service refclock-master 2
3. Configure Device B:
# Enable the NTP service.
<DeviceB> system-view
[DeviceB] ntp-service enable
# Specify the time protocol as NTP.
[DeviceB] clock protocol ntp
# Specify Device A as the IPv6 NTP server of Device B so that Device B is synchronized to Device A.
[DeviceB] ntp-service ipv6 unicast-server 3000::34
4. Verify the configuration:
# Verify that Device B has synchronized to Device A, and the clock stratum level is 3 on Device B and 2 on Device A.
[DeviceB] display ntp-service status
Clock status: synchronized
Clock stratum: 3
System peer: 3000::34
Local mode: client
Reference clock ID: 163.29.247.19
Leap indicator: 00
Clock jitter: 0.000977 s
Stability: 0.000 pps
Clock precision: 2^-10
Root delay: 0.02649 ms
Root dispersion: 12.24641 ms
Reference time: d0c60419.9952fb3e Wed, Dec 29 2010 19:01:45.598
# Verify that an IPv6 NTP association has been established between Device B and Device A.
[DeviceB] display ntp-service ipv6 sessions
Notes: 1 source(master), 2 source(peer), 3 selected, 4 candidate, 5 configured.
Source: [12345]3000::34
Reference: 127.127.1.0 Clock stratum: 2
Reachabilities: 15 Poll interval: 64
Last receive time: 19 Offset: 0.0
Roundtrip delay: 0.0 Dispersion: 0.0
Total sessions: 1
NTP symmetric active/passive mode configuration example
Network requirements
As shown in Figure 28:
· Configure the local clock of Device A as a reference source, with stratum level 2.
· Configure Device A to operate in symmetric-active mode and specify Device B as the passive peer of Device A.
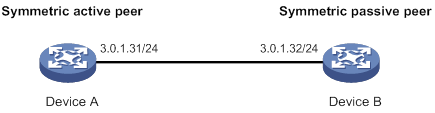
Configuration procedure
1. Assign an IP address to each interface, and make sure Device A and Device B can reach each other, as shown in Figure 28. (Details not shown.)
2. Configure Device B:
# Enable the NTP service.
<DeviceB> system-view
[DeviceB] ntp-service enable
# Specify the time protocol as NTP.
[DeviceB] clock protocol ntp
3. Configure Device A:
# Enable the NTP service.
<DeviceA> system-view
[DeviceA] ntp-service enable
# Specify the time protocol as NTP.
[DeviceA] clock protocol ntp
# Specify the local clock as the reference source, with stratum level 2.
[DeviceA] ntp-service refclock-master 2
# Configure Device B as a symmetric passive peer.
[DeviceA] ntp-service unicast-peer 3.0.1.32
4. Verify the configuration:
# Verify that Device B has synchronized to Device A.
[DeviceB] display ntp-service status
Clock status: synchronized
Clock stratum: 3
System peer: 3.0.1.31
Local mode: sym_passive
Reference clock ID: 3.0.1.31
Leap indicator: 00
Clock jitter: 0.000916 s
Stability: 0.000 pps
Clock precision: 2^-17
Root delay: 0.00609 ms
Root dispersion: 1.95859 ms
Reference time: 83aec681.deb6d3e5 Wed, Jan 8 2014 14:33:11.081
# Verify that an IPv4 NTP association has been established between Device B and Device A.
[DeviceB] display ntp-service sessions
source reference stra reach poll now offset delay disper
********************************************************************************
[12]3.0.1.31 127.127.1.0 2 62 64 34 0.4251 6.0882 1392.1
Notes: 1 source(master), 2 source(peer), 3 selected, 4 candidate, 5 configured.
Total sessions: 1
IPv6 NTP symmetric active/passive mode configuration example
Network requirements
As shown in Figure 29:
· Configure the local clock of Device A as a reference source, with stratum level 2.
· Configure Device A to operate in symmetric-active mode and specify Device B as the IPv6 passive peer of Device A.
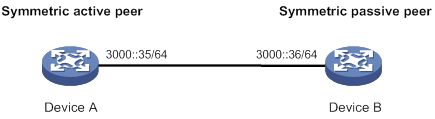
Configuration procedure
1. Assign an IP address to each interface, and make sure Device A and Device B can reach each other, as shown in Figure 29. (Details not shown.)
2. Configure Device B:
# Enable the NTP service.
<DeviceB> system-view
[DeviceB] ntp-service enable
# Specify the time protocol as NTP.
[DeviceB] clock protocol ntp
3. Configure Device A:
# Enable the NTP service.
<DeviceA> system-view
[DeviceA] ntp-service enable
# Specify the time protocol as NTP.
[DeviceA] clock protocol ntp
# Specify the local clock as the reference source, with stratum level 2.
[DeviceA] ntp-service refclock-master 2
# Configure Device B as an IPv6 symmetric passive peer.
[DeviceA] ntp-service ipv6 unicast-peer 3000::36
4. Verify the configuration:
# Verify that Device B has synchronized to Device A.
[DeviceB] display ntp-service status
Clock status: synchronized
Clock stratum: 3
System peer: 3000::35
Local mode: sym_passive
Reference clock ID: 251.73.79.32
Leap indicator: 11
Clock jitter: 0.000977 s
Stability: 0.000 pps
Clock precision: 2^-10
Root delay: 0.01855 ms
Root dispersion: 9.23483 ms
Reference time: d0c6047c.97199f9f Wed, Dec 29 2010 19:03:24.590
# Verify that an IPv6 NTP association has been established between Device B and Device A.
[DeviceB] display ntp-service ipv6 sessions
Notes: 1 source(master), 2 source(peer), 3 selected, 4 candidate, 5 configured.
Source: [1234]3000::35
Reference: 127.127.1.0 Clock stratum: 2
Reachabilities: 15 Poll interval: 64
Last receive time: 19 Offset: 0.0
Roundtrip delay: 0.0 Dispersion: 0.0
Total sessions: 1
NTP broadcast mode configuration example
Network requirements
As shown in Figure 30, Router C functions as the NTP server for multiple devices on a network segment and synchronizes the time among multiple devices.
· Configure Router C's local clock as a reference source, with stratum level 2.
· Configure Router C to operate in broadcast server mode and send broadcast messages from GigabitEthernet 1/0/1.
· Configure Router B and Router A to operate in broadcast client mode and receive broadcast messages through their respective GigabitEthernet 1/0/1.
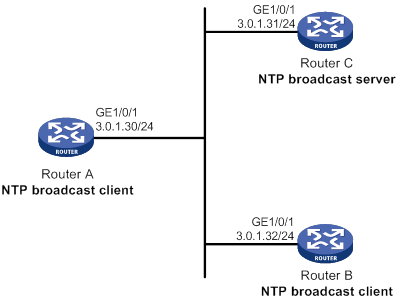
Configuration procedure
1. Assign an IP address to each interface, and make sure Router A, Router B, and Router C can reach each other, as shown in Figure 30. (Details not shown.)
2. Configure Router C:
# Enable the NTP service.
<RouterC> system-view
[RouterC] ntp-service enable
# Specify the time protocol as NTP.
[RouterC] clock protocol ntp
# Specify the local clock as the reference source, with stratum level 2.
[RouterC] ntp-service refclock-master 2
# Configure Router C to operate in broadcast server mode and send broadcast messages through GigabitEthernet 1/0/1.
[RouterC] interface gigabitethernet 1/0/1
[RouterC-GigabitEthernet1/0/1] ntp-service broadcast-server
3. Configure Router A:
# Enable the NTP service.
<RouterA> system-view
[RouterA] ntp-service enable
# Specify the time protocol as NTP.
[RouterA] clock protocol ntp
# Configure Router A to operate in broadcast client mode and receive broadcast messages on GigabitEthernet 1/0/1.
[RouterA] interface gigabitethernet 1/0/1
[RouterA-GigabitEthernet1/0/1] ntp-service broadcast-client
4. Configure Router B:
# Enable the NTP service.
<RouterB> system-view
[RouterB] ntp-service enable
# Specify the time protocol as NTP.
[RouterB] clock protocol ntp
# Configure Router B to operate in broadcast client mode and receive broadcast messages on GigabitEthernet 1/0/1.
[RouterB] interface gigabitethernet 1/0/1
[RouterB-GigabitEthernet1/0/1] ntp-service broadcast-client
5. Verify the configuration:
# Verify that Router A has synchronized to Router C, and the clock stratum level is 3 on Router A and 2 on Router C.
[RouterA-GigabitEthernet1/0/1] display ntp-service status
Clock status: synchronized
Clock stratum: 3
System peer: 3.0.1.31
Local mode: bclient
Reference clock ID: 3.0.1.31
Leap indicator: 00
Clock jitter: 0.044281 s
Stability: 0.000 pps
Clock precision: 2^-10
Root delay: 0.00229 ms
Root dispersion: 4.12572 ms
Reference time: d0d289fe.ec43c720 Sat, Jan 8 2011 7:00:14.922
# Verify that an IPv4 NTP association has been established between Router A and Router C.
[RouterA-GigabitEthernet1/0/1] display ntp-service sessions
source reference stra reach poll now offset delay disper
********************************************************************************
[1245]3.0.1.31 127.127.1.0 2 1 64 519 -0.0 0.0022 4.1257
Notes: 1 source(master),2 source(peer),3 selected,4 candidate,5 configured.
Total sessions: 1
NTP multicast mode configuration example
Network requirements
As shown in Figure 31, Router C functions as the NTP server for multiple devices on different network segments and synchronizes the time among multiple devices.
· Configure Router C's local clock as a reference source, with stratum level 2.
· Configure Router C to operate in multicast server mode and send multicast messages from GigabitEthernet 1/0/1.
· Configure Router D and Router A to operate in multicast client mode and receive multicast messages through their respective GigabitEthernet 1/0/1.
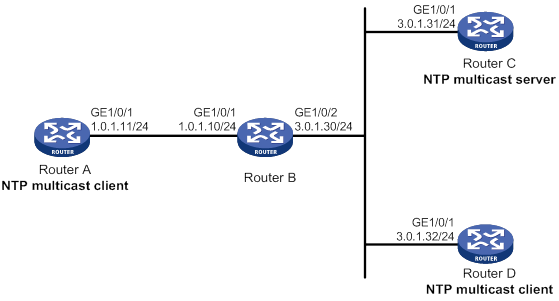
Configuration procedure
1. Assign an IP address to each interface, and make sure the routers can reach each other, as shown in Figure 31. (Details not shown.)
2. Configure Router C:
# Enable the NTP service.
<RouterC> system-view
[RouterC] ntp-service enable
# Specify the time protocol as NTP.
[RouterC] clock protocol ntp
# Specify the local clock as the reference source, with stratum level 2.
[RouterC] ntp-service refclock-master 2
# Configure Router C to operate in multicast server mode and send multicast messages through GigabitEthernet 1/0/1.
[RouterC] interface gigabitethernet 1/0/1
[RouterC-GigabitEthernet1/0/1] ntp-service multicast-server
3. Configure Router D:
# Enable the NTP service.
<RouterD> system-view
[RouterD] ntp-service enable
# Specify the time protocol as NTP.
[RouterD] clock protocol ntp
# Configure Router D to operate in multicast client mode and receive multicast messages on GigabitEthernet 1/0/1.
[RouterD] interface gigabitethernet 1/0/1
[RouterD-GigabitEthernet1/0/1] ntp-service multicast-client
4. Verify the configuration:
Router D and Router C are on the same subnet, so Router D can do the following:
? Receive multicast messages from Router C without being enabled with the multicast function.
? Synchronize to Router C.
# Verify that Router D has synchronized to Router C, and the clock stratum level is 3 on Router D and 2 on Router C.
[RouterD-GigabitEthernet1/0/1] display ntp-service status
Clock status: synchronized
Clock stratum: 3
System peer: 3.0.1.31
Local mode: bclient
Reference clock ID: 3.0.1.31
Leap indicator: 00
Clock jitter: 0.044281 s
Stability: 0.000 pps
Clock precision: 2^-10
Root delay: 0.00229 ms
Root dispersion: 4.12572 ms
Reference time: d0d289fe.ec43c720 Sat, Jan 8 2011 7:00:14.922
# Verify that an IPv4 NTP association has been established between Router D and Router C.
[RouterD-GigabitEthernet1/0/1] display ntp-service sessions
source reference stra reach poll now offset delay disper
********************************************************************************
[1245]3.0.1.31 127.127.1.0 2 1 64 519 -0.0 0.0022 4.1257
Notes: 1 source(master),2 source(peer),3 selected,4 candidate,5 configured.
Total sessions: 1
5. Configure Router B:
Because Router A and Router C are on different subnets, you must enable the multicast functions on Router B before Router A can receive multicast messages from Router C.
# Enable the IP multicast function.
<RouterB> system-view
[RouterB] multicast routing
[RouterB-mrib] quit
[RouterB] interface gigabitethernet 1/0/1
[RouterB-GigabitEthernet1/0/1] igmp enable
[RouterB-GigabitEthernet1/0/1] igmp static-group 224.0.1.1
[RouterB-GigabitEthernet1/0/1] quit
[RouterB] interface gigabitethernet 1/0/2
[RouterB-GigabitEthernet1/0/2] pim dm
6. Configure Router A:
# Enable the NTP service.
<RouterA> system-view
[RouterA] ntp-service enable
# Specify the time protocol as NTP.
[RouterA] clock protocol ntp
# Configure Router A to operate in multicast client mode and receive multicast messages from GigabitEthernet 1/0/1.
[RouterA] interface gigabitethernet 1/0/1
[RouterA-GigabitEthernet1/0/1] ntp-service multicast-client
7. Verify the configuration:
# Verify that Router A has synchronized to Router C, and the clock stratum level is 3 on Router A and 2 on Router C.
[RouterA-GigabitEthernet1/0/1] display ntp-service status
Clock status: synchronized
Clock stratum: 3
System peer: 3.0.1.31
Local mode: bclient
Reference clock ID: 3.0.1.31
Leap indicator: 00
Clock jitter: 0.165741 s
Stability: 0.000 pps
Clock precision: 2^-10
Root delay: 0.00534 ms
Root dispersion: 4.51282 ms
Reference time: d0c61289.10b1193f Wed, Dec 29 2010 20:03:21.065
# Verify that an IPv4 NTP association has been established between Router A and Router C.
[RouterA-GigabitEthernet1/0/1] display ntp-service sessions
source reference stra reach poll now offset delay disper
********************************************************************************
[1234]3.0.1.31 127.127.1.0 2 247 64 381 -0.0 0.0053 4.5128
Notes: 1 source(master),2 source(peer),3 selected,4 candidate,5 configured.
Total sessions: 1
IPv6 NTP multicast mode configuration example
Network requirements
As shown in Figure 32, Router C functions as the NTP server for multiple devices on different network segments and synchronizes the time among multiple devices.
· Configure Router C's local clock as a reference source, with stratum level 2.
· Configure Router C to operate in IPv6 multicast server mode and send IPv6 NTP multicast messages from GigabitEthernet 1/0/1.
· Configure Router D and Router A to operate in multicast client mode and receive IPv6 multicast messages through their respective GigabitEthernet 1/0/1.
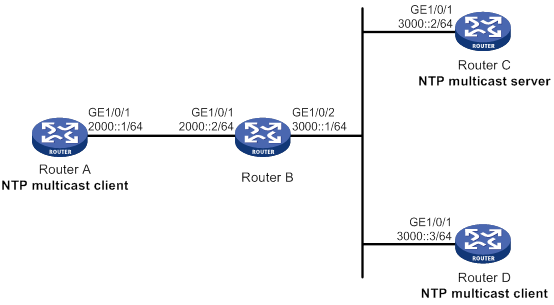
Configuration procedure
1. Assign an IP address to each interface, and make sure the routers can reach each other, as shown in Figure 32. (Details not shown.)
2. Configure Router C:
# Enable the NTP service.
<RouterC> system-view
[RouterC] ntp-service enable
# Specify the time protocol as NTP.
[RouterC] clock protocol ntp
# Specify the local clock as the reference source, with stratum level 2.
[RouterC] ntp-service refclock-master 2
# Configure Router C to operate in IPv6 multicast server mode and send multicast messages through GigabitEthernet 1/0/1.
[RouterC] interface gigabitethernet 1/0/1
[RouterC-GigabitEthernet1/0/1] ntp-service ipv6 multicast-server ff24::1
3. Configure Router D:
# Enable the NTP service.
<RouterD> system-view
[RouterD] ntp-service enable
# Specify the time protocol as NTP.
[RouterD] clock protocol ntp
# Configure Router D to operate in IPv6 multicast client mode and receive multicast messages on GigabitEthernet 1/0/1.
[RouterD] interface gigabitethernet 1/0/1
[RouterD-GigabitEthernet1/0/1] ntp-service ipv6 multicast-client ff24::1
4. Verify the configuration:
Router D and Router C are on the same subnet, so Router D can do the following:
? Receive the IPv6 multicast messages from Router C without being enabled with the IPv6 multicast functions.
? Synchronize to Router C.
# Verify that Router D has synchronized to Router C, and the clock stratum level is 3 on Router D and 2 on Router C.
[RouterD-GigabitEthernet1/0/1] display ntp-service status
Clock status: synchronized
Clock stratum: 3
System peer: 3000::2
Local mode: bclient
Reference clock ID: 165.84.121.65
Leap indicator: 00
Clock jitter: 0.000977 s
Stability: 0.000 pps
Clock precision: 2^-10
Root delay: 0.00000 ms
Root dispersion: 8.00578 ms
Reference time: d0c60680.9754fb17 Wed, Dec 29 2010 19:12:00.591
# Verify that an IPv6 NTP association has been established between Router D and Router C.
[RouterD-GigabitEthernet1/0/1] display ntp-service ipv6 sessions
Notes: 1 source(master), 2 source(peer), 3 selected, 4 candidate, 5 configured.
Source: [1234]3000::2
Reference: 127.127.1.0 Clock stratum: 2
Reachabilities: 111 Poll interval: 64
Last receive time: 23 Offset: -0.0
Roundtrip delay: 0.0 Dispersion: 0.0
Total sessions: 1
5. Configure Router B:
Because Router A and Router C are on different subnets, you must enable the multicast functions on Router B before Router A can receive IPv6 multicast messages from Router C.
# Enable the IPv6 multicast function.
<RouterB> system-view
[RouterB] ipv6 multicast routing
[RouterB-mrib6] quit
[RouterB] interface gigabitethernet 1/0/1
[RouterB-GigabitEthernet1/0/1] mld enable
[RouterB-GigabitEthernet1/0/1] mld static-group ff24::1
[RouterB-GigabitEthernet1/0/1] quit
[RouterB] interface gigabitethernet 1/0/2
[RouterB-GigabitEthernet1/0/2] ipv6 pim dm
6. Configure Router A:
# Enable the NTP service.
<RouterA> system-view
[RouterA] ntp-service enable
# Specify the time protocol as NTP.
[RouterA] clock protocol ntp
# Configure Router A to operate in IPv6 multicast client mode and receive multicast messages from GigabitEthernet 1/0/1.
[RouterA] interface gigabitethernet 1/0/1
[RouterA-GigabitEthernet1/0/1] ntp-service ipv6 multicast-client ff24::1
7. Verify the configuration:
# Verify that Router A has synchronized to Router C, and the clock stratum level is 3 on Router A and 2 on Router C.
[RouterA-GigabitEthernet1/0/1] display ntp status
Clock status: synchronized
Clock stratum: 3
System peer: 3000::2
Local mode: bclient
Reference clock ID: 165.84.121.65
Leap indicator: 00
Clock jitter: 0.165741 s
Stability: 0.000 pps
Clock precision: 2^-10
Root delay: 0.00534 ms
Root dispersion: 4.51282 ms
Reference time: d0c61289.10b1193f Wed, Dec 29 2010 20:03:21.065
# Verify that an IPv6 NTP association has been established between Router A and Router C.
[RouterA-GigabitEthernet1/0/1] display ntp-service ipv6 sessions
Notes: 1 source(master), 2 source(peer), 3 selected, 4 candidate, 5 configured.
Source: [124]3000::2
Reference: 127.127.1.0 Clock stratum: 2
Reachabilities: 2 Poll interval: 64
Last receive time: 71 Offset: -0.0
Roundtrip delay: 0.0 Dispersion: 0.0
Total sessions: 1
Configuration example for NTP client/server mode with authentication
Network requirements
As shown in Figure 33:
· Configure the local clock of Device A as a reference source, with stratum level 2.
· Configure Device B to operate in client mode and specify Device A as the NTP server of Device B.
· Configure NTP authentication on both Device A and Device B.
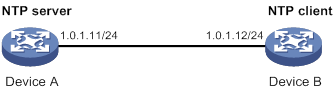
Configuration procedure
1. Assign an IP address to each interface, and make sure Device A and Device B can reach each other, as shown in Figure 33. (Details not shown.)
2. Configure Device A:
# Enable the NTP service.
<DeviceA> system-view
[DeviceA] ntp-service enable
# Specify the local clock as the reference source, with stratum level 2.
[DeviceA] ntp-service refclock-master 2
3. Configure Device B:
# Enable the NTP service.
<DeviceB> system-view
[DeviceB] ntp-service enable
# Specify the time protocol as NTP.
[DeviceB] clock protocol ntp
# Enable NTP authentication on Device B.
[DeviceB] ntp-service authentication enable
# Set an authentication key, and input the key in plain text.
[DeviceB] ntp-service authentication-keyid 42 authentication-mode md5 simple aNiceKey
# Specify the key as a trusted key.
[DeviceB] ntp-service reliable authentication-keyid 42
# Specify Device A as the NTP server of Device B, and associate the server with key 42.
[DeviceB] ntp-service unicast-server 1.0.1.11 authentication-keyid 42
Before Device B can synchronize its clock to that of Device A, enable NTP authentication for Device A.
4. Configure NTP authentication on Device A:
# Enable NTP authentication.
[DeviceA] ntp-service authentication enable
# Set an authentication key, and input the key in plain text.
[DeviceA] ntp-service authentication-keyid 42 authentication-mode md5 simple aNiceKey
# Specify the key as a trusted key.
[DeviceA] ntp-service reliable authentication-keyid 42
5. Verify the configuration:
# Verify that Device B has synchronized to Device A, and the clock stratum level is 3 on Device B and 2 on Device A.
[DeviceB] display ntp-service status
Clock status: synchronized
Clock stratum: 3
System peer: 1.0.1.11
Local mode: client
Reference clock ID: 1.0.1.11
Leap indicator: 00
Clock jitter: 0.005096 s
Stability: 0.000 pps
Clock precision: 2^-10
Root delay: 0.00655 ms
Root dispersion: 1.15869 ms
Reference time: d0c62687.ab1bba7d Wed, Dec 29 2010 21:28:39.668
# Verify that an IPv4 NTP association has been established between Device B and Device A.
[DeviceB] display ntp-service sessions
source reference stra reach poll now offset delay disper
********************************************************************************
[1245]1.0.1.11 127.127.1.0 2 1 64 519 -0.0 0.0065 0.0
Notes: 1 source(master),2 source(peer),3 selected,4 candidate,5 configured.
Total sessions: 1
Configuration example for NTP broadcast mode with authentication
Network requirements
As shown in Figure 34, Router C functions as the NTP server for multiple devices on different network segments and synchronizes the time among multiple devices. Router A and Router B authenticate the reference source.
· Configure Router C's local clock as a reference source, with stratum level 3.
· Configure Router C to operate in broadcast server mode and send broadcast messages from GigabitEthernet 1/0/1.
· Configure Router A and Router B to operate in broadcast client mode and receive broadcast client through GigabitEthernet 1/0/1.
· Configure NTP authentication on Router A, Router B, and Router C.
Configuration procedure
1. Assign an IP address to each interface, and make sure Router A, Router B, and Router C can reach each other, as shown in Figure 34. (Details not shown.)
2. Configure Router A:
# Enable the NTP service.
<RouterA> system-view
[RouterA] ntp-service enable
# Specify the time protocol as NTP.
[RouterA] clock protocol ntp
# Enable NTP authentication on Router A. Configure an NTP authentication key, with the key ID of 88 and key value of 123456. Input the key in plain text, and specify it as a trusted key.
[RouterA] ntp-service authentication enable
[RouterA] ntp-service authentication-keyid 88 authentication-mode md5 simple 123456
[RouterA] ntp-service reliable authentication-keyid 88
# Configure Router A to operate in broadcast client mode and receive NTP broadcast messages from GigabitEthernet 1/0/1.
[RouterA] interface gigabitethernet 1/0/1
[RouterA-GigabitEthernet1/0/1] ntp-service broadcast-client
3. Configure Router B:
# Enable the NTP service.
<RouterB> system-view
[RouterB] ntp-service enable
# Specify the time protocol as NTP.
[RouterB] clock protocol ntp
# Enable NTP authentication on Router B. Configure an NTP authentication key, with the key ID of 88 and key value of 123456. Input the key in plain text and specify it as a trusted key.
[RouterB] ntp-service authentication enable
[RouterB] ntp-service authentication-keyid 88 authentication-mode md5 simple 123456
[RouterB] ntp-service reliable authentication-keyid 88
# Configure Router B to operate in broadcast client mode and receive NTP broadcast messages from GigabitEthernet 1/0/1.
[RouterB] interface gigabitethernet 1/0/1
[RouterB-GigabitEthernet1/0/1] ntp-service broadcast-client
4. Configure Router C:
# Enable the NTP service.
<RouterC> system-view
[RouterC] ntp-service enable
# Specify the time protocol as NTP.
[RouterC] clock protocol ntp
# Specify the local clock as the reference source, with stratum level 3.
[RouterC] ntp-service refclock-master 3
# Configure Router C to operate in the NTP broadcast server mode and use GigabitEthernet 1/0/1 to send NTP broadcast messages.
[RouterC] interface gigabitethernet 1/0/1
[RouterC-GigabitEthernet1/0/1] ntp-service broadcast-server
[RouterC-GigabitEthernet1/0/1] quit
5. Verify the configuration:
NTP authentication is enabled on Router A and Router B, but not enabled on Router C, so Router A and Router B cannot synchronize their local clocks to Router C.
# Verify that Router B has not synchronized to Router C.
[RouterB-GigabitEthernet1/0/1] display ntp-service status
Clock status: unsynchronized
Clock stratum: 16
Reference clock ID: none
6. Configure NTP authentication on Router C:
# Enable NTP authentication on Router C. Configure an NTP authentication key, with the key ID of 88 and key value of 123456. Input the key in plain text and specify it as a trusted key.
[RouterC] ntp-service authentication enable
[RouterC] ntp-service authentication-keyid 88 authentication-mode md5 simple 123456
[RouterC] ntp-service reliable authentication-keyid 88
# Specify Router C as an NTP broadcast server, and associate the key 88 with Router C.
[RouterC] interface gigabitethernet 1/0/1
[RouterC-GigabitEthernet1/0/1] ntp-service broadcast-server authentication-keyid 88
7. Verify the configuration:
# Verify that Router B has synchronized to Router C, and the clock stratum level is 4 on Router B and 3 on Router C.
[RouterB-GigabitEthernet1/0/1] display ntp-service status
Clock status: synchronized
Clock stratum: 4
System peer: 3.0.1.31
Local mode: bclient
Reference clock ID: 3.0.1.31
Leap indicator: 00
Clock jitter: 0.006683 s
Stability: 0.000 pps
Clock precision: 2^-10
Root delay: 0.00127 ms
Root dispersion: 2.89877 ms
Reference time: d0d287a7.3119666f Sat, Jan 8 2011 6:50:15.191
# Verify that an IPv4 NTP association has been established between Router B and Router C.
[RouterB-GigabitEthernet1/0/1] display ntp-service sessions
source reference stra reach poll now offset delay disper
********************************************************************************
[1245]3.0.1.31 127.127.1.0 3 3 64 68 -0.0 0.0000 0.0
Notes: 1 source(master),2 source(peer),3 selected,4 candidate,5 configured.
Total sessions: 1
Configuration example for MPLS VPN time synchronization in client/server mode
Network requirements
As shown in Figure 35, two VPNs are present on PE 1 and PE 2: VPN 1 and VPN 2. CE 1 and CE 3 are devices in VPN 1.
To synchronize time between PE 2 and CE 1 in VPN 1, perform the following tasks:
· Configure CE 1's local clock as a reference source, with stratum level 2.
· Configure CE 1 to operate in client/server mode.
· Specify VPN 1 as the target VPN.
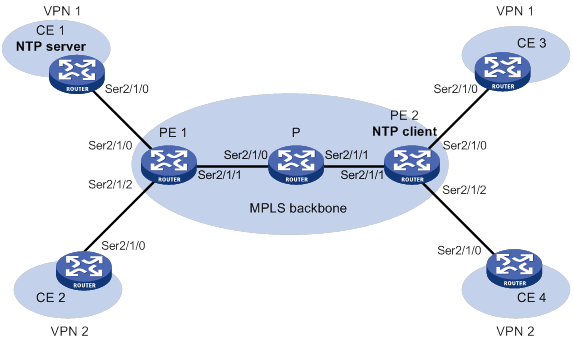
|
Device |
Interface |
IP address |
Device |
Interface |
IP address |
|
CE 1 |
Ser2/1/0 |
10.1.1.1/24 |
PE 1 |
Ser2/1/0 |
10.1.1.2/24 |
|
CE 2 CE 3 |
Ser2/1/0 Ser2/1/0 |
10.2.1.1/24 10.3.1.1/24 |
|
Ser2/1/1 Ser2/1/2 |
172.1.1.1/24 10.2.1.2/24 |
|
CE 4 |
Ser2/1/0 |
10.4.1.1/24 |
PE 2 |
Ser2/1/0 |
10.3.1.2/24 |
|
P |
Ser2/1/0 |
172.1.1.2/24 |
|
Ser2/1/1 |
172.2.1.2/24 |
|
|
Ser2/1/1 |
172.2.1.1/24 |
|
Ser2/1/2 |
10.4.1.2/24 |
Configuration procedure
Before you perform the following configuration, be sure you have completed MPLS VPN-related configurations. For information about configuring MPLS VPN, see MPLS Configuration Guide.
1. Assign an IP address to each interface, as shown in Figure 35. Make sure CE 1 and PE 1, PE 1 and PE 2, and PE 2 and CE 3 can reach each other. (Details not shown.)
2. Configure CE 1:
# Enable the NTP service.
<CE1> system-view
[CE1] ntp-service enable
# Specify the local clock as the reference source, with stratum level 2.
[CE1] ntp-service refclock-master 2
3. Configure PE 2:
# Enable the NTP service.
<PE2> system-view
[PE2] ntp-service enable
# Specify the time protocol as NTP.
[PE2] clock protocol ntp
# Specify CE 1 in VPN 1 as the NTP server of PE 2.
[PE2] ntp-service unicast-server 10.1.1.1 vpn-instance vpn1
4. Verify the configuration:
# Verify that PE 2 has synchronized to CE 1, with stratum level 3.
[PE2] display ntp-service status
Clock status: synchronized
Clock stratum: 3
System peer: 10.1.1.1
Local mode: client
Reference clock ID: 10.1.1.1
Leap indicator: 00
Clock jitter: 0.005096 s
Stability: 0.000 pps
Clock precision: 2^-10
Root delay: 0.00655 ms
Root dispersion: 1.15869 ms
Reference time: d0c62687.ab1bba7d Wed, Dec 29 2010 21:28:39.668
# Verify that an IPv4 NTP association has been established between PE 2 and CE 1.
[PE2] display ntp-service sessions
source reference stra reach poll now offset delay disper
********************************************************************************
[1245]10.1.1.1 127.127.1.0 2 1 64 519 -0.0 0.0065 0.0
Notes: 1 source(master),2 source(peer),3 selected,4 candidate,5 configured.
Total sessions: 1
# Verify that server 127.0.0.1 has synchronized to server 10.1.1.1, and server 10.1.1.1 has synchronized to the local clock.
[PE2] display ntp-service trace
Server 127.0.0.1
Stratum 3 , jitter 0.000, synch distance 796.50.
Server 10.1.1.1
Stratum 2 , jitter 939.00, synch distance 0.0000.
RefID 127.127.1.0
Configuration example for MPLS VPN time synchronization in symmetric active/passive mode
Network requirements
As shown in Figure 36, two VPNs are present on PE 1 and PE 2: VPN 1 and VPN 2. CE 1 and CE 3 belong to VPN 1.
To synchronize time between PE 1 and CE 1 in VPN 1, perform the following tasks:
· Configure CE 1's local clock as a reference source, with stratum level 2.
· Configure CE 1 to operate in symmetric active mode.
· Specify VPN 1 as the target VPN.
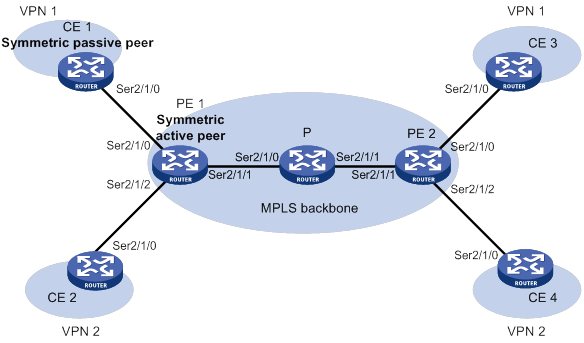
|
Device |
Interface |
IP address |
Device |
Interface |
IP address |
|
CE 1 |
Ser2/1/0 |
10.1.1.1/24 |
PE 1 |
Ser2/1/0 |
10.1.1.2/24 |
|
CE 2 CE 3 |
Ser2/1/0 Ser2/1/0 |
10.2.1.1/24 10.3.1.1/24 |
|
Ser2/1/1 Ser2/1/2 |
172.1.1.1/24 10.2.1.2/24 |
|
CE 4 |
Ser2/1/0 |
10.4.1.1/24 |
PE 2 |
Ser2/1/0 |
10.3.1.2/24 |
|
P |
Ser2/1/0 |
172.1.1.2/24 |
|
Ser2/1/1 |
172.2.1.2/24 |
|
|
Ser2/1/1 |
172.2.1.1/24 |
|
Ser2/1/2 |
10.4.1.2/24 |
Configuration procedure
Before you perform the following configuration, be sure you have completed MPLS VPN-related configurations.
1. Assign an IP address to each interface, as shown in Figure 36. Make sure CE 1 and PE 1, PE 1 and PE 2, PE 2 and CE 3 can reach each other. (Details not shown.)
2. Configure CE 1:
# Enable the NTP service.
<CE1> system-view
[CE1] ntp-service enable
# Specify the time protocol as NTP.
[CE1] clock protocol ntp
# Specify the local clock as the reference source, with stratum level 2.
[CE1] ntp-service refclock-master 2
3. Configure PE 1:
# Enable the NTP service.
<PE1> system-view
[PE1] ntp-service enable
# Specify the time protocol as NTP.
[PE1] clock protocol ntp
# Specify CE 1 in VPN 1 as the symmetric-passive peer of PE 1.
[PE1] ntp-service unicast-peer 10.1.1.1 vpn-instance vpn1
4. Verify the configuration:
# Verify that PE 1 has synchronized to CE 1, with stratum level 3.
[PE1] display ntp-service status
Clock status: synchronized
Clock stratum: 3
System peer: 10.1.1.1
Local mode: sym_active
Reference clock ID: 10.1.1.1
Leap indicator: 00
Clock jitter: 0.005096 s
Stability: 0.000 pps
Clock precision: 2^-10
Root delay: 0.00655 ms
Root dispersion: 1.15869 ms
Reference time: d0c62687.ab1bba7d Wed, Dec 29 2010 21:28:39.668
# Verify that an IPv4 NTP association has been established between PE 1 and CE 1.
[PE1] display ntp-service sessions
source reference stra reach poll now offset delay disper
********************************************************************************
[1245]10.1.1.1 127.127.1.0 2 1 64 519 -0.0 0.0000 0.0
Notes: 1 source(master),2 source(peer),3 selected,4 candidate,5 configured.
Total sessions: 1
# Verify that server 127.0.0.1 has synchronized to server 10.1.1.1, and server 10.1.1.1 has synchronized to the local clock.
[PE1] display ntp-service trace
Server 127.0.0.1
Stratum 3 , jitter 0.000, synch distance 796.50.
Server 10.1.1.1
Stratum 2 , jitter 939.00, synch distance 0.0000.
RefID 127.127.1.0
Configuring SNTP
SNTP is a simplified, client-only version of NTP specified in RFC 4330. SNTP supports only the client/server mode. An SNTP-enabled device can receive time from NTP servers, but cannot provide time services to other devices.
SNTP uses the same packet format and packet exchange procedure as NTP, but provides faster synchronization at the price of time accuracy.
If you specify multiple NTP servers for an SNTP client, the server with the best stratum is selected. If multiple servers are at the same stratum, the NTP server whose time packet is first received is selected.
Configuration restrictions and guidelines
When you configure SNTP, follow these restrictions and guidelines:
· You cannot configure both NTP and SNTP on the same device.
· Make sure you use the clock protocol command to specify the time protocol as NTP.
Configuration task list
|
Tasks at a glance |
|
(Required.) Enabling the SNTP service |
|
(Required.) Specifying an NTP server for the device |
|
(Optional.) Configuring SNTP authentication |
Enabling the SNTP service
The NTP service and SNTP service are mutually exclusive. You can only enable either NTP service or SNTP service at a time.
To enable the SNTP service:
|
Step |
Command |
Remarks |
|
1. Enter system view. |
system-view |
N/A |
|
2. Enable the SNTP service. |
sntp enable |
By default, the SNTP service is not enabled. |
Specifying an NTP server for the device
|
Step |
Command |
Remarks |
|
1. Enter system view. |
system-view |
N/A |
|
2. Specify an NTP server for the device. |
·
For IPv4: ·
For IPv6: |
By default, no NTP server is specified for the device. Repeat this step to specify multiple NTP servers. To use authentication, you must specify the authentication-keyid keyid option. |
To use an NTP server as the time source, make sure its clock has been synchronized. If the stratum level of the NTP server is greater than or equal to that of the client, the client does not synchronize with the NTP server.
Configuring SNTP authentication
SNTP authentication makes sure an SNTP client is synchronized only to an authenticated trustworthy NTP server.
Follow these guidelines when you configure SNTP authentication:
· Enable authentication on both the NTP server and the SNTP client.
· Use the same authentication key ID, authentication algorithm, and key on the NTP server and SNTP client. Specify the key as a trusted key on both the NTP server and the SNTP client. For information about configuring NTP authentication on an NTP server, see "Configuring NTP."
· On the SNTP client, associate the specified key with the NTP server. Make sure the server is allowed to use the key ID for authentication on the client.
With authentication disabled, the SNTP client can synchronize with the NTP server regardless of whether the NTP server is enabled with authentication.
To configure SNTP authentication on the SNTP client:
|
Step |
Command |
Remarks |
|
1. Enter system view. |
system-view |
N/A |
|
2. Enable SNTP authentication. |
sntp authentication enable |
By default, SNTP authentication is disabled. |
|
3. Configure an SNTP authentication key. |
sntp authentication-keyid keyid authentication-mode md5 { cipher | simple } string [ acl ipv4-acl-number | ipv6 acl ipv6-acl-number ] * |
By default, no SNTP authentication key is configured. |
|
4. Specify the key as a trusted key. |
sntp reliable authentication-keyid keyid |
By default, no trusted key is specified. |
|
5. Associate the SNTP authentication key with an NTP server. |
·
For IPv4: ·
For IPv6: |
By default, no NTP server is specified. |
Displaying and maintaining SNTP
Execute display commands in any view.
|
Task |
Command |
|
Display information about all IPv6 SNTP associations. |
display sntp ipv6 sessions |
|
Display information about all IPv4 SNTP associations. |
display sntp sessions |
SNTP configuration example
Network requirements
As shown in Figure 37:
· Configure the local clock of Device A as a reference source, with stratum level 2.
· Configure Device B to operate in SNTP client mode, and specify Device A as the NTP server.
· Configure NTP authentication on Device A and SNTP authentication on Device B.
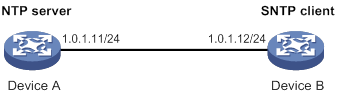
Configuration procedure
1. Assign an IP address to each interface, and make sure Device A and Device B can reach each other, as shown in Figure 37. (Details not shown.)
2. Configure Device A:
# Enable the NTP service.
<DeviceA> system-view
[DeviceA] ntp-service enable
# Specify the time protocol as NTP.
[DeviceA] clock protocol ntp
# Configure the local clock of Device A as a reference source, with stratum level 2.
[DeviceA] ntp-service refclock-master 2
# Enable NTP authentication on Device A.
[DeviceA] ntp-service authentication enable
# Configure an NTP authentication key, with the key ID of 10 and key value of aNiceKey. Input the key in plain text.
[DeviceA] ntp-service authentication-keyid 10 authentication-mode md5 simple aNiceKey
# Specify the key as a trusted key.
[DeviceA] ntp-service reliable authentication-keyid 10
3. Configure Device B:
# Enable the SNTP service.
<DeviceB> system-view
[DeviceB] sntp enable
# Specify the time protocol as NTP.
[DeviceB] clock protocol ntp
# Enable SNTP authentication on Device B.
[DeviceB] sntp authentication enable
# Configure an SNTP authentication key, with the key ID of 10 and key value of aNiceKey. Input the key in plain text.
[DeviceB] sntp authentication-keyid 10 authentication-mode md5 simple aNiceKey
# Specify the key as a trusted key.
[DeviceB] sntp reliable authentication-keyid 10
# Specify Device A as the NTP server of Device B, and associate the server with key 10.
[DeviceB] sntp unicast-server 1.0.1.11 authentication-keyid 10
4. Verify the configuration:
# Verify that an SNTP association has been established between Device B and Device A, and Device B has synchronized to Device A.
[DeviceB] display sntp sessions
NTP server Stratum Version Last receive time
1.0.1.11 2 4 Tue, May 17 2011 9:11:20.833 (Synced)
Configuring PoE
Overview
IEEE 802.3af-compliant power over Ethernet (PoE) enables a network device to supply power to terminals over twisted pair cables.
As shown in Figure 38, a PoE system includes the following elements:
· PoE power supply—The PoE power supply provides power for the entire PoE system.
· PSE—A power sourcing equipment (PSE) detects and classifies powered devices (PDs), supplies power to PDs, and monitors the PD power and connection status. PSEs include endpoint PSEs and midspan PSEs.
H3C PSEs are endpoint PSEs. An H3C PSE is a PoE-capable interface card on a device. A device with multiple PSEs uses PSE IDs to identify different PSEs. The display poe device command displays the mapping between a PSE ID and the slot or subslot number of a PSE.
· PI—A power interface (PI) is a PoE-capable Ethernet interface on a PSE.
· PD—A PD receives power from the PSE.
PDs include IP telephones, APs, portable chargers, POS terminals, and Web cameras.
You can also connect a PD to a redundant power source for reliability.
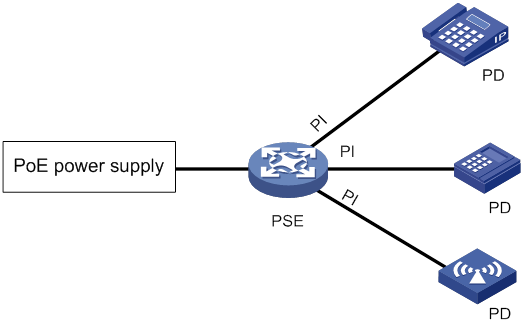
Compatibility information
Feature and hardware compatibility
This feature is supported only by the MSR810-10-PoE router and the following PoE-capable routers installed with the SIC-4FSWP, DSIC-9FSWP, or HMIM-24GSWP interface modules:
· MSR 3610/3620/3620-DP/3640/3660.
· MSR5620/5660/5680.
Command and hardware compatibility
Commands and descriptions for centralized devices apply to the following routers:
· MSR810-10-PoE.
· MSR 3610/3620/3620-DP/3640/3660.
Commands and descriptions for distributed devices apply to the following routers:
· MSR5620.
· MSR 5660.
· MSR 5680.
PoE configuration task list
You can configure a PI directly on the port or by configuring a PoE profile and applying the PoE profile to the PI. To configure one PI, configure it on the port. To configure multiple PIs in batches, use the PoE profile.
Before configuring PoE, make sure the PoE power supply and PSE are operating correctly. Otherwise, either you cannot configure PoE or the PoE configuration cannot take effect.
To configure PoE, perform the following tasks:
|
Tasks at a glance |
Remarks |
|
(Required.) Enabling PoE: |
N/A |
|
(Optional.) Configuring PD detection: |
N/A |
|
(Optional.) Configuring the PoE power settings: |
N/A |
|
(Optional.) Configuring PoE power management: |
N/A |
|
(Optional.) Configuring PoE monitoring |
N/A |
|
(Optional.) Configuring a PI by using a PoE profile: |
N/A |
|
(Optional.) Upgrading PSE firmware in service |
N/A |
Enabling PoE
This section describes how to enable PoE for a PSE and a PI.
Enabling PoE for a PSE
|
|
NOTE: Support for the feature depends on the device model. |
The system only supplies power to and reserves power for PoE-enabled PSEs.
You can enable PoE for a PSE if the PSE will not result in PoE power overload. PoE overload occurs when the sum of the power consumption of all PSEs exceeds the maximum power of PoE power supply. The maximum power of PoE power supply depends on the hardware specifications of the PoE power supply and the configuration.
If the PSE will result in PoE power overload, you can enable PoE for the PSE only when PoE power management is enabled. For more information about PSE power management, see "Configuring PSE power management."
To enable PoE for a PSE:
|
Step |
Command |
Remarks |
|
1. Enter system view. |
system-view |
N/A |
|
2. Enable PoE for the PSE. |
poe enable pse pse-id |
By default, this function is disabled. |
Enabling PoE for a PI
The system only supplies power to and reserves power for PDs connected to PoE-enabled PIs.
You can enable PoE for a PI if the PI will not result in PSE power overload. PSE overload occurs when the sum of the power consumption of all PIs exceeds the maximum power of the PSE. The maximum PSE power is configurable.
If the PI will result in PSE power overload, you can enable PoE for the PI only when PI power management is enabled. For more information about PI power management, see "Configuring PI power management."
The PSE supplies power over the Category 3 or Category 5 twisted pair cable connected to a PI in the following modes:
· Over signal wires—The PSE uses data pairs (pins 1, 2, 3, and 6) to supply DC power to PDs.
· Over spare wires—The PSE uses spare pairs (pins 4, 5, 7, and 8) to supply DC power to PDs.
|
|
NOTE: · The device supports power transmission only over signal wires. · The power transmission mode varies by device model. A PSE can supply power to a PD directly only when the PSE and PD use the same power transmission mode. If the PSE and PD use different power transmission modes, you must change the order of the lines in the twisted pair cable to supply power to the PD. |
To enable PoE for a PI:
|
Step |
Command |
Remarks |
|
1. Enter system view. |
system-view |
N/A |
|
2. Enter PI view. |
interface interface-type interface-number |
N/A |
|
3. Enable PoE for the PI. |
poe enable |
By default, PoE is disabled for a PI. |
|
4. (Optional.) Configure power transmission mode. |
poe mode { signal | spare } |
The default mode is power over signal cables (signal). Support for the signal and spare keywords depends on the device model. |
|
5. (Optional.) Configure a description for the PD connected to the PI. |
poe pd-description text |
By default, no description is configured for the PD connected to the PI. |
Configuring PD detection
This section describes how to configure nonstandard-PD detection and PD disconnection detection.
Enabling nonstandard PD detection
|
Step |
Command |
Remarks |
|
1. Enter system view. |
system-view |
N/A |
|
2. Enable nonstandard PD detection. |
poe legacy enable |
By default, nonstandard PD detection is disabled. The PSE detects only IEEE 802.3af-compliant standard PDs and supplies power to them. |
|
Step |
Command |
Remarks |
|
1. Enter system view. |
system-view |
N/A |
|
2. Enable nonstandard PD detection. |
poe legacy enable pse pse-id |
By default, nonstandard PD detection is disabled. The PSE detects only IEEE 802.3af-compliant standard PDs and supplies power to them. |
Configuring a PD disconnection detection mode
|
|
CAUTION: If you change the PD disconnection detection mode when the device is running, the connected PDs are powered off. |
A PSE detects PD disconnection in AC mode or DC mode. The AC mode uses less power than the DC mode.
To configure a PD disconnection detection mode:
|
Step |
Command |
Remarks |
|
1. Enter system view. |
system-view |
N/A |
|
2. (Optional.) Configure a PD disconnection detection mode. |
poe disconnect { ac | dc } |
The default PD disconnection detection mode varies by device model. |
Configuring the PoE power
This section describes how to configure the maximum PSE power and the maximum PI power.
Configuring the maximum PSE power
The maximum power of a PSE is the maximum power that the PSE can provide to all its attached PDs.
Follow these guidelines when you configure the maximum PSE power:
· To avoid the PoE power overload situation, make sure the total power of all PSEs is less than the maximum PoE power.
· The maximum power of the PSE must be greater than or equal to the total maximum power of all its critical PIs to guarantee these PIs power.
To configure the maximum PSE power:
|
Step |
Command |
Remarks |
|
1. Enter system view. |
system-view |
N/A |
|
2. Configure the maximum power for the PSE. |
poe max-power max-power |
The default maximum power of the PSE varies by device model. |
To configure the maximum PSE power:
|
Step |
Command |
Remarks |
|
1. Enter system view. |
system-view |
N/A |
|
2. Configure the maximum power for the PSE. |
poe pse pse-id max-power max-power |
The default maximum power of the PSE varies by device model. |
Configuring the maximum PI power
The maximum PI power is the maximum power that a PI can provide to the connected PD. If the PD requires more power than the maximum PI power, the PI does not supply power to the PD.
To configure the maximum PI power:
|
Step |
Command |
Remarks |
|
1. Enter system view. |
system-view |
N/A |
|
2. Enter PI view. |
interface interface-type interface-number |
N/A |
|
3. Configure the maximum power for the PI. |
poe max-power max-power |
The default maximum power of the PI varies by device model. |
Configuring PoE power management
PoE power management includes PSE power management and PI power management.
Configuring PSE power management
|
|
NOTE: Support for this feature depends on the device model. |
PSE power management performs priority-based power allocation in PoE power overload situations. The power-supply priority levels of a PSE are critical, high, and low in descending order. If the PoE power is sufficient, you do not need to enable PSE power management.
If you do not enable PSE power management, the system supplies power based on the maximum PoE power configuration status in PoE power overload situations.
If you enable PSE power management, the system supplies power based on the PSE priority when a new PSE causes PoE power overload:
|
Priority of the new PSE |
PoE system operations |
|
Low |
The system does not supply power to a new PSE. |
|
High |
· If low-priority PSEs exist, the system stops power supply to the existing low-priority PSEs, and supplies power to the new PSE. · If no low-priority PSEs exist, the system does not supply power to the new PSE. |
|
Critical |
· If low-priority or high-priority PSEs exist, the system stops power supply to the existing low-priority or high-priority PSEs, and supplies power to the new PSE. · If no low-priority or high-priority PSEs exist, the system does not supply power to the new PSE. |
|
|
NOTE: Configuration for PSEs whose power is preempted remains unchanged. |
If multiple new PSEs require power supply, the system supplies power to PSEs in priority descending order. For PSEs with the same priority, the one with the smallest PSE ID takes precedence.
If multiple existing PSEs need to be stopped with power supply, the system stops power supply to PSEs in priority ascending order. For PSEs with the same priority, the one with the greatest ID takes precedence.
The system guarantees its critical PSEs uninterruptable power by reserving guaranteed PoE power. If you want a PSE to be allocated with uninterruptable power, configure it with critical priority. Otherwise, configure it with high or low priority to ensure that other PSEs can be supplied with power.
Before you configure a PSE with critical priority, make sure the remaining guaranteed power is greater than or equal to the maximum power of the PSE. The remaining guaranteed PoE power is the maximum PoE power minus the maximum power for PoE-enabled and PoE-disabled critical PSEs.
To configure PSE power management:
|
Step |
Command |
Remarks |
|
1. Enter system view. |
system-view |
N/A |
|
2. Enable PSE power management. |
poe pse-policy priority |
By default, PSE power management is disabled. |
|
3. (Optional.) Configure the power supply priority for the PSE. |
poe priority { critical | high | low } pse pse-id |
By default, the power supply priority for the PSE is low. |
Configuring PI power management
PI power management enables the PSE to perform priority-based PI power management in PSE power overload situations. The power-supply priority levels of a PI are critical, high, and low in descending order. The PD priority is determined by the priority of the PI to which the PD is connected. All PSEs use the same PI power management mechanism.
If you do not enable PI power management, the PSE performs operations based on the status of the maximum PSE power upon power overload:
|
Maximum PSE power |
PSE operations |
|
Configured |
The PSE stops power supply to the new PD. |
|
Not configured |
The PSE stops power supply to all PDs when the PoE self-protection mechanism is triggered. |
If you enable PI power management, the PSE stops power supply to existing PDs causing overload or performs priority-based operations for new PDs causing overload:
|
Priority of the new PD |
PSE operations |
|
Low |
The PSE does not supply power to a new PD. |
|
High |
· If low-priority PDs exist, the PSE stops power supply to the existing low-priority PDs, and supplies power to the new PD. · If no low-priority PDs exist, the PSE does not supply power to the new PD. |
|
Critical |
· If low-priority or high-priority PDs exist, the PSE stops power supply to the existing low-priority or high-priority PDs, and supplies power to the new PD. · If no low-priority or high-priority PDs exist, the PSE does not supply power to the new PD. |
|
|
NOTE: Configuration for PIs whose power is preempted remains unchanged. |
If multiple new PDs require power supply, the PSE supplies power to PDs in priority descending order. For PDs with the same priority, the one with the smallest PD ID takes precedence.
If multiple existing PDs need to be stopped with power supply, the PSE stops power supply to PDs in priority ascending order. For PDs with the same priority, the one with the greatest ID takes precedence.
The PSE guarantees its critical PIs uninterruptable power by reserving guaranteed PSE power. If you want a PI to be allocated with uninterruptable power, configure the PI with critical priority. Otherwise, configure the PI with high or low priority to ensure that other PIs can be supplied with power.
Before you configure a PI with critical priority, make sure the remaining guaranteed power is greater than or equal to the maximum power of the PI. The remaining guaranteed PSE power is the maximum PSE power minus the maximum power for PoE-enabled and PoE-disabled critical PIs.
To configure PI power management:
|
Step |
Command |
Remarks |
|
1. Enter system view. |
system-view |
N/A |
|
2. Enable PI power management. |
poe pd-policy priority |
By default, PI power management is disabled. |
|
3. Enter PI view. |
interface interface-type interface-number |
N/A |
|
4. (Optional.) Configure the power supply priority for a PI. |
poe priority { critical | high | low } |
By default, the power supply priority for the PSE is low. |
Configuring PoE monitoring
When the PoE monitoring function is enabled, the system monitors PSEs, PDs, and device temperature in real time. If a specific value exceeds the threshold, the system automatically takes self-protection measures.
If a PSE starts or stops power supply to a PD, the system automatically sends a notification message. For more information, see "Configuring SNMP."
The system monitors PSE power utilization and sends notification messages when PSE power utilization exceeds or drops below the threshold. If PSE power utilization crosses the threshold multiple times in succession, the system sends notification messages only for the first crossing. For more information about the notification message, see "Configuring SNMP."
To configure a PSE power alarm threshold:
|
Step |
Command |
Remarks |
|
1. Enter system view. |
system-view |
N/A |
|
2. Configure a power alarm threshold for the PSE. |
poe utilization-threshold utilization-threshold-value pse pse-id |
By default, the power alarm threshold for the PSE is 80%. |
Configuring a PI by using a PoE profile
A PoE profile is a collection of configurations that contain multiple PoE features.
You can configure a PI either on the port or by using a PoE profile. Follow these guidelines when you configure parameters for a PI:
· The poe max-power max-power and poe priority { critical | high | low } commands must be configured in the same method.
· If you configure a parameter twice with different methods, only the first configuration takes effect.
The PoE profile is preferable for PI configuration in batches and PD-specific PI configuration.
· You can apply a PoE profile to multiple PIs. PIs configured by the same PoE profile have the same PoE features.
· You can define PoE configurations for a PD in a PoE profile, and apply the PoE profile to the PI to which the PD connects. This avoids reconfiguration when the PD is moved to another PI.
Configuring a PoE profile
|
Step |
Command |
Remarks |
|
1. Enter system view. |
system-view |
N/A |
|
2. Create a PoE profile, and enter PoE profile view. |
poe-profile profile-name [ index ] |
By default, no PoE profiles exist. |
|
3. Enable PoE. |
poe enable |
By default, this function is disabled. |
|
4. (Optional.) Configure PI priority. |
poe priority { critical | high | low } |
The default priority is low. |
Applying a PoE profile
You can apply a PoE profile in system view or PI view. If you perform the operation in both views, the most recent operation takes effect. To apply a PoE profile to multiple PIs, perform the operation in system view. A PoE profile can be applied to multiple PIs, but a PI can have only one PoE profile.
To modify an applied PoE profile, first execute the undo apply poe-profile or undo apply poe-profile interface command to remove its application.
Applying a PoE profile to multiple PIs in system view
|
Step |
Command |
Remarks |
|
1. Enter system view. |
system-view |
N/A |
|
2. Apply a PoE profile to one or multiple PIs. |
apply poe-profile { index index | name profile-name } interface interface-range |
By default, no PoE profile is applied to a PI. |
Applying a PoE profile to a PI in PI view
|
Step |
Command |
Remarks |
|
1. Enter system view. |
system-view |
N/A |
|
2. Enter PI view. |
interface interface-type interface-number |
N/A |
|
3. Apply the PoE profile to the interface. |
apply poe-profile { index index | name profile-name } |
By default, no PoE profile is applied to a PI. |
Upgrading PSE firmware in service
You can upgrade the PSE firmware in service in either of the following modes:
· Refresh mode—Updates the PSE firmware without deleting it. You can use the refresh mode in most cases.
· Full mode—Deletes the current PSE firmware and reloads a new one. Use the full mode if the PSE firmware is damaged and you cannot execute any PoE commands.
If the PSE firmware upgrade fails because of interruption such as a device reboot, you can restart the device and upgrade it in full mode again. After the upgrade, restart the device manually for the new PSE firmware to take effect.
To upgrade the PSE firmware in service:
|
Step |
Command |
|
1. Enter system view. |
system-view |
|
2. Upgrade the PSE firmware in service. |
poe update { full | refresh } filename [ pse pse-id ] |
Displaying and maintaining PoE
Execute display commands in any view.
|
Task |
Command |
|
Display general PSE information. |
·
Distributed devices in standalone mode/centralized
devices in standalone or IRF mode: ·
Distributed devices in IRF mode: |
|
Display the power supplying information for the specified PI. |
display poe interface [ interface-type interface-number ] |
|
Display power information for PIs. |
display poe interface power [ interface-type interface-number ] |
|
Display power information for the PoE power supply and all PSEs. |
·
In standalone mode: ·
Distributed devices in IRF mode: ·
Centralized devices in IRF mode: |
|
Display detailed PSE information. |
display poe pse [ pse-id ] |
|
Display the power supplying information for all PIs on a PSE. |
display poe pse pse-id interface |
|
Display power information for all PIs on a PSE. |
display poe pse pse-id interface power |
|
Display all information about the PoE profile. |
display poe-profile [ index index | name profile-name ] |
|
Display all information about the PoE profile applied to the specified PI. |
display poe-profile interface interface-type interface-number |
PoE configuration example
Network requirements
As shown in Figure 39, the device has two PSEs PSE 10 and PSE 16. Configure PoE to meet the following requirements:
· Enable the device to supply power to IP telephones and APs.
· Configure PI power management so that the PSE does not supply power to a new PD when the new PD results in PSE power overload.
· Allocate 400 watts to PSE 10. (This example assumes that the default maximum power of PSE 16 can meet the requirements.)
· Allocate AP B a maximum power of 9000 milliwatts.
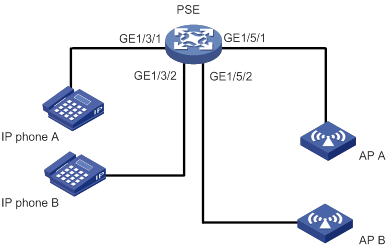
Configuration procedure
# Enable PoE for the PSE.
<PSE> system-view
[PSE] poe enable pse 10
[PSE] poe enable pse 16
# Set the maximum power of PSE 10 to 400 watts.
[PSE] poe pse 10 max-power 400
# Enable PoE on GigabitEthernet 1/3/1 and GigabitEthernet 1/5/1.
[PSE] interface gigabitethernet 1/3/1
[PSE-GigabitEthernet1/3/1] poe enable
[PSE-GigabitEthernet1/3/1] quit
[PSE] interface gigabitethernet 1/5/1
[PSE-GigabitEthernet1/5/1] poe enable
[PSE-GigabitEthernet1/5/1] quit
# Enable PoE on GigabitEthernet 1/3/2, and set its power priority to critical.
[PSE] interface gigabitethernet 1/3/2
[PSE-GigabitEthernet1/3/2] poe enable
[PSE-GigabitEthernet1/3/2] poe priority critical
[PSE-GigabitEthernet1/3/2] quit
# Enable PoE on GigabitEthernet 1/5/2, and set its maximum power to 9000 milliwatts.
[PSE] interface gigabitethernet 1/5/2
[PSE-GigabitEthernet1/5/2] poe enable
[PSE-GigabitEthernet1/5/2] poe max-power 9000
Verifying the configuration
# Connect the IP telephones and APs to the PSEs to verify that they can obtain power and operate correctly. (Details not shown.)
Troubleshooting PoE
Failure to set the priority of a PI to critical
Symptom
Power supply priority configuration for a PI failed.
Solution
To resolve the problem:
1. Identify whether the remaining guaranteed power of the PSE is lower than the maximum power of the PI. If it is, increase the maximum PSE power or reduce the maximum power of the PI.
2. Identify whether the priority has been configured through other methods. If the priority has been configured, remove the configuration.
3. If the problem persists, contact H3C Support.
Failure to apply a PoE profile to a PI
Symptom
PoE profile application for a PI failed.
Solution
To resolve the problem:
1. Identify whether some settings in the PoE profile have been configured. If they have been configured, remove the configuration.
2. Identify whether the settings in the PoE profile meet the requirements of the PI. If they do not, modify the settings in the PoE profile.
3. Identify whether another PoE profile is already applied to the PI. If it is, remove the application.
4. If the problem persists, contact H3C Support.
Configuring SNMP
Overview
Simple Network Management Protocol (SNMP) is an Internet standard protocol widely used for a management station to access and operate the devices on a network, regardless of their vendors, physical characteristics, and interconnect technologies.
SNMP enables network administrators to read and set the variables on managed devices for state monitoring, troubleshooting, statistics collection, and other management purposes.
SNMP framework
The SNMP framework contains the following elements:
· SNMP manager—Works on an NMS to monitor and manage the SNMP-capable devices in the network.
· SNMP agent—Works on a managed device to receive and handle requests from the NMS, and sends notifications to the NMS when events, such as an interface state change, occur.
· Management Information Base (MIB)—Specifies the variables (for example, interface status and CPU usage) maintained by the SNMP agent for the SNMP manager to read and set.
Figure 40 Relationship between NMS, agent, and MIB
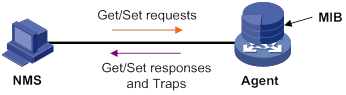
MIB and view-based MIB access control
A MIB stores variables called "nodes" or "objects" in a tree hierarchy and identifies each node with a unique OID. An OID is a dotted numeric string that uniquely identifies the path from the root node to a leaf node. For example, object B in Figure 41 is uniquely identified by the OID {1.2.1.1}.
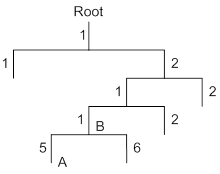
A MIB view represents a set of MIB objects (or MIB object hierarchies) with certain access privileges and is identified by a view name. The MIB objects included in the MIB view are accessible while those excluded from the MIB view are inaccessible.
A MIB view can have multiple view records each identified by a view-name oid-tree pair.
You control access to the MIB by assigning MIB views to SNMP groups or communities.
SNMP operations
SNMP provides the following basic operations:
· Get—NMS retrieves the SNMP object nodes in an agent MIB.
· Set—NMS modifies the value of an object node in an agent MIB.
· Notification—SNMP agent sends traps or informs to report events to the NMS. The difference between these two types of notification is that informs require acknowledgment but traps do not. Traps are available in SNMPv1, SNMPv2c, and SNMPv3, but informs are available only in SNMPv2c and SNMPv3.
Protocol versions
SNMPv1, SNMPv2c, and SNMPv3 are supported in non-FIPS mode. Only SNMPv3 is supported in FIPS mode. An NMS and an SNMP agent must use the same SNMP version to communicate with each other.
· SNMPv1—Uses community names for authentication. To access an SNMP agent, an NMS must use the same community name as set on the SNMP agent. If the community name used by the NMS differs from the community name set on the agent, the NMS cannot establish an SNMP session to access the agent or receive traps from the agent.
· SNMPv2c—Uses community names for authentication. SNMPv2c is compatible with SNMPv1, but supports more operation types, data types, and error codes.
· SNMPv3—Uses a user-based security model (USM) to secure SNMP communication. You can configure authentication and privacy mechanisms to authenticate and encrypt SNMP packets for integrity, authenticity, and confidentiality.
Access control modes
SNMP uses the following modes to control access to MIB objects:
? SNMP communities or users have read and write access to all MIB objects if they use the predefined network-admin or level-15 user role.
? SNMP communities or users have read-only access to all MIB objects if they use the predefined network-operator user role.
? SNMP communities or users have user-assigned access rights if they use a non-predefined user role. To create a non-predefined user role, use the role command. To assign MIB object rights to the user role, use the rule command.
If you create the same SNMP community or user with both modes multiple times, the most recent configuration takes effect. For more information about RBAC, see Fundamentals Command Reference.
FIPS compliance
The device supports the FIPS mode that complies with NIST FIPS 140-2 requirements. Support for features, commands, and parameters might differ in FIPS mode and non-FIPS mode. For more information about FIPS mode, see Security Configuration Guide.
Configuring SNMP basic parameters
SNMPv3 differs from SNMPv1 and SNMPv2c in many ways. Their configuration procedures are described in separate sections.
Configuring SNMPv1 or SNMPv2c basic parameters
Only users with the network-admin or level-15 user role can create SNMPv1 or SNMPv2c communities, users, or groups. Users with other user roles cannot create SNMPv1 or SNMPv2c communities, users, or groups even if these roles are granted access to commands of the SNMPv1 or SNMPv2c feature or related commands.
To configure SNMPv1 or SNMPv2c basic parameters:
|
Step |
Command |
Remarks |
|
1. Enter system view. |
system-view |
N/A |
|
2. (Optional.) Enable the SNMP agent. |
snmp-agent |
By default, the SNMP agent is disabled. The SNMP agent is enabled when you use any command that begins with snmp-agent except for the following commands: · snmp-agent calculate-password · snmp-agent trap enble protocol (The protocol value is not syslog) |
|
3. (Optional.) Configure the system contact. |
snmp-agent sys-info contact sys-contact |
The default system contact is Hangzhou H3C Tech. Co., Ltd.. |
|
4. (Optional.) Configure the system location. |
snmp-agent sys-info location sys-location |
The default system location is Hangzhou, China. |
|
5. Enable SNMPv1 or SNMPv2c. |
By default, SNMPv3 is enabled. |
|
|
6. (Optional.) Set a local engine ID. |
snmp-agent local-engineid engineid |
By default, the local engine ID is the company ID plus the device ID. The device ID varies by device model. |
|
7. (Optional.) Set an engine ID for a remote SNMP entity. |
snmp-agent remote { ipv4-address | ipv6 ipv6-address } [ vpn-instance vpn-instance-name ] engineid engineid |
By default, no remote entity engine IDs exist. This step is required for the device to send SNMPv1 or SNMPv2c notifications to a host, typically NMS. |
|
8. (Optional.) Create or update a MIB view. |
snmp-agent mib-view { excluded | included } view-name oid-tree [ mask mask-value ] |
By default, the MIB view ViewDefault is predefined. In this view, all the MIB objects in the iso subtree but the snmpUsmMIB, snmpVacmMIB, and snmpModules.18 subtrees are accessible. Each view-name oid-tree pair represents a view record. If you specify the same record with different MIB sub-tree masks multiple times, the most recent configuration takes effect. |
|
9. Configure the SNMP access right. |
·
(Method 1.) Create an SNMP community: · (Method 2.) Create an SNMPv1/v2c group, and add users to the group: a. snmp-agent group { v1 | v2c } group-name [ read-view view-name ] [ write-view view-name ] [ notify-view view-name ] [ acl { ipv4-acl-number | name ipv4-acl-name } | acl ipv6 { ipv6-acl-number | name ipv6-acl-name } ] * b. snmp-agent usm-user { v1 | v2c } user-name group-name [ acl { ipv4-acl-number | name ipv4-acl-name } | acl ipv6 { ipv6-acl-number | name ipv6-acl-name } ] * |
By default, no SNMP group or SNMP community exists. The username in method 2 has the same purpose as the community name in method 1. Whichever method you use, make sure the configured name is the same as the community name on the NMS. |
|
10. (Optional.) Create an SNMP context. |
snmp-agent context context-name |
By default, no SNMP contexts exist. |
|
11. (Optional.) Map an SNMP community to an SNMP context. |
snmp-agent community-map community-name context context-name |
By default, no mapping exists between an SNMP community and an SNMP context. |
|
12. (Optional.) Configure the maximum SNMP packet size (in bytes) that the SNMP agent can handle. |
snmp-agent packet max-size byte-count |
By default, an SNMP agent can process SNMP packets with a maximum size of 1500 bytes. |
|
13. Specify the UDP port for receiving SNMP packets. |
snmp-agent port port-num |
By default, the device uses UDP port 161 for receiving SNMP packets. |
Configuring SNMPv3 basic parameters
Only users with the network-admin or level-15 user role can create SNMPv3 users or groups. Users with other user roles cannot create SNMPv3 users or groups even if these roles are granted access to commands of the SNMPv3 feature or related commands.
SNMPv3 users are managed in groups. All SNMPv3 users in a group share the same security model, but can use different authentication and privacy key settings. To implement a security model for a user and avoid SNMP communication failures, make sure the security model configuration for the group and the security key settings for the user are compliant with Table 7 and match the settings on the NMS.
Table 7 Basic security setting requirements for different security models
|
Security model |
Security model keyword for the group |
Security key settings for the user |
Remarks |
|
Authentication with privacy |
privacy |
Authentication key, privacy key |
If the authentication key or the privacy key is not configured, SNMP communication will fail. |
|
Authentication without privacy |
authentication |
Authentication key |
If no authentication key is configured, SNMP communication will fail. The privacy key (if any) for the user does not take effect. |
|
No authentication, no privacy |
Neither authentication nor privacy |
None |
The authentication and privacy keys, if configured, do not take effect. |
To configure SNMPv3 basic parameters:
|
Step |
Command |
Remarks |
|
1. Enter system view. |
system-view |
N/A |
|
2. (Optional.) Enable the SNMP agent. |
snmp-agent |
By default, the SNMP agent is disabled. The SNMP agent is enabled when you use any command that begins with snmp-agent except for the snmp-agent calculate-password command. |
|
3. (Optional.) Configure the system contact. |
snmp-agent sys-info contact sys-contact |
The default system contact is Hangzhou H3C Tech. Co., Ltd.. |
|
4. (Optional.) Configure the system location. |
snmp-agent sys-info location sys-location |
The default system location is Hangzhou, China. |
|
5. Enable SNMPv3. |
By default, SNMPv3 is enabled. |
|
|
6. (Optional.) Set a local engine ID. |
snmp-agent local-engineid engineid |
By default, the local engine ID is the company ID plus the device ID.
After you change the local engine ID, the existing SNMPv3 users and encrypted keys become invalid, and you must reconfigure them. |
|
7. (Optional.) Set an engine ID for a remote SNMP entity. |
snmp-agent remote { ipv4-address | ipv6 ipv6-address } [ vpn-instance vpn-instance-name ] engineid engineid |
By default, no remote entity engine IDs exist. This step is required for the device to send SNMPv3 notifications to a host, typically NMS. |
|
8. (Optional.) Create or update a MIB view. |
snmp-agent mib-view { excluded | included } view-name oid-tree [ mask mask-value ] |
By default, the MIB view ViewDefault is predefined. In this view, all the MIB objects in the iso subtree but the snmpUsmMIB, snmpVacmMIB, and snmpModules.18 subtrees are accessible. Each view-name oid-tree pair represents a view record. If you specify the same record with different MIB sub-tree masks multiple times, the most recent configuration takes effect. |
|
9. (Optional.) Create an SNMPv3 group. |
·
In non-FIPS mode: |
By default, no SNMP groups exist. |
|
10. (Optional.) Calculate the encrypted form for the key in plaintext form. |
·
In non-FIPS mode: ·
In FIPS mode: |
N/A |
|
11. Create an SNMPv3 user. |
·
In non-FIPS mode (in VACM mode): ·
In FIPS mode (in VACM mode): |
If the cipher keyword is specified, the arguments auth-password and priv-password are used as encrypted keys. To send notifications to an SNMPv3 NMS, you must specify the remote keyword. |
|
12. (Optional.) Assign a user role to an SNMPv3 user created in RBAC mode. |
By default, an SNMPv3 user has the user role assigned to it at its creation. |
|
|
13. (Optional.) Create an SNMP context. |
snmp-agent context context-name |
By default, no SNMP contexts exist |
|
14. (Optional.) Configure the maximum SNMP packet size (in bytes) that the SNMP agent can handle. |
snmp-agent packet max-size byte-count |
By default, an SMMP agent can process SNMP packets with a maixmum size of 1500 bytes. |
|
15. (Optional.) Specify the UDP port for receiving SNMP packets. |
snmp-agent port port-num |
By default, the device uses UDP port 161 for receiving SNMP packets. |
Configuring SNMP logging
Enable SNMP logging only if necessary. SNMP logging is memory-intensive and might impact device performance.
The SNMP agent logs Get requests, Set requests, Set responses, SNMP notifications, and SNMP authentication failures, but does not log Get responses.
· Get operation—The agent logs the IP address of the NMS, name of the accessed node, and node OID.
· Set operation—The agent logs the NMS' IP address, name of accessed node, node OID, variable value, and error code and index for the Set operation.
· Notification tracking—The agent logs the SNMP notifications after sending them to the NMS.
· SNMP authentication failure—The agent logs related information when an NMS fails to be authenticated by the agent.
The SNMP module sends these logs to the information center. You can configure the information center to output these messages to certain destinations, such as the console and the log buffer. The total output size for the node field (MIB node name) and the value field (value of the MIB node) in each log entry is 1024 bytes. If this limit is exceeded, the information center truncates the data in the fields. For more information about the information center, see "Configuring the information center."
To configure SNMP logging:
|
Step |
Command |
Remarks |
|
1. Enter system view. |
system-view |
N/A |
|
2. (Optional.) Enable SNMP logging. |
snmp-agent log { all | authfail | get-operation | set-operation } |
By default, SNMP logging is disabled. |
|
3. (Optional.) Enable SNMP notification logging. |
snmp-agent trap log |
By default, SNMP notification logging is disabled. |
Configuring SNMP notifications
The SNMP Agent sends notifications (traps and informs) to inform the NMS of significant events, such as link state changes and user logins or logouts. Unless otherwise stated, the trap keyword in the command line includes both traps and informs.
Enabling SNMP notifications
Enable an SNMP notification only if necessary. SNMP notifications are memory-intensive and might affect device performance.
To generate linkUp or linkDown notifications when the link state of an interface changes, you must perform the following tasks:
· Enable linkUp or linkDown notification globally by using the snmp-agent trap enable standard [ linkdown | linkup ] * command.
· Enable linkUp or linkDown notification on the interface by using the enable snmp trap updown command.
After you enable notifications for a module, whether the module generates notifications also depends on the configuration of the module. For more information, see the configuration guide for each module.
|
Step |
Command |
Remarks |
|
1. Enter system view. |
system-view |
N/A |
|
2. Enable SNMP notifications. |
snmp-agent trap enable [ configuration | protocol | standard [ authentication | coldstart | linkdown | linkup | warmstart ] * | system ] |
By default, SNMP configuration notifications, standard notifications, and system notifications are enabled. Whether other SNMP notifications are enabled varies by modules. To enable SNMP notifications for a protocol, first enable the protocol. |
|
3. Enter interface view. |
interface interface-type interface-number |
N/A |
|
4. Enable link state notifications. |
enable snmp trap updown |
By default, link state notifications are enabled. |
Configuring the SNMP agent to send notifications to a host
You can configure the SNMP agent to send notifications as traps or informs to a host, typically an NMS, for analysis and management. Traps are less reliable and use fewer resources than informs, because an NMS does not send an acknowledgment when it receives a trap.
Configuration guidelines
When network congestion occurs or the destination is not reachable, the SNMP agent buffers notifications in a queue. You can set the queue size and the notification lifetime (the maximum time that a notification can stay in the queue). A notification is deleted when its lifetime expires. When the notification queue is full, the oldest notifications are automatically deleted.
You can extend standard linkUp/linkDown notifications to include interface description and interface type, but must make sure the NMS supports the extended SNMP messages.
To send informs, make sure of the following information:
· The SNMP agent and the NMS use SNMPv2c or SNMPv3.
· If SNMPv3 is used, you must configure the SNMP engine ID of the NMS when you configure SNMPv3 basic settings. Also, specify the IP address of the SNMP engine when you create the SNMPv3 user.
Configuration prerequisites
Configure the SNMP agent with the same basic SNMP settings as the NMS. If SNMPv1 or SNMPv2c is used, you must configure a community name. If SNMPv3 is used, you must configure an SNMPv3 user, a MIB view, and a remote SNMP engine ID associated with the SNMPv3 user for notifications.
Make sure the SNMP agent and the NMS can reach each other.
Configuration procedure
To configure the SNMP agent to send notifications to a host:
|
Step |
Command |
Remarks |
|
1. Enter system view. |
system-view |
N/A |
|
2. Configure a target host. |
·
(In non-FIPS mode.) Send traps to the target
host: ·
(In FIPS mode.) Send traps to the target host: ·
(In non-FIPS mode.) Send informs to the target
host: ·
(In FIPS mode.) Send informs to the
target host: |
By default, no target host is configured. |
|
3. (Optional.) Configure a source address for notifications. |
snmp-agent { inform | trap } source interface-type { interface-number | interface-number.subnumber } |
By default, SNMP uses the IP address of the outgoing routed interface as the source IP address. |
|
4. (Optional.) Enable extended linkUp/linkDown notifications. |
snmp-agent trap if-mib link extended |
By default, the SNMP agent sends standard linkup/linkDown notifications. |
|
5. (Optional.) Set the notification queue size. |
snmp-agent trap queue-size size |
By default, the notification queue can hold 100 notification messages. |
|
6. (Optional.) Set the notification lifetime. |
snmp-agent trap life seconds |
The default notification lifetime is 120 seconds. |
Displaying the SNMP settings
Execute display commands in any view.
|
Task |
Command |
|
Display SNMP agent system information, including the contact, physical location, and SNMP version. |
display snmp-agent sys-info [ contact | location | version ] * |
|
Display SNMP agent statistics. |
display snmp-agent statistics |
|
Display the local engine ID. |
display snmp-agent local-engineid |
|
Display SNMP group information. |
display snmp-agent group [ group-name ] |
|
Display remote engine IDs. |
display snmp-agent remote { ipv4-address | ipv6 ipv6-address } |
|
Display basic information about the notification queue. |
display snmp-agent trap queue |
|
Display SNMP notifications enabling status for modules. |
display snmp-agent trap-list |
|
Display SNMPv3 user information. |
display snmp-agent usm-user [ engineid engineid | username user-name | group group-name ] * |
|
Display SNMPv1 or SNMPv2c community information. (This command is not supported in FIPS mode.) |
display snmp-agent community [ read | write ] |
|
Display MIB view information. |
display snmp-agent mib-view [ exclude | include | viewname view-name ] |
|
Display SNMP MIB node information. |
display snmp-agent mib-node [ details | index-node | trap-node | verbose ] |
|
Display an SNMP context. |
display snmp-agent context [ context-name ] |
SNMPv1/SNMPv2c configuration example
The SNMPv1 configuration procedure is the same as the SNMPv2c configuration procedure. This example uses SNMPv1, and is not available in FIPS mode.
Network requirements
As shown in Figure 42, the NMS (1.1.1.2/24) uses SNMPv1 to manage the SNMP agent (1.1.1.1/24), and the agent automatically sends notifications to report events to the NMS.
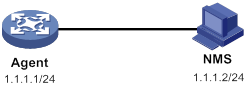
Configuration procedure
1. Configure the SNMP agent:
# Configure the IP address of the agent and make sure the agent and the NMS can reach each other. (Details not shown.)
# Specify SNMPv1, and create the read-only community public and the read and write community private.
<Agent> system-view
[Agent] snmp-agent sys-info version v1
[Agent] snmp-agent community read public
[Agent] snmp-agent community write private
# Configure contact and physical location information for the agent.
[Agent] snmp-agent sys-info contact Mr.Wang-Tel:3306
[Agent] snmp-agent sys-info location telephone-closet,3rd-floor
# Enable SNMP notifications, specify the NMS at 1.1.1.2 as an SNMP trap destination, and use public as the community name. (To make sure the NMS can receive traps, specify the same SNMP version in the snmp-agent target-host command as is configured on the NMS.)
[Agent] snmp-agent trap enable
[Agent] snmp-agent target-host trap address udp-domain 1.1.1.2 params securityname public v1
2. Configure the SNMP NMS:
? Specify SNMPv1.
? Create the read-only community public, and create the read and write community private.
? Set the timeout timer and maximum number of retries as needed.
For information about configuring the NMS, see the NMS manual.
|
|
NOTE: The SNMP settings on the agent and the NMS must match. |
Verifying the configuration
# Try to get the MTU value of NULL0 interface from the agent. The attempt succeeds.
Send request to 1.1.1.1/161 ...
Protocol version: SNMPv1
Operation: Get
Request binding:
1: 1.3.6.1.2.1.2.2.1.4.135471
Response binding:
1: Oid=ifMtu.135471 Syntax=INT Value=1500
Get finished
# Use a wrong community name to get the value of a MIB node on the agent. You can see an authentication failure trap on the NMS.
1.1.1.1/2934 V1 Trap = authenticationFailure
SNMP Version = V1
Community = public
Command = Trap
Enterprise = 1.3.6.1.4.1.43.1.16.4.3.50
GenericID = 4
SpecificID = 0
Time Stamp = 8:35:25.68
SNMPv3 configuration example
Network requirements
As shown in Figure 43, the NMS (1.1.1.2/24) uses SNMPv3 to monitor and manage the interface status of the agent (1.1.1.1/24). The agent automatically sends notifications to report events to the NMS. The default UDP port 162 is used for SNMP notifications.
The NMS and the agent perform authentication when they establish an SNMP session. The authentication algorithm is SHA-1 and the authentication key is 123456TESTauth&!. The NMS and the agent also encrypt the SNMP packets between them by using the AES algorithm and the privacy key 123456TESTencr&!.
Configuration procedure
Configuring SNMPv3 in RBAC mode
1. Configure the agent:
# Create user role test, and assign test read-only access to the objects under the snmpMIB node (OID: 1.3.6.1.6.3.1), including the linkUp and linkDown objects.
[Agent] role name test
[Agent-role-test] rule 1 permit read oid 1.3.6.1.6.3.1
# Assign user role test read-only access to the system node (OID: 1.3.6.1.2.1.1) and read-write access to the interfaces node (OID: 1.3.6.1.2.1.2).
[Agent-role-test] rule 2 permit read oid 1.3.6.1.2.1.1
[Agent-role-test] rule 3 permit read write oid 1.3.6.1.2.1.2
[Agent-role-test] quit
# Create SNMPv3 user RBACtest. Assign user role test to RBACtest. Set the authentication algorithm to sha, authentication key to 123456TESTauth&!, encryption algorithm to aes128, and privacy key to 123456TESTencr&!.
# Configure contact and physical location information for the agent.
[Agent] snmp-agent sys-info contact Mr.Wang-Tel:3306
[Agent] snmp-agent sys-info location telephone-closet,3rd-floor
# Enable notifications, specify the NMS at 1.1.1.2 as a notification destination, and set the username to RBACtest for the notifications.
[Agent] snmp-agent trap enable
[Agent] snmp-agent target-host trap address udp-domain 1.1.1.2 params securityname RBACtest v3 privacy
2. Configure the SNMP NMS:
? Specify SNMPv3.
? Create the SNMPv3 user RBACtest.
? Enable both authentication and privacy functions.
? Use SHA-1 for authentication and AES for encryption.
? Set the authentication key to 123456TESTauth&! and the privacy key to 123456TESTencr&!.
? Set the timeout timer and maximum number of retries.
For information about configuring the NMS, see the NMS manual.
|
|
NOTE: The SNMP settings on the agent and the NMS must match. |
Configuring SNMPv3 in VACM mode
1. Configure the agent:
# Configure the IP address of the agent, and make sure the agent and the NMS can reach each other. (Details not shown.)
# Create SNMPv3 group managev3group and assign managev3group read-only access to the objects under the snmpMIB node (OID: 1.3.6.1.2.1.2.2) in the test view, including the linkUp and linkDown objects.
<Agent> system-view
[Agent] undo snmp-agent mib-view ViewDefault
[Agent] snmp-agent mib-view included test snmpMIB
[Agent] snmp-agent group v3 managev3group privacy read-view test
# Assign SNMPv3 group managev3group read-write access to the objects under the system node (OID: 1.3.6.1.2.1.1) and interfaces node (OID: 1.3.6.1.2.1.2) in the test view.
[Agent] snmp-agent mib-view included test 1.3.6.1.2.1.1
[Agent] snmp-agent mib-view included test 1.3.6.1.2.1.2
[Agent] snmp-agent group v3 managev3group privacy read-view test write-view test
# Add user VACMtest to SNMPv3 group managev3group, and set the authentication algorithm to sha, authentication key to 123456TESTauth&!, encryption algorithm to aes128, and privacy key to 123456TESTencr&!.
[Agent] snmp-agent usm-user v3 VACMtest managev3group simple authentication-mode sha 123456TESTauth&! privacy-mode aes128 123456TESTencr&!
# Configure contact and physical location information for the agent.
[Agent] snmp-agent sys-info contact Mr.Wang-Tel:3306
[Agent] snmp-agent sys-info location telephone-closet,3rd-floor
# Enable notifications, specify the NMS at 1.1.1.2 as a trap destination, and set the username to VACMtest for the traps.
[Agent] snmp-agent trap enable
[Agent] snmp-agent target-host trap address udp-domain 1.1.1.2 params securityname VACMtest v3 privacy
2. Configure the SNMP NMS:
? Specify SNMPv3.
? Create the SNMPv3 user VACMtest.
? Enable both authentication and privacy functions.
? Use SHA-1 for authentication and AES for encryption.
? Set the authentication key to 123456TESTauth&! and the privacy key to 123456TESTencr&!.
? Set the timeout timer and maximum number of retries.
For information about configuring the NMS, see the NMS manual.
|
|
NOTE: The SNMP settings on the agent and the NMS must match. |
Verifying the configuration
· Use username RBACtest to access the agent.
# Retrieve the value of the sysName node. The value Agent is returned.
# Set the value for the sysName node to Sysname. The operation fails because the NMS does not have write access to the node.
# Shut down or bring up an interface on the agent. The NMS receives linkUP (OID: 1.3.6.1.6.3.1.1.5.4) or linkDown (OID: 1.3.6.1.6.3.1.1.5.3) notifications.
· Use username VACMtest to access the agent.
# Retrieve the value of the sysName node. The value Agent is returned.
# Set the value for the sysName node to Sysname. The operation succeeds.
# Shut down or bring up an interface on the agent. The NMS receives linkUP (OID: 1.3.6.1.6.3.1.1.5.4) or linkDown (OID: 1.3.6.1.6.3.1.1.5.3) notifications.
Configuring RMON
Overview
Remote Network Monitoring (RMON) is an enhancement to SNMP. It enables proactive remote monitoring and management of network devices and subnets. An RMON monitor periodically or continuously collects traffic statistics for the network attached to a port on the managed device. The managed device can automatically send a notification when a statistic crosses an alarm threshold, so the NMS does not need to constantly poll MIB variables and compare the results.
RMON uses SNMP notifications to notify NMSs of various alarm conditions such as broadcast traffic threshold exceeded. In contrast, SNMP reports function and interface operating status changes such as link up, link down, and module failure. For more information about SNMP notifications, see "Configuring SNMP."
H3C devices provide an embedded RMON agent as the RMON monitor. An NMS can perform basic SNMP operations to access the RMON MIB.
RMON groups
Among standard RMON groups, H3C implements the statistics group, history group, event group, alarm group, probe configuration group, and user history group. H3C also implements a private alarm group, which enhances the standard alarm group. The probe configuration group and user history group are not configurable from the CLI. To configure these two groups, you must access the MIB.
Statistics group
The statistics group samples traffic statistics for monitored Ethernet interfaces and stores the statistics in the Ethernet statistics table (ethernetStatsTable). The statistics include:
· Number of collisions.
· CRC alignment errors.
· Number of undersize or oversize packets.
· Number of broadcasts.
· Number of multicasts.
· Number of bytes received.
· Number of packets received.
The statistics in the Ethernet statistics table are cumulative sums.
History group
The history group periodically samples traffic statistics on interfaces and saves the history samples in the history table (etherHistoryTable). The statistics include:
· Bandwidth utilization.
· Number of error packets.
· Total number of packets.
The history table stores traffic statistics collected for each sampling interval.
Event group
The event group controls the generation and notifications of events triggered by the alarms defined in the alarm group and the private alarm group. The following are RMON alarm event handling methods:
· Log—Logs event information (including event time and description) in the event log table so the management device can get the logs through SNMP.
· Trap—Sends an SNMP notification when the event occurs.
· Log-Trap—Logs event information in the event log table and sends an SNMP notification when the event occurs.
· None—Takes no actions.
Alarm group
The RMON alarm group monitors alarm variables, such as the count of incoming packets (etherStatsPkts) on an interface. After you create an alarm entry, the RMON agent samples the value of the monitored alarm variable regularly. If the value of the monitored variable is greater than or equal to the rising threshold, a rising alarm event is triggered. If the value of the monitored variable is smaller than or equal to the falling threshold, a falling alarm event is triggered. The event group defines the action to take on the alarm event.
If an alarm entry crosses a threshold multiple times in succession, the RMON agent generates an alarm event only for the first crossing. For example, if the value of a sampled alarm variable crosses the rising threshold multiple times before it crosses the falling threshold, only the first crossing triggers a rising alarm event, as shown in Figure 44.
Figure 44 Rising and falling alarm events
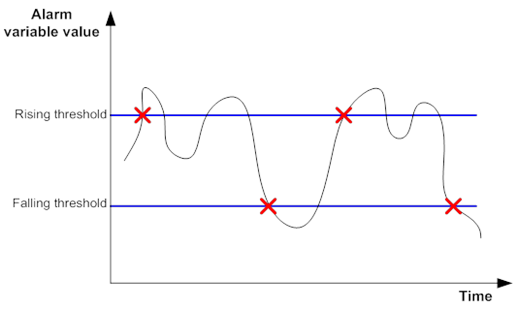
Private alarm group
The private alarm group enables you to perform basic math operations on multiple variables, and compare the calculation result with the rising and falling thresholds.
The RMON agent samples variables and takes an alarm action based on a private alarm entry as follows:
1. Samples the private alarm variables in the user-defined formula.
2. Processes the sampled values with the formula.
3. Compares the calculation result with the predefined thresholds, and then takes one of the following actions:
? Triggers the event associated with the rising alarm event if the result is equal to or greater than the rising threshold.
? Triggers the event associated with the falling alarm event if the result is equal to or less than the falling threshold.
If a private alarm entry crosses a threshold multiple times in succession, the RMON agent generates an alarm event only for the first crossing. For example, if the value of a sampled alarm variable crosses the rising threshold multiple times before it crosses the falling threshold, only the first crossing triggers a rising alarm event.
Sample types for the alarm group and the private alarm group
The RMON agent supports the following sample types:
· absolute—RMON compares the value of the monitored variable with the rising and falling thresholds at the end of the sampling interval.
· delta—RMON subtracts the value of the monitored variable at the previous sample from the current value, and then compares the difference with the rising and falling thresholds.
Protocols and standards
· RFC 4502, Remote Network Monitoring Management Information Base Version 2
· RFC 2819, Remote Network Monitoring Management Information Base Status of this Memo
Feature and hardware compatibility
The following matrix shows the feature and hardware compatibility:
|
Hardware |
RMON compatibility |
|
MSR810/810-W/810-W-DB/810-LM/810-W-LM/810-10-PoE/810-LM-HK/810-W-LM-HK |
Yes |
|
MSR810-LMS/810-LUS |
No |
|
MSR2600-6-X1/2600-10-X1 |
Yes |
|
MSR 2630 |
Yes |
|
MSR3600-28/3600-51 |
Yes |
|
MSR3600-28-SI/3600-51-SI |
Yes |
|
MSR3610-X1/3610-X1-DP/3610-X1-DC/3610-X1-DP-DC |
Yes |
|
MSR 3610/3620/3620-DP/3640/3660 |
Yes |
|
MSR5620/5660/5680 |
Yes |
|
Hardware |
RMON compatibility |
|
MSR810-LM-GL |
Yes |
|
MSR810-W-LM-GL |
Yes |
|
MSR830-6EI-GL |
Yes |
|
MSR830-10EI-GL |
Yes |
|
MSR830-6HI-GL |
Yes |
|
MSR830-10HI-GL |
Yes |
|
MSR2600-6-X1-GL |
Yes |
|
MSR3600-28-SI-GL |
Yes |
Configuring the RMON statistics function
RMON implements the statistics function through the Ethernet statistics group and the history group. The statistics function is available only for Layer 2 and Layer 3 Ethernet interfaces.
The Ethernet statistics group provides the cumulative statistic for a variable from the time the statistics entry is created to the current time. For more information about the configuration, see "Creating an RMON Ethernet statistics entry."
The history group provides statistics that are sampled for a variable for each sampling interval. The history group uses the history control table to control sampling, and it stores samples in the history table. For more information about the configuration, see "Creating an RMON history control entry."
Creating an RMON Ethernet statistics entry
|
Command |
Remarks |
|
|
1. Enter system view. |
system-view |
N/A |
|
2. Enter Ethernet interface view. |
interface interface-type interface-number |
N/A |
|
3. Create an RMON Ethernet statistics entry. |
rmon statistics entry-number [ owner text ] |
By default, no RMON Ethernet statistics entry exists. You can create one statistics entry for each Ethernet interface, and a maximum of 100 statistics entries on the device. After the entry limit is reached, you cannot add new entries. |
Creating an RMON history control entry
You can configure multiple history control entries for one interface, but you must make sure their entry numbers and sampling intervals are different.
You can create a history control entry successfully even if the specified bucket size exceeds the available history table size. RMON will set the bucket size as closely to the expected bucket size as possible.
To create an RMON history control entry:
|
Step |
Command |
Remarks |
|
1. Enter system view. |
system-view |
N/A |
|
2. Enter Ethernet interface view. |
interface interface-type interface-number |
N/A |
|
3. Create an RMON history control entry. |
rmon history entry-number buckets number interval interval [ owner text ] |
By default, no RMON history control entries exist. You can create a maximum of 100 history control entries. |
Configuring the RMON alarm function
When you configure the RMON alarm function, follow these guidelines:
· To send notifications to the NMS when an alarm is triggered, configure the SNMP agent as described in "Configuring SNMP" before configuring the RMON alarm function.
· For a new event, alarm, or private alarm entry to be created:
? The entry must not have the same set of parameters as an existing entry.
? The maximum number of entries is not reached.
Table 8 shows the parameters to be compared for duplication and the entry limits.
Table 8 RMON configuration restrictions
|
Entry |
Parameters to be compared |
Maximum number of entries |
|
Event |
· Event description (description string) · Event type (log, trap, logtrap, or none) · Community name (security-string) |
60 |
|
Alarm |
· Alarm variable (alarm-variable) · Sampling interval (sampling-interval) · Sample type (absolute or delta) · Rising threshold (threshold-value1) · Falling threshold (threshold-value2) |
60 |
|
Private alarm |
· Alarm variable formula (prialarm-formula) · Sampling interval (sampling-interval) · Sample type (absolute or delta) · Rising threshold (threshold-value1) · Falling threshold (threshold-value2) |
50 |
To configure the RMON alarm function:
|
Step |
Command |
Remarks |
|
1. Enter system view. |
system-view |
N/A |
|
2. (Optional.) Create an RMON event entry. |
rmon event entry-number [ description string ] { log | log-trap security-string | none | trap security-string } [ owner text ] |
By default, no RMON event entries exist. |
|
3. Create an RMON alarm entry. |
·
Create an RMON alarm entry: ·
Create an RMON private alarm entry: |
By default, no RMON alarm entries or RMON private alarm entries exist. You can associate an alarm with an event that has not been created yet. The alarm will trigger the event only after the event is created. |
Displaying and maintaining RMON settings
Execute display commands in any view.
|
Task |
Command |
|
Display RMON statistics. |
display rmon statistics [ interface-type interface-number] |
|
Display RMON history control entries and history samples. |
display rmon history [ interface-type interface-number ] |
|
Display RMON alarm entries. |
display rmon alarm [ entry-number ] |
|
Display RMON private alarm entries. |
display rmon prialarm [ entry-number ] |
|
Display RMON event entries. |
display rmon event [ entry-number ] |
|
Display log information for event entries. |
display rmon eventlog [ entry-number ] |
RMON configuration examples
Ethernet statistics group configuration example
Network requirements
As shown in Figure 45, create an RMON Ethernet statistics entry on the device to gather cumulative traffic statistics for GigabitEthernet 1/0/1.
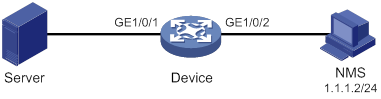
Configuration procedure
# Create an RMON Ethernet statistics entry for GigabitEthernet 1/0/1.
<Sysname> system-view
[Sysname] interface gigabitethernet 1/0/1
[Sysname-GigabitEthernet1/0/1] rmon statistics 1 owner user1
# Display statistics collected for GigabitEthernet 1/0/1.
<Sysname> display rmon statistics gigabitethernet 1/0/1
EtherStatsEntry 1 owned by user1 is VALID.
Interface : GigabitEthernet1/0/1<ifIndex.3>
etherStatsOctets : 21657 , etherStatsPkts : 307
etherStatsBroadcastPkts : 56 , etherStatsMulticastPkts : 34
etherStatsUndersizePkts : 0 , etherStatsOversizePkts : 0
etherStatsFragments : 0 , etherStatsJabbers : 0
etherStatsCRCAlignErrors : 0 , etherStatsCollisions : 0
etherStatsDropEvents (insufficient resources): 0
Incoming packets by size:
64 : 235 , 65-127 : 67 , 128-255 : 4
256-511: 1 , 512-1023: 0 , 1024-1518: 0
# Get the traffic statistics from the NMS through SNMP. (Details not shown.)
History group configuration example
Network requirements
As shown in Figure 46, create an RMON history control entry on the device to sample traffic statistics for GigabitEthernet 1/0/1 every minute.

Configuration procedure
# Create an RMON history control entry to sample traffic statistics every minute for GigabitEthernet 1/0/1. Retain a maximum of eight samples for the interface in the history statistics table.
<Sysname> system-view
[Sysname] interface gigabitethernet 1/0/1
[Sysname-GigabitEthernet1/0/1] rmon history 1 buckets 8 interval 60 owner user1
# Display the history statistics collected for GigabitEthernet 1/0/1.
[Sysname-GigabitEthernet1/0/1] display rmon history
HistoryControlEntry 1 owned by user1 is VALID
Sampled interface : GigabitEthernet1/0/1<ifIndex.3>
Sampling interval : 60(sec) with 8 buckets max
Sampling record 1 :
dropevents : 0 , octets : 834
packets : 8 , broadcast packets : 1
multicast packets : 6 , CRC alignment errors : 0
undersize packets : 0 , oversize packets : 0
fragments : 0 , jabbers : 0
collisions : 0 , utilization : 0
Sampling record 2 :
dropevents : 0 , octets : 962
packets : 10 , broadcast packets : 3
multicast packets : 6 , CRC alignment errors : 0
undersize packets : 0 , oversize packets : 0
fragments : 0 , jabbers : 0
collisions : 0 , utilization : 0
Sampling record 3 :
dropevents : 0 , octets : 830
packets : 8 , broadcast packets : 0
multicast packets : 6 , CRC alignment errors : 0
undersize packets : 0 , oversize packets : 0
fragments : 0 , jabbers : 0
collisions : 0 , utilization : 0
Sampling record 4 :
dropevents : 0 , octets : 933
packets : 8 , broadcast packets : 0
multicast packets : 7 , CRC alignment errors : 0
undersize packets : 0 , oversize packets : 0
fragments : 0 , jabbers : 0
collisions : 0 , utilization : 0
Sampling record 5 :
dropevents : 0 , octets : 898
packets : 9 , broadcast packets : 2
multicast packets : 6 , CRC alignment errors : 0
undersize packets : 0 , oversize packets : 0
fragments : 0 , jabbers : 0
collisions : 0 , utilization : 0
Sampling record 6 :
dropevents : 0 , octets : 898
packets : 9 , broadcast packets : 2
multicast packets : 6 , CRC alignment errors : 0
undersize packets : 0 , oversize packets : 0
fragments : 0 , jabbers : 0
collisions : 0 , utilization : 0
Sampling record 7 :
dropevents : 0 , octets : 766
packets : 7 , broadcast packets : 0
multicast packets : 6 , CRC alignment errors : 0
undersize packets : 0 , oversize packets : 0
fragments : 0 , jabbers : 0
collisions : 0 , utilization : 0
Sampling record 8 :
dropevents : 0 , octets : 1154
packets : 13 , broadcast packets : 1
multicast packets : 6 , CRC alignment errors : 0
undersize packets : 0 , oversize packets : 0
fragments : 0 , jabbers : 0
collisions : 0 , utilization : 0
# Get the traffic statistics from the NMS through SNMP. (Details not shown.)
Alarm function configuration example
Network requirements
As shown in Figure 47, configure the device to monitor the incoming traffic statistic on GigabitEthernet 1/0/1, and send RMON alarms when the following events occur:
· The 5-second delta sample for the traffic statistic crosses the rising threshold (100).
· The 5-second delta sample for the traffic statistic drops below the falling threshold (50).
Configuration procedure
# Configure the SNMP agent (the device) with the same SNMP settings as the NMS at 1.1.1.2. This example uses SNMPv1, read community public, and write community private.
<Sysname> system-view
[Sysname] snmp-agent
[Sysname] snmp-agent community read public
[Sysname] snmp-agent community write private
[Sysname] snmp-agent sys-info version v1
[Sysname] snmp-agent trap enable
[Sysname] snmp-agent trap log
[Sysname] snmp-agent target-host trap address udp-domain 1.1.1.2 params securityname public
# Create an RMON Ethernet statistics entry for GigabitEthernet 1/0/1.
[Sysname] interface gigabitethernet 1/0/1
[Sysname-GigabitEthernet1/0/1] rmon statistics 1 owner user1
[Sysname-GigabitEthernet1/0/1] quit
# Create an RMON event entry and an RMON alarm entry to send SNMP notifications when the delta sample for 1.3.6.1.2.1.16.1.1.1.4.1 exceeds 100 or drops below 50.
[Sysname] rmon event 1 trap public owner user1
[Sysname] rmon alarm 1 1.3.6.1.2.1.16.1.1.1.4.1 5 delta rising-threshold 100 1 falling-threshold 50 1 owner user1
|
|
NOTE: The string 1.3.6.1.2.1.16.1.1.1.4.1 is the object instance for GigabitEthernet 1/0/1. The digits before the last digit (1.3.6.1.2.1.16.1.1.1.4) represent the object for total incoming traffic statistics. The last digit (1) is the RMON Ethernet statistics entry index for GigabitEthernet 1/0/1. |
# Display the RMON alarm entry.
<Sysname> display rmon alarm 1
AlarmEntry 1 owned by user1 is VALID.
Sample type : delta
Sampled variable : 1.3.6.1.2.1.16.1.1.1.4.1<etherStatsOctets.1>
Sampling interval (in seconds) : 5
Rising threshold : 100(associated with event 1)
Falling threshold : 50(associated with event 1)
Alarm sent upon entry startup : risingOrFallingAlarm
Latest value : 0
# Display statistics for GigabitEthernet 1/0/1.
<Sysname> display rmon statistics gigabitethernet 1/0/1
EtherStatsEntry 1 owned by user1 is VALID.
Interface : GigabitEthernet1/0/1<ifIndex.3>
etherStatsOctets : 57329 , etherStatsPkts : 455
etherStatsBroadcastPkts : 53 , etherStatsMulticastPkts : 353
etherStatsUndersizePkts : 0 , etherStatsOversizePkts : 0
etherStatsFragments : 0 , etherStatsJabbers : 0
etherStatsCRCAlignErrors : 0 , etherStatsCollisions : 0
etherStatsDropEvents (insufficient resources): 0
Incoming packets by size :
64 : 7 , 65-127 : 413 , 128-255 : 35
256-511: 0 , 512-1023: 0 , 1024-1518: 0
# Query alarm events on the NMS. (Details not shown.)
On the device, alarm event messages are displayed when events occur. The following is a sample alarm event message:
[Sysname] % Apr 6 09:23:53:357 2013 sysname SNMP/6/SNMP_NOTIFY: Notification fallingA
larm(1.3.6.1.2.1.16.0.2) with alarmIndex(1.3.6.1.2.1.16.3.1.1.1.1)=1;alarmVariab
le(1.3.6.1.2.1.16.3.1.1.3.1)=1.3.6.1.2.1.16.1.1.1.4.1;alarmSampleType(1.3.6.1.2.
1.16.3.1.1.4.1)=2;alarmValue(1.3.6.1.2.1.16.3.1.1.5.1)=0;alarmFallingThreshold(1
.3.6.1.2.1.16.3.1.1.8.1)=50.
Configuring the Event MIB
Overview
The Event Management Information Base (Event MIB) provides the ability to monitor MIB objects on a local or remote system by using SNMP. It takes the notification or set action whenever a trigger condition is met.
The Event MIB is an enhancement to remote network monitoring (RMON):
· In addition to threshold tests, the Event MIB provides Boolean and existence tests for event triggers.
· When a trigger condition is met, the Event MIB sends a notification to the NMS, sets the value of a MIB object, or performs both operations.
Monitored objects
In the Event MIB, you can monitor the following MIB objects:
· Table node.
· Conceptual row node.
· Table column node.
· Simple leaf node.
· Parent node of a leaf node.
The monitored objects can be fully specified or wildcarded:
· To monitor a specific instance, for example, the description node for the interface with index 2 ifDescr.2, specify the monitored object ifDescr.2.
· To monitor multiple instances, for example, all instances of the interface description node ifDescr, configure the monitored objects to be wildcarded by using ifDescr.
Object owner
An object owner can only be an SNMPv3 user. You can assign the object owner the rights to access the monitored objects. For more information about SNMPv3 user access rights, see "Configuring SNMP."
Trigger test
Existence test
An existence test monitors and manages the absence, presence, and change of a MIB object, for example, interface status. When a monitored object is specified, the system reads the value of the monitored object regularly.
· If the test type is Absent, the system triggers an alarm event and takes the specified action when the monitored object disappears.
· If the test type is Present, the system triggers an alarm event and takes the specified action when the monitored object appears.
· If the test type is Changed, the system triggers an alarm event and takes the specified action when the value of the monitored object changes.
Boolean test
A Boolean test compares the value of the monitored object with the reference value and takes action according to the comparison result. The comparison types include unequal, equal, less, lessorequal, greater, and greaterorequal. For example, if the comparison type is equal, an event is triggered when the value of the monitored object equals the reference value. The event will not be triggered again until the value becomes unequal and comes back to equal.
Threshold test
A threshold test regularly compares the value of the monitored object with the threshold values.
· A rising alarm event is triggered if the value of the monitored object is greater than or equal to the rising threshold.
· A falling alarm event is triggered if the value of the monitored object is smaller than or equal to the falling threshold.
· A rising alarm event is triggered if the difference between the current sampled value and the previous sampled value is greater than or equal to the delta rising threshold.
· A falling alarm event is triggered if the difference between the current sampled value and the previous sampled value is smaller than or equal to the delta falling threshold.
· A falling alarm event is triggered if the values of the monitored object, the rising threshold, and the falling threshold are the same.
· A falling alarm event is triggered if the delta rising threshold, the delta falling threshold, and the difference between the current sampled value and the previous sampled value is the same.
The alarm management module defines the set or notification action to take on alarm events.
If the value of the monitored object crosses a threshold multiple times in succession, the managed device triggers an alarm event only for the first crossing. For example, if the value of a sampled object crosses the rising threshold multiple times before it crosses the falling threshold, only the first crossing triggers a rising alarm event, as shown in Figure 48.
Figure 48 Rising and falling alarm events
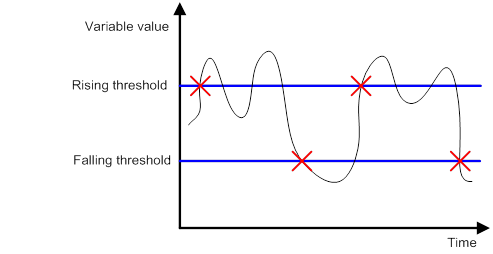
Event actions
The Event MIB triggers one or both of the following actions when the trigger condition is met:
· Set action—Uses SNMP to set the value of the monitored object.
· Notification action—Uses SNMP to send a notification to the NMS. If an object list is specified for the notification action, the notification will carry the object list.
Prerequisites
Before you configure the Event MIB, make sure the SNMP agent and NMS are configured correctly.
Event MIB configuration task list
To configure the Event MIB:
|
Tasks at a glance |
|
(Required.) Configuring Event MIB object lists |
|
(Required.) Configuring an event |
|
(Required.) Configuring a trigger · (Optional.) Configuring a Boolean trigger test · (Optional.) Configuring an existence trigger test · (Optional.) Configuring a threshold trigger test |
|
(Required.) Enabling SNMP notifications for Event MIB |
Configuring Event MIB sampling
|
Step |
Command |
Remarks |
|
1. Enter system view. |
system-view |
N/A |
|
2. (Optional.) Set the minimum sampling interval. |
By default, the minimum sampling interval is 1 second. Changing the minimum sampling interval does not affect the exiting instances. |
|
|
3. (Optional.) Configure the maximum number of sampled instances. |
By default, the maximum number of sampled instances is 0. Changing the maximum number of sampled instances does not affect the existing instances. |
Configuring Event MIB object lists
When you configure an Event MIB object list, specify its owner, name, and index. You can configure one or more object lists.
If a notification action is triggered by an event, the Event MIB object list specified for the notification action will be carried in the notification to the NMS.
To configure an object list:
|
Step |
Command |
Remarks |
|
1. Enter system view. |
system-view |
N/A |
|
2. Configure an Event MIB object list. |
snmp mib event object list owner objects-owner name objects-name objects-index oid object-identifier [ wildcard ] |
By default, no Event MIB object lists are configured. The owner must be an SNMPv3 user. |
Configuring an event
Creating an event
|
Step |
Command |
Remarks |
|
1. Enter system view. |
system-view |
N/A |
|
2. Create an event. |
By default, no event exists. The owner must be an SNMPv3 user. |
|
|
3. (Optional.) Configure a description for the event. |
description text |
By default, an event does not have a description. |
|
4. (Optional.) Specify an action for the event. |
By default, no action is specified for an event. |
|
|
5. Enable the event. |
By default, an event is disabled. To enable the event action for the Boolean, existence, or threshold trigger test, you must enable the event. |
Configuring a set action for an event
When you enable a set action, a set entry is created automatically. All fields in the entry have default values.
To configure a set action:
|
Step |
Command |
Remarks |
|
1. Enter system view. |
N/A |
|
|
2. Enter event view. |
N/A |
|
|
3. Enable the set action and enter set action view. |
N/A |
|
|
4. (Optional.) Specify an object for the set action. |
By default, no object is specified for the set action. |
|
|
5. (Optional.) Enable the OID to be wildcarded. |
By default, an object is fully specified. This command must be used in conjunction with the oid object-identifier command. |
|
|
6. (Optional.) Set a value for the object. |
The default value for the object is 0. |
|
|
7. (Optional.) Specify a context for the object. |
By default, no context is specified for an object. |
|
|
8. (Optional.) Enable the context to be wildcarded. |
By default, an object context is fully specified. This command must be used in conjunction with the context context-name command. |
Configuring a notification action for an event
When you enable a notification action, a notification entry is created automatically. All fields in the entry have default values.
To configure a notification action:
|
Step |
Command |
Remarks |
|
1. Enter system view. |
system-view |
N/A |
|
2. Enter event view |
snmp mib event owner event-owner name event-name |
N/A |
|
3. Enable the notification action and enter notification action view. |
N/A |
|
|
4. (Optional.) Specify a notification OID. |
By default, no notification OID is specified. |
|
|
5. (Optional.) Specify the object list to be added to the notification triggered by the event. |
By default, no object list is specified for the notification action. |
Configuring a trigger
You can specify a Boolean test, an existence test, or a threshold test for a trigger. For more information, see "Configuring a Boolean trigger test," "Configuring an existence trigger test," and "Configuring a threshold trigger test."
To configure a trigger:
|
Step |
Command |
Remarks |
|
1. Enter system view. |
system-view |
N/A |
|
2. Create a trigger and enter its view, or enter the view of an existing trigger. |
snmp mib event trigger owner trigger-owner name trigger-name |
By default, no triggers exist. The owner must be an SNMPv3 user. |
|
3. (Optional.) Configure a description for the trigger. |
By default, a trigger does not have a description. |
|
|
4. Set a sampling interval. |
By default, the sampling interval is 600 seconds. Make sure the sampling interval is greater than or equal to the Event MIB minimum sampling interval. |
|
|
5. Specify the sampling method. |
The default sampling method is absolute. |
|
|
6. Specify the object to be sampled. |
By default, the OID is 0.0. No object is specified for a trigger. The mteTriggerEnabled and mteTriggerTargetTag objects are read-only and cannot be sampled. |
|
|
7. (Optional.) Enable the OID to be wildcarded. |
By default, an object to be monitored is specified. This command must be used in conjunction with the oid object-identifier command. |
|
|
8. (Optional.) Configure a context for the monitored object. |
By default, no context is configured for a monitored object. |
|
|
9. (Optional.) Enable the context for the monitored object to be wildcarded. |
By default, a context for the monitored object is not wildcarded. This command must be used in conjunction with the context context-name command. |
|
|
10. (Optional.) Specify the object list to be added to the notification triggered by the event. |
By default, no object list is specified for a trigger. |
|
|
11. (Optional.) Specify a test type for the trigger. |
By default, no test type is specified for a trigger. |
|
|
12. (Optional.) Enable the trigger. |
By default, a trigger is disabled. |
Configuring a Boolean trigger test
When you enable a Boolean trigger test, a Boolean entry is created automatically. All fields in the entry have default values.
To configure a Boolean trigger test:
|
Step |
Command |
Remarks |
|
1. Enter system view. |
system-view |
N/A |
|
2. Enter trigger view. |
snmp mib event trigger owner trigger-owner name trigger-name |
N/A |
|
3. Enable Boolean trigger test and enter Boolean test view. |
N/A |
|
|
4. (Optional.) Specify a Boolean comparison type. |
comparison { equal | greater | greaterorequal | less | lessorequal | unequal } |
The default Boolean comparison type is unequal. |
|
5. (Optional.) Configure the event for the Boolean trigger test. |
By default, no event is configured for a Boolean trigger test. |
|
|
6. (Optional.) Specify the object list to be added to the notification triggered by the event. |
By default, no object list is specified for a Boolean trigger test. |
|
|
7. (Optional.) Enable the event to be triggered when the trigger condition is met at the first sampling. |
By default, the event is triggered when the trigger condition is met at the first sampling. |
|
|
8. (Optional.) Set a reference value for the Boolean trigger test. |
The default reference value for a Boolean trigger test is 0. |
Configuring an existence trigger test
When you enable an existence trigger test, an existence entry is created automatically. All fields in the entry have default values.
To configure an existence trigger test:
|
Step |
Command |
Remarks |
|
1. Enter system view. |
system-view |
N/A |
|
2. Enter trigger view. |
snmp mib event trigger owner trigger-owner name trigger-name |
N/A |
|
3. Enable existence trigger test and enter existence test view. |
N/A |
|
|
4. Specify the event for the existence trigger test. |
By default, no event is specified for an existence trigger test. The owner must be an SNMPv3 user. |
|
|
5. (Optional.) Specify the object list to be added to the notification triggered by the event. |
By default, no object list is specified for an existence trigger test. |
|
|
6. (Optional.) Specify an existence trigger test type. |
The default existence trigger test types are present and absent. |
|
|
7. (Optional.) Specify an existence trigger test type for the first sampling. |
For the first sampling, you must execute the startup { absent | present } command to enable the event trigger. By default, both the present and absent existence trigger test types are allowed for the first sampling. |
Configuring a threshold trigger test
When you enable a threshold trigger test, a threshold entry is created automatically. All fields in the entry have default values.
To configure a threshold trigger test:
|
Step |
Command |
Remarks |
|
1. Enter system view. |
system-view |
N/A |
|
2. Enter trigger view. |
snmp mib event trigger owner trigger-owner name trigger-name |
You can only specify an existing SNMPv3 user as the trigger owner. |
|
3. Enable threshold trigger test and enter threshold test view. |
test boolean |
N/A |
|
4. (Optional.) Specify the object list to be added to the notification triggered by the event. |
By default, no object list is specified for a threshold trigger test. The owner must be an SNMPv3 user. |
|
|
5. (Optional.) Specify the type of the threshold trigger test for the first sampling. |
For the first sampling, you must execute the startup { falling | rising | rising-or-falling } command to enable the event trigger. The default threshold trigger test type for the first sampling is rising-or-falling. |
|
|
6. (Optional.) Specify the delta falling threshold and the falling alarm event triggered when the sampled value is smaller than or equal to the threshold. |
delta falling { event owner event-owner name event-name | value integer-value } |
By default, the delta falling threshold is 0, and no falling alarm event is specified. |
|
7. (Optional.) Specify the delta rising threshold and the rising alarm event triggered when the sampled value is greater than or equal to the threshold. |
delta rising { event owner event-owner name event-name | value integer-value } |
By default, the delta rising threshold is 0, and no rising alarm event is specified. |
|
8. (Optional.) Specify the falling threshold and the falling alarm event triggered when the sampled value is smaller than or equal to the threshold. |
falling { event owner event-owner name event-name | value integer-value } |
By default, the falling threshold is 0, and no falling alarm event is specified. |
|
9. (Optional.) Specify the rising threshold and the ring alarm event triggered when the sampled value is greater than or equal to the threshold. |
rising { event owner event-owner name event-name | value integer-value } |
By default, the rising threshold is 0, and no rising alarm event is specified. |
Enabling SNMP notifications for Event MIB
To report critical Event MIB events to an NMS, enable SNMP notifications for Event MIB. For Event MIB event notifications to be sent correctly, you must also configure SNMP on the device. For more information about SNMP configuration, see the network management and monitoring configuration guide for the device.
To configure SNMP notifications for Event MIB:
|
Step |
Command |
Remarks |
|
1. Enter system view. |
system-view |
N/A |
|
2. Enable snmp notifications for Event MIB. |
snmp-agent trap enable event-mib |
By default, SNMP notifications are enabled for Event MIB. |
Displaying and maintaining the Event MIB
Execute display commands in any view.
|
Task |
Command |
|
Display global Event MIB configuration and statistics. |
|
|
Display trigger information. |
display snmp mib event trigger [ owner trigger-owner name trigger-name ] |
|
Display event information. |
display snmp mib event event [ owner event-owner name event-name ] |
|
Display object list information. |
display snmp mib event object list [ owner objects-owner name objects-name ] |
|
Display Event MIB configuration information. |
Event MIB configuration examples
Existence trigger test configuration example
Network requirements
As shown in Figure 49, the NMS uses SNMPv3 to monitor and manage the device.
· Configure the device to send notifications to the NMS.
· Configure a trigger and configure an existence trigger test for the trigger. When the trigger condition is met, the agent sends an mteTriggerFired notification to the NMS.

Configuration procedure
1. Configure the device:
# Add the user owner1 to the SNMPv3 group g3. Assign g3 the right to access the MIB view a.
[Device] snmp-agent usm-user v3 owner1 g3
[Device] snmp-agent group v3 g3 read-view a write-view a notify-view a
[Device] snmp-agent mib-view included a iso
# Set the SNMP context to contextnameA.
[Device] snmp-agent context contextnameA
# Configure the device to use the username owner1 to send SNMPv3 notifications to the NMS at 1.1.1.2.
[Device] snmp-agent target-host trap address udp-domain 1.1.1.2 params securityname owner1 v3
[Device] snmp-agent trap enable
[Device] quit
2. Enable the device to display Event MIB debugging information and logs on the current terminal.
The current terminal is enabled to display debugging logs.
<Device>terminal monitor
The current terminal is enabled to display logs.
<Device> debugging event-mib all
3. Set the minimum sampling interval to 50 seconds and the maximum number of sampled instances to 10.
[Device] snmp mib event sample minimum 50
[Device] snmp mib event sample instance maximum 10
4. Configure a trigger:
# Create a trigger. Specify its owner as owner1 and its name as triggerA.
[Device] snmp mib event trigger owner owner1 name triggerA
# Set the sampling interval to 60 seconds. Make sure the sampling interval is greater than or equal to the minimum sampling interval.
[Device-trigger-owner1-triggerA] frequency 60
# Specify a monitored object by its OID and enable wildcarded search for the OID.
[Device-trigger-owner1-triggerA] oid 1.3.6.1.2.1.2.2.1.1
[Device-trigger-owner1-triggerA] wildcard oid
# Configure the context contextnameA for the monitored object and enable wildcarded search for the context.
[Device-trigger-owner1-triggerA] context contextnameA
[Device-trigger-owner1-triggerA] wildcard context
# Specify the existence trigger test for the trigger.
[Device-trigger-owner1-triggerA] test existence
[Device-trigger-owner1-triggerA-existence] quit
# Enable the trigger.
[Device-trigger-owner1-triggerA] trigger enable
[Device-trigger-owner1-triggerA] quit
Verifying the configuration
# Display global Event MIB configuration and statistics.
[Device] display snmp mib event summary
TriggerFailures : 0
EventFailures : 0
SampleMinimum : 50
SampleInstanceMaximum : 10
SampleInstance : 2
SampleInstancesHigh : 2
SampleInstanceLacks : 0
# Display information about the trigger.
[Device] display snmp mib event trigger owner owner1 name triggerA
Trigger entry triggerA owned by owner1:
TriggerComment : N/A
TriggerTest : existence
TriggerSampleType : absoluteValue
TriggerValueID : 1.3.6.1.2.1.2.2.1.1<ifIndex>
TriggerValueIDWildcard : true
TriggerTargetTag : N/A
TriggerContextName : contextnameA
TriggerContextNameWildcard : true
TriggerFrequency(in seconds): 60
TriggerObjOwner : N/A
TriggerObjName : N/A
TriggerEnabled : true
Existence entry:
ExiTest : present | absent
ExiStartUp : present | absent
ExiObjOwner : N/A
ExiObjName : N/A
ExiEvtOwner : N/A
ExiEvtName : N/A
# Display Event MIB debugging information.
*Feb 8 20:42:59:367 2014 Device EVENTMIB/7/EVENTMIB_INFO:
Condition to generate the mteTriggerFired notification occurred.
TriggerOwner: owner1
TriggerName: triggerA
SampleType: absoluteValue
TriggerTest: Existence
Type of existence test: present
ValueID: 1.3.6.1.2.1.2.2.1.1.5185
Value of the mteTriggerValueID: 5185
ContextName: contextnameA
*Feb 8 20:42:59:367 2014 Device EVENTMIB/7/EVENTMIB_INFO:
Condition to generate the mteTriggerFired notification occurred.
TriggerOwner: owner1
TriggerName: triggerA
SampleType: absoluteValue
TriggerTest: Existence
Type of existence test: present
ValueID: 1.3.6.1.2.1.2.2.1.1.5313
Value of the mteTriggerValueID: 5313
ContextName: contextnameA
Boolean trigger test configuration example
Network requirements
As shown in Figure 49, the NMS uses SNMPv3 to monitor and manage the device.
· Configure the device to send notifications to the NMS.
· Configure a trigger and configure a Boolean trigger test for the trigger. When the trigger condition is met, the device sends an mteTriggerFired notification to the NMS.
Figure 50 Network diagram
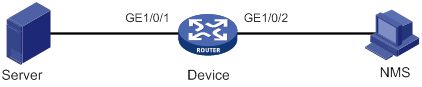
Configuration procedure
1. Configure the device:
# Add the user owner1 to the SNMPv3 group g3. Assign g3 the right to access the MIB view a.
<Device> system-view
[Device] snmp-agent usm-user v3 owner1 g3
[Device] snmp-agent group v3 g3 read-view a write-view a notify-view a
[Device] snmp-agent mib-view included a iso
# Configure the device to use the username owner1 to send SNMPv3 notifications to the NMS at 1.1.1.2.
[Device] snmp-agent target-host trap address udp-domain 1.1.1.2 params securityname owner1 v3
[Device] snmp-agent trap enable
[Device] quit
2. Enable the device to display Event MIB debugging information and logs on the current terminal.
<Device>terminal debugging
The current terminal is enabled to display debugging logs.
<Device>terminal monitor
The current terminal is enabled to display logs.
<Device> debugging event-mib all
3. Set the Event MIB minimum sampling interval to 50 seconds and the maximum number of sampled instances to 10.
<Device> system-view
[Device] snmp mib event sample minimum 50
[Device] snmp mib event sample instance maximum 10
4. Configure the Event MIB object lists. When a notification action is triggered, the system uses the object list owner and name specified in the object list command to match the object list.
[Device] snmp mib event object list owner owner1 name objectB 1 oid 1.3.6.1.4.1.25506.2.6.1.1.1.1.7.24
[Device] snmp mib event object list owner owner1 name objectC 1 oid 1.3.6.1.4.1.25506.2.6.1.1.1.1.8.24
5. Configure an event:
# Create an event. Specify its owner as owner1 and its name as EventA.
[Device] snmp mib event owner owner1 name EventA
# Specify the notification action for the event.
[Device-event-owner1-EventA] action notification
# Specify the OID for the notification.
[Device-event-owner1-EventA-notification] oid 1.3.6.1.4.1.25506.2.6.2.0.5
# Specify the object list to be added to the notification when the notification action is triggered
[Device-event-owner1-EventA-notification] object list owner owner1 name objectC
[Device-event-owner1-EventA-notification] quit
# Enable the event.
[Device-event-owner1-EventA] event enable
[Device-event-owner1-EventA] quit
6. Configure a trigger:
# Create a trigger. Specify its owner as owner1 and its name as triggerA.
[Device] snmp mib event trigger owner owner1 name triggerA
# Set the sampling interval to 60 seconds. Make sure the interval is greater than or equal to the global minimum sampling interval.
[Device-trigger-owner1-triggerA] frequency 60
# Specify the monitored object by its OID.
[Device-trigger-owner1-triggerA] oid 1.3.6.1.4.1.25506.2.6.1.1.1.1.9.24
# Specify the object list to be added to the notification when the notification action is triggered.
[Device-trigger-owner1-triggerA] object list owner owner1 name objectA
# Enable the Boolean trigger test. Specify the comparison type, reference value, event, and object list for the test.
[Device-trigger-owner1-triggerA] test existence
[Device-trigger-owner1-triggerA-existence] quit
[Device-trigger-owner1-triggerA-boolean] comparison greater
[Device-trigger-owner1-triggerA-boolean] value 10
[Device-trigger-owner1-triggerA-boolean] event owner owner1 name EventA
[Device-trigger-owner1-triggerA-boolean] object list owner owner1 name objectB
[Device-trigger-owner1-triggerA-boolean] quit
# Enable the trigger.
[Device-trigger-owner1-triggerA] trigger enable
[Device-trigger-owner1-triggerA] quit
Verifying the configuration
# Display global Event MIB configuration and statistics
[Device] display snmp mib event summary
TriggerFailures : 0
EventFailures : 0
SampleMinimum : 50
SampleInstanceMaximum : 10
SampleInstance : 1
SampleInstancesHigh : 1
SampleInstanceLacks : 0
# Display information about the Event MIB object lists.
[Device] display snmp mib event object list
Object list objectA owned by owner1:
ObjIndex : 1
ObjID : 1.3.6.1.4.1.25506.2.6.1.1.1.1.6.24<hh3cEntityExt
CpuUsage.24>
ObjIDWildcard : false
Object list objectB owned by owner1:
ObjIndex : 1
ObjID : 1.3.6.1.4.1.25506.2.6.1.1.1.1.7.24<hh3cEntityExt
CpuUsageThreshold.24>
ObjIDWildcard : false
Object list objectC owned by owner1:
ObjIndex : 1
ObjID : 1.3.6.1.4.1.25506.2.6.1.1.1.1.8.24<hh3cEntityExt
MemUsage.24>
ObjIDWildcard : false
# Display information about the event.
[Device]display snmp mib event event owner owner1 name EventA
Event entry EventA owned by owner1:
EvtComment : N/A
EvtAction : notification
EvtEnabled : true
Notification entry:
NotifyOID : 1.3.6.1.4.1.25506.2.6.2.0.5<hh3cEntityExtMemUsag
NotifyObjName : objectC
# Display information about the trigger.
[Device] display snmp mib event trigger owner owner1 name triggerA
Trigger entry triggerA owned by owner1:
TriggerComment : N/A
TriggerTest : boolean
TriggerSampleType : absoluteValue
TriggerValueID : 1.3.6.1.4.1.25506.2.6.1.1.1.1.9.24<hh3cEntityExt
MemUsageThreshold.24>
TriggerValueIDWildcard : false
TriggerTargetTag : N/A
TriggerContextName : N/A
TriggerContextNameWildcard : false
TriggerFrequency(in seconds): 60
TriggerObjOwner : owner1
TriggerObjName : objectA
TriggerEnabled : true
Boolean entry:
BoolCmp : greater
BoolValue : 10
BoolStartUp : true
BoolObjOwner : owner1
BoolObjName : objectB
BoolEvtOwner : owner1
BoolEvtName : EventA
# Display Event MIB debugging information.
*Feb 8 22:02:51:185 2014 Device EVENTMIB/7/EVENTMIB_INFO:-
Condition to generate the mteTriggerFired notification occurred.
TriggerOwner: owner1
TriggerName: triggerA
SampleType: absoluteValue
TriggerTest: Boolean
Type of boolean comparison: greater
Boolean comparison value: 10
ValueID: 1.3.6.1.4.1.25506.2.6.1.1.1.1.9.24
Value of the mteTriggerValueID: 100
ContextName: contextnameA
Threshold trigger test configuration example
Network requirements
As shown in Figure 49, the NMS uses SNMPv3 to monitor and manage the device.
· Configure the device to send notifications to the NMS.
· Configure a trigger and configure a threshold trigger test for the trigger. When the trigger conditions are met, the agent sent an mteTriggerFired notification to the NMS.
Figure 51 Network diagram
Configuration procedure
1. Configure the device:
# Add the user named owner1 to the SNMPv3 group g3. Assign g3 the right to access the MIB view a.
<Device> system-view
[Device] snmp-agent usm-user v3 owner1 g3
[Device] snmp-agent group v3 g3 read-view a write-view a notify-view a
[Device] snmp-agent mib-view included a iso
# Configure the agent to use the username owner1 to send SNMPv3 notifications to the NMS at 1.1.1.2.
[Device] snmp-agent target-host trap address udp-domain 1.1.1.2 params securityname owner1 v3
[Device] snmp-agent trap enable
[Device] quit
2. Enable the device to display Event MIB debugging information and logs on the current terminal.
<Device>terminal debugging
The current terminal is enabled to display debugging logs.
<Device>terminal monitor
The current terminal is enabled to display logs.
<Device> debugging event-mib all
3. Set the Event MIB minimum sampling interval to 50 seconds and the maximum number of sampled instances to 10.
<Device> system-view
[Device] snmp mib event sample minimum 50
[Device] snmp mib event sample instance maximum 10
4. Configure a trigger:
# Create a trigger. Specify its owner as owner1 and its name as triggerA.
[Device] snmp mib event trigger owner owner1 name triggerA
# Set the sampling interval to 60 seconds. Make sure the interval is greater than or equal to the Event MIB minimum sampling interval.
[Device-trigger-owner1-triggerA] frequency 60
# Specify the monitored object.
[Device-trigger-owner1-triggerA] oid 1.3.6.1.2.1.16.3.1.1.5.1
# Enable the threshold trigger test. Specify the rising threshold, falling threshold, delta rising threshold, and delta falling threshold for the test.
[Device-trigger-owner1-triggerA] test threshold
[Device-trigger-owner1-triggerA-threshold] rising value 3
[Device-trigger-owner1-triggerA-threshold] falling value 1
[Device-trigger-owner1-triggerA-threshold] delta rising value 3
[Device-trigger-owner1-triggerA-threshold] delta falling value 1
[Device-trigger-owner1-triggerA-threshold] quit
# Enable the trigger.
[Device-trigger-owner1-triggerA] trigger enable
[Device-trigger-owner1-triggerA] quit
Verifying the configuration
# Display global Event MIB configuration and statistics.
[Device] display snmp mib event summary
TriggerFailures : 0
EventFailures : 0
SampleMinimum : 50
SampleInstanceMaximum : 10
SampleInstance : 1
SampleInstancesHigh : 1
SampleInstanceLacks : 0
# Display information about the trigger.
[Device] display snmp mib event trigger owner owner1 name triggerA
Trigger entry triggerA owned by owner1:
TriggerComment : N/A
TriggerTest : threshold
TriggerSampleType : absoluteValue
TriggerValueID : 1.3.6.1.2.1.16.3.1.1.5.1<alarmValue.1>
TriggerValueIDWildcard : false
TriggerTargetTag : N/A
TriggerContextName : N/A
TriggercontextNameWildcard : false
TriggerFrequency(in seconds): 60
TriggerObjOwner : N/A
TriggerObjName : N/A
TriggerEnabled : true
Threshold entry:
ThresStartUp : risingOrFalling
ThresRising : 3
ThresFalling : 1
ThresDeltaRising : 3
ThresDeltaFalling : 1
ThresObjOwner : N/A
ThresObjName : N/A
ThresRisEvtOwner : N/A
ThresRisEvtName : N/A
ThresFalEvtOwner : N/A
ThresFalEvtName : N/A
ThresDeltaRisEvtOwner : N/A
ThresDeltaRisEvtName : N/A
ThresDeltaFalEvtOwner : N/A
ThresDeltaFalEvtName : N/A
# Display Event MIB debugging information.
*Feb 8 22:02:51:185 2014 Device EVENTMIB/7/EVENTMIB_INFO:-
Condition to generate the mteTriggerFired notification occurred.
TriggerOwner: owner1
TriggerName: triggerA
SampleType: absoluteValue
TriggerTest: Threshold
Rising: 3
ValueID: 1.3.6.1.2.1.16.3.1.1.5.1
Value of the mteTriggerValueID: 5
ContextName: contextnameA
*Feb 8 22:02:51:185 2014 Device EVENTMIB/7/EVENTMIB_INFO:-
Condition to generate the mteTriggerFired notification occurred.
TriggerOwner: owner1
TriggerName: triggerA
SampleType: absoluteValue
TriggerTest: Threshold
Deltafalling: 1
ValueID: 1.3.6.1.2.1.16.3.1.1.5.1
Value of the mteTriggerValueID: 5
ContextName: contextnameA
Configuring NETCONF
Overview
Network Configuration Protocol (NETCONF) is an XML-based network management protocol with filtering capabilities. It provides programmable mechanisms to manage and configure network devices. Through NETCONF, you can configure device parameters, retrieve parameter values, and get statistics information.
In NETCONF messages, each data item is contained in a fixed element. This enables different devices of the same vendor to provide the same access method and the same result presentation method. For the devices of different vendors, XML mapping in NETCONF messages can achieve the same effect. For a network environment containing different devices regardless of vendors, you can develop a NETCONF-based NMS system to configure and manage devices in a simple and effective way.
NETCONF structure
NETCONF has four layers: content layer, operations layer, RPC layer, and transport protocol layer.
Table 9 NETCONF layers and XML layers
|
NETCONF layer |
XML layer |
Description |
|
Content |
Configuration data, status data, and statistics information |
The content layer contains a set of managed objects, which can be configuration data, status data, and statistics information. For information about the operable data, see the NETCONF XML API reference for the device. |
|
Operations |
<get>,<get-config>,<edit-config>… |
The operations layer defines a set of base operations invoked as RPC methods with XML-encoded parameters. NETCONF base operations include data retrieval operations, configuration operations, lock operations, and session operations. For the device supported operations, see "Appendix A Supported NETCONF operations." |
|
RPC |
<rpc>,<rpc-reply> |
The RPC layer provides a simple, transport-independent framing mechanism for encoding RPCs. The <rpc> and <rpc-reply> elements are used to enclose NETCONF requests and responses (data at the operations layer and the content layer). |
|
Transport Protocol |
·
In non-FIPS mode: ·
In FIPS mode: |
The transport protocol layer provides reliable, connection-oriented, serial data links. In non-FIPS mode, the following login methods are available: · You can log in through Telnet, SSH, or the console port to perform NETCONF operations at the CLI. · You can log in through HTTP or HTTPS to perform NETCONF operations in the Web interface or perform NETCONF-over-SOAP operations. In FIPS mode, all login methods are the same as in non-FIPS mode except that you cannot use HTTP or Telnet. |
NETCONF message format
NETCONF
All NETCONF messages are XML-based and comply with RFC 4741. Any incoming NETCONF messages must pass XML Schema check before it can be processed. If a NETCONF message fails XML Schema check, the device sends an error message to the client.
For information about the NETCONF operations supported by the device and the operable data, see the NETCONF XML API reference for the device.
The following example shows a NETCONF message for getting all parameters of all interfaces on the device:
<?xml version="1.0" encoding="utf-8"?>
<rpc message-id="100" xmlns="urn:ietf:params:xml:ns:netconf:base:1.0">
<get-bulk>
<filter type="subtree">
<top xmlns="http://www.h3c.com/netconf/data:1.0">
<Ifmgr>
<Interfaces>
<Interface/>
</Interfaces>
</Ifmgr>
</top>
</filter>
</get-bulk>
</rpc>
NETCONF over SOAP
All NETCONF over SOAP messages are XML-based and comply with RFC 4741. NETCONF messages are contained in the <Body> element of SOAP messages. NETCONF over SOAP messages also comply with the following rules:
· SOAP messages must use the SOAP Envelope namespaces.
· SOAP messages must use the SOAP Encoding namespaces.
· SOAP messages cannot contain the following information:
? DTD reference.
? XML processing instructions.
The following example shows a NETCONF over SOAP message for getting all parameters of all interfaces on the device:
<env:Envelope xmlns:env="http://www.w3.org/2003/05/soap-envelope">
<env:Header>
<auth:Authentication env:mustUnderstand="1" xmlns:auth="http://www.h3c.com/netconf/base:1.0">
<auth:AuthInfo>800207F0120020C</auth:AuthInfo>
</auth:Authentication>
</env:Header>
<env:Body>
<rpc message-id="100" xmlns="urn:ietf:params:xml:ns:netconf:base:1.0">
<get-bulk>
<filter type="subtree">
<top xmlns="http://www.h3c.com/netconf/data:1.0">
<Ifmgr>
<Interfaces>
<Interface/>
</Interfaces>
</Ifmgr>
</top>
</filter>
</get-bulk>
</rpc>
</env:Body>
</env:Envelope>
How to use NETCONF
You can use NETCONF to manage and configure the device by using the methods in Table 10.
Table 10 NETCONF methods for configuring the device
|
Configuration tool |
Login method |
Remarks |
|
CLI |
· Console port · SSH · Telnet |
To implement NETCONF operations, copy valid NETCONF messages to the CLI in XML view. This method is suitable for R&D and test purposes. |
|
Standard Web interface for the device |
·
In FIPS mode: · In non-FIPS mode: ? HTTP ? HTTPS |
The system automatically converts the configuration operations on the Web interface to NETCONF messages and sends them to the device to implement NETCONF operations. This method is the most commonly used method. |
|
Custom Web interface |
N/A |
To use this method, you must enable NETCONF over SOAP. By default, the device cannot interpret Custom Web interfaces' URLs. For the device to interpret these URLs, you must encode the NETCONF messages sent from a custom Web interface in SOAP. Table 11 shows the hardware compatibility for this configuration method. |
Table 11 Custom Web interface configuration method and hardware compatibility
|
Hardware |
Custom Web interface compatibility |
|
MSR810/810-W/810-W-DB/810-LM/810-W-LM/810-10-PoE/810-LM-HK/810-W-LM-HK |
Yes |
|
MSR810-LMS/810-LUS |
No |
|
MSR2600-6-X1/2600-10-X1 |
Yes |
|
MSR 2630 |
Yes |
|
MSR3600-28/3600-51 |
Yes |
|
MSR3600-28-SI/3600-51-SI |
No |
|
MSR 3610/3620/3620-DP/3640/3660 |
Yes |
|
MSR3610-X1/3610-X1-DP/3610-X1-DC/3610-X1-DP-DC |
Yes |
|
MSR5620/5660/5680 |
No |
Protocols and standards
· RFC 3339, Date and Time on the Internet: Timestamps
· RFC 4741, NETCONF Configuration Protocol
· RFC 4742, Using the NETCONF Configuration Protocol over Secure SHell (SSH)
· RFC 4743, Using NETCONF over the Simple Object Access Protocol (SOAP)
· RFC 5277, NETCONF Event Notifications
· RFC 5381, Experience of Implementing NETCONF over SOAP
· RFC 5539, NETCONF over Transport Layer Security (TLS)
· RFC 6241, Network Configuration Protocol
FIPS compliance
The device supports the FIPS mode that complies with NIST FIPS 140-2 requirements. Support for features, commands, and parameters might differ in FIPS mode (see Security Configuration Guide) and non-FIPS mode.
NETCONF configuration task list
|
Task at a glance |
|
(Optional.) Configuring NETCONF over SOAP |
|
(Optional.) Enabling NETCONF over SSH |
|
(Optional.) Enabling NETCONF logging |
|
(Optional.) Configuring NETCONF to use module-specific namespaces |
|
(Required.) Establishing a NETCONF session |
|
(Optional.) Subscribing to event notifications |
|
(Optional.) Locking/unlocking the configuration |
|
(Optional.) Performing the <get>/<get-bulk> operation |
|
(Optional.) Performing the <get-config>/<get-bulk-config> operation |
|
(Optional.) Performing the <edit-config> operation |
|
(Optional.) Saving, rolling back, and loading the configuration |
|
(Optional.) Filtering data |
|
(Optional.) Performing CLI operations through NETCONF |
|
(Optional.) Retrieving NETCONF session information |
|
(Optional.) Terminating another NETCONF session |
|
(Optional.) Returning to the CLI |
Configuring NETCONF over SOAP
NETCONF over SOAP encapsulates NETCONF messages into SOAP messages and transmits the SOAP messages over HTTP or HTTPS. You can use a custom user interface to establish a NETCONF over SOAP session to the device and perform NETCONF operations.
To configure NETCONF over SOAP:
|
Step |
Command |
Remark |
|
1. Enter system view. |
system-view |
N/A |
|
2. Enable NETCONF over SOAP. |
·
Enable NETCONF over SOAP over HTTP (not
available in FIPS mode): ·
Enable NETCONF over SOAP over HTTPS: |
By default, the NETCONF over SOAP feature is disabled. |
|
3. Apply an IPv4 ACL to control NETCONF over SOAP access. |
·
Apply an IPv4 ACL to control NETCONF over SOAP
over HTTP access (not available in FIPS mode): ·
Apply an IPv4 ACL to control NETCONF over SOAP
over HTTPS access: |
By default, no IPv4 ACL is applied to control NETCONF over SOAP access. |
|
4. Specify a mandatory authentication domain for NETCONF users. |
netconf soap domain domain-name |
By default, no mandatory authentication domain is specified for NETCONF users. For information about authentication domains, see AAA in Security Configuration Guide. |
Enabling NETCONF over SSH
This feature allows users to use a client to perform NETCONF operations on the device through a NETCONF over SSH connection.
To enable NETCONF over SSH:
|
Step |
Command |
Remark |
|
1. Enter system view. |
system-view |
N/A |
|
2. Enable NETCONF over SSH. |
netconf ssh server enable |
By default, NETCONF over SSH is disabled. |
|
3. Specify a port to listen for NETCONF over SSH connections. |
netconf ssh server port port-number |
By default, port 830 listens for NETCONF over SSH connections. |
|
4. Apply an IPv4 ACL to control NETCONF over SSH access. |
netconf ssh acl { ipv4-acl-number | name ipv4-acl-name } |
By default, no IPv4 ACL is applied to control NETCONF over SSH access. |
Enabling NETCONF logging
NETCONF generates logs for different NETCONF operation sources and NETCONF operations.
To enable NETCONF logging:
|
Step |
Command |
Remarks |
|
1. Enter system view. |
system-view |
N/A |
|
2. Enable NETCONF logging. |
netconf log source { all | { agent | soap | web } * } { { protocol-operation { all | { action | config | get | set | session | syntax | others } * } } | verbose } |
By default, NETCONF logging is disabled. |
Configuring NETCONF to use module-specific namespaces
About module-specific namespaces for NETCONF
NETCONF supports the following types of namespaces:
· Common namespace—The common namespace is shared by all modules. In a packet that uses the common namespace, the namespace is indicated in the <top> element, and the modules are listed under the <top> element.
Example:
<rpc message-id="100" xmlns="urn:ietf:Params:xml:ns:netconf:base:1.0">
<get-bulk>
<filter type="subtree">
<top xmlns="http://www.h3c.com/netconf/data:1.0">
<Ifmgr>
<Interfaces>
</Interfaces>
</Ifmgr>
</top>
</filter>
</get-bulk>
</rpc>
· Module-specific namespace—Each module has its own namespace. A packet that uses a module-specific namespace does not have the <top> element. The namespace follows the module name.
Example:
<rpc message-id="100" xmlns="urn:ietf:params:xml:ns:netconf:base:1.0">
<get-bulk>
<filter type="subtree">
<Ifmgr xmlns="http://www.h3c.com/netconf/data:1.0-Ifmgr">
<Interfaces>
</Interfaces>
</Ifmgr>
</filter>
</get-bulk>
</rpc>
The common namespace is incompatible with module-specific namespaces. To set up a NETCONF session, the device and the client must use the same type of namespaces. By default, the common namespace is used. If the client does not support the common namespace, use this feature to configure the device to use module-specific namespaces.
Configuration restrictions and guidelines
For this feature to take effect, you must reestablish the NETCONF session.
Configuration procedure
To configure NETCONF to use module-specific namespaces:
|
Step |
Command |
Remark |
|
1. Enter system view. |
system-view |
N/A |
|
2. Configure NETCONF to use module-specific namespaces. |
netconf capability specific-namespace |
By default, the common namespace is used. |
Establishing a NETCONF session
After a NETCONF session is established, the device automatically sends its capabilities to the client. You must send the capabilities of the client to the device before you can perform any other NETCONF operations.
You can use the aaa session-limit command to set the maximum number of NETCONF sessions that the device can support. If the upper limit is reached, new NETCONF users cannot access the device. For information about this command, see Security Configuration Guide.
Before performing a NETCONF operation, make sure no other users are configuring or managing the device. If multiple users simultaneously configure or manage the device, the result might be different from what you expect.
Setting the NETCONF session idle timeout time
If no NETCONF packets are exchanged on a NETCONF session within the NETCONF session idle timeout time, the device tears down the session.
To set the NETCONF session idle timeout time:
|
Task |
Command |
Remarks |
|
1. Enter system view. |
system-view |
N/A |
|
2. Set the NETCONF session idle timeout time. |
netconf { soap | agent } idle-timeout minute |
By default, the NETCONF session idle timeout time is as follows: · 10 minutes for NETCONF over SOAP over HTTP sessions and NETCONF over SOAP over HTTPS sessions. · 0 minutes for NETCONF over SSH sessions, NETCONF over Telnet sessions, and NETCONF over console sessions. The sessions never time out. |
Entering XML view
|
Task |
Command |
Remarks |
|
Enter XML view. |
xml |
Available in user view. To ensure the format correctness of NETCONF messages in XML view, do not enter NETCONF messages manually. Copy and paste the messages. While the device is performing a NETCONF operation, do not perform any other operations, such as pasting a NETCONF message or pressing Enter. For the device to identify NETCONF messages, you must add end mark ]]>]]> at the end of each NETCONF message. Examples in this document do not have this end mark. Do add the end mark in actual operations. |
Exchanging capabilities
After you enter XML view, the client and the device exchange their capabilities before you can perform subsequent operations. The device automatically advertises its NETCONF capabilities to the client in a hello message as follows:
<?xml version="1.0" encoding="UTF-8"?><hello xmlns="urn:ietf:params:xml:ns:netconf:base:1.0"><capabilities><capability>urn:ietf:params:netconf:base:1.0</capability><capability>urn:ietf:params:netconf:capability:writable-running:1.0</capability><capability>urn:ietf:params:netconf:capability:notification:1.0</capability><capability>urn:ietf:params:netconf:capability:validate:1.0</capability><capability>urn:ietf:params:netconf:capability:interleave:1.0</capability><capability>urn:ietf:params:netconf:capability:rollback-on-error:1.0</capability><capability>urn:hp:params:netconf:capability:hp-netconf-ext:1.0</capability><capability>urn:hp:params:netconf:capability:hp-save-point::1.0</capability></capabilities><session-id>1</session-id></hello>]]>]]>
The <capabilities> element represents the capabilities supported by the device.
The <session-id> element represents the unique ID assigned to the current session.
After receiving the hello message from the device, copy the following message to notify the device of the capabilities (user-configurable) supported by the client:
<hello xmlns="urn:ietf:params:xml:ns:netconf:base:1.0">
<capabilities>
<capability>
capability-set
</capability>
</capabilities>
</hello>
Use a pair of <capability> and </capability> tags to enclose each capability set.
Subscribing to event notifications
After you subscribe to event notifications, the device sends event notifications to the NETCONF client when a subscribed event takes place on the device. The notifications include the code, group, severity, start time, and description of the events. The device supports only log subscription. For information about which event notifications you can subscribe to, see the system log messages reference for the device.
A subscription takes effect only on the current session. If the session is terminated, the subscription is automatically canceled.
You can send multiple subscription messages to subscribe to notification of multiple events.
Subscription procedure
# Copy the following message to the client to complete the subscription:
<?xml version="1.0" encoding="UTF-8"?>
<rpc message-id="100" xmlns="urn:ietf:params:xml:ns:netconf:base:1.0">
<create-subscription xmlns="urn:ietf:params:xml:ns:netconf:notification:1.0">
<stream>NETCONF</stream>
<filter>
<event xmlns="http://www.h3c.com/netconf/event:1.0">
<Code>code</Code>
<Group>group</Group>
<Severity>severity</Severity>
</event>
</filter>
<startTime>start-time</startTime>
<stopTime>stop-time</stopTime>
</create-subscription>
</rpc>
The <stream> element represents the event stream type supported by the device. Only NETCONF is supported.
The <event> element represents an event to which you have subscribed.
The <code> element represents a mnemonic symbol.
The <group> element represents the module name.
The <severity> element represents the severity level of the event.
The <start-time> element represents the start time of the subscription.
The <stop-time> element represents the end time of the subscription.
After receiving the subscription request from the client, the device returns a response in the following format if the subscription is successful:
<?xml version="1.0" encoding="UTF-8"?>
<rpc-reply message-id="100" xmlns:netconf="urn:ietf:params:xml:ns:netconf:base:1.0">
<ok/>
</rpc-reply>
If the subscription fails, the device returns an error message in the following format:
<?xml version="1.0" encoding="UTF-8"?>
<rpc-reply message-id="100" xmlns="urn:ietf:params:xml:ns:netconf:base:1.0">
<rpc-error>
<error-type>error-type</error-type>
<error-tag>error-tag</error-tag>
<error-severity>error-severity</error-severity>
<error-message xml:lang="en">error-message</error-message>
</rpc-error>
</rpc-reply>
For more information about error messages, see RFC 4741.
Example for subscribing to event notifications
Network requirements
Configure a client to subscribe to all events with no time limitation. After the subscription is successful, all events on the device are sent to the client before the session between the device and client is terminated.
Configuration procedure
# Enter XML view.
<Sysname> xml
# Notify the device of the NETCONF capabilities supported on the client.
<hello xmlns="urn:ietf:params:xml:ns:netconf:base:1.0">
<capabilities>
<capability>
urn:ietf:params:netconf:base:1.0
</capability>
</capabilities>
</hello>
# Subscribe to all events with no time limitation.
<rpc message-id="100" xmlns="urn:ietf:params:xml:ns:netconf:base:1.0">
<create-subscription xmlns ="urn:ietf:params:xml:ns:netconf:notification:1.0">
<stream>NETCONF</stream>
</create-subscription>
</rpc>
Verifying the configuration
# If the client receives the following response, the subscription is successful:
<?xml version="1.0" encoding="UTF-8"?>
<rpc-reply xmlns="urn:ietf:params:xml:ns:netconf:base:1.0" message-id="100">
<ok/>
</rpc-reply>
# If fan 1 on the device encounters problems, the device sends the following text to the client that has subscribed to all events:
<?xml version="1.0" encoding="UTF-8"?>
<notification xmlns="urn:ietf:params:xml:ns:netconf:notification:1.0">
<eventTime>2011-01-04T12:30:46</eventTime>
<event xmlns="http://www.h3c.com/netconf/event:1.0">
<Group>DEV</Group>
<Code>FAN_DIRECTION_NOT_PREFERRED</Code>
<Slot>6</Slot>
<Severity>Alert</Severity>
<context>Fan 1 airflow direction is not preferred on slot 6, please check it.</context>
</event>
</notification>
# When another client (192.168.100.130) logs in to the device, the device sends a notification to the client that has subscribed to all events:
<?xml version="1.0" encoding="UTF-8"?>
<notification xmlns="urn:ietf:params:xml:ns:netconf:notification:1.0">
<eventTime>2011-01-04T12:30:52</eventTime>
<event xmlns="http://www.h3c.com/netconf/event:1.0">
<Group>SHELL</Group>
<Code>SHELL_LOGIN</Code>
<Slot>6</Slot>
<Severity>Notification</Severity>
<context>VTY logged in from 192.168.100.130.</context>
</event>
</notification>
Locking/unlocking the configuration
The device supports multiple NETCONF sessions. Multiple users can simultaneously manage and monitor the device using NETCONF. During device configuration and maintenance or network troubleshooting, a user can lock the configuration to prevent other users from changing it. After that, only the user holding the lock can change the configuration, and other users can only read the configuration.
In addition, only the user holding the lock can release the lock. After the lock is released, other users can change the current configuration or lock the configuration. If the session of the user that holds the lock is terminated, the system automatically releases the lock.
Locking the configuration
# Copy the following text to the client to lock the configuration:
<?xml version="1.0" encoding="UTF-8"?>
<rpc message-id="100" xmlns="urn:ietf:params:xml:ns:netconf:base:1.0">
<lock>
<target>
<running/>
</target>
</lock>
</rpc>
After receiving the lock request, the device returns a response in the following format if the <lock> operation is successful:
<?xml version="1.0" encoding="UTF-8"?>
<rpc-reply message-id="100" xmlns="urn:ietf:params:xml:ns:netconf:base:1.0">
<ok/>
</rpc-reply>
Unlocking the configuration
# Copy the following text to the client to unlock the configuration:
<?xml version="1.0" encoding="UTF-8"?>
<rpc message-id="100" xmlns="urn:ietf:params:xml:ns:netconf:base:1.0">
<unlock>
<target>
<running/>
</target>
</unlock>
</rpc>
After receiving the unlock request, the device returns a response in the following format if the <unlock> operation is successful:
<?xml version="1.0" encoding="UTF-8"?>
<rpc-reply message-id="100" xmlns="urn:ietf:params:xml:ns:netconf:base:1.0">
<ok/>
</rpc-reply>
Example for locking the configuration
Network requirements
Lock the device configuration so that other users cannot change the device configuration.
Configuration procedure
# Enter XML view.
<Sysname> xml
# Notify the device of the NETCONF capabilities supported on the client.
<hello xmlns="urn:ietf:params:xml:ns:netconf:base:1.0">
<capabilities>
<capability>
urn:ietf:params:netconf:base:1.0
</capability>
</capabilities>
</hello>
# Lock the configuration.
<?xml version="1.0" encoding="UTF-8"?>
<rpc message-id="100" xmlns="urn:ietf:params:xml:ns:netconf:base:1.0">
<lock>
<target>
<running/>
</target>
</lock>
</rpc>
Verifying the configuration
If the client receives the following response, the <lock> operation is successful:
<?xml version="1.0" encoding="UTF-8"?>
<rpc-reply message-id="100" xmlns="urn:ietf:params:xml:ns:netconf:base:1.0">
<ok/>
</rpc-reply>
If another client sends a lock request, the device returns the following response:
<?xml version="1.0" encoding="UTF-8"?>
<rpc-reply message-id="100" xmlns="urn:ietf:params:xml:ns:netconf:base:1.0">
<rpc-error>
<error-type>protocol</error-type>
<error-tag>lock-denied</error-tag>
<error-severity>error</error-severity>
<error-message xml:lang="en"> Lock failed because the NETCONF lock is held by another session.</error-message>
<error-info>
<session-id>1</session-id>
</error-info>
</rpc-error>
</rpc-reply>
The output shows that the <lock> operation failed because the client with session ID 1 held the lock, and only the client holding the lock can release the lock.
Performing service operations
You can use NETCONF to perform service operations on the device, such as retrieving and modifying the specified information. The basic operations include <get>, <get-bulk>, <get-config>, <get-bulk-config>, and <edit-config>, which are used to retrieve all data, retrieve configuration data, and edit the data of the specified module. For more information, see the NETCONF XML API reference for the device.
|
|
NOTE: During a <get>, <get-bulk>, <get-config>, and <get-bulk-config> operation, NETCONF replaces unidentifiable characters in the retrieved data with question marks (?) before sending the data to the client. |
Performing the <get>/<get-bulk> operation
The <get> operation is used to retrieve device configuration and state information that match the conditions. In some cases, this operation leads to inefficiency.
The <get-bulk> operation is used to retrieve a number of data entries starting from the data entry next to the one with the specified index. One data entry contains a device configuration entry and a state information entry. The data entry quantity is defined by the count attribute, and the index is specified by the index attribute. The returned output does not include the index information. If you do not specify the index attribute, the index value starts with 1 by default.
The <get-bulk> operation retrieves all the rest data entries starting from the data entry next to the one with the specified index if either of the following conditions occurs:
· You do not specify the count attribute.
· The number of matching data entries is less than the value of the count attribute.
# Copy the following text to the client to perform the <get> operation:
<?xml version="1.0" encoding="UTF-8"?>
<rpc message-id="100" xmlns="urn:ietf:params:xml:ns:netconf:base:1.0">
<getoperation>
<filter>
<top xmlns="http://www.h3c.com/netconf/data:1.0">
Specify the module, submodule, table name, and column name
</top>
</filter>
</getoperation>
</rpc>
The <getoperation> element can be <get> or <get-bulk>. The <filter> element is used to filter data, and it can contain module name, submodule name, table name, and column name.
· If the module name and the submodule name are not provided, the operation retrieves the data for all modules and submodules. If a module name or a submodule name is provided, the operation retrieves the data for the specified module or submodule.
· If the table name is not provided, the operation retrieves the data for all tables. If a table name is provided, the operation retrieves the data for the specified table.
· If only the index column is provided, the operation retrieves the data for all columns. If the index column and other columns are provided, the operation retrieves the data for the index column and the specified columns.
The <get> and <get-bulk> messages are similar. A <get-bulk> message carries the count and index attributes. The following is a <get-bulk> message example:
<?xml version="1.0" encoding="UTF-8"?>
<rpc message-id ="100" xmlns="urn:ietf:params:xml:ns:netconf:base:1.0" xmlns:xc="http://www.h3c.com/netconf/base:1.0">
<get-bulk>
<filter type="subtree">
<top xmlns="http://www.h3c.com/netconf/data:1.0" xmlns:base="http://www.h3c.com/netconf/base:1.0">
<Syslog>
<Logs xc:count="5">
<Log>
<Index>10</Index>
</Log>
</Logs>
</Syslog>
</top>
</filter>
</get-bulk>
</rpc>
The count attribute complies with the following rules:
· The count attribute can be placed in the module node and table node. In other nodes, it cannot be resolved.
· When the count attribute is placed in the module node, a descendant node inherits this count attribute if the descendant node does not contain the count attribute.
When retrieving interface information, the device cannot identify whether an integer value for the <IfIndex> element represents an interface name or index. When retrieving VPN instance information, the device cannot identify whether an integer value for the <vrfindex> element represents a VPN name or index. To resolve the issue, you can use the valuetype attribute to specify the value type.
The valuetype attribute has the following values:
· name—The <IfIndex> or <vrfindex> element is carrying a name.
· index—The <IfIndex> or <vrfindex> element is carrying an index.
· auto—Default value. The device uses the value of the <IfIndex> or <vrfindex> element as a name for interface or VPN instance matching. If no match is found, the device uses the value as an index for interface or VPN instance matching.
The following example specifies an index-type value for the <IfIndex> element:
<rpc xmlns="urn:ietf:params:xml:ns:netconf:base:1.0">
<getoperation>
<filter>
<top xmlns="http://www.h3c.com/netconf/config:1.0" xmlns:base=”http://www.h3c.com/netconf/base:1.0”>
<VLAN>
<TrunkInterfaces>
<Interface>
<IfIndex base:valuetype="index">1</IfIndex>
</Interface>
</TrunkInterfaces>
</VLAN>
</top>
</filter >
</getoperation>
</rpc>
Verifying the configuration
After receiving the get-bulk request, the device returns a response in the following format if the operation is successful:
<?xml version="1.0"?>
<rpc-reply message-id="100" xmlns="urn:ietf:params:xml:ns:netconf:base:1.0">
<data>
Device state and configuration data
</data>
</rpc-reply>
Performing the <get-config>/<get-bulk-config> operation
The <get-config> and <get-bulk-config> operations are used to retrieve all non-default configurations, which are configured by means of CLI, MIB, and Web. The <get-config> and <get-bulk-config> messages can contain the <filter> element for filtering data.
The <get-config> and <get-bulk-config> messages are similar. The following is a <get-config> message example:
<?xml version="1.0"?>
<rpc message-id="100" xmlns="urn:ietf:params:xml:ns:netconf:base:1.0">
<get-config>
<source>
<running/>
</source>
<filter>
<top xmlns="http://www.h3c.com/netconf/config:1.0">
Specify the module name, submodule name, table name, and column name
</top>
</filter>
</get-config>
</rpc>
Verifying the configuration
After receiving the get-config request, the device returns a response in the following format if the operation is successful:
<?xml version="1.0"?>
<rpc-reply message-id="100" xmlns="urn:ietf:params:xml:ns:netconf:base:1.0">
<data>
All data matching the specified filter
</data>
</rpc-reply>
Performing the <edit-config> operation
The <edit-config> operation includes the following operations: merge, create, replace, remove, delete, default-operation, error-option, test-option, and incremental. For more information about the operations, see "Appendix A Supported NETCONF operations."
# Copy the following text to perform the <edit-config> operation:
<?xml version="1.0"?>
<rpc message-id="101" xmlns="urn:ietf:params:xml:ns:netconf:base:1.0">
<edit-config>
<target><running></running></target>
<error-option>
error-option
</error-option>
<config>
<top xmlns="http://www.h3c.com/netconf/config:1.0">
Specify the module name, submodule name, table name, and column name
</top>
</config>
</edit-config>
</rpc>
The <error-option> element indicates the action to be taken in response to an error that occurs during the operation. It has the following values:
· stop-on-error—Stops the operation.
· continue-on-error—Continues the operation.
· rollback-on-error—Rolls back the configuration to the configuration before the <edit-config> operation was performed.
By default, an <edit-config> operation cannot be performed while the device is rolling back the configuration. If the rollback time exceeds the maximum time that the client can wait, the client determines that the <edit-config> operation has failed and performs the operation again. Because the previous rollback is not completed, the operation triggers another rollback. If this process repeats itself, CPU and memory resources will be exhausted and the device will reboot. To allow an <edit-config> operation to be performed while the device is rolling back the configuration, perform an <action> operation to change the value of the DisableEditConfigWhenRollback attribute to false.
After receiving the edit-config request, the device returns a response in the following format if the operation is successful:
<?xml version="1.0">
<rpc-reply message-id="100" xmlns="urn:ietf:params:xml:ns:netconf:base:1.0">
<ok/>
</rpc-reply>
All-module configuration data retrieval example
Network requirements
Retrieve configuration data for all modules.
Configuration procedure
# Enter XML view.
<Sysname> xml
# Notify the device of the NETCONF capabilities supported on the client.
<hello xmlns="urn:ietf:params:xml:ns:netconf:base:1.0">
<capabilities>
<capability>
urn:ietf:params:netconf:base:1.0
</capability>
</capabilities>
</hello>
# Retrieve configuration data for all modules.
<rpc message-id="100" xmlns="urn:ietf:params:xml:ns:netconf:base:1.0">
<get-config>
<source>
<running/>
</source>
</get-config>
</rpc>
Verifying the configuration
If the client receives the following text, the <get-config> operation is successful:
<rpc-reply xmlns="urn:ietf:params:xml:ns:netconf:base:1.0" xmlns:web="urn:ietf:params:xml:ns:netconf:base:1.0" message-id="100">
<data>
<top xmlns="http://www.h3c.com/netconf/config:1.0">
<Ifmgr>
<Interfaces>
<Interface>
<IfIndex>1307</IfIndex>
<Shutdown>1</Shutdown>
</Interface>
<Interface>
<IfIndex>1308</IfIndex>
<Shutdown>1</Shutdown>
</Interface>
<Interface>
<IfIndex>1309</IfIndex>
<Shutdown>1</Shutdown>
</Interface>
<Interface>
<IfIndex>1311</IfIndex>
<VlanType>2</VlanType>
</Interface>
<Interface>
<IfIndex>1313</IfIndex>
<VlanType>2</VlanType>
</Interface>
</Interfaces>
</Ifmgr>
<Syslog>
<LogBuffer>
<BufferSize>120</BufferSize>
</LogBuffer>
</Syslog>
<System>
<Device>
<SysName>H3C</SysName>
<TimeZone>
<Zone>+11:44</Zone>
<ZoneName>beijing</ZoneName>
</TimeZone>
</Device>
</System>
<Fundamentals>
<WebUI>
<SessionAgingTime>98</SessionAgingTime>
</WebUI>
</Fundamentals>
</top>
</data>
</rpc-reply>
Syslog configuration data retrieval example
Network requirements
Retrieve configuration data for the Syslog module.
Configuration procedure
# Enter XML view.
<Sysname> xml
# Notify the device of the NETCONF capabilities supported on the client.
<hello xmlns="urn:ietf:params:xml:ns:netconf:base:1.0">
<capabilities>
<capability>
urn:ietf:params:netconf:base:1.0
</capability>
</capabilities>
</hello>
# Retrieve configuration data for the Syslog module.
<rpc message-id="100" xmlns="urn:ietf:params:xml:ns:netconf:base:1.0">
<get-config>
<source>
<running/>
</source>
<filter type="subtree">
<top xmlns="http://www.h3c.com/netconf/config:1.0">
<Syslog/>
</top>
</filter>
</get-config>
</rpc>
Verifying the configuration
If the client receives the following text, the <get-config> operation is successful:
<?xml version="1.0" encoding="UTF-8"?>
<rpc-reply xmlns="urn:ietf:params:xml:ns:netconf:base:1.0" message-id="100">
<data>
<top xmlns="http://www.h3c.com/netconf/config:1.0">
<Syslog>
<LogBuffer>
<BufferSize>120</BufferSize>
</LogBuffer>
</Syslog>
</top>
</data>
</rpc-reply>
Example for retrieving a data entry for the interface table
Network requirements
Retrieve a data entry for the interface table.
Configuration procedure
# Enter XML view.
<Sysname> xml
# Notify the device of the NETCONF capabilities supported on the client.
<hello xmlns="urn:ietf:params:xml:ns:netconf:base:1.0">
<capabilities>
<capability>urn:ietf:params:netconf:base:1.0</capability>
</capabilities>
</hello>
# Retrieve a data entry for the interface table.
<rpc message-id="100" xmlns="urn:ietf:params:xml:ns:netconf:base:1.0" xmlns:web="urn:ietf:params:xml:ns:netconf:base:1.0">
<get-bulk>
<filter type="subtree">
<top xmlns="http://www.h3c.com/netconf/data:1.0" xmlns:web="http://www.h3c.com/netconf/base:1.0">
<Ifmgr>
<Interfaces web:count="1">
</Interfaces>
</Ifmgr>
</top>
</filter>
</get-bulk>
</rpc>
Verifying the configuration
If the client receives the following text, the <get-bulk> operation is successful:
<rpc-reply xmlns="urn:ietf:params:xml:ns:netconf:base:1.0" xmlns:web="urn:ietf:params:xml:ns:netconf:base:1.0" message-id="100">
<data>
<top xmlns="http://www.h3c.com/netconf/data:1.0">
<Ifmgr>
<Interfaces>
<Interface>
<IfIndex>3</IfIndex>
<Name>GigabitEthernet1/0/2</Name>
<AbbreviatedName>GE1/0/2</AbbreviatedName>
<PortIndex>3</PortIndex>
<ifTypeExt>22</ifTypeExt>
<ifType>6</ifType>
<Description>GigabitEthernet 1/0/2 Interface</Description>
<AdminStatus>2</AdminStatus>
<OperStatus>2</OperStatus>
<ConfigSpeed>0</ConfigSpeed>
<ActualSpeed>100000</ActualSpeed>
<ConfigDuplex>3</ConfigDuplex>
<ActualDuplex>1</ActualDuplex>
</Interface>
</Interfaces>
</Ifmgr>
</top>
</data>
</rpc-reply>
Example for changing the value of a parameter
Network requirements
Change the log buffer size for the Syslog module to 512.
Configuration procedure
# Enter XML view.
<Sysname> xml
# Notify the device of the NETCONF capabilities supported on the client.
<hello xmlns="urn:ietf:params:xml:ns:netconf:base:1.0">
<capabilities>
<capability>urn:ietf:params:netconf:base:1.0</capability>
</capabilities>
</hello>
# Change the log buffer size for the Syslog module to 512.
<rpc message-id="100" xmlns="urn:ietf:params:xml:ns:netconf:base:1.0" xmlns:web="urn:ietf:params:xml:ns:netconf:base:1.0">
<edit-config>
<target>
<running/>
</target>
<config>
<top xmlns="http://www.h3c.com/netconf/config:1.0" web:operation="merge">
<Syslog>
<LogBuffer>
<BufferSize>512</BufferSize>
</LogBuffer>
</Syslog>
</top>
</config>
</edit-config>
</rpc>
Verifying the configuration
If the client receives the following text, the <edit-config> operation is successful:
<?xml version="1.0" encoding="UTF-8"?>
<rpc-reply message-id="100" xmlns="urn:ietf:params:xml:ns:netconf:base:1.0">
<ok/>
</rpc-reply>
Saving, rolling back, and loading the configuration
Use NETCONF to save, roll back, or load the configuration.
Performing the <save>, <rollback>, or <load> operation consumes a lot of system resources. Do not perform these operations when the system resources are heavily occupied.
By default, an <edit-config> operation cannot be performed while the device is rolling back the configuration. To allow an <edit-config> operation to be performed while the device is rolling back the configuration, perform an <action> operation to change the value of the DisableEditConfigWhenRollback attribute to false.
Saving the configuration
# Copy the following text to the client to save the device configuration to the specified file:
<?xml version="1.0" encoding="UTF-8"?>
<rpc message-id="100" xmlns="urn:ietf:params:xml:ns:netconf:base:1.0">
<save OverWrite="false" Binary-only="false">
<file>Specify the configuration file name</file>
</save>
</rpc>
The name of the specified configuration file must start with the storage media name and end with the.cfg extension. If the text includes the file column, you must specify the file name. The specified file will be used as the next-startup configuration file. If the text does not include the file column, the configuration is automatically saved to the default main next-startup configuration file.
The OverWrite attribute determines whether to overwrite the specified file if the file already exists.
· If the attribute uses the default value true, the current configuration is saved, and the original file is overwritten.
· If the attribute value is set to false, the current configuration cannot be saved, and the system displays an error message.
The Binary-only attribute determines whether to save the current configuration to the specified text configuration file.
· If the attribute uses the default value false, the device saves the configuration to both the text and binary configuration files.
· If you set the attribute to true, the device saves the configuration only to the binary file, and sets the corresponding text file as the next-startup configuration file.
? If the specified text file does not exist, the <save> operation fails.
? If the file column is not included, the device identifies whether there is a next-startup configuration file. If a next-startup configuration file exists, the device saves the configuration only to the corresponding binary file. If no next-startup configuration file exists, the <save> operation fails.
Saving the configuration to both the text and binary configuration files requires more time. If you want to perform the <save> operation frequently, set the Binary-only attribute to true.
After receiving the save request, the device returns a response in the following format if the <save> operation is successful:
<?xml version="1.0" encoding="UTF-8"?>
<rpc-reply message-id="100" xmlns="urn:ietf:params:xml:ns:netconf:base:1.0">
<ok/>
</rpc-reply>
Rolling back the configuration based on a configuration file
# Copy the following text to the client to roll back the configuration based on a configuration file:
<?xml version="1.0" encoding="UTF-8"?>
<rpc message-id="100" xmlns="urn:ietf:params:xml:ns:netconf:base:1.0">
<rollback>
<file>Specify the configuration file name</file>
</rollback>
</rpc>
After receiving the rollback request, the device returns a response in the following format if the <rollback> operation is successful:
<?xml version="1.0" encoding="UTF-8"?>
<rpc-reply message-id="100" xmlns="urn:ietf:params:xml:ns:netconf:base:1.0">
<ok/>
</rpc-reply>
Rolling back the configuration based on a rollback point
You can roll back the running configuration based on a rollback point when one of the following situations occurs:
· A NETCONF client sends a rollback request.
· The NETCONF session idle time is longer than the rollback idle timeout time.
· A NETCONF client is unexpectedly disconnected from the device.
To roll back the configuration based on a rollback point, perform the following tasks:
1. Lock the system.
Multiple users might simultaneously use NETCONF to configure the device. As a best practice, lock the system before rolling back the configuration to prevent other users from modifying the running configuration.
2. Mark the beginning of a <rollback> operation. For more information, see "Performing the <save-point/begin> operation."
3. Edit the device configuration. For more information, see "Performing the <edit-config> operation."
4. Configure the rollback point. For more information, see "Performing the <save-point/commit> operation."
You can repeat this step to configure multiple rollback points.
5. Roll back the configuration based on the rollback point. For more information, see "Performing the <save-point/rollback> operation."
The configuration can also be automatically rolled back based on the most recently configured rollback point when the NETCONF session idle time is longer than the rollback idle timeout time.
6. End the rollback configuration. For more information, see "Performing the <save-point/end> operation."
7. Release the lock.
Performing the <save-point/begin> operation
# Copy the following text to the client to mark the beginning of a <rollback> operation based on a rollback point:
<rpc message-id="100" xmlns="urn:ietf:params:xml:ns:netconf:base:1.0">
<save-point>
<begin>
<confirm-timeout>100</confirm-timeout>
</begin>
</save-point>
</rpc>
The <confirm-timeout> element specifies the rollback idle timeout time in the range of 1 to 65535 seconds (the default is 600 seconds). This element is optional.
After receiving the begin request, the device returns a response in the following format if the <begin> operation is successful:
<rpc-reply message-id="100" xmlns="urn:ietf:params:xml:ns:netconf:base:1.0">
<data>
<save-point>
<commit>
<commit-id>1</commit-id>
</commit>
</save-point>
</data>
</rpc-reply>
Performing the <save-point/commit> operation
The system supports a maximum of 50 rollback points. When the limit is reached, you must specify the force attribute to overwrite the earliest rollback point.
# Copy the following text to the client to configure the rollback point:
<rpc message-id="100" xmlns="urn:ietf:params:xml:ns:netconf:base:1.0">
<save-point>
<commit>
<label>SUPPORT VLAN<label>
<comment>vlan 1 to 100 and interfaces. Each vlan used for different custom as follows: ……</comment>
</commit>
</save-point>
</rpc>
The <label> and <comment> elements are optional.
After receiving the commit request, the device returns a response in the following format if the <commit> operation is successful:
<rpc-reply message-id="100" xmlns="urn:ietf:params:xml:ns:netconf:base:1.0">
<data>
<save-point>
<commit>
<commit-id>2</commit-id>
</commit>
</save-point>
</data>
</rpc-reply>
Performing the <save-point/rollback> operation
# Copy the following text to the client to roll back the configuration:
<rpc message-id="100" xmlns="urn:ietf:params:xml:ns:netconf:base:1.0">
<save-point>
<rollback>
<commit-id/>
<commit-index/>
<commit-label/>
</rollback>
</save-point>
</rpc>
The <commit-id> element uniquely identifies a rollback point.
The <commit-index> element specifies 50 most recently configured rollback points. The value of 0 indicates the most recently configured one and 49 indicates the earliest configured one.
The <commit-label> element exclusively specifies a label for a rollback point. The label is not required for a rollback point.
Specify one of these elements to roll back the specified configuration. If no element is specified, this operation rolls back configuration based on the most recently configured rollback point.
After receiving the rollback request, the device returns a response in the following format if the <rollback> operation is successful:
<rpc-reply message-id="100" xmlns="urn:ietf:params:xml:ns:netconf:base:1.0">
<ok></ok>
</rpc-reply>
Performing the <save-point/end> operation
# Copy the following text to the client to end the rollback configuration:
<rpc message-id="100" xmlns="urn:ietf:params:xml:ns:netconf:base:1.0">
<save-point>
<end/>
</save-point>
</rpc>
After receiving the end request, the device returns a response in the following format if the <end> operation is successful:
<rpc-reply message-id="100" xmlns="urn:ietf:params:xml:ns:netconf:base:1.0">
<ok/>
</rpc-reply>
Performing the <save-point/get-commits> operation
# Copy the following text to the client to get the rollback point configuration records:
<rpc message-id="100" xmlns="urn:ietf:params:xml:ns:netconf:base:1.0">
<save-point>
<get-commits>
<commit-id/>
<commit-index/>
<commit-label/>
</get-commits>
</save-point>
</rpc>
Specify one of the <commit-id>, <commit-index>, and <commit-label> elements to get the specified rollback point configuration records. If no element is specified, this operation gets records for all rollback point configurations. The following text is a <save-point>/<get-commits> request example:
<rpc message-id="100" xmlns="urn:ietf:params:xml:ns:netconf:base:1.0">
<save-point>
<get-commits>
<commit-label>SUPPORT VLAN</commit-label>
</get-commits>
</save-point>
</rpc>
After receiving the get commits request, the device returns a response in the following format if the <get-commits> operation is successful:
<rpc-reply message-id="100" xmlns="urn:ietf:params:xml:ns:netconf:base:1.0">
<data>
<save-point>
<commit-information>
<CommitID>2</CommitID>
<TimeStamp>Thu Oct 30 11:30:28 1980</TimeStamp>
<UserName>test</UserName>
<Label>SUPPORT VLAN</Label>
</commit-information>
</save-point>
</data>
</rpc-reply>
Performing the <save-point/get-commit-information> operation
# Copy the following text to the client to get the system configuration data corresponding to a rollback point:
<rpc message-id="100" xmlns="urn:ietf:params:xml:ns:netconf:base:1.0">
<save-point>
<get-commit-information>
<commit-information>
<commit-id/>
<commit-index/>
<commit-label/>
</commit-information>
<compare-information>
<commit-id/>
<commit-index/>
<commit-label/>
</compare-information
</get-commit-information>
</save-point>
</rpc>
Specify one of the <commit-id>, <commit-index>, and <commit-label> elements to get the configuration data corresponding to the specified rollback point. The <compare-information> element is optional. If no element is specified, this operation gets the configuration data corresponding to the most recently configured rollback point. The following text is a <save-point>/<get-commit-information> request example:
<rpc message-id="100" xmlns="urn:ietf:params:xml:ns:netconf:base:1.0">
<save-point>
<get-commit-information>
<commit-information>
<commit-label>SUPPORT VLAN</commit-label>
</commit-information>
</get-commit-information>
</save-point>
</rpc>
After receiving the get-commit-information request, the device returns a response in the following format if the <get-commit-information> operation is successful:
<rpc-reply message-id="100" xmlns="urn:ietf:params:xml:ns:netconf:base:1.0">
<data>
<save-point>
<commit-information>
<content>
…
interface vlan 1
…
</content>
</commit-information>
</save-point>
</data>
</rpc-reply>
Loading the configuration
After you perform the <load> operation, the loaded configurations are merged into the current configuration as follows:
· New configurations are directly loaded.
· Configurations that already exist in the current configuration are replaced by those loaded from the configuration file.
Some configurations in a configuration file might conflict with the existing configurations. For the configurations in the file to take effect, delete the existing conflicting configurations, and then load the configuration file.
# Copy the following text to the client to load a configuration file for the device:
<?xml version="1.0" encoding="UTF-8"?>
<rpc message-id="100" xmlns="urn:ietf:params:xml:ns:netconf:base:1.0">
<load>
<file>Specify the configuration file name</file>
</load>
</rpc>
The name of the specified configuration file must start with the storage media name and end with the .cfg extension.
After receiving the load request, the device returns a response in the following format if the <load> operation is successful:
<?xml version="1.0" encoding="UTF-8"?>
<rpc-reply message-id="100" xmlns="urn:ietf:params:xml:ns:netconf:base:1.0">
<ok/>
</rpc-reply>
Example for saving the configuration
Network requirements
Save the current configuration to configuration file my_config.cfg.
Configuration procedure
# Enter XML view.
<Sysname> xml
# Notify the device of the NETCONF capabilities supported on the client.
<hello xmlns="urn:ietf:params:xml:ns:netconf:base:1.0">
<capabilities>
<capability>
urn:ietf:params:netconf:base:1.0
</capability>
</capabilities>
</hello>
# Save the configuration of the device to configuration file my_config.cfg.
<?xml version="1.0" encoding="UTF-8"?>
<rpc message-id="100" xmlns="urn:ietf:params:xml:ns:netconf:base:1.0">
<save>
<file>my_config.cfg</file>
</save>
</rpc>
Verifying the configuration
If the client receives the following response, the <save> operation is successful:
<?xml version="1.0" encoding="UTF-8"?>
<rpc-reply message-id="100" xmlns="urn:ietf:params:xml:ns:netconf:base:1.0">
<ok/>
</rpc-reply>
Filtering data
You can define a filter to filter information when you perform a <get>, <get-bulk>, <get-config>, or <get-bulk-config> operation. Data filtering includes the following types:
· Table-based filtering—Filters table information.
· Column-based filtering—Filters information for a single column.
For table-based filtering to take effect, you must configure table-based filtering before column-based filtering.
Table-based filtering
You can specify a match criterion for the row attribute filter to implement table-based filtering, for example, IP address filtering. The namespace is http://www.h3c.com/netconf/base:1.0. For information about the support for table-based match, see NETCONF XML API documents.
# Copy the following text to the client to retrieve the longest data with VPN instance name vpn1, IP address 1.1.1.0, and mask length 24 from the IPv4 routing table:
<rpc message-id="100" xmlns="urn:ietf:params:xml:ns:netconf:base:1.0" xmlns:h3c="http://www.h3c.com/netconf/base:1.0">
<get>
<filter type="subtree">
<top xmlns="http://www.h3c.com/netconf/data:1.0">
<Route>
<Ipv4Routes>
<RouteEntry h3c:filter="vrf vpn1 IP 1.1.1.0 MaskLen 24 longer"/>
</Ipv4Routes>
</Route>
</top>
</filter>
</get>
</rpc>
Column-based filtering
Column-based filtering includes full match filtering, regular expression match filtering, and conditional match filtering. Full match filtering has the highest priority and the conditional match filtering has the lowest priority. When more than one filtering criterion is specified, the one with the highest priority takes effect.
Full match filtering
You can specify an element value in an XML message to implement full match filtering. If multiple element values are provided, the system returns the data that matches all the specified values.
# Copy the following text to the client to retrieve configuration data of all interfaces in UP state:
<rpc message-id="100" xmlns="urn:ietf:params:xml:ns:netconf:base:1.0">
<get>
<filter type="subtree">
<top xmlns="http://www.h3c.com/netconf/data:1.0">
<Ifmgr>
<Interfaces>
<Interface>
<AdminStatus>1</AdminStatus>
</Interface>
</Interfaces>
</Ifmgr>
</top>
</filter>
</get>
</rpc>
You can also specify an attribute name that is the same as a column name of the current table at the row to implement full match filtering. The system returns only configuration data that matches this attribute name. The XML message equivalent to the above element-value-based full match filtering is as follows:
<rpc message-id="100" xmlns="urn:ietf:params:xml:ns:netconf:base:1.0">
<get>
<filter type="subtree">
<top xmlns="http://www.h3c.com/netconf/data:1.0"xmlns:data="http://www.h3c.com/netconf/data:1.0">
<Ifmgr>
<Interfaces>
<Interface data:AdminStatus="1"/>
</Interfaces>
</Ifmgr>
</top>
</filter>
</get>
</rpc>
The above examples show that both element-value-based full match filtering and attribute-name-based full match filtering can retrieve the same index and column information for all interfaces in up state.
Regular expression match filtering
To implement a complex data filtering with characters, you can add a regExp attribute for a specific element.
The supported data types include integer, date and time, character string, IPv4 address, IPv4 mask, IPv6 address, MAC address, OID, and time zone.
# Copy the following text to the client to retrieve the descriptions of interfaces, of which all the characters must be upper-case letters from A to Z:
<rpc message-id="100" xmlns="urn:ietf:params:xml:ns:netconf:base:1.0" xmlns:h3c="http://www.h3c.com/netconf/base:1.0">
<get-config>
<source>
<running/>
</source>
<filter type="subtree">
<top xmlns="http://www.h3c.com/netconf/config:1.0">
<Ifmgr>
<Interfaces>
<Interface>
<Description h3c:regExp="^[A-Z]*$"/>
</Interface>
</Interfaces>
</Ifmgr>
</top>
</filter>
</get-config>
</rpc>
Conditional match filtering
To implement a complex data filtering with digits and character strings, you can add a match attribute for a specific element. Table 12 lists the conditional match operators.
Table 12 Conditional match operators
|
Operation |
Operator |
Remarks |
|
More than |
match="more:value" |
More than the specified value. The supported data types include date, digit, and character string. |
|
Less than |
match="less:value" |
Less than the specified value. The supported data types include date, digit, and character string. |
|
Not less than |
match="notLess:value" |
Not less than the specified value. The supported data types include date, digit, and character string. |
|
Not more than |
match="notMore:value" |
Not more than the specified value. The supported data types include date, digit, and character string. |
|
Equal |
match="equal:value" |
Equal to the specified value. The supported data types include date, digit, character string, OID, and BOOL. |
|
Not equal |
match="notEqual:value" |
Not equal to the specified value. The supported data types include date, digit, character string, OID, and BOOL. |
|
Include |
match="include:string" |
Includes the specified string. The supported data types include only character string. |
|
Not include |
match="exclude:string" |
Excludes the specified string. The supported data types include only character string. |
|
Start with |
match="startWith:string" |
Starts with the specified string. The supported data types include character string and OID. |
|
End with |
match="endWith:string" |
Ends with the specified string. The supported data types include only character string. |
# Copy the following text to the client to retrieve extension information about the entity whose CPU usage is more than 50%:
<rpc message-id="100" xmlns="urn:ietf:params:xml:ns:netconf:base:1.0" xmlns:h3c="http://www.h3c.com/netconf/base:1.0">
<get>
<filter type="subtree">
<top xmlns="http://www.h3c.com/netconf/data:1.0">
<Device>
<ExtPhysicalEntities>
<Entity>
<CpuUsage h3c:match="more:50"></CpuUsage>
</Entity>
</ExtPhysicalEntities>
</Device>
</top>
</filter>
</get>
</rpc>
Example for filtering data with regular expression match
Network requirements
Retrieve all data including Ten-Gigabit in the Description column of the Interfaces table under the Ifmgr module.
Configuration procedure
# Enter XML view.
<Sysname> xml
# Notify the device of the NETCONF capabilities supported on the client.
<hello xmlns="urn:ietf:params:xml:ns:netconf:base:1.0">
<capabilities>
<capability>
urn:ietf:params:netconf:base:1.0
</capability>
</capabilities>
</hello>
# Retrieve all data including Ten-Gigabit in the Description column of the Interfaces table under the Ifmgr module.
<?xml version="1.0"?>
<rpc message-id="100" xmlns="urn:ietf:params:xml:ns:netconf:base:1.0" xmlns:h3c="http://www.h3c.com/netconf/base:1.0">
<get>
<filter type="subtree">
<top xmlns="http://www.h3c.com/netconf/data:1.0">
<Ifmgr>
<Interfaces>
<Interface>
<Description reg:regExp="Ten-Gigabit"/>
</Interface>
</Interfaces>
</Ifmgr>
</top>
</filter>
</get>
</rpc>
Verifying the configuration
If the client receives the following text, the operation is successful:
<?xml version="1.0" encoding="UTF-8"?>
<rpc-reply xmlns="urn:ietf:params:xml:ns:netconf:base:1.0" xmlns:h3c="http://www.h3c.com/netconf/base:1.0" message-id="100">
<data>
<top xmlns="http://www.h3c.com/netconf/data:1.0">
<Ifmgr>
<Interfaces>
<Interface>
<IfIndex>2681</IfIndex>
<Description>Ten-GigabitEthernet1/0/1 Interface</Description>
</Interface>
<Interface>
<IfIndex>2685</IfIndex>
<Description>Ten-GigabitEthernet1/0/2 Interface</Description>
</Interface>
<Interface>
<IfIndex>2689</IfIndex>
<Description>Ten-GigabitEthernet1/0/3 Interface</Description>
</Interface>
<Interface>
</Ifmgr>
</top>
</data>
</rpc-reply>
Example for filtering data by conditional match
Network requirements
Retrieve data in the Name column with the ifindex value not less than 5000 in the Interfaces table under the Ifmgr module.
Configuration procedure
# Enter XML view.
<Sysname> xml
# Notify the device of the NETCONF capabilities supported on the client.
<hello xmlns="urn:ietf:params:xml:ns:netconf:base:1.0">
<capabilities>
<capability>
urn:ietf:params:netconf:base:1.0
</capability>
</capabilities>
</hello>
# Retrieve data in the Name column with the ifindex value not less than 5000 in the Interfaces table under the Ifmgr module.
<rpc message-id="100" xmlns="urn:ietf:params:xml:ns:netconf:base:1.0" xmlns:h3c="http://www.h3c.com/netconf/base:1.0">
<get>
<filter type="subtree">
<top xmlns="http://www.h3c.com/netconf/data:1.0">
<Ifmgr>
<Interfaces>
<Interface>
<IfIndex nc:match="notLess:5000"/>
<Name/>
</Interface>
</Interfaces>
</Ifmgr>
</top>
</filter>
</get>
</rpc>
Verifying the configuration
If the client receives the following text, the operation is successful:
<?xml version="1.0" encoding="UTF-8"?>
<rpc-reply xmlns="urn:ietf:params:xml:ns:netconf:base:1.0" xmlns:h3c="http://www.h3c.com/netconf/base:1.0" message-id="100">
<data>
<top xmlns="http://www.h3c.com/netconf/data:1.0">
<Ifmgr>
<Interfaces>
<Interface>
<IfIndex>7241</IfIndex>
<Name>NULL0</Name>
</Interface>
<Interface>
<IfIndex>7243</IfIndex>
<Name>Register-Tunnel0</Name>
</Interface>
</Interfaces>
</Ifmgr>
</top>
</data>
</rpc-reply>
Performing CLI operations through NETCONF
You can enclose command lines in XML messages to configure the device.
Configuration procedure
# Copy the following text to the client to execute the commands:
<?xml version="1.0" encoding="UTF-8"?>
<rpc message-id="100" xmlns="urn:ietf:params:xml:ns:netconf:base:1.0">
<CLI>
<Execution>
Commands
</Execution>
</CLI>
</rpc>
The <Execution> element can contain multiple commands, with one command on one line.
After receiving the CLI operation request, the device returns a response in the following format if the CLI operation is successful:
<?xml version="1.0" encoding="UTF-8"?>
<rpc-reply message-id="100" xmlns="urn:ietf:params:xml:ns:netconf:base:1.0">
<CLI>
<Execution>
<![CDATA[Responses to the commands]]>
</Execution>
</CLI>
</rpc-reply>
CLI operation example
Configuration requirements
Send the display default configuration command to the device.
Configuration procedure
# Enter XML view.
<Sysname> xml
# Notify the device of the NETCONF capabilities supported on the client.
<hello xmlns="urn:ietf:params:xml:ns:netconf:base:1.0">
<capabilities>
<capability>
urn:ietf:params:netconf:base:1.0
</capability>
</capabilities>
</hello>
# Copy the following text to the client to execute the display default-configuration command:
<?xml version="1.0" encoding="UTF-8"?>
<rpc message-id="100" xmlns="urn:ietf:params:xml:ns:netconf:base:1.0">
<CLI>
<Execution>
display default-configuration
</Execution>
</CLI>
</rpc>
Verifying the configuration
If the client receives the following text, the operation is successful:
<?xml version="1.0" encoding="UTF-8"?>
<rpc-reply message-id="100" xmlns="urn:ietf:params:xml:ns:netconf:base:1.0">
<CLI>
<Execution><![CDATA[
<Sysname>display default-configuration
#
version 7.1.064, Demo 2501005
#
sysname Sysname
#
ftp server enable
ftp update fast
ftp timeout 2000
#
irf mac-address persistent timer
irf auto-update enable
undo irf link-delay
#
domain default enable system
#
telnet server enable
#
vlan 1
#
vlan 1000
#
radius scheme system
primary authentication 127.0.0.1 1645
#
return
]]>
</Execution>
</CLI>
</rpc-reply>
Retrieving NETCONF session information
You can use the <get-sessions> operation to retrieve NETCONF session information of the device.
# Copy the following message to the client to retrieve NETCONF session information from the device:
<?xml version="1.0" encoding="UTF-8"?>
<rpc message-id="100" xmlns="urn:ietf:params:xml:ns:netconf:base:1.0">
<get-sessions/>
</rpc>
After receiving the get-sessions request, the device returns a response in the following format if the <get-sessions> operation is successful:
<?xml version="1.0" encoding="UTF-8"?>
<rpc-reply message-id="100" xmlns="urn:ietf:params:xml:ns:netconf:base:1.0">
<get-sessions>
<Session>
<SessionID>Configuration session ID</SessionID>
<Line>Line information</Line>
<UserName>Name of the user creating the session</UserName>
<Since>Time when the session was created</Since>
<LockHeld>Whether the session holds a lock</LockHeld>
</Session>
</get-sessions>
</rpc-reply>
For example, to get NETCONF session information:
# Enter XML view.
<Sysname> xml
# Notify the device of the NETCONF capabilities supported on the client:
<hello xmlns="urn:ietf:params:xml:ns:netconf:base:1.0">
<capabilities>
<capability>
urn:ietf:params:netconf:base:1.0
</capability>
</capabilities>
</hello>
# Copy the following message to the client to get the current NETCONF session information on the device:
<?xml version="1.0" encoding="UTF-8"?>
<rpc message-id="100" xmlns="urn:ietf:params:xml:ns:netconf:base:1.0">
<get-sessions/>
</rpc>
If the client receives a message as follows, the operation is successful:
<?xml version="1.0" encoding="UTF-8"?>
<rpc-reply xmlns="urn:ietf:params:xml:ns:netconf:base:1.0" message-id="100">
<get-sessions>
<Session>
<SessionID>1</SessionID>
<Line>vty0</Line>
<UserName></UserName>
<Since>2011-01-05T00:24:57</Since>
<LockHeld>false</LockHeld>
</Session>
</get-sessions>
</rpc-reply>
The output shows the following information:
· The session ID of an existing NETCONF session is 1.
· The login user type is vty0.
· The login time is 2011-01-05T00:24:57.
· The user does not hold the lock of the configuration.
Terminating another NETCONF session
NETCONF allows one client to terminate the NETCONF session of another client. The client whose session is terminated returns to user view.
Configuration procedure
# Copy the following message to the client to terminate the specified NETCONF session:
<rpc message-id="100" xmlns="urn:ietf:params:xml:ns:netconf:base:1.0">
<kill-session>
<session-id>
Specified session-ID
</session-id>
</kill-session>
</rpc>
After receiving the kill-session request, the device returns a response in the following format if the <kill-session> operation is successful:
<?xml version="1.0" encoding="UTF-8"?>
<rpc-reply message-id="100" xmlns="urn:ietf:params:xml:ns:netconf:base:1.0">
<ok/>
</rpc-reply>
Configuration example
Configuration requirement
The user whose session's ID is 1 terminates the session with session ID 2.
Configuration procedure
# Enter XML view.
<Sysname> xml
# Notify the device of the NETCONF capabilities supported on the client.
<hello xmlns="urn:ietf:params:xml:ns:netconf:base:1.0">
<capabilities>
<capability>
urn:ietf:params:netconf:base:1.0
</capability>
</capabilities>
</hello>
# Terminate the session with session ID 2.
<rpc message-id="100" xmlns="urn:ietf:params:xml:ns:netconf:base:1.0">
<kill-session>
<session-id>2</session-id>
</kill-session>
</rpc>
Verifying the configuration
If the client receives the following text, the NETCONF session with session ID 2 has been terminated, and the client with session ID 2 has returned from XML view to user view:
<?xml version="1.0" encoding="UTF-8"?>
<rpc-reply message-id="100" xmlns="urn:ietf:params:xml:ns:netconf:base:1.0">
<ok/>
</rpc-reply>
Returning to the CLI
To return from XML view to the CLI, send the following close-session request:
<rpc message-id="100" xmlns="urn:ietf:params:xml:ns:netconf:base:1.0">
<close-session/>
</rpc>
When the device receives the close-session request, it sends the following response and returns to CLI's user view:
<?xml version="1.0" encoding="UTF-8"?>
<rpc-reply message-id="100" xmlns="urn:ietf:params:xml:ns:netconf:base:1.0">
<ok/>
</rpc-reply>
Displaying and maintaining NETCONF
Execute display commands in any view and reset commands in user view.
|
Task |
Command |
|
Display current NETCONF service status and global NETCONF service statistics. |
display netconf service |
|
Display NETCONF session status and statistics. |
display netconf session |
|
Clear NETCONF service statistics. |
reset netconf service statistics |
|
Clear NETCONF session statistics. |
reset netconf session statistics |
Appendix
Appendix A Supported NETCONF operations
Table 13 lists the NETCONF operations available with Comware 7.
|
Operation |
Description |
XML example |
|
get |
Retrieves device configuration and state information. |
To retrieve device configuration and state information for the Syslog module: |
|
get-config |
Retrieves the non-default configuration data. If non-default configuration data does not exist, the device returns a response with empty data. |
To retrieve non-default configuration data for the interface table: |
|
get-bulk |
Retrieves a number of data entries (including device configuration and state information) starting from the data entry next to the one with the specified index. |
To retrieve device configuration and state information for all interface: |
|
get-bulk-config |
Retrieves a number of non-default configuration data entries starting from the data entry next to the one with the specified index. |
To retrieve non-default configuration for all interfaces: |
|
edit-config: incremental |
Adds configuration data to a column without affecting the original data. The incremental attribute applies to a list column such as the vlan permitlist column. You can use the incremental attribute for <edit-config> operations except for the <replace> operation. Support for the incremental attribute varies by module. For more information, see NETCONF XML API documents. |
To add VLANs 1 through 10 to an untagged VLAN list that has untagged VLANs 12 through 15: |
|
edit-config: merge |
Changes the running configuration. To use the merge attribute in an <edit-config> operation, you must specify the operation target (on a specified level): · If the specified target exists, the operation directly changes the configuration for the target. · If the specified target does not exist, the operation creates and configures the target. · If the specified target does not exist and it cannot be created, an error message is returned. |
To change the buffer size to 120: |
|
edit-config: create |
Creates a specified target. To use the create attribute in an <edit-config> operation, you must specify the operation target. · If the table supports target creation and the specified target does not exist, the operation creates and then configures the target. · If the specified target exists, a data-exist error message is returned. |
The XML data format is the same as the edit-config message with the merge attribute. Change the operation attribute from merge to create. |
|
edit-config: replace |
Replaces the specified target. · If the specified target exists, the operation replaces the configuration of the target with the configuration carried in the message. · If the specified target does not exist but is allowed to be created, create the target and then apply the configuration of the target. · If the specified target does not exist and is not allowed to be created, the operation is not conducted and an invalid-value error message is returned. |
The syntax is the same as the edit-config message with the merge attribute. Change the operation attribute from merge to replace. |
|
edit-config: remove |
Removes the specified configuration. · If the specified target has only the table index, the operation removes all configuration of the specified target, and the target itself. · If the specified target has the table index and configuration data, the operation removes the specified configuration data of this target. · If the specified target does not exist, or the XML message does not specify any targets, a success message is returned. |
The syntax is the same as the edit-config message with the merge attribute. Change the operation attribute from merge to remove. |
|
edit-config: delete |
Deletes the specified configuration. · If the specified target has only the table index, the operation removes all configuration of the specified target, and the target itself. · If the specified target has the table index and configuration data, the operation removes the specified configuration data of this target. · If the specified target does not exist, an error message is returned, showing that the target does not exist. |
The syntax is the same as the edit-config message with the merge attribute. Change the operation attribute from merge to delete. |
|
edit-config: default-operation |
Modifies the current configuration of the device using the default operation method. If you do not specify an operation attribute for an edit-config message, NETCONF uses one of the following default operation attributes: merge, create, delete, and replace. Your setting of the value for the <default-operation> element takes effect only once. If you do not specify an operation attribute and the default operation method for an <edit-config> message, merge is always applied. · merge—The default value for the <default-operation> element. · replace—Value used when the operation attribute is not specified and the default operation method is specified as replace. · none—Value used when the operation attribute is not specified and the default operation method is specified as none. If this value is specified, the <edit-config> operation is used only for schema verification rather than issuing a configuration. If the schema verification is passed, a successful message is returned. Otherwise, an error message is returned. |
To issue an empty operation for schema verification purposes: |
|
edit-config: error-option |
Determines the action to take in case of a configuration error. The <error-option> element has one of the following values: · stop-on-error—Stops the operation on error and returns an error message. This is the default error-option value. · continue-on-error—Continues the operation on error and returns an error message. · rollback-on-error—Rolls back the configuration. |
To issue the configuration for two interfaces with the <error-option> element value as continue-on-error: |
|
edit-config: test-option |
Determines whether to issue a configuration item in an <edit-config> operation. The <test-option> element has one of the following values: · test-then-set—Performs a validation test before attempting to set. If the validation test fails, the <edit-config> operation is not performed. This is the default test-option value. · set—Directly performs the <set> operation without the validation test. · test-only—Performs only a validation test without attempting to set. If the validation test succeeds, a successful message is returned. Otherwise, an error message is returned. |
To issue the configuration for an interface for test purposes: |
|
action |
Issues actions that are not for configuring data, for example, reset action. |
To clear statistics information for all interfaces: |
|
lock |
Locks the configuration data made through NETCONF sessions. The configuration data can be changed by the <edit-config> operation. Other configuration data are not limited by the <lock> operation. This <lock> operation does not lock configuration data made through other protocols, for example, SNMP. |
To lock the configuration: |
|
unlock |
Unlocks the configuration, so NETCONF sessions can change device configuration. When a NETCONF session is terminated, the related locked configuration is also unlocked. |
To unlock the configuration: |
|
get-sessions |
Retrieves information about all NETCONF sessions in the system. |
To retrieve information about all NETCONF sessions in the system: |
|
close-session |
Terminates the NETCONF session for the current user, to unlock the configuration and release the resources (for example, memory) of this session. This operation logs the current user off the XML view. |
To terminate the NETCONF session for the current user: |
|
kill-session |
Terminates the NETCONF session for another user. This operation cannot terminate the NETCONF session for the current user. |
To terminate the NETCONF session with session-id 1: |
|
CLI |
Executes CLI operations. A request message encloses commands in the <CLI> element, and a response message encloses the command output in the <CLI> element. You can use the following elements to execute commands: · Execution—Executes commands in user view. ·
Configuration—Executes commands in system view. To execute commands in a lower-level view of the system view, use
the <Configuration> element to enter the view first. ? false (the default)—Executes commands without using a channel. ? true—Executes commands by using a temporary channel. The channel is automatically closed after the execution. ? persist—Executes
commands by using the persistent channel for the session. You can also specify the error-when-rollback attribute in the <Configuration> element to indicate whether a CLI request is mutually exclusive with a configuration error-triggered configuration rollback. This attribute takes effect only if the value of the <error-option> element in <edit-config> operations is set to rollback-on-error. It has the following values: ? false (the default)—Not mutually exclusive. ? true—Mutually exclusive. A NETCONF session supports only one persistent channel and but supports multiple temporary channels. NETCONF does not support executing interactive commands. You cannot use the quit command by using a channel to exit user view. |
To execute the telnet server enabledisplay this command in system view without using a channel: |
|
save |
Saves the running configuration. You can use the <file> element to specify a file for saving the configuration. If the text does not include the file column, the running configuration is automatically saved to the main next-startup configuration file. The OverWrite attribute determines whether the current configuration overwrites the original configuration file when the specified file already exists. The Binary-only attribute determines whether to save the current configuration to the specified text configuration file. |
To save the running configuration to file test.cfg: |
|
load |
Loads the configuration. After the device finishes the <load> operation, the configuration in the specified file is merged into the current configuration of the device. |
To merge the configuration in file a1.cfg to the current configuration of the device: |
|
rollback |
Rolls back the configuration. To do so, you must specify the configuration file in the <file> element. After the device finishes the <rollback> operation, the current device configuration is totally replaced with the configuration in the specified configuration file. |
To roll back the current configuration to the configuration in file 1A.cfg: |
Configuring CWMP
Overview
CPE WAN Management Protocol (CWMP), also called "TR-069," is a DSL Forum technical specification for remote management of home network devices.
The protocol was initially designed to provide remote autoconfiguration through a server for large numbers of dispersed end-user devices in DSL networks. However, it has been increasingly used on other types of networks, including Ethernet, for remote autoconfiguration.
CWMP network framework
Figure 52 shows a basic CWMP network framework.
Figure 52 CWMP network framework
A basic CWMP network includes the following network elements:
· ACS—Autoconfiguration server, the management device in the network.
· CPE—Customer premises equipment, the managed device in the network.
· DNS server—Domain name system server. CWMP defines that the ACS and the CPE use URLs to identify and access each other. DNS is used to resolve the URLs.
· DHCP server—Assigns ACS attributes along with IP addresses to CPEs when the CPEs are powered on. DHCP server is optional in CWMP. With a DHCP server, you do not need to configure ACS attributes manually on each CPE. The CPEs contact the ACS automatically when they are powered on for the first time.
The device is operating as a CPE in the CWMP framework.
Basic CWMP functions
You can autoconfigure and upgrade CPEs in bulk from the ACS.
Autoconfiguration
You can create configuration files for different categories of CPEs on the ACS.
The following are methods available for the ACS to issue configuration to the CPE:
· Transfers the configuration file to the CPE, and specifies the file as the next-startup configuration file. At a reboot, the CPE starts up with the ACS-specified configuration file.
· Runs the configuration in the CPE's RAM. The configuration takes effect immediately on the CPE. For the running configuration to survive a reboot, you must save the configuration on the CPE.
Software image management
The ACS can manage CPE software upgrade.
When the ACS finds a software version update, the ACS notifies the CPE to download the software image file from a specific location. The location can be the URL of the ACS or an independent file server.
The CPE notifies the ACS of the download result (success or failure) when it completes a download attempt. The CPE downloads the specified image file only when the file passes validity verification.
Data backup
The ACS can require the CPE to upload a configuration or log file to a specific location. The destination location can be the ACS or a file server.
Status and performance monitoring
The CPE allows the ACS to monitor the status and performance objects in Table 14.
Table 14 CPE status and performance objects available for the ACS to monitor
|
Category |
Objects |
|
Device information |
Manufacturer ManufacturerOUI SerialNumber HardwareVersion SoftwareVersion |
|
Operating status and information |
DeviceStatus UpTime |
|
Configuration file |
ConfigFile |
|
CWMP settings |
ACS URL ACS username ACS password PeriodicInformEnable PeriodicInformInterval PeriodicInformTime ConnectionRequestURL (CPE URL) ConnectionRequestUsername (CPE username) ConnectionRequestPassword (CPE password) |
How CWMP works
CWMP uses remote procedure call (RPC) methods for bidirectional communication between CPE and ACS. The RPC methods are encapsulated in HTTP or HTTPS.
RPC methods
Table 15 shows the primary RPC methods used in CWMP.
|
RPC method |
Description |
|
Get |
The ACS obtains the values of parameters on the CPE. |
|
Set |
The ACS modifies the values of parameters on the CPE. |
|
Inform |
The CPE sends an Inform message to the ACS for the following purposes: · Initiates a connection to the ACS. · Reports configuration changes to the ACS. · Periodically updates CPE settings to the ACS. |
|
Download |
The ACS requires the CPE to download a configuration or software image file from a specific URL for software or configuration update. |
|
Upload |
The ACS requires the CPE to upload a file to a specific URL. |
|
Reboot |
The ACS reboots the CPE remotely for the CPE to complete an upgrade or recover from an error condition. |
Autoconnect between ACS and CPE
The CPE automatically initiates a connection to the ACS when one of the following events occurs:
· ACS URL change. The CPE initiates a connection request to the new ACS URL.
· CPE startup. The CPE initiates a connection to the ACS after the startup.
· Timeout of the periodic Inform interval. The CPE re-initiates a connection to the ACS at the Inform interval.
· Expiration of the scheduled connection initiation time. The CPE initiates a connection to the ACS at the scheduled time.
CWMP connection establishment
As shown in Figure 53, the CPE and the ACS use the following process to establish a connection:
1. After obtaining the basic ACS parameters, the CPE initiates a TCP connection to the ACS.
2. If HTTPS is used, the CPE and the ACS initialize SSL for a secure HTTP connection.
3. The CPE sends an Inform message in HTTPS to initiate a CWMP session.
4. After the CPE passes authentication, the ACS returns an Inform response to establish the session.
5. After sending all requests, the CPE sends an empty HTTP post message.
6. If the ACS wants to point the CPE to a new ACS URL, the ACS queries the ACS URL set on the CPE.
7. The CPE replies with its ACS URL setting.
8. The ACS sends a Set request to modify the ACS URL on the CPE.
9. After the ACS URL is modified, the CPE sends a response.
10. The ACS sends an empty HTTP message to notify the CPE that it has no other requests.
11. The CPE closes the connection, and then initiates a new connection to the new ACS URL.
Figure 53 CWMP message interaction procedure
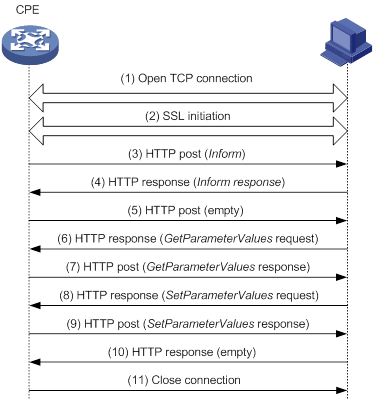
Configuration task list
To use CWMP, you must enable CWMP from the CLI. You can then configure ACS and CPE attributes from the CPE's CLI, the DHCP server, or the ACS.
For an attribute, the CLI- and ACS-assigned values have higher priority than the DHCP-assigned value. The CLI- and ACS-assigned values overwrite each other, whichever is assigned later.
This document only describes configuring ACS and CPE attributes from the CLI and DHCP server. For more information about configuring and using the ACS, see ACS documentation.
To configure CWMP, perform the following tasks:
Enabling CWMP from the CLI
You must enable CWMP for other CWMP settings to take effect, whether they are configured from the CLI, or assigned through the DHCP server or ACS.
To enable CWMP:
|
Command |
Remarks |
|
|
1. Enter system view. |
N/A |
|
|
2. Enter CWMP view. |
N/A |
|
|
3. Enable CWMP. |
By default, CWMP is disabled. |
Configuring ACS attributes
You can configure two sets of ACS attributes for the CPE: preferred and default.
· The preferred ACS attributes are configurable from the CPE's CLI, the DHCP server, and ACS. For an attribute, the CLI- and ACS-assigned values have higher priority than the DHCP-assigned value. The CLI- and ACS-assigned values overwrite each other.
· The default ACS attributes are configurable only from the CLI.
The CPE uses the default ACS attributes for connection establishment only when it is not assigned a preferred ACS URL from the CLI, ACS, or DHCP server.
Configuring the preferred ACS attributes
Assigning ACS attributes from the DHCP server
You can use DHCP option 43 to assign the ACS URL and ACS login authentication username and password.
If the DHCP server is an H3C device, you can configure DHCP option 43 by using the option 43 hex 01length URL username password command.
· length—A hexadecimal number that indicates the total length of the length, URL, username, and password arguments, including the spaces between these arguments. No space is allowed between the 01 keyword and the length value.
· URL—ACS URL.
· username—Username for the CPE to authenticate to the ACS.
· password—Password for the CPE to authenticate to the ACS.
|
|
NOTE: The ACS URL, username and password must use the hexadecimal format and be space separated. |
The following example configures the ACS address as http://169.254.76.31:7547/acs, username as 1234, and password as 5678:
[Sysname] dhcp server ip-pool 0
[Sysname-dhcp-pool-0] option 43 hex 0127687474703A2F2F3136392E3235342E37362E33313A373534372F61637320313233342035363738
Table 16 Hexadecimal forms of the ACS attributes
|
Attribute |
Attribute value |
Hexadecimal form |
|
Length |
39 characters |
27 |
|
ACS URL |
http://169.254.76.31/acs |
687474703A2F2F3136392E3235342E37362E33313A373534372F61637320 NOTE: The two ending digits (20) represent the space. |
|
ACS connect username |
1234 |
3132333420 NOTE: The two ending digits (20) represent the space. |
|
ACS connect password |
5678 |
35363738 |
For more information about DHCP and DHCP Option 43, see layer 3—IP Services Configuration Guide.
Configuring the preferred ACS attributes from the CLI
|
Step |
Command |
Remarks |
|
1. Enter system view. |
system-view |
N/A |
|
2. Enter CWMP view. |
cwmp |
N/A |
|
3. Configure the preferred ACS URL. |
cwmp acs url url |
By default, no preferred ACS URL has been configured. |
|
4. Configure the username for authentication to the preferred ACS URL. |
cwmp acs username username |
By default, no username has been configured for authentication to the preferred ACS URL. |
|
5. (Optional.) Configure the password for authentication to the preferred ACS URL. |
cwmp acs password { cipher | simple } string |
By default, no password has been configured for authentication to the preferred ACS URL. |
Configuring the default ACS attributes from the CLI
|
Step |
Command |
Remarks |
|
1. Enter system view. |
system-view |
N/A |
|
2. Enter CWMP view. |
cwmp |
N/A |
|
3. Configure the default ACS URL. |
cwmp acs default url url |
By default, no default ACS URL has been configured. |
|
4. Configure the username for authentication to the default ACS URL. |
cwmp acs default username username |
By default, no username has been configured for authentication to the default ACS URL. |
|
5. (Optional.) Configure the password for authentication to the default ACS URL. |
cwmp acs default password { cipher | simple } string |
By default, no password has been configured for authentication to the default ACS URL. |
Configuring CPE attributes
You can assign CPE attribute values to the CPE from the CPE's CLI or the ACS. The CLI- and ACS-assigned values overwrite each other, whichever is assigned later.
For more information about the configuration methods supported for each CPE attribute, see "Configuration task list."
Configuring ACS authentication parameters
To protect the CPE against unauthorized access, configure a CPE username and password for ACS authentication. When an ACS initiates a connection to the CPE, the ACS must provide the correct username and password.
|
|
NOTE: The password setting is optional. You can specify only a username for authentication. |
To configure ACS authentication parameters:
|
Step |
Command |
Remarks |
|
1. Enter system view. |
system-view |
N/A |
|
2. Enter CWMP view. |
cwmp |
N/A |
|
3. Configure the username for authentication to the CPE. |
cwmp cpe username username |
By default, no username has been configured for authentication to the CPE. |
|
4. (Optional.) Configure the password for authentication to the CPE. |
cwmp cpe password { cipher | simple } string |
By default, no password has been configured for authentication to the CPE. |
Configuring the provision code
The ACS can use the provision code to identify services assigned to each CPE. For correct configuration deployment, make sure the same provision code is configured on the CPE and the ACS. For information about the support of your ACS for provision codes, see the ACS documentation.
To configure the provision code:
|
Step |
Command |
Remarks |
|
1. Enter system view. |
system-view |
N/A |
|
2. Enter CWMP view. |
cwmp |
N/A |
|
3. Configure the provision code. |
cwmp cpe provision-code provision-code |
The default provision code is PROVISIONINGCODE. |
Configuring the CWMP connection interface
The CWMP connection interface is the interface that the CPE uses to communicate with the ACS. To establish a CWMP connection, the CPE sends the IP address of this interface in the Inform messages, and the ACS replies to this IP address.
If the interface that connects the CPE to the ACS is the only Layer 3 interface that has an IP address on the device, you do not need to specify the CWMP connection interface.
If the CPE has multiple Layer 3 interfaces, specify the interface that connects to the ACS as the CWMP connection interface. This manual setting avoids the risk of incorrect CWMP connection interface selection in an automatic selection process.
To configure the CWMP connection interface:
|
Step |
Command |
Remarks |
|
1. Enter system view. |
system-view |
N/A |
|
2. Enter CWMP view. |
cwmp |
N/A |
|
3. Specify the interface that connects to the ACS as the CWMP connection interface. |
cwmp cpe connect interface interface-type interface-number |
By default, no CWMP connection interface is specified. The CPE automatically selects the CWMP connection interface. |
Configuring autoconnect parameters
You can configure the CPE to connect to the ACS periodically, or at a schedule time for configuration or software update. To protect system resources, limit the number of retries that the CPE can make to connect to the ACS.
Configuring the periodic Inform feature
To connect to the ACS periodically for CPE information update:
|
Step |
Command |
Remarks |
|
1. Enter system view. |
system-view |
N/A |
|
2. Enter CWMP view. |
cwmp |
N/A |
|
3. Enable the periodic Inform feature. |
cwmp cpe inform interval enable |
By default, this function is disabled. |
|
4. (Optional.) Set the Inform interval. |
cwmp cpe inform interval interval |
By default, the CPE sends an Inform message to start a session every 600 seconds. |
Scheduling a connection initiation
To connect to the ACS for configuration or software update at a scheduled time:
|
Step |
Command |
Remarks |
|
1. Enter system view. |
system-view |
N/A |
|
2. Enter CWMP view. |
cwmp |
N/A |
|
3. Schedule a connection initiation. |
cwmp cpe inform time time |
By default, no connection initiation has been scheduled. |
Setting the maximum number of connection retries
The CPE retries a connection automatically when one of the following events occurs:
· The CPE fails to connect to the ACS.
· The connection is disconnected before the session on the connection is completed.
The CPE considers a connection attempt as having failed when the close-wait timer expires. This timer starts when the CPE sends an Inform request. If the CPE fails to receive a response before the timer expires, the CPE resends the Inform request.
To set the maximum number of connection retries that the CPE can make:
|
Step |
Command |
Remarks |
|
1. Enter system view. |
system-view |
N/A |
|
2. Enter CWMP view. |
cwmp |
N/A |
|
3. Set the maximum number of connection retries. |
cwmp cpe connect retry retries |
By default, the CPE retries a failed connection until the connection is established. |
Setting the close-wait timer
The close-wait timer specifies the amount of time the connection to the ACS can be idle before it is terminated. The CPE terminates the connection to the ACS if no traffic is transmitted before the timer expires.
The timer also specifies the maximum amount of time the CPE waits for the response to a session request. The CPE determines that its session attempt has failed when the timer expires.
To set the close-wait timer for the CPE:
|
Step |
Command |
Remarks |
|
1. Enter system view. |
system-view |
N/A |
|
2. Enter CWMP view. |
cwmp |
N/A |
|
3. Set the close-wait timer. |
cwmp cpe wait timeout seconds |
By default, the close-wait timer is 30 seconds. |
Enabling NAT traversal for the CPE
For the connection request initiated from the ACS to reach the CPE, you must enable NAT traversal feature on the CPE when a NAT gateway resides between the CPE and the ACS.
The NAT traversal feature complies with RFC 3489 Simple Traversal of UDP Through NATs (STUN). The feature enables the CPE to discover the NAT gateway, and obtain an open NAT binding (a public IP address and port binding) through which the ACS can send unsolicited packets. The CPE sends the binding to the ACS when it initiates a connection to the ACS. For the connection requests sent by the ACS at any time to reach the CPE, the CPE maintains the open NAT binding.
|
|
NOTE: Connection requests initiated from the CPE can reach the ACS through a NAT gateway without NAT traversal. |
For more information about NAT, see Layer 3—IP Services Configuration Guide.
To enable NAT traversal on the CPE:
|
Step |
Command |
Remarks |
|
1. Enter system view. |
system-view |
N/A |
|
2. Enter CWMP view. |
cwmp |
N/A |
|
3. Enable NAT traversal. |
cwmp cpe stun enable |
By default, NAT traversal is disabled on the CPE. |
Specifying an SSL client policy for HTTPS connection to ACS
CWMP uses HTTP or HTTPS for data transmission. If the ACS uses HTTPS for secure access, its URL begins with https://. You must configure an SSL client policy for the CPE to authenticate the ACS for HTTPS connection establishment. For more information about configuring SSL client policies, see Security Configuration Guide.
To specify an SSL client policy for the CPE to establish an HTTPS connection to the ACS:
|
Step |
Command |
Remarks |
|
1. Enter system view. |
system-view |
N/A |
|
2. Enter CWMP view. |
cwmp |
N/A |
|
3. Specify an SSL client policy. |
ssl client-policy policy-name |
By default, no SSL client policy is specified. |
Displaying and maintaining CWMP
Execute display commands in any view.
|
Task |
Command |
|
Display CWMP configuration. |
display cwmp configuration |
|
Display the current status of CWMP. |
display cwmp status |
CWMP configuration example
Network requirements
As shown in Figure 54, use H3C IMC BIMS as the ACS to bulk-configure the devices (CPEs), and assign ACS attributes to the CPEs from the DHCP server.
The configuration files for the devices in equipment rooms A and B are configure1.cfg and configure2.cfg, respectively.
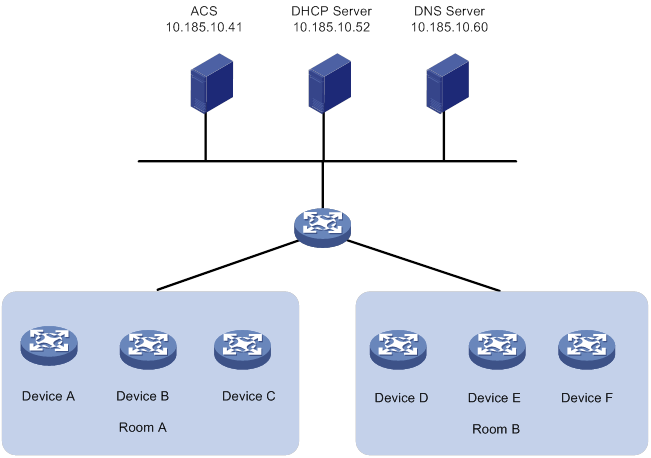
Table 17 shows the ACS attributes for the CPEs to connect to the ACS.
Table 17 ACS attributes
|
Item |
Setting |
|
Preferred ACS URL |
http://10.185.10.41:8080/acs |
|
ACS username |
Admin |
|
ACS password |
12345 |
Table 18 lists serial numbers of the CPEs.
|
Device |
Serial number |
|
Configuration procedure
Configuring the ACS
1. Log in to the ACS:
a. Launch a Web browser on the ACS configuration terminal.
b. In the address bar of the Web browser, enter the ACS URL and port number. This example uses http://10.185.10.41:8080/imc.
c. On the login page, enter the ACS login username and password, and then click Login.
2. Create a CPE user account:
a. Select Service > System Management > CPE Authentication User from the top navigation bar.
The CPE authentication user configuration page appears.
Figure 55 CPE authentication user configuration page
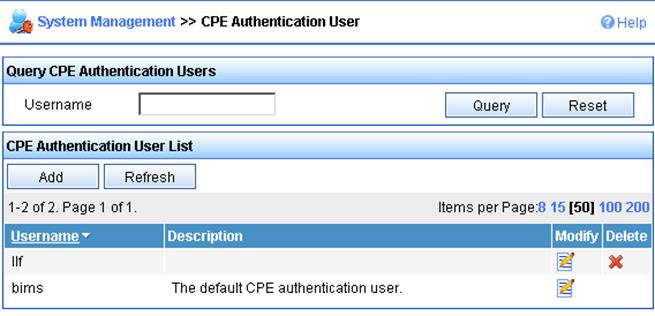
b. Click Add.
c. Enter the username and password for authentication to the ACS, and then click OK.
Figure 56 Adding a CPE user account
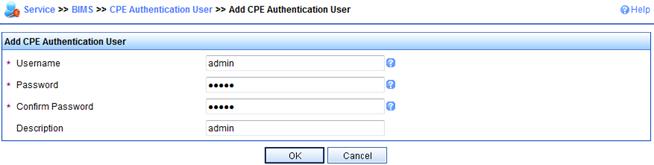
3. Add device groups and device classes for devices in equipment rooms A and B:
This example assigns all devices to the same device group, and assigns the devices in two equipment rooms to different device classes.
a. Select Service > Resource > Device Group from the top navigation bar.
b. Click Add.
c. On the Add Device Group page, enter a service group name (for example, DB_1), and then click OK.
Figure 57 Adding a device group
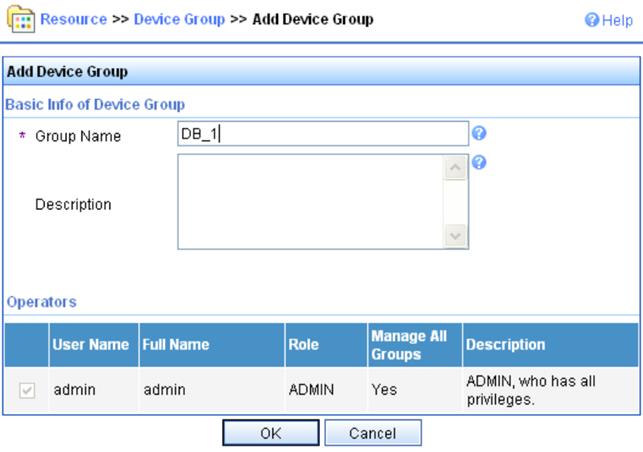
d. Select Service > Resource > Device Class from the top navigation bar.
e. Click Add.
f. On the Add Device Class page, enter a device class name for devices in equipment room A, and then click OK.
In this example, the device class for devices in equipment room A is Device_A.
Figure 58 Adding a device class
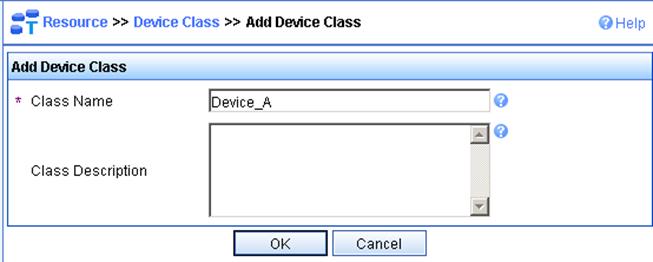
g. Repeat the previous two steps to create a device class for devices in equipment room B.
4. Add the devices as CPEs:
a. Select Service > BIMS > Add CPE from the top navigation bar.
b. On the Add CPE page, enter or select basic settings for device A, and then click OK.
c. Repeat the previous two steps to add other devices.
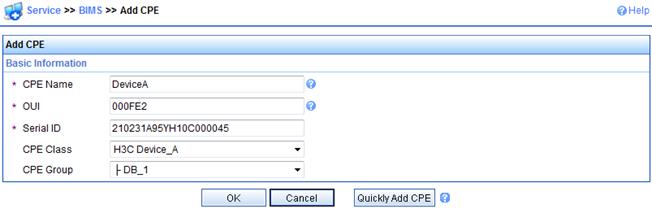
After the CPE is added successfully, a success message is displayed, as shown in Figure 60.
Figure 60 CPE added successfully
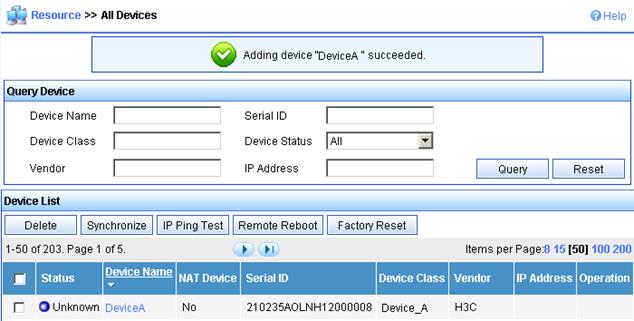
5. Configure the system settings of the ACS, as shown in Figure 61.
Figure 61 Configuring the system settings of the ACS
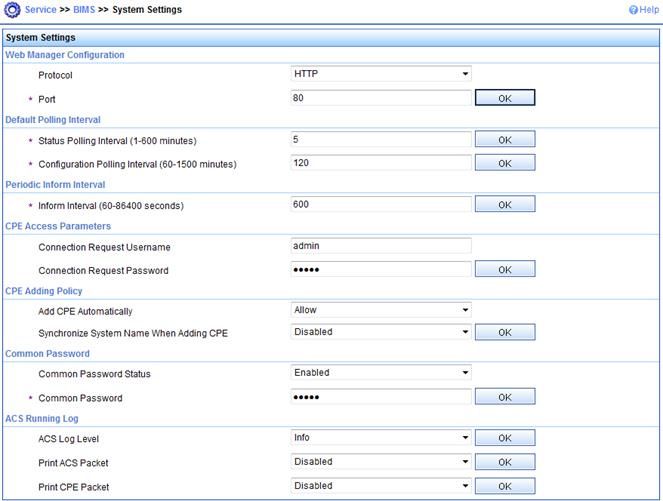
6. Add configuration templates and software library entries for the two classes of devices:
a. Select Service > BIMS > Configuration Management > Configuration Templates from the navigation tree.
Figure 62 Configuring templates page
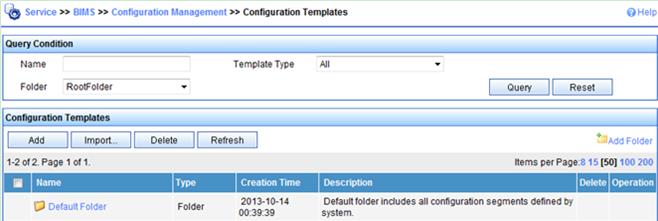
b. On the Configuration Templates page, click Import….
c. On the Import Configuration Template page, select configuration template settings for the Device_A device class, add the Device_A class to the Applicable CPEs pane, and then click OK.
d. Repeat the previous two steps to configure a configuration template for equipment room B's device class.
Figure 63 Importing configuration template
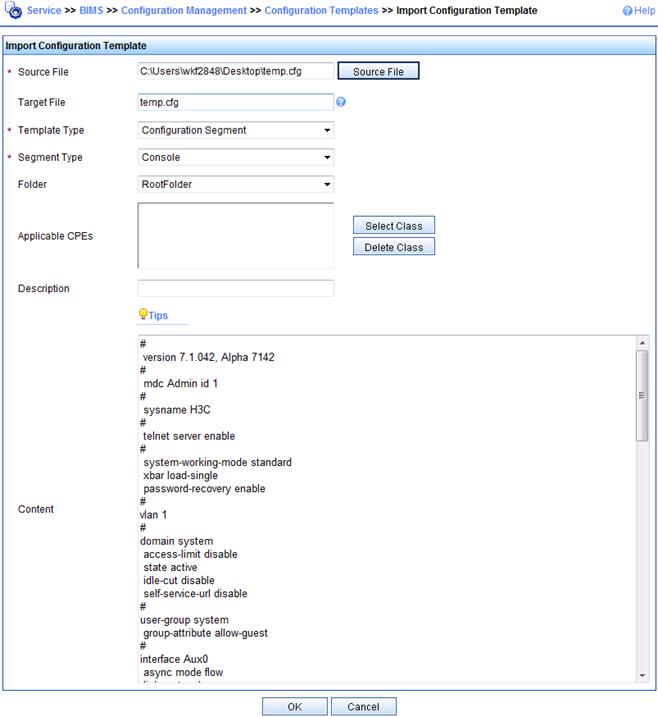
After the configuration template is added successfully, a success message is displayed, as shown in Figure 64.
Figure 64 Configuration templates
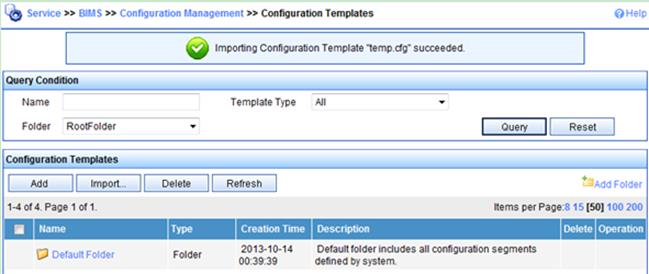
7. Add auto-deployment tasks:
a. Select Service > BIMS > Configuration Management > Deployment Guide from the top navigation bar.
b. On the Deployment Guide page, click By Device Class in the Auto Deploy Configuration pane.
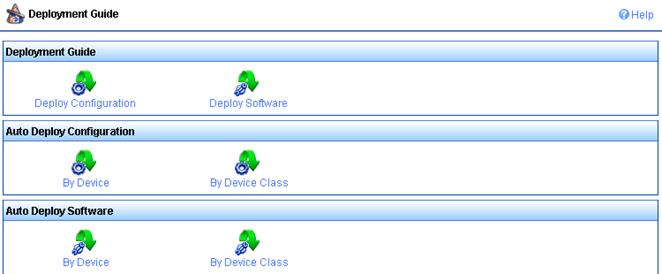
c. On the Auto Deploy Configuration page, click Select Class.
Figure 66 Configuring auto deployment
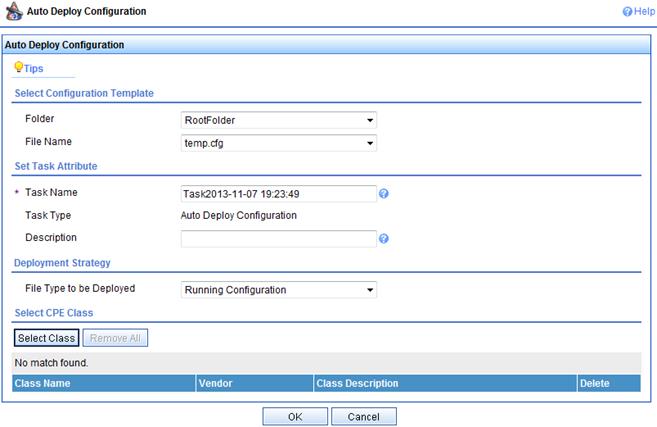
d. On the Device Class page, select Device_A, and then click OK.
Figure 67 Selecting device class
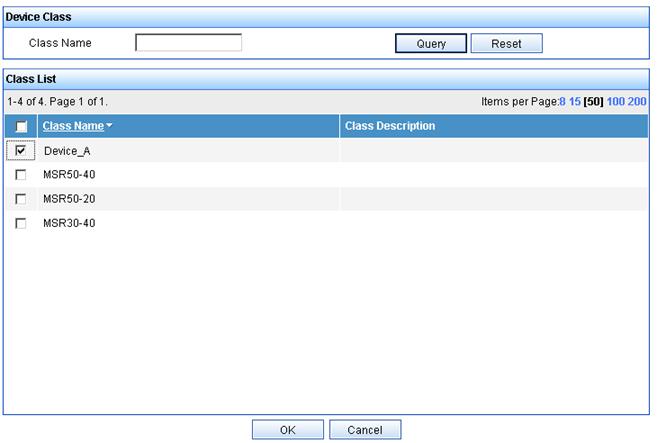
e. On the Auto Deploy Configuration page, click OK.
A success message is displayed, as shown in Figure 68.
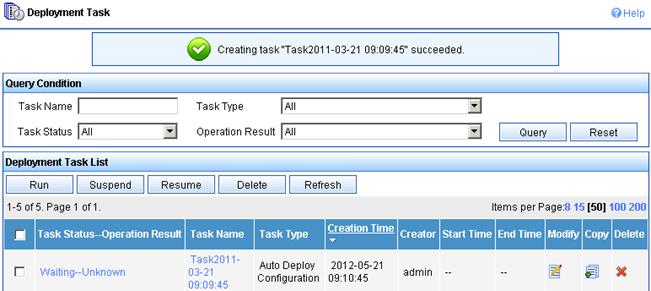
f. Add a deployment task for devices in equipment room B in the same way you add the deployment task for the devices in equipment room A.
Configuring the DHCP server
In this example, an H3C device is operating as the DHCP server.
1. Configure an IP address pool to assign IP addresses and DNS server address to the CPEs. This example uses subnet 10.185.10.0/24 for IP address assignment.
# Enable DHCP.
[DHCP_server] dhcp enable
# Enable DHCP server on VLAN-interface 1.
[DHCP_server] interface vlan-interface 1
[DHCP_server-Vlan-interface1] dhcp select server
[DHCP_server-Vlan-interface1] quit
# Exclude the DNS server address 10.185.10.60 and the ACS IP address 10.185.10.41 from dynamic allocation.
[DHCP_server] dhcp server forbidden-ip 10.185.10.41
[DHCP_server] dhcp server forbidden-ip 10.185.10.60
# Create DHCP address pool 0.
[DHCP_server] dhcp server ip-pool 0
# Assign subnet 10.185.10.0/24 to the address pool, and specify the DNS server address 10.185.10.60 in the address pool.
[DHCP_server-dhcp-pool-0] network 10.185.10.0 mask 255.255.255.0
[DHCP_server-dhcp-pool-0] dns-list 10.185.10.60
2. Configure DHCP Option 43 to contain the ACS URL, username, and password in hexadecimal format.
Configuring the DNS server
Map http://acs.database:9090/acs to http://10.185.1.41:9090/acs on the DNS server. For more information about DNS configuration, see DNS server documentation.
Connecting the CPEs to the network
# Connect the CPEs to the network, and then power on the CPEs. (Details not shown.)
At startup, the CPEs obtain the IP address and ACS information from the DHCP server to initiate a connection to the ACS. After the connection is established, the CPEs interact with the ACS to complete autoconfiguration.
Verifying the configuration
Verify that the CPEs have obtained the correct configuration file from the ACS:
1. Select Service > Resource > Device Interaction Log from the top navigation bar.
2. On the Device Interaction Log page, verify that the configuration has been deployed on the CPEs.
Figure 69 Verifying the configuration deployment status
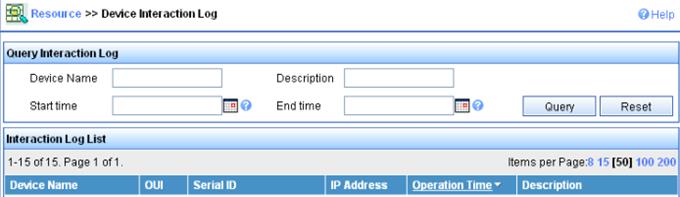
Configuring EAA
Overview
Embedded Automation Architecture (EAA) is a monitoring framework that enables you to self-define monitored events and actions to take in response to an event. It allows you to create monitor policies by using the CLI or Tcl scripts.
EAA framework
EAA framework includes a set of event sources, a set of event monitors, a real-time event manager (RTM), and a set of user-defined monitor policies, as shown in Figure 70.
Figure 70 EAA framework
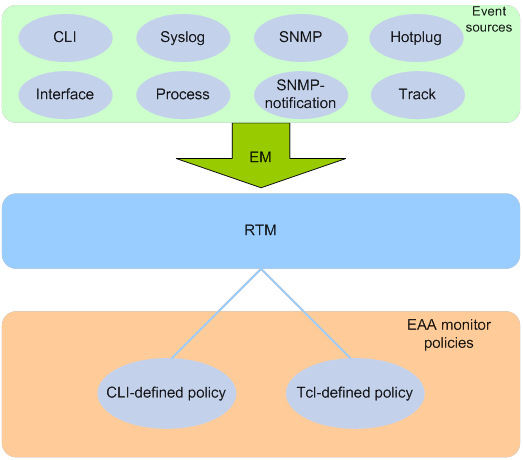
Event sources
Event sources are software or hardware modules that trigger events (see Figure 70).
For example, the CLI module triggers an event when you enter a command. The Syslog module (the information center) triggers an event when it receives a log message.
Event monitors
EAA creates one event monitor to monitor the system for the event specified in each monitor policy. An event monitor notifies the RTM to run the monitor policy when the monitored event occurs.
RTM
RTM manages the creation, state machine, and execution of monitor policies.
EAA monitor policies
A monitor policy specifies the event to monitor and actions to take when the event occurs.
You can configure EAA monitor policies by using the CLI or Tcl.
A monitor policy contains the following elements:
· One event.
· A minimum of one action.
· A minimum of one user role.
· One running time setting.
For more information about these elements, see "Elements in a monitor policy."
Elements in a monitor policy
Event
Table 19 shows types of events that EAA can monitor.
|
Event type |
Description |
|
CLI |
CLI event occurs in response to monitored operations performed at the CLI. For example, a command is entered, a question mark (?) is entered, or the Tab key is pressed to complete a command. |
|
Syslog |
Syslog event occurs when the information center receives the monitored log within a specific period. NOTE: The log that is generated by the EAA RTM does not trigger the monitor policy to run. |
|
Process |
Process event occurs in response to a state change of the monitored process (such as an exception, shutdown, start, or restart). Both manual and automatic state changes can cause the event to occur. |
|
Hotplug |
Hotplug event occurs a card is inserted in or removed from the monitored slot. |
|
Interface |
Each interface event is associated with two user-defined thresholds: start and restart. An interface event occurs when the monitored interface traffic statistic crosses the start threshold in the following situations: · The statistic crosses the start threshold for the first time. · The statistic crosses the start threshold each time after it crosses the restart threshold. |
|
SNMP |
Each SNMP event is associated with two user-defined thresholds: start and restart. SNMP event occurs when the monitored MIB variable's value crosses the start threshold in the following situations: · The monitored variable's value crosses the start threshold for the first time. · The monitored variable's value crosses the start threshold each time after it crosses the restart threshold. |
|
SNMP-Notification |
SNMP-Notification event occurs when the monitored MIB variable's value in an SNMP notification matches the specified condition. For example, the broadcast traffic rate on an Ethernet interface reaches or exceeds 30%. |
|
Track |
Track event occurs when the state of the monitored track entry changes from Positive to Negative or from Negative to Positive. If you specify multiple track entries for a policy, EAA triggers the policy only when the state of all the track entries changes from Positive (Negative) to Negative (Positive). If you set a suppress time for a policy, the timer starts when the policy is triggered. The system does not process the messages that report the track entry state change from Positive (Negative) to Negative (Positive) until the timer times out. |
Action
You can create a series of order-dependent actions to take in response to the event specified in the monitor policy.
The following are available actions:
· Executing a command.
· Sending a log.
· Enabling an active/standby switchover.
· Executing a reboot without saving the running configuration.
User role
For EAA to execute an action in a monitor policy, you must assign the policy the user role that has access to the action-specific commands and resources. If EAA lacks access to an action-specific command or resource, EAA does not perform the action and all the subsequent actions.
For example, a monitor policy has four actions numbered from 1 to 4. The policy has user roles that are required for performing actions 1, 3, and 4. However, it does not have the user role required for performing action 2. When the policy is triggered, EAA executes only action 1.
For more information about user roles, see RBAC in Fundamentals Configuration Guide.
Runtime
Runtime limits the amount of time that the monitor policy executes its actions from the time it is triggered. This setting prevents system resources from being occupied by incorrectly defined policies.
EAA environment variables
EAA environment variables decouple the configuration of action arguments from the monitor policy so you can modify a policy easily.
An EAA environment variable is defined as a <variable_name variable_value> pair and can be used in different policies. When you define an action, you can enter a variable name with a leading dollar sign ($variable_name). EAA will replace the variable name with the variable value when it performs the action.
To change the value for an action argument, modify the value specified in the variable pair instead of editing each affected monitor policy.
EAA environment variables include system-defined variables and user-defined variables.
System-defined variables
System-defined variables are provided by default, and they cannot be created, deleted, or modified by users. System-defined variable names start with an underscore (_) sign. The variable values are set automatically depending on the event setting in the policy that uses the variables.
System-defined variables include the following types:
· Public variable—Available for any events.
· Event-specific variable—Available only for a type of event.
Table 20 shows all system-defined variables.
Table 20 System-defined EAA environment variables by event type
|
Variable name |
Description |
|
Any event: |
|
|
_event_id |
Event ID. |
|
_event_type |
Event type. |
|
_event_type_string |
Event type description. |
|
_event_time |
Time when the event occurs. |
|
_event_severity |
Severity level of an event. |
|
CLI: |
|
|
_cmd |
Commands that are matched. |
|
Syslog: |
|
|
_syslog_pattern |
Log message content. |
|
Hotplug: |
|
|
_slot |
(Centralized devices.) 0. (Distributed devices.) ID of the slot where card hot-swapping occurs. (Centralized IRF devices.) ID of the member device that joins or leaves the IRF fabric. |
|
_subslot |
ID of the subslot where hot-swapping occurs. |
|
Interface: |
|
|
_ifname |
Interface name. |
|
SNMP: |
|
|
_oid |
OID of the MIB variable where an SNMP operation is performed. |
|
_oid_value |
Value of the MIB variable. |
|
SNMP-Notification: |
|
|
_oid |
OID that is included in the SNMP notification. |
|
Process: |
|
|
_process_name |
Process name. |
User-defined variables
You can use user-defined variables for all types of events.
User-defined variable names can contain digits, characters, and the underscore sign (_), except that the underscore sign cannot be the leading character.
Command and hardware compatibility
Commands and descriptions for centralized devices apply to the following routers:
· MSR810/810-W/810-W-DB/810-LM/810-W-LM/810-10-PoE/810-LM-HK/810-W-LM-HK/810-LMS/810-LUS.
· MSR2600-6-X1/2600-10-X1.
· MSR 2630.
· MSR3600-28/3600-51.
· MSR3600-28-SI/3600-51-SI.
· MSR3610-X1/3610-X1-DP/3610-X1-DC/3610-X1-DP-DC.
· MSR 3610/3620/3620-DP/3640/3660.
· MSR810-LM-GL/810-W-LM-GL/830-6EI-GL/830-10EI-GL/830-6HI-GL/830-10HI-GL/2600-6-X1-GL/3600-28-SI-GL.
Commands and descriptions for distributed devices apply to the following routers:
· MSR5620.
· MSR 5660.
· MSR 5680.
Configuring a user-defined EAA environment variable
Configure a user-defined EAA environment variable before you use it in an action.
To configure a user-defined EAA environment variable:
|
Step |
Command |
Remarks |
|
1. Enter system view. |
system-view |
N/A |
|
2. Configure a user-defined EAA environment variable. |
rtm environment var-name var-value |
By default, no user-defined environment variables exist. The system provides the system-defined variables in Table 20. |
Configuring a monitor policy
You can configure a monitor policy by using the CLI or Tcl.
Configuration restrictions and guidelines
When you configure monitor policies, follow these restrictions and guidelines:
· Make sure the actions in different policies do not conflict. Policy execution result will be unpredictable if policies that conflict in actions are running concurrently.
· You can assign the same policy name to a CLI-defined policy and a Tcl-defined policy. However, you cannot assign the same name to policies that are the same type.
· The system executes the actions in a policy in ascending order of action IDs. When you add actions to a policy, you must make sure the execution order is correct.
Configuring a monitor policy from the CLI
|
Step |
Command |
Remarks |
|
1. Enter system view. |
system-view |
N/A |
|
2. Enter CLI-defined policy view. |
rtm cli-policy policy-name |
If the policy does not exist, this command creates the policy first. |
|
3. Configure an event in the policy. |
·
Configure a CLI event: ·
Configure a hotplug event (Distributed devices
in standalone mode/centralized devices in standalone or IRF mode): ·
Configure a hotplug event (Distributed devices
in IRF mode): ·
Configure an interface event: ·
Configure a process event (Distributed devices
in standalone mode/centralized devices in standalone or IRF mode): ·
Configure a process event (Distributed devices
in IRF mode): ·
Configure an SNMP event: ·
Configure an SNMP-Notification event: ·
Configure a Syslog event: ·
Configure a track event: |
By default, a monitor policy does not contain an event. You can configure only one event in a monitor policy. If the monitor policy already contains an event, the new event overrides the old event. For support for the subslot subslot-number option in the event hotplug command, see EAA commands in Network Management and Monitoring Command Reference. |
|
4. Configure the actions to take when the event occurs. |
·
Configure a CLI action: ·
Configure a reboot action (Centralized devices
in standalone mode): ·
Configure a reboot action (Centralized devices
in IRF mode/distributed devices in standalone mode): ·
Configure a reboot action (Distributed devices
in IRF mode): ·
Configure a logging action: ·
Configure an active/standby switchover
action: |
By default, a monitor policy does not contain any actions. Repeat this step to add a maximum of 232 actions to the policy. When you define an action, you can specify a value or specify a variable name in $variable_name format for an argument. For support for the subslot subslot-number option in the action reboot command, see "EAA commands." |
|
5. (Optional.)Assign a user role to the policy. |
user-role role-name |
By default, a monitor policy contains user roles that its creator had at the time of policy creation. A monitor policy supports a maximum of 64 valid user roles. User roles added after this limit is reached do not take effect. An EAA policy cannot have both the security-audit user role and any other user roles. Any previously assigned user roles are automatically removed when you assign the security-audit user role to the policy. The previously assigned security-audit user role is automatically removed when you assign any other user roles to the policy. |
|
6. (Optional.) Set the duration that the policy executes its actions. |
running-time time |
By default, a CLI-defined policy executes its actions for a period of 20 seconds. |
|
7. Enable the policy. |
commit |
By default, CLI-defined policies are not enabled. A CLI-defined policy can take effect only after you perform this step. |
Configuring a monitor policy by using Tcl
|
Step |
Command |
Remarks |
|
1. Edit a Tcl script file (see Table 21). |
N/A |
The supported Tcl version is 8.5.8. |
|
2. Download the file to the device by using FTP or TFTP. |
N/A |
For more information about using FTP and TFTP, see Fundamentals Configuration Guide. |
|
3. Enter system view. |
system-view |
N/A |
|
4. Create a Tcl-defined policy and bind it to the Tcl script file. |
rtm tcl-policy policy-name tcl-filename |
· (Centralized devices in IRF mode.) Make sure the script file is saved on all IRF member devices. This practice ensures that the policy can run correctly after a master/subordinate switchover occurs or the member device where the script file resides leaves the IRF. · (Distributed devices in standalone mode or IRF mode.) Make sure the script file is saved on all MPUs. This practice ensures that the policy can run correctly after an active/standby or master/standby switchover occurs or the MPU where the script file resides fails or is removed. By default, no Tcl policies exist. This step enables the Tcl-defined policy. To revise the Tcl script of a policy, you must suspend all monitor policies first, and then resume the policies after you finish revising the script. The system cannot execute a Tcl-defined policy if you edit its Tcl script without suspending policies. |
Write a Tcl script in two lines for a monitor policy, as shown in Table 21.
Table 21 Tcl script requirements
|
Line |
Content |
Requirements |
|
Line 1 |
Event, user roles, and policy runtime |
This line must use the following format: The arg1 arg2 arg3 … arguments represent event matching rules. If an argument value contains spaces, use double quotation marks ("") to enclose the value. For example, "a b c." |
|
Line 2 |
Actions |
When you define an action, you can specify a value or specify a variable name in $variable_name format for an argument. The following actions are available: · Standard Tcl commands. · EAA-specific Tcl commands. · Commands supported by the device. |
Suspending monitor policies
This task suspends all CLI-defined and Tcl-defined monitor policies except for the policies that are running.
To suspend monitor policies:
|
Step |
Command |
Remarks |
|
1. Enter system view. |
system-view |
N/A |
|
2. Suspend monitor policies. |
rtm scheduler suspend |
To resume monitor polices, use the undo rtm scheduler suspend command. |
Displaying and maintaining EAA settings
Execute display commands except for the display this command in any view.
|
Task |
Command |
|
Display user-defined EAA environment variables. |
display rtm environment [ var-name] |
|
Display EAA monitor policies. |
display rtm policy { active | registered [ verbose ] } [ policy-name ] |
|
Display the running configuration of all CLI-defined monitor policies. |
display current-configuration |
|
Display the running configuration of a CLI-defined monitor policy in CLI-defined monitor policy view. |
display this |
EAA configuration examples
CLI event CLI-defined policy configuration example
Network requirements
Configure a policy from the CLI to monitor the event that occurs when a question mark (?) is entered at the command line that contains letters and digits.
When the event occurs, the system executes the command and sends the log message "hello world" to the information center.
Configuration procedure
# Create CLI-defined policy test and enter its view.
<Sysname> system-view
[Sysname] rtm cli-policy test
# Add a CLI event that occurs when a question mark (?) is entered at any command line that contains letters and digits.
[Sysname-rtm-test] event cli async mode help pattern [a-zA-Z0-9]
# Add an action that sends the message "hello world" with a priority of 4 from the logging facility local3 when the event occurs.
[Sysname-rtm-test] action 0 syslog priority 4 facility local3 msg “hello world”
# Add an action that enters system view when the event occurs.
[Sysname-rtm-test] action 2 cli system-view
# Add an action that creates VLAN 2 when the event occurs.
[Sysname-rtm-test] action 3 cli vlan 2
# Set the duration that the policy executes its actions to 2000 seconds.
[Sysname-rtm-test] running-time 2000
# Specify the network-admin user role for executing the policy.
[Sysname-rtm-test] user-role network-admin
# Enable the policy.
[Sysname-rtm-test] commit
Verifying the configuration
# Display information about the policy.
[Sysname-rtm-test] display rtm policy registered
Total number: 1
Type Event TimeRegistered PolicyName
CLI CLI Aug 29 14:56:50 2013 test
# Enable the information center to output log messages to the current monitoring terminal.
[Sysname-rtm-test] return
<Sysname> terminal monitor
# Enter a question mark (?) at a command line that contains a letter d. Verify that the system displays the "hello world" message and a policy successfully executed message on the terminal screen.
<Sysname>d?
debugging
delete
diagnostic-logfile
dir
display
<Sysname>d%May 7 02:10:03:218 2013 Sysname RTM/4/RTM_ACTION: "hello world"
%May 7 02:10:04:176 2013 Sysname RTM/6/RTM_POLICY: CLI policy test is running successfully.
Track event CLI-defined monitor policy configuration example
Network requirements
As shown in Figure 71, Device A has established BGP sessions with Device D and Device E. Traffic from Device D and Device E to the Internet is forwarded through Device A.
Configure a CLI-defined EAA monitor policy on Device A to disconnect the sessions with Device D and Device E when GigabitEthernet 1/0/1 connected to Device C is down. In this way, traffic from Device D and Device E to the Internet can be forwarded through Device B.
Configuration procedure
# Display BGP peer information for Device A.
<Sysname> display bgp peer ipv4
BGP local router ID: 1.1.1.1
Local AS number: 100
Total number of peers: 3 Peers in established state: 3
* - Dynamically created peer
Peer AS MsgRcvd MsgSent OutQ PrefRcv Up/Down State
10.2.1.2 200 13 16 0 0 00:16:12 Established
10.3.1.2 300 13 16 0 0 00:10:34 Established
10.3.2.2 300 13 16 0 0 00:10:38 Established
# Create track entry 1 and associate it with the link state of GigabitEthernet 1/0/1.
<Sysname> system-view
[Sysname] track 1 interface gigabitethernet 1/0/1
# Configure a CLI-defined EAA monitor policy so that the system automatically disables session establishment with Device D and Device E when GigabitEthernet 1/0/1 is down.
Sysname] rtm cli-policy test
[Sysname-rtm-test] event track 1 state negative
[Sysname-rtm-test] action 0 cli system-view
[Sysname-rtm-test] action 1 cli bgp 100
[Sysname-rtm-test] action 2 cli peer 10.3.1.2 ignore
[Sysname-rtm-test] action 3 cli peer 10.3.2.2 ignore
[Sysname-rtm-test] user-role network-admin
[Sysname-rtm-test] commit
[Sysname-rtm-test] quit
Verifying the configuration
# Shut down GigabitEthernet 1/0/1.
[Sysname] interface gigabitethernet 1/0/1
[Sysname-GigabitEthernet1/0/1] shutdown
# Display BGP peer information.
<Sysname> display bgp peer ipv4
BGP local router ID: 1.1.1.1
Local AS number: 100
Total number of peers: 0 Peers in established state: 0
* - Dynamically created peer
Peer AS MsgRcvd MsgSent OutQ PrefRcv Up/Down State
The command output shows that Device A does not have any BGP peers.
CLI event with EAA environment variables CLI-defined policy configuration example
Network requirements
Define an environment variable to match the IP address 1.1.1.1.
Configure a policy from the CLI to monitor the event that occurs when a command line that contains loopback0 is executed. In the policy, use the environment variable for IP address assignment.
When the event occurs, the system performs the following tasks:
· Creates the Loopback 0 interface.
· Assigns 1.1.1.1/24 to the interface.
· Sends the matching command line to the information center.
Configuration procedure
# Configure an EAA environment variable for IP address assignment. The variable name is loopback0IP, and the variable value is 1.1.1.1.
<Sysname>system-view
[Sysname] rtm environment loopback0IP 1.1.1.1
# Create the CLI-defined policy test and enter its view.
[Sysname] rtm cli-policy test
# Add a CLI event that occurs when a command line that contains loopback0 is executed.
[Sysname-rtm-test] event cli async mode execute pattern loopback0
# Add an action that enters system view when the event occurs.
[Sysname-rtm-test]action 0 cli system-view
# Add an action that creates interface Loopback 0 and enters loopback interface view.
[Sysname-rtm-test]action 1 cli interface loopback 0
# Add an action that assigns the IP address 1.1.1.1 to Loopback 0. The loopback0IP variable is used in the action for IP address assignment.
[Sysname-rtm-test]action 2 cli ip address $loopback0IP 24
# Add an action that sends the matching loopback0 command with a priority of 0 from the logging facility local7 when the event occurs.
[Sysname-rtm-test]action 3 syslog priority 0 facility local7 msg $_cmd
# Specify the network-admin user role for executing the policy.
[Sysname-rtm-test]user-role network-admin
# Enable the policy.
[Sysname-rtm-test]commit
[Sysname-rtm-test] return
<Sysname>
Verifying the configuration
# Enable the information center to output log messages to the current monitoring terminal.
<Sysname> terminal monitor
# Execute the loopback0 command. Verify that the system displays the loopback0 message and a policy successfully executed message on the terminal screen.
<Sysname> loopback0
<Sysname>
%Jan 3 09:46:10:592 2014 Sysname RTM/0/RTM_ACTION: loopback0
%Jan 3 09:46:10:613 2014 Sysname RTM/6/RTM_POLICY: CLI policy test is running successfully.
# Verify that Loopback 0 has been created and assigned the IP address 1.1.1.1.
<Sysname>display interface loopback brief
Brief information on interfaces in route mode:
Link: ADM - administratively down; Stby - standby
Protocol: (s) - spoofing
Interface Link Protocol Primary IP Description
Loop0 UP UP(s) 1.1.1.1
<Sysname>
CLI event Tcl-defined policy configuration example
Network requirements
As shown in Figure 72, use Tcl to create a monitor policy on the Device. This policy must meet the following requirements:
· EAA sends the log message "rtm_tcl_test is running" when a command that contains the display this string is entered.
· The system executes the command only after it executes the policy successfully.
Configuration procedure
# Edit a Tcl script file (rtm_tcl_test.tcl, in this example) for EAA to send the message "rtm_tcl_test is running" when a command that contains the display this string is executed.
::comware::rtm::event_register cli sync mode execute pattern display this user-role network-admin
::comware::rtm::action syslog priority 1 facility local4 msg rtm_tcl_test is running
# Download the Tcl script file from the TFTP server at 1.2.1.1.
<Sysname> tftp 1.2.1.1 get rtm_tcl_test.tcl
# Create Tcl-defined policy test and bind it to the Tcl script file.
<Sysname> system-view
[Sysname] rtm tcl-policy test rtm_tcl_test.tcl
[Sysname] quit
Verifying the configuration
# Display information about the policy.
<Sysname> display rtm policy registered
Total number: 1
Type Event TimeRegistered PolicyName
TCLCLI Aug 29 14:54:50 2013 test
# Enable the information center to output log messages to the current monitoring terminal.
<Sysname> terminal monitor
# Execute the display this command. Verify that the system displays the rtm_tcl_test is running message and a message that the policy is being successfully executed.
<Sysname>display this
#
return
<Sysname>%Jun 4 15:02:30:354 2013 Sysname RTM/1/RTM_ACTION: rtm_tcl_test is running
%Jun 4 15:02:30:382 2013 Sysname RTM/6/RTM_POLICY: TCL policy test is running successfully.
Monitoring and maintaining processes
Overview
H3C Comware 7 is a full-featured, modular, and scalable network operating system based on the Linux kernel. Comware 7 software features run the following types of independent processes:
· User process—Runs in user space. Most Comware 7 software features run user processes. Each process runs in an independent space so the failure of a process does not affect other processes. The system automatically monitors user processes. Comware 7 supports preemptive multithreading. A process can run multiple threads to support multiple activities. Whether a process supports multithreading depends on the software implementation.
· Kernel thread—Runs in kernel space. A kernel thread executes kernel code. It has a higher security level than a user process. If a kernel thread fails, the system breaks down. You can monitor the running status of kernel threads.
Command and hardware compatibility
Commands and descriptions for centralized devices apply to the following routers:
· MSR810/810-W/810-W-DB/810-LM/810-W-LM/810-10-PoE/810-LM-HK/810-W-LM-HK/810-LMS/810-LUS.
· MSR2600-6-X1/2600-10-X1.
· MSR 2630.
· MSR3600-28/3600-51.
· MSR3600-28-SI/3600-51-SI.
· MSR3610-X1/3610-X1-DP/3610-X1-DC/3610-X1-DP-DC.
· MSR 3610/3620/3620-DP/3640/3660.
· MSR810-LM-GL/810-W-LM-GL/830-6EI-GL/830-10EI-GL/830-6HI-GL/830-10HI-GL/2600-6-X1-GL/3600-28-SI-GL.
Commands and descriptions for distributed devices apply to the following routers:
· MSR5620.
· MSR 5660.
· MSR 5680.
Displaying and maintaining processes
Commands described in this section apply to both user processes and kernel threads. You can execute these commands in any view.
The system identifies a process that consumes excessive memory or CPU resources as an anomaly source.
To display and maintain processes (centralized devices in standalone mode):
|
Task |
Command |
|
Display memory usage. |
display memory |
|
Display process state information. |
display process [ all | job job-id | name process-name ] |
|
Display CPU usage for all processes. |
display process cpu |
|
Monitor process running state. |
monitor process [ dumbtty ] [ iteration number ] |
|
Monitor thread running state. |
monitor thread [ dumbtty ] [ iteration number ] |
To display and maintain processes (distributed devices in standalone mode/centralized devices in IRF mode):
|
Task |
Command |
|
Display memory usage. |
display memory [ slot slot-number [ cpu cpu-number ] ] |
|
Display process state information. |
display process [ all | job job-id | name process-name ] [ slot slot-number [ cpu cpu-number ] ] |
|
Display CPU usage for all processes. |
display process cpu [ slot slot-number [ cpu cpu-number ] ] |
|
Monitor process running state. |
monitor process [ dumbtty ] [ iteration number ] [ slot slot-number [ cpu cpu-number ] ] |
|
Monitor thread running state. |
monitor thread [ dumbtty ] [ iteration number ] [ slot slot-number [ cpu cpu-number ] ] |
To display and maintain processes (distributed devices in IRF mode):
|
Task |
Command |
|
Display memory usage. |
display memory [ chassis chassis-number slot slot-number [ cpu cpu-number ] ] |
|
Display process state information. |
display process [ all | job job-id | name process-name ] [ chassis chassis-number slot slot-number [ cpu cpu-number ] ] |
|
Display CPU usage for all processes. |
display process cpu [ chassis chassis-number slot slot-number [ cpu cpu-number ] ] |
|
Monitor process running state. |
monitor process [ dumbtty ] [ iteration number ] [ chassis chassis-number slot slot-number [ cpu cpu-number ] ] |
|
Monitor thread running state. |
monitor thread [ dumbtty ] [ iteration number ] [ chassis chassis-number slot slot-number [ cpu cpu-number ] ] |
For more information about the display memory command, see Fundamentals Command Reference.
Displaying and maintaining user processes
Execute display commands in any view and other commands in user view.
Centralized devices in standalone mode:
|
Task |
Command |
Remarks |
|
Display log information for all user processes. |
display process log |
N/A |
|
Display memory usage for all user processes. |
display process memory |
N/A |
|
Display heap memory usage for a user process. |
display process memory heap job job-id [ verbose ] |
N/A |
|
Display the addresses of memory blocks with a specified size used by a user process. |
display process memory heap job job-id size memory-size [ offset offset-size ] |
N/A |
|
Display memory content starting from a specified memory block for a user process. |
display process memory heap job job-id address starting-address length memory-length |
N/A |
|
Display context information for process exceptions. |
N/A |
|
|
Display the core file directory. |
N/A |
|
|
Enable or disable a process to generate core files for exceptions and set the maximum number of core files. |
process core { maxcore value | off } { job job-id | name process-name } |
By default, a process generates a core file for the first exception and does not generate any core files for subsequent exceptions. |
|
Specify the directory for saving core files. |
The default directory is the root directory of the default file system. |
|
|
Clear context information for process exceptions. |
N/A |
Distributed devices in standalone mode/centralized devices in IRF mode:
|
Task |
Command |
Remarks |
|
Display log information for all user processes. |
display process log [ slot slot-number [ cpu cpu-number ] ] |
N/A |
|
Display memory usage for all user processes. |
display process memory [ slot slot-number [ cpu cpu-number ] ] |
N/A |
|
Display heap memory usage for a user process. |
display process memory heap job job-id [ verbose ] [ slot slot-number [ cpu cpu-number ] ] |
N/A |
|
Display the addresses of memory blocks with a specified size used by a user process. |
display process memory heap job job-id size memory-size [ offset offset-size ] [ slot slot-number [ cpu cpu-number ] ] |
N/A |
|
Display memory content starting from a specified memory block for a user process. |
display process memory heap job job-id address starting-address length memory-length [ slot slot-number [ cpu cpu-number ] ] |
N/A |
|
Display context information for process exceptions. |
display exception context [ count value ] [ slot slot-number [ cpu cpu-number ] ] |
N/A |
|
Display the core file directory. |
display exception filepath [ slot slot-number [ cpu cpu-number ] ] |
N/A |
|
Enable or disable a process to generate core files for exceptions and set the maximum number of core files. |
By default, a process generates a core file for the first exception and does not generate any core files for subsequent exceptions. |
|
|
Specify the directory for saving core files. |
The default directory is the root directory of the default file system. |
|
|
Clear context information for process exceptions. |
reset exception context [ slot slot-number [ cpu cpu-number ] ] |
N/A |
Distributed devices in IRF mode:
|
Task |
Command |
Remarks |
|
Display log information for all user processes. |
display process log [ chassis chassis-number slot slot-number [ cpu cpu-number ] ] |
N/A |
|
Display memory usage for all user processes. |
display process memory [ chassis chassis-number slot slot-number [ cpu cpu-number ] ] |
N/A |
|
Display heap memory usage for a user process. |
display process memory heap job job-id [ verbose ] [ chassis chassis-number slot slot-number [ cpu cpu-number ] ] |
N/A |
|
Display the addresses of memory blocks with a specified size used by a user process. |
display process memory heap job job-id size memory-size [ offset offset-size ] [ chassis chassis-number slot slot-number [ cpu cpu-number ] ] |
N/A |
|
Display memory content starting from a specified memory block for a user process. |
display process memory heap job job-id address starting-address length memory-length [ chassis chassis-number slot slot-number [ cpu cpu-number ] ] |
N/A |
|
Display context information for process exceptions. |
N/A |
|
|
Display the core file directory. |
display exception filepath [ chassis chassis-number slot slot-number [ cpu cpu-number ] ] |
N/A |
|
Enable or disable a process to generate core files for exceptions and set the maximum number of core files. |
By default, a process generates a core file for the first exception and does not generate any core files for subsequent exceptions. |
|
|
Specify the directory for saving core files. |
The default directory is the root directory of the default file system. |
|
|
Clear context information for process exceptions. |
reset exception context [ chassis chassis-number slot slot-number [ cpu cpu-number ] ] |
N/A |
Starting or stopping a third-party process
Feature and hardware compatibility
|
Hardware |
Third-party process management compatibility |
|
MSR810/810-W/810-W-DB/810-LM/810-W-LM/810-10-PoE/810-LM-HK/810-W-LM-HK |
Yes |
|
MSR810-LMS/810-LUS |
No |
|
MSR2600-6-X1/2600-10-X1 |
No |
|
MSR 2630 |
No |
|
MSR3600-28/3600-51 |
No |
|
MSR3600-28-SI/3600-51-SI |
No |
|
MSR3610-X1/3610-X1-DP/3610-X1-DC/3610-X1-DP-DC |
No |
|
MSR 3610/3620/3620-DP/3640/3660 |
No |
|
MSR5620/5660/5680 |
No |
|
Hardware |
Third-party process management compatibility |
|
MSR810-LM-GL |
Yes |
|
MSR810-W-LM-GL |
Yes |
|
MSR830-6EI-GL |
Yes |
|
MSR830-10EI-GL |
Yes |
|
MSR830-6HI-GL |
Yes |
|
MSR830-10HI-GL |
Yes |
|
MSR2600-6-X1-GL |
No |
|
MSR3600-28-SI-GL |
No |
Starting a third-party process
|
Step |
Command |
Remarks |
|
1. Enter system view. |
system-view |
N/A |
|
2. Start a third-party process. |
third-part-process start name process-name [ arg args ] |
Third party processes are not automatically started at system startup. Use this command to start a third party process. |
Stopping a third-party process
|
Step |
Command |
Remarks |
|
1. Display the IDs of third party processes. |
display process all |
This command is available in any view. |
|
2. Enter system view. |
system-view |
N/A |
|
3. Stop a third-party process. |
third-part-process stop pid pid&<1-10> |
This command can be used to stop only processes started by using the third-part-process start command. |
Monitoring kernel threads
Tasks in this section help you quickly identify thread deadloop and starvation problems and their causes.
Configuring kernel thread deadloop detection
|
|
CAUTION: As a best practice, use the default settings. Inappropriate configuration of kernel thread deadloop detection can cause service problems or system breakdown. Make sure you understand the impact of this configuration on your network before you configure kernel thread deadloop detection. |
Kernel threads share resources. If a kernel thread monopolizes the CPU, other threads cannot run, resulting in a deadloop.
This feature enables the device to detect deadloops. If a thread occupies the CPU for a specific interval, the device considers that a deadloop has occurred. It generates a deadloop message and reboots to remove the deadloop.
To configure kernel thread deadloop detection (centralized devices in standalone mode):
|
Step |
Command |
Remarks |
|
1. Enter system view. |
system-view |
N/A |
|
2. Enable kernel thread deadloop detection. |
monitor kernel deadloop enable |
By default, kernel thread deadloop detection is disabled. |
|
3. (Optional.) Set the interval for identifying a kernel thread deadloop. |
monitor kernel deadloop time time |
The default is 8 seconds. |
|
4. (Optional.) Disable kernel thread deadloop detection for a kernel thread. |
monitor kernel deadloop exclude-thread tid |
After enabled, kernel thread deadloop detection monitors all kernel threads by default. |
To configure kernel thread deadloop detection (distributed devices in standalone mode/centralized devices in IRF mode):
|
Step |
Command |
Remarks |
|
1. Enter system view. |
system-view |
N/A |
|
2. Enable kernel thread deadloop detection. |
monitor kernel deadloop enable [ slot slot-number [ cpu cpu-number ] ] |
By default, kernel thread deadloop detection is disabled. |
|
3. (Optional.) Set the interval for identifying a kernel thread deadloop. |
monitor kernel deadloop time time [ slot slot-number [ cpu cpu-number ] ] |
The default is 8 seconds. |
|
4. (Optional.) Disable kernel thread deadloop detection for a kernel thread. |
monitor kernel deadloop exclude-thread tid [ slot slot-number [ cpu cpu-number ] ] |
After enabled, kernel thread deadloop detection monitors all kernel threads by default. |
To configure kernel thread deadloop detection (distributed devices in IRF mode):
|
Step |
Command |
Remarks |
|
1. Enter system view. |
system-view |
N/A |
|
2. Enable kernel thread deadloop detection. |
monitor kernel deadloop enable [ chassis chassis-number slot slot-number [ cpu cpu-number ] ] |
By default, kernel thread deadloop detection is disabled. |
|
3. (Optional.) Set the interval for identifying a kernel thread deadloop. |
monitor kernel deadloop time time [ chassis chassis-number slot slot-number [ cpu cpu-number ] ] |
The default is 8 seconds. |
|
4. (Optional.) Disable kernel thread deadloop detection for a kernel thread. |
monitor kernel deadloop exclude-thread tid [ chassis chassis-number slot slot-number [ cpu cpu-number ] ] |
After enabled, kernel thread deadloop detection monitors all kernel threads by default. |
Configuring kernel thread starvation detection
|
|
CAUTION: The system detects whether or not kernel thread starvation occurs after the device is powered up. Inappropriate configuration of kernel thread starvation detection can cause service problems or system breakdown. Make sure you understand the impact of this configuration on your network before you configure kernel thread starvation detection. |
Starvation occurs when a thread is unable to access shared resources.
Kernel thread starvation detection enables the system to detect and report thread starvation. If a thread is not executed within a specific interval, the system considers that a starvation has occurred, and generates a starvation message.
Thread starvation does not impact system operation. A starved thread can automatically run when certain conditions are met.
To configure kernel thread starvation detection (centralized devices in standalone mode):
|
Step |
Command |
Remarks |
|
1. Enter system view. |
system-view |
N/A |
|
2. Enable kernel thread starvation detection. |
monitor kernel starvation enable |
By default, the function is disabled. |
|
3. (Optional.) Set the interval for identifying a kernel thread starvation. |
monitor kernel starvation time time |
The default is 120 seconds. |
|
4. (Optional.) Disable kernel thread starvation detection for a kernel thread. |
monitor kernel starvation exclude-thread tid |
After enabled, kernel thread starvation detection monitors all kernel threads by default. |
To configure kernel thread starvation detection (distributed devices in standalone mode/centralized devices in IRF mode):
|
Step |
Command |
Remarks |
|
1. Enter system view. |
system-view |
N/A |
|
2. Enable kernel thread starvation detection. |
monitor kernel starvation enable [ slot slot-number [ cpu cpu-number ] ] |
By default, the function is disabled. |
|
3. (Optional.) Set the interval for identifying a kernel thread starvation. |
monitor kernel starvation time time [ slot slot-number [ cpu cpu-number ] ] |
The default is 120 seconds. |
|
4. (Optional.) Disable kernel thread starvation detection for a kernel thread. |
monitor kernel starvation exclude-thread tid [ slot slot-number [ cpu cpu-number ] ] |
After enabled, kernel thread starvation detection monitors all kernel threads by default. |
To configure kernel thread starvation detection (distributed devices in IRF mode):
|
Step |
Command |
Remarks |
|
1. Enter system view. |
system-view |
N/A |
|
2. Enable kernel thread starvation detection. |
monitor kernel starvation enable [ chassis chassis-number slot slot-number [ cpu cpu-number ] ] |
By default, the function is disabled. |
|
3. (Optional.) Set the interval for identifying a kernel thread starvation. |
monitor kernel starvation time time [ chassis chassis-number slot slot-number [ cpu cpu-number ] ] |
The default is 120 seconds. |
|
4. (Optional.) Disable kernel thread starvation detection for a kernel thread. |
monitor kernel starvation exclude-thread tid [ chassis chassis-number slot slot-number [ cpu cpu-number ] ] |
After enabled, kernel thread starvation detection monitors all kernel threads by default. |
Displaying and maintaining kernel threads
Execute display commands in any view and reset commands in user view.
Centralized devices in standalone mode:
|
Task |
Command |
|
Display kernel thread deadloop information. |
display kernel deadloop show-number [ offset ] [ verbose ] |
|
Display kernel thread deadloop detection configuration. |
display kernel deadloop configuration |
|
Display kernel thread exception information. |
display kernel exception show-number [ offset ] [ verbose ] |
|
Display kernel thread starvation detection configuration. |
display kernel starvation configuration |
|
Clear kernel thread deadloop information. |
reset kernel deadloop |
|
Clear kernel thread exception information. |
reset kernel exception |
Distributed devices in standalone mode/centralized devices in IRF mode:
|
Task |
Command |
|
Display kernel thread deadloop information. |
display kernel deadloop show-number [ offset ] [ verbose ] [ slot slot-number [ cpu cpu-number ] ] |
|
Display kernel thread deadloop detection configuration. |
display kernel deadloop configuration [ slot slot-number [ cpu cpu-number ] ] |
|
Display kernel thread exception information. |
display kernel exception show-number [ offset ] [ verbose ] [ slot slot-number [ cpu cpu-number ] ] |
|
Display kernel thread starvation detection configuration. |
display kernel starvation configuration [ slot slot-number [ cpu cpu-number ] ] |
|
Clear kernel thread deadloop information. |
reset kernel deadloop [ slot slot-number [ cpu cpu-number ] ] |
|
Clear kernel thread exception information. |
reset kernel exception [ slot slot-number [ cpu cpu-number ] ] |
Distributed devices in IRF mode:
|
Task |
Command |
|
Display kernel thread deadloop information. |
display kernel deadloop show-number [ offset ] [ verbose ] [ chassis chassis-number slot slot-number [ cpu cpu-number ] ] |
|
Display kernel thread deadloop detection configuration. |
display kernel deadloop configuration [ chassis chassis-number slot slot-number [ cpu cpu-number ] ] |
|
Display kernel thread exception information. |
display kernel exception show-number [ offset ] [ verbose ] [ chassis chassis-number slot slot-number [ cpu cpu-number ] ] |
|
Display kernel thread starvation detection configuration. |
display kernel starvation configuration [ chassis chassis-number slot slot-number [ cpu cpu-number ] ] |
|
Clear kernel thread deadloop information. |
reset kernel deadloop [ chassis chassis-number slot slot-number [ cpu cpu-number ] ] |
|
Clear kernel thread exception information. |
reset kernel exception [ chassis chassis-number slot slot-number [ cpu cpu-number ] ] |
Configuring samplers
Overview
A sampler selects a packet from sequential packets and sends the packet to other service modules for processing. Sampling is useful when you want to limit the volume of traffic to be analyzed. The sampled data is statistically accurate and sampling decreases the impact on the forwarding capacity of the device.
The following sampling modes are available:
· Fixed mode—The first packet is selected from sequential packets in each sampling.
· Random mode—Any packet might be selected from sequential packets in each sampling.
A sampler can sample packets for NetStream. Then, only the sampled packets are sent to and processed by the NetStream module. For more information about NetStream, see "Configuring NetStream."
Compatibility information
Feature and hardware compatibility
|
Hardware |
Sampler compatibility |
|
MSR810/810-W/810-W-DB/810-LM/810-W-LM/810-10-PoE/810-LM-HK/810-W-LM-HK |
Yes |
|
MSR810-LMS/810-LUS |
No |
|
MSR2600-6-X1/2600-10-X1 |
Yes |
|
MSR 2630 |
Yes |
|
MSR3600-28/3600-51 |
Yes |
|
MSR3600-28-SI/3600-51-SI |
Yes |
|
MSR3610-X1/3610-X1-DP/3610-X1-DC/3610-X1-DP-DC |
Yes |
|
MSR 3610/3620/3620-DP/3640/3660 |
Yes |
|
MSR5620/5660/5680 |
Yes |
|
Hardware |
Sampler compatibility |
|
MSR810-LM-GL |
Yes |
|
MSR810-W-LM-GL |
Yes |
|
MSR830-6EI-GL |
Yes |
|
MSR830-10EI-GL |
Yes |
|
MSR830-6HI-GL |
Yes |
|
MSR830-10HI-GL |
Yes |
|
MSR2600-6-X1-GL |
Yes |
|
MSR3600-28-SI-GL |
Yes |
Command and hardware compatibility
Commands and descriptions for centralized devices apply to the following routers:
· MSR810/810-W/810-W-DB/810-LM/810-W-LM/810-10-PoE/810-LM-HK/810-W-LM-HK/810-LMS/810-LUS.
· MSR2600-6-X1/2600-10-X1.
· MSR 2630.
· MSR3600-28/3600-51.
· MSR3600-28-SI/3600-51-SI.
· MSR3610-X1/3610-X1-DP/3610-X1-DC/3610-X1-DP-DC.
· MSR 3610/3620/3620-DP/3640/3660.
· MSR810-LM-GL/810-W-LM-GL/830-6EI-GL/830-10EI-GL/830-6HI-GL/830-10HI-GL/2600-6-X1-GL/3600-28-SI-GL.
Commands and descriptions for distributed devices apply to the following routers:
· MSR5620.
· MSR 5660.
· MSR 5680.
Creating a sampler
|
Step |
Command |
Remarks |
|
1. Enter system view. |
system-view |
N/A |
|
2. Create a sampler. |
sampler sampler-name mode { fixed | random } packet-interval [n-power ] rate |
By default, no samplers exist. |
Displaying and maintaining a sampler
Execute display commands in any view.
|
Task |
Command |
|
Display configuration information about the sampler (Centralized devices in standalone mode). |
display sampler [ sampler-name ] |
|
Display configuration information about the sampler (Distributed devices in standalone mode/centralized devices in IRF mode). |
display sampler [ sampler-name ] [ slot slot-number ] |
|
Display configuration information about the sampler (Distributed devices in IRF mode). |
display sampler [ sampler-name ] [ chassis chassis-number slot slot-number ] |
Sampler configuration example
Network requirements
As shown in Figure 73, configure samplers and NetStream as follows:
· Configure IPv4 NetStream on the device to collect statistics on incoming and outgoing traffic.
· Send the NetStream data to port 5000 on the NetStream server.
· Configure fixed sampling in the inbound direction to select the first packet from 256 packets on GigabitEthernet 1/0/1.
· Configure random sampling in the outbound direction to select one packet randomly from 1024 packets on GigabitEthernet 1/0/2.
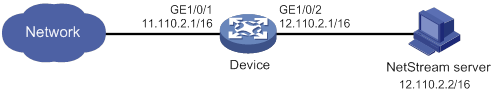
Configuration procedure
# Create sampler 256 in fixed sampling mode, and set the rate to 8. The first packet of 256 (2 to the 8th power) packets is selected.
<Device> system-view
[Device] sampler 256 mode fixed packet-interval n-power 8
# Create sampler 1024 in random sampling mode, and set the sampling rate to 1024. One packet from 1024 packets is selected.
[Device] sampler 1024 mode random packet-interval 1024
# Enable IPv4 NetStream to use sampler 256 to collect statistics about the incoming traffic on GigabitEthernet 1/0/1.
[Device] interface gigabitethernet 1/0/1
[Device-GigabitEthernet1/0/1] ip netstream inbound
[Device-GigabitEthernet1/0/1] ip netstream inbound sampler 256
[Device-GigabitEthernet1/0/1] quit
# Enable IPv4 NetStream to use sampler 1024 to collect statistics about outgoing traffic on GigabitEthernet 1/0/2.
[Device] interface gigabitethernet 1/0/2
[Device-GigabitEthernet1/0/2] ip netstream outbound
[Device-GigabitEthernet1/0/2] ip netstream outbound sampler 1024
[Device-GigabitEthernet1/0/2] quit
# Configure the address and port number of the NetStream server as the destination for the NetStream data export. Use the default source interface for the NetStream data export.
[Device] ip netstream export host 12.110.2.2 5000
Verifying the configuration
# Display configuration information for sampler 256 and sampler 1024.
[Device] display sampler 256
Sampler name: 256
Mode: Fixed; Packet-interval: 8; IsNpower: Y
[Device] display sampler 1024
Sampler name: 1024
Mode: Random; Packet-interval: 1024; IsNpower: N
Configuring port mirroring
Overview
Port mirroring copies the packets passing through a port to a port that connects to a data monitoring device for packet analysis.
Terminology
The following terms are used in port mirroring configuration.
Mirroring source
The mirroring sources can be one or more monitored ports called source ports.
Packets passing through mirroring sources are copied to a port connecting to a data monitoring device for packet analysis. The copies are called mirrored packets.
Source device
The device where the mirroring sources reside is called a source device.
Mirroring destination
The mirroring destination connects to a data monitoring device and is the destination port (also known as the monitor port) of mirrored packets. Mirrored packets are sent out of the monitor port to the data monitoring device.
A monitor port might receive multiple copies of a packet when it monitors multiple mirroring sources. For example, two copies of a packet are received on Port 1 when the following conditions exist:
· Port 1 is monitoring bidirectional traffic of Port 2 and Port 3 on the same device.
· The packet travels from Port 2 to Port 3.
Destination device
The device where the monitor port resides is called the destination device.
Mirroring direction
The mirroring direction specifies the direction of the traffic that is copied on a mirroring source.
· Inbound—Copies packets received.
· Outbound—Copies packets sent.
· Bidirectional—Copies packets received and sent.
Mirroring group
Port mirroring is implemented through mirroring groups. The device supports only local mirroring groups, in which mirroring sources and the mirroring destination are on the same device.
Local port mirroring implementation
In local port mirroring, the following conditions exist:
· The source device is directly connected to a data monitoring device.
· The source device acts as the destination device to forward mirrored packets to the data monitoring device.
A local mirroring group is a mirroring group that contains the mirroring sources and the mirroring destination on the same device.
Figure 74 Local port mirroring implementation
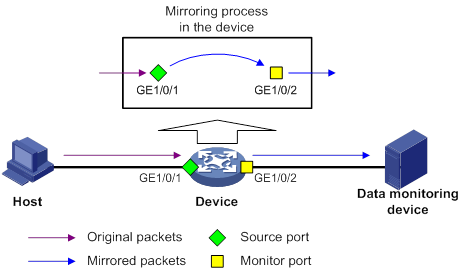
As shown in Figure 74, the source port GigabitEthernet 1/0/1 and the monitor port GigabitEthernet 1/0/2 reside on the same device. Packets received on GigabitEthernet 1/0/1 are copied to GigabitEthernet 1/0/2. GigabitEthernet 1/0/2 then forwards the packets to the data monitoring device for analysis.
Feature and hardware compatibility
|
Hardware |
Port mirroring compatibility |
|
MSR810/810-W/810-W-DB/810-LM/810-W-LM/810-10-PoE/810-LM-HK/810-W-LM-HK |
Yes |
|
MSR810-LMS/810-LUS |
No |
|
MSR2600-6-X1/2600-10-X1 |
Yes |
|
MSR 2630 |
Yes |
|
MSR3600-28/3600-51 |
Yes |
|
MSR3600-28-SI/3600-51-SI |
Yes |
|
MSR3610-X1/3610-X1-DP/3610-X1-DC/3610-X1-DP-DC |
Yes |
|
MSR 3610/3620/3620-DP/3640/3660 |
Yes |
|
MSR5620/5660/5680 |
Yes |
Configuring local port mirroring
A local mirroring group takes effect only when you configure the monitor port and the source ports for the local mirroring group.
Local port mirroring configuration task list
|
Tasks at a glance |
|
1. (Required.) Creating a local mirroring group |
|
2. (Required.) Configuring source ports for the local mirroring group |
|
3. (Required.) Configuring the monitor port for the local mirroring group |
Creating a local mirroring group
|
Step |
Command |
Remarks |
|
1. Enter system view. |
system-view |
N/A |
|
2. Create a local mirroring group. |
mirroring-group group-id local |
By default, no local mirroring groups exist. |
Configuring source ports for the local mirroring group
To configure source ports for a local mirroring group, use one of the following methods:
· Assign a list of source ports to the mirroring group in system view.
· Assign a port to the mirroring group as a source port in interface view.
To assign multiple ports to the mirroring group as source ports in interface view, repeat the operation.
Configuration restrictions and guidelines
When you configure source ports for a local mirroring group, follow these restrictions and guidelines:
· A mirroring group can contain multiple source ports.
· A port can act as a source port for only one mirroring group.
· A source port cannot be configured as an egress port or a monitor port.
Configuring source ports in system view
|
Step |
Command |
Remarks |
|
1. Enter system view. |
system-view |
N/A |
|
2. Configure source ports for a local mirroring group. |
mirroring-group group-id mirroring-port interface-list { both | inbound | outbound } |
By default, no source port is configured for a local mirroring group. |
Configuring source ports in interface view
|
Step |
Command |
Remarks |
|
1. Enter system view. |
system-view |
N/A |
|
2. Enter interface view. |
interface interface-type interface-number |
N/A |
|
3. Configure the port as a source port for a local mirroring group. |
mirroring-group group-id mirroring-port { both | inbound | outbound } |
By default, a port does not act as a source port for any local mirroring groups. |
Configuring the monitor port for the local mirroring group
To configure the monitor port for a mirroring group, use one of the following methods:
· Configure the monitor port for the mirroring group in system view.
· Assign a port to the mirroring group as the monitor port in interface view.
Use a monitor port only for port mirroring, so the data monitoring device receives only the mirrored traffic.
Configuring the monitor port in system view
|
Step |
Command |
Remarks |
|
1. Enter system view. |
system-view |
N/A |
|
2. Configure the monitor port for a local mirroring group. |
mirroring-group group-id monitor-port interface-type interface-number |
By default, no monitor port is configured for a local mirroring group. |
Configuring the monitor port in interface view
|
Step |
Command |
Remarks |
|
1. Enter system view. |
system-view |
N/A |
|
2. Enter interface view. |
interface interface-type interface-number |
N/A |
|
3. Configure the port as the monitor port for a mirroring group. |
mirroring-group group-id monitor-port |
By default, a port does not act as the monitor port for any local mirroring groups. |
Displaying and maintaining port mirroring
Execute display commands in any view.
|
Task |
Command |
|
Display mirroring group information. |
display mirroring-group { group-id | all | local } |
Local port mirroring configuration example
Network requirements
As shown in Figure 75, configure local port mirroring in source port mode to enable the server to monitor the bidirectional traffic of the two departments.
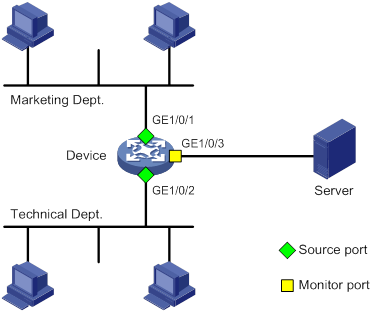
Configuration procedure
# Create local mirroring group 1.
<Device> system-view
[Device] mirroring-group 1 local
# Configure GigabitEthernet 1/0/1 and GigabitEthernet 1/0/2 as source ports for local mirroring group 1.
[Device] mirroring-group 1 mirroring-port gigabitethernet 1/0/1 gigabitethernet 1/0/2 both
# Configure GigabitEthernet 1/0/3 as the monitor port for local mirroring group 1.
[Device] mirroring-group 1 monitor-port gigabitethernet 1/0/3
Verifying the configuration
# Verify the mirroring group configuration.
[Device] display mirroring-group all
Mirroring group 1:
Type: Local
Status: Active
Mirroring port:
GigabitEthernet1/0/1 Both
GigabitEthernet1/0/2 Both
Monitor port: GigabitEthernet1/0/3
Configuring flow mirroring
Flow mirroring copies packets matching a class and sends the packets to a data monitoring device for packet analyzing and monitoring. It is implemented through QoS policies.
To configure flow mirroring, perform the following tasks:
· Define traffic classes and configure match criteria to classify packets to be mirrored. Flow mirroring allows you to flexibly classify packets to be analyzed by defining match criteria.
· Configure traffic behaviors to mirror the matching packets to an interface that connects to the data monitoring device.
For more information about QoS policies, traffic classes, and traffic behaviors, see ACL and QoS Configuration Guide.
Feature and hardware compatibility
|
Hardware |
Flow mirroring compatibility |
|
MSR810/810-W/810-W-DB/810-LM/810-W-LM/810-10-PoE/810-LM-HK/810-W-LM-HK |
Yes |
|
MSR810-LMS/810-LUS |
No |
|
MSR2600-6-X1/2600-10-X1 |
Yes |
|
MSR 2630 |
Yes |
|
MSR3600-28/3600-51 |
Yes |
|
MSR3600-28-SI/3600-51-SI |
Yes |
|
MSR3610-X1/3610-X1-DP/3610-X1-DC/3610-X1-DP-DC |
Yes |
|
MSR 3610/3620/3620-DP/3640/3660 |
Yes |
|
MSR5620/5660/5680 |
Yes |
Flow mirroring configuration task list
|
Tasks at a glance |
|
(Required.) Configuring a traffic class |
|
(Required.) Configuring a traffic behavior |
|
(Required.) Configuring a QoS policy |
|
(Required.) Applying a QoS policy: |
For more information about the following commands except the mirror-to command, see ACL and QoS Command Reference.
Configuring a traffic class
|
Step |
Command |
Remarks |
|
1. Enter system view. |
system-view |
N/A |
|
2. Create a traffic class and enter traffic class view. |
traffic classifier tcl-name [ operator { and | or } ] |
By default, no traffic classes exist. |
|
3. Configure match criteria. |
if-match [ not ] match-criteria |
By default, no match criterion is configured in a traffic class. |
Configuring a traffic behavior
|
Step |
Command |
Remarks |
|
1. Enter system view. |
system-view |
N/A |
|
2. Create a traffic behavior and enter traffic behavior view. |
traffic behavior behavior-name |
By default, no traffic behaviors exist. |
|
3. Configure a mirroring action to mirror traffic to an interface. |
mirror-to interface interface-type interface-number |
By default, no mirroring action is configured for a traffic behavior. |
|
4. (Optional.) Display traffic behavior configuration. |
display traffic behavior |
Available in any view. |
Configuring a QoS policy
|
Step |
Command |
Remarks |
|
1. Enter system view. |
system-view |
N/A |
|
2. Create a QoS policy and enter QoS policy view. |
qos policy policy-name |
By default, no QoS policies exist. |
|
3. Associate a class with a traffic behavior in the QoS policy. |
classifier tcl-name behavior behavior-name |
By default, no traffic behavior is associated with a class. |
|
4. (Optional.) Display QoS policy configuration. |
display qos policy |
Available in any view. |
Applying a QoS policy
Applying a QoS policy to an interface
By applying a QoS policy to an interface, you can mirror the traffic in the specified direction of the interface. A policy can be applied to multiple interfaces. In one direction (inbound or outbound) of an interface, only one policy can be applied.
To apply a QoS policy to an interface:
|
Step |
Command |
|
1. Enter system view. |
system-view |
|
2. Enter interface view. |
interface interface-type interface-number |
|
3. Apply a policy to the interface. |
qos apply policy policy-name { inbound | outbound } |
Applying a QoS policy to the control plane
You can apply a QoS policy to the control plane to mirror the traffic in the specified direction of all ports on the control plane.
To apply a QoS policy to the control plane:
|
Step |
Command |
|
1. Enter system view. |
system-view |
|
2. Enter control plane view. |
·
Centralized devices in standalone mode: ·
Distributed devices in standalone
mode/centralized devices in IRF mode: ·
Distributed devices in IRF mode: |
|
3. Apply a QoS policy to the control plane. |
qos apply policy policy-name inbound |
Flow mirroring configuration example
Network requirements
As shown in Figure 76, configure flow mirroring so that the server can monitor the following traffic:
· All traffic that the Technical Department sends to access the Internet.
· IP traffic that the Technical Department sends to the Marketing Department during working hours (8:00 to 18:00) on weekdays.
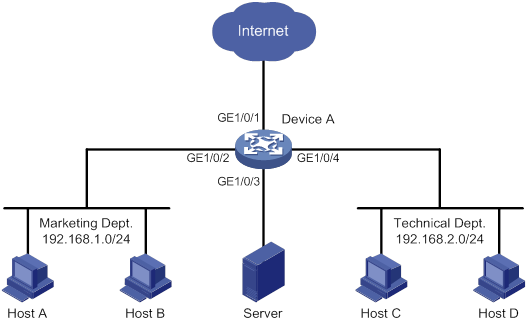
Configuration procedure
# Create a working hour range work, in which working hours are from 8:00 to 18:00 on weekdays.
<DeviceA> system-view
[DeviceA] time-range work 8:00 to 18:00 working-day
# Create IPv4 advanced ACL 3000 to allow packets from the Technical Department to access the Internet and to the Marketing Department during working hours.
[DeviceA] acl advanced 3000
[DeviceA-acl-ipv4-adv-3000] rule permit tcp source 192.168.2.0 0.0.0.255 destination-port eq www
[DeviceA-acl-ipv4-adv-3000] rule permit ip source 192.168.2.0 0.0.0.255 destination 192.168.1.0 0.0.0.255 time-range work
[DeviceA-acl-ipv4-adv-3000] quit
# Create traffic class tech_c, and configure the match criterion as ACL 3000.
[DeviceA] traffic classifier tech_c
[DeviceA-classifier-tech_c] if-match acl 3000
[DeviceA-classifier-tech_c] quit
# Create traffic behavior tech_b, configure the action of mirroring traffic to port GigabitEthernet 1/0/3.
[DeviceA] traffic behavior tech_b
[DeviceA-behavior-tech_b] mirror-to interface gigabitethernet 1/0/3
[DeviceA-behavior-tech_b] quit
# Create QoS policy tech_p, and associate traffic class tech_c with traffic behavior tech_b in the QoS policy.
[DeviceA] qos policy tech_p
[DeviceA-qospolicy-tech_p] classifier tech_c behavior tech_b
[DeviceA-qospolicy-tech_p] quit
# Apply QoS policy tech_p to the incoming packets of GigabitEthernet 1/0/4.
[DeviceA] interface gigabitethernet 1/0/4
[DeviceA-GigabitEthernet1/0/4] qos apply policy tech_p inbound
[DeviceA-GigabitEthernet1/0/4] quit
Verifying the configuration
# Verify that the server can monitor the following traffic:
· All traffic sent by the Technical Department to access the Internet.
· IP traffic that the Technical Department sends to the Marketing Department during working hours on weekdays.
(Details not shown.)
Configuring NetStream
Overview
NetStream is an accounting technology that provides statistics on a per-flow basis. An IPv4 flow is defined by the following 7-tuple elements:
· Destination IP address.
· Source IP address.
· Destination port number.
· Source port number.
· Protocol number.
· ToS.
· Inbound or outbound interface.
NetStream architecture
A typical NetStream system includes the following elements:
· NetStream data exporter—A device configured with NetStream. The NDE provides the following functions:
? Classifies traffic flows by using the 7-tuple elements.
? Collects data from the classified flows.
? Aggregates and exports the data to the NSC.
· NetStream collector—A program running in an operation system. The NSC parses the packets received from the NDEs, and saves the data to its database.
· NetStream data analyzer—A network traffic analyzing tool. Based on the data in NSC, the NDA generates reports for traffic billing, network planning, and attack detection and monitoring. The NDA can collect data from multiple NSCs. Typically, the NDA features a Web-based system for easy operation.
NSC and NDA are typically integrated into a NetStream server.
H3C network devices act as NDEs in the NetStream system. This document focuses on NDE configuration.
Figure 77 NetStream system
Flow aging
NetStream uses flow aging to enable the NDE to export NetStream data to NetStream servers. NetStream creates a NetStream entry for each flow for storing the flow statistics in the cache.
When a flow is aged out, the NDE performs the following operations:
· Exports the summarized data to NetStream servers in a NetStream export format.
· Clears NetStream entry information in the cache.
For more information about flow aging types and configurations, see "Configuring NetStream flow aging."
NetStream data export
Traditional data export
Traditional NetStream collects the statistics of each flow and exports the statistics to NetStream servers.
This method consumes more bandwidth and CPU than the aggregation method, and it requires a large cache size.
Aggregation data export
NetStream aggregation merges the flow statistics according to the aggregation criteria of an aggregation mode, and it sends the summarized data to NetStream servers. The NetStream aggregation data export uses less bandwidth than the traditional data export.
Table 22 lists the available aggregation modes. In each mode, the system merges statistics for multiple flows into statistics for one aggregate flow if each aggregation criterion is of the same value. The system records the statistics for the aggregate flow. These aggregation modes work independently and can take effect concurrently.
For example, when the aggregation mode configured on the NDE is protocol-port, NetStream aggregates the statistics of flow entries by protocol number, source port, and destination port. Four NetStream entries record four TCP flows with the same destination address, source port, and destination port, but with different source addresses. In the aggregation mode, only one NetStream aggregation entry is created and sent to NetStream servers.
Table 22 NetStream aggregation modes
|
Aggregation mode |
Aggregation criteria |
|
AS aggregation |
· Source AS number · Destination AS number · Inbound interface index · Outbound interface index |
|
Protocol-port aggregation |
· Protocol number · Source port · Destination port |
|
Source-prefix aggregation |
· Source AS number · Source address mask length · Source prefix (source network address) · Inbound interface index |
|
Destination-prefix aggregation |
· Destination AS number · Destination address mask length · Destination prefix (destination network address) · Outbound interface index |
|
Prefix aggregation |
· Source AS number · Destination AS number · Source address mask length · Destination address mask length · Source prefix · Destination prefix · Inbound interface index · Outbound interface index |
|
Prefix-port aggregation |
· Source prefix · Destination prefix · Source address mask length · Destination address mask length · ToS · Protocol number · Source port · Destination port · Inbound interface index · Outbound interface index |
|
ToS-AS aggregation |
· ToS · Source AS number · Destination AS number · Inbound interface index · Outbound interface index |
|
ToS-source-prefix aggregation |
· ToS · Source AS number · Source prefix · Source address mask length · Inbound interface index |
|
ToS-destination-prefix aggregation |
· ToS · Destination AS number · Destination address mask length · Destination prefix · Outbound interface index |
|
ToS-prefix aggregation |
· ToS · Source AS number · Source prefix · Source address mask length · Destination AS number · Destination address mask length · Destination prefix · Inbound interface index · Outbound interface index |
|
ToS-protocol-port aggregation |
· ToS · Protocol type · Source port · Destination port · Inbound interface index · Outbound interface index |
|
ToS-BGP-nexthop |
· ToS · BGP next hop · Outbound interface index |
If packets are not forwarded according to the BGP routing table, the AS number or BGP next hop cannot be obtained.
NetStream export formats
NetStream exports data in UDP datagrams in one of the following formats:
· Version 5—Exports original statistics collected based on the 7-tuple elements and does not support the NetStream aggregation data export. The packet format is fixed and cannot be extended.
· Version 8—Supports the NetStream aggregation data export. The packet format is fixed and cannot be extended.
· Version 9—Based on templates that can be defined according to the template formats defined in RFCs. The version 9 format supports exporting the NetStream aggregation data and collecting statistics about BGP next hop and MPLS packets.
NetStream filtering
NetStream filtering uses an ACL to identify packets. Whether NetStream collects data for identified packets depends on the action in the matching rule.
· NetStream collects data for packets that match permit rules in the ACL.
· NetStream does not collect data for packets that match deny rules in the ACL.
For more information about ACL, see ACL and QoS Configuration Guide.
NetStream sampling
NetStream sampling collects statistics on fewer packets and is useful when the network has a large amount of traffic. NetStream on sampled traffic lessens the impact on the device's performance. For more information about sampling, see "Configuring samplers."
Command and hardware compatibility
Commands and descriptions for centralized devices apply to the following routers:
· MSR810/810-W/810-W-DB/810-LM/810-W-LM/810-10-PoE/810-LM-HK/810-W-LM-HK/810-LMS/810-LUS.
· MSR2600-6-X1/2600-10-X1.
· MSR 2630.
· MSR3600-28/3600-51.
· MSR3600-28-SI/3600-51-SI.
· MSR3610-X1/3610-X1-DP/3610-X1-DC/3610-X1-DP-DC.
· MSR 3610/3620/3620-DP/3640/3660.
· MSR810-LM-GL/810-W-LM-GL/830-6EI-GL/830-10EI-GL/830-6HI-GL/830-10HI-GL/2600-6-X1-GL/3600-28-SI-GL.
Commands and descriptions for distributed devices apply to the following routers:
· MSR5620.
· MSR 5660.
· MSR 5680.
NetStream configuration task list
When you configure NetStream, choose the following configurations as needed:
· Choose the device on which you want to enable NetStream.
· If multiple service flows are passing through the NDE, use an ACL to select the target traffic.
· If the network has a large amount of traffic, configure NetStream sampling.
· Determine the export format for the NetStream data export.
· Configure NetStream flow aging.
· To reduce the bandwidth consumption of the NetStream data export, configure NetStream aggregation.
Figure 78 NetStream configuration flow
To configure NetStream, perform the following tasks:
|
Tasks at a glance |
|
(Required.) Enabling NetStream on an interface |
|
(Optional.) Configuring NetStream filtering |
|
(Optional.) Configuring NetStream sampling |
|
(Optional.) Enabling NetStream for outgoing packets before IPsec encapsulation |
|
(Optional.) Configuring attributes of the NetStream data export |
|
(Optional.) Configuring NetStream flow aging |
|
(Required.) Perform at least one of the following tasks to configure NetStream data export: |
Enabling NetStream on an interface
|
Step |
Command |
Remarks |
|
1. Enter system view. |
system-view |
N/A |
|
2. Enter interface view. |
interface interface-type interface-number |
N/A |
|
3. Enable NetStream on the interface. |
ip netstream { inbound | outbound } |
By default, NetStream is disabled on an interface. |
Configuring NetStream filtering
When you configure NetStream filtering, follow these restrictions and guidelines:
· When NetStream filtering and sampling are both configured, packets are filtered first, and then the permitted packets are sampled.
· The NetStream filtering feature does not take effect on MPLS packets.
To configure NetStream filtering:
|
Step |
Command |
Remarks |
|
1. Enter system view. |
system-view |
N/A |
|
2. Enter interface view. |
interface interface-type interface-number |
N/A |
|
3. Enable NetStream filtering on the interface. |
ip netstream { inbound | outbound } filter acl ipv4-acl-number |
By default, NetStream filtering is disabled. NetStream collects statistics of all IPv4 packets passing through the interface. |
Configuring NetStream sampling
|
Step |
Command |
Remarks |
|
1. Enter system view. |
system-view |
N/A |
|
2. Create a sampler. |
sampler sampler-name mode { fixed | random } packet-interval rate |
For more information about a sampler, see "Configuring samplers." |
|
3. Enter interface view. |
interface interface-type interface-number |
N/A |
|
4. Enable NetStream sampling. |
ip netstream [ inbound | outbound ] sampler sampler-name |
By default, NetStream sampling is disabled. |
Enabling NetStream for outgoing packets before IPsec encapsulation
|
Step |
Command |
Remarks |
|
1. Enter system view. |
system-view |
N/A |
|
2. Enter interface view. |
interface interface-type interface-number |
N/A |
|
3. Enable NetStream in the outbound direction of the interface. |
ip netstream outbound |
By default, NetStream is disabled in the outbound direction of an interface. |
|
4. Enable NetStream for outgoing packets before IPsec encapsulation. |
ip netstream ipsec raw-packet |
By default, NetStream is enabled for outgoing IPsec encapsulated packets. |
Configuring attributes of the NetStream data export
Configuring the NetStream data export format
NetStream exports NetStream data in version 5 or version 9 format, and the data fields can be expanded to contain additional information, including the following:
· Statistics about source AS, destination AS, and peer ASs in version 5 or version 9 format.
· Statistics about BGP next hop only in version 9 format.
To configure the NetStream data export format:
|
Step |
Command |
Remarks |
|
1. Enter system view. |
system-view |
N/A |
|
2. Configure the NetStream data export format, and specify whether to record AS and BGP next hop information. |
· ip netstream export version 5 { origin-as | peer-as } · ip netstream export version 9 { origin-as | peer-as } [ bgp-nexthop ] |
By default: · The NetStream traditional data export uses the version 9 format. · MPLS flow data is not exported. · The peer AS numbers are exported for the source and destination. · The BGP next hop is not exported. |
Configuring the refresh rate for NetStream version 9 templates
Version 9 is template-based and supports user-defined formats. An NetStream device must send the version 9 templates to NetStream servers regularly, because the servers do not permanently save templates.
For a NetStream server to use correct version 9 templates, configure the refresh frequency or refresh interval for version 9 templates. If both settings are configured, templates are sent when either of the conditions is met.
A NetStream entry records the source IP address and destination IP address, and two AS numbers for each IP address. The origin-as and peer-as keywords in the ip netstream export version 5 and ip netstream export version 9 commands specify the AS numbers to be exported.
· origin-as—Specifies the source AS of the source address and the destination AS of the destination address.
· peer-as—Specifies the ASs before and after the AS where the NetStream device resides as the source AS and the destination AS, respectively.
For example, as shown in Figure 79, a flow starts at AS 20, passes AS 21 through AS 23, and then reaches AS 24. NetStream is enabled on the device in AS 22.
· The origin-as keyword defines AS 20 as the source AS and AS 24 as the destination AS.
· The peer-as keyword defines AS 21 as the source AS and AS 23 as the destination AS.
Figure 79 Recorded AS information varies by different keyword configurations
To configure the refresh rate for NetStream version 9 templates:
|
Step |
Command |
Remarks |
|
1. Enter system view. |
system-view |
N/A |
|
2. Configure the refresh frequency for NetStream version 9 templates. |
By default, the version 9 templates are sent every 20 packets. |
|
|
3. Configure the refresh interval for NetStream version 9 templates. |
By default, the version 9 templates are sent every 30 minutes. |
Configuring MPLS-aware NetStream
An MPLS flow is identified by the same labels in the same position and the same 7-tuple elements. MPLS-aware NetStream collects statistics on a maximum of three labels in the label stack, with or without IP fields.
To configure MPLS-aware NetStream:
|
Step |
Command |
Remarks |
|
1. Enter system view. |
system-view |
N/A |
|
2. Collect statistics on MPLS packets. |
ip netstream mpls [ label-positions label-position1 [ label-position2 [ label-position3 ] ] ] [ no-ip-fields ] |
By default, statistics about MPLS packets are not collected. |
Configuring NetStream flow aging
Flow aging methods
Periodical aging
Periodical aging uses the following methods:
· Inactive flow aging—A flow is inactive if no packet arrives for this NetStream entry within the period specified by using the ip netstream timeout inactive command. When the inactive flow aging timer expires, the following events occur:
? The inactive flow entry is aged out.
? The statistics of the flow are sent to NetStream servers and are cleared in the cache. The statistics can no longer be displayed by using the display ip netstream cache command.
When you use the inactive flow aging method, the cache is large enough for new flow entries.
· Active flow aging—A flow is active if packets arrive for the NetStream entry within the period specified by using the ip netstream timeout active command. When the active flow aging timer expires, the statistics of the active flow are exported to NetStream servers. The device continues to collect active flow statistics, which can be displayed by using the display ip netstream cache command. The active flow aging method periodically exports the statistics of active flows to NetStream servers.
Forced aging
To implement forced aging, use one of the following commands:
· Use the reset ip netstream statistics command. This command ages out all NetStream entries, and exports and clears the statistics.
· Use the ip netstream max-entry command. This command provides the following processing options when the upper limit is reached:
? Age out the oldest entries.
? Disable creation of a new entry in the cache.
Configuration procedure
|
Step |
Command |
Remarks |
|
1. Enter system view. |
system-view |
N/A |
|
2. (Optional.) Configure periodical aging. |
·
Set the aging timer for active flows: ·
Set the aging timer for inactive flows: |
By default: · The aging timer for active flows is 30 minutes. · The aging timer for inactive flows is 30 seconds. |
|
3. (Optional.) Configure forced aging. |
·
Set the upper limit for NetStream entries: · Manually age out NetStream entries: a. Return to user view: b. Age out NetStream entries: |
Configuring the NetStream data export
Configuring the NetStream traditional data export
|
Step |
Command |
Remarks |
|
1. Enter system view. |
system-view |
N/A |
|
2. Specify a destination host for NetStream traditional data export. |
ip netstream export host ip-address udp-port [ vpn-instance vpn-instance-name ] |
By default, no destination host is specified. No NetStream traditional data is exported. |
|
3. (Optional.) Specify the source interface for NetStream data packets sent to NetStream servers. |
ip netstream export source interface interface-type interface-number |
By default, no source interface is specified for NetStream data packets. The packets take the primary IP address of the output interface as the source IP address. |
|
4. (Optional.) Limit the data export rate. |
ip netstream export rate rate |
By default, the data export rate is not limited. |
Configuring the NetStream aggregation data export
Configuration restrictions and guidelines
When you configure the NetStream aggregation data export, follow these restrictions and guidelines:
· Configurations in NetStream aggregation mode view apply only to the NetStream aggregation data export, and those in system view apply to the NetStream traditional data export. If configurations in NetStream aggregation mode view are not provided, the configurations in system view apply to the NetStream aggregation data export.
· If the version 5 format is configured to export NetStream data, NetStream aggregation data export uses the version 8 format.
Configuration procedure
To configure the NetStream aggregation data export:
|
Step |
Command |
Remarks |
|
1. Enter system view. |
system-view |
N/A |
|
2. Specify a NetStream aggregation mode and enter its view. |
ip netstream aggregation { as | destination-prefix | prefix | prefix-port | protocol-port | source-prefix | tos-as | tos-bgp-nexthop | tos-destination-prefix | tos-prefix | tos-protocol-port | tos-source-prefix } |
By default, no NetStream aggregation mode is specified |
|
3. Enable the NetStream aggregation mode. |
enable |
By default, NetStream aggregation is disabled. |
|
4. Specify a destination host for NetStream aggregation data export. |
ip netstream export host ip-address udp-port [ vpn-instance vpn-instance-name ] |
By default, no destination host is specified. If you expect only NetStream aggregation data, specify the destination host only in the related NetStream aggregation mode view. |
|
5. (Optional.) Specify the source interface for NetStream data packets sent to NetStream servers. |
ip netstream export source interface interface-type interface-number |
By default, no source interface is specified for NetStream data packets. The packets take the primary IP address of the output interface as the source IP address. Source interfaces in different NetStream aggregation mode views can be different. If no source interface is configured in NetStream aggregation mode view, the source interface configured in system view applies. |
Displaying and maintaining NetStream
Execute display commands in any view and reset commands in user view.
|
Task |
Command |
|
Display NetStream entry information (centralized devices in standalone mode). |
|
|
Display NetStream entry information (distributed devices in standalone mode/centralized devices in IRF mode). |
|
|
Display NetStream entry information (distributed devices in IRF mode). |
|
|
Display information about the NetStream data export. |
display ip netstream export |
|
Display NetStream template information (centralized devices in standalone mode). |
display ip netstream template |
|
Display NetStream template information (distributed devices in standalone mode/centralized devices in IRF mode). |
|
|
Display NetStream template information (distributed devices in IRF mode). |
display ip netstream template [ chassis chassis-number slot slot-number ] |
|
Age out and export all NetStream data, and clear the cache. |
reset ip netstream statistics |
NetStream configuration examples
NetStream traditional data export configuration example
Network requirements
As shown in Figure 80, configure NetStream on the router to collect statistics on packets passing through the router.
· Enable NetStream for incoming and outgoing traffic on GigabitEthernet 1/0/1.
· Configure the router to export NetStream traditional data to UDP port 5000 of the NetStream server.
Configuration procedure
# Assign an IP address to each interface, as shown in Figure 80. (Details not shown.)
# Enable NetStream for incoming and outgoing traffic on GigabitEthernet 1/0/1.
<Router> system-view
[Router] interface gigabitethernet 1/0/1
[Router-GigabitEthernet1/0/1] ip netstream inbound
[Router-GigabitEthernet1/0/1] ip netstream outbound
[Router-GigabitEthernet1/0/1] quit
# Specify 12.110.2.2 as the IP address of the destination host and UDP port 5000 as the export destination port number.
[Router] ip netstream export host 12.110.2.2 5000
Verifying the configuration
# Display NetStream entry information.
[Router] display ip netstream cache
IP NetStream cache information:
Active flow timeout : 30 min
Inactive flow timeout : 30 sec
Max number of entries : 1024
IP active flow entries : 2
MPLS active flow entries : 0
L2 active flow entries : 0
IPL2 active flow entries : 0
IP flow entries counted : 0
MPLS flow entries counted : 0
L2 flow entries counted : 0
IPL2 flow entries counted : 0
Last statistics resetting time : Never
IP packet size distribution (11 packets in total):
1-32 64 96 128 160 192 224 256 288 320 352 384 416 448 480
.000 .000 .909 .000 .000 .090 .000 .000 .000 .000 .000 .000 .000 .000 .000
512 544 576 1024 1536 2048 2560 3072 3584 4096 4608 >4608
.000 .000 .000 .000 .000 .000 .000 .000 .000 .000 .000 .000
Protocol Total Packets Flows Packets Active(sec) Idle(sec)
Flows /sec /sec /flow /flow /flow
---------------------------------------------------------------------------
Type DstIP(Port) SrcIP(Port) Pro ToS VNI APPID If(Direct) Pkts
DstMAC(VLAN) SrcMAC(VLAN)
TopLblType(IP/MASK) Lbl-Exp-S-List
---------------------------------------------------------------------------
IP 10.1.1.1 (21) 100.1.1.2(1024) 1 0 N/A 0x0 GE1/0/1(I) 5
IP 100.1.1.2 (1024) 10.1.1.1 (21) 1 0 N/A 0x0 GE1/0/1(O) 5
# Display information about the NetStream data export.
[Router] display ip netstream export
IP export information:
Flow source interface : Not specified
Flow destination VPN instance : Not specified
Flow destination IP address (UDP) : 12.110.2.2 (5000)
Version 5 exported flows number : 0
Version 5 exported UDP datagrams number (failed): 0 (0)
Version 9 exported flows number : 10
Version 9 exported UDP datagrams number (failed): 10 (0)
NetStream aggregation data export configuration example
Network requirements
As shown in Figure 81, all routers in the network are running EBGP. Configure NetStream on the router to meet the following requirements:
· Use version 5 format to export NetStream traditional data to port 5000 of the NetStream server.
· Perform NetStream aggregation in the modes of AS, protocol-port, source-prefix, destination-prefix, and prefix.
· Export the aggregation data of different modes to 4.1.1.1, with UDP ports 2000, 3000, 4000, 6000, and 7000.
Configuration procedure
# Assign an IP address to each interface, as shown in Figure 81. (Details not shown.)
# Specify version 5 format to export NetStream traditional data.
<Router> system-view
[Router] ip netstream export version 5 origin-as
# Enable NetStream for incoming and outgoing traffic on GigabitEthernet 1/0/1.
[Router] interface gigabitethernet 1/0/1
[Router-GigabitEthernet1/0/1] ip netstream inbound
[Router-GigabitEthernet1/0/1] ip netstream outbound
[Router-GigabitEthernet1/0/1] quit
# Specify 4.1.1.1 as the IP address of the destination host and UDP port 5000 as the export destination port number.
[Router] ip netstream export host 4.1.1.1 5000
# Set the aggregation mode to AS, and specify the destination host for the aggregation data export.
[Router] ip netstream aggregation as
[Router-ns-aggregation-as] enable
[Router-ns-aggregation-as] ip netstream export host 4.1.1.1 2000
[Router-ns-aggregation-as] quit
# Set the aggregation mode to protocol-port, and specify the destination host for the aggregation data export.
[Router] ip netstream aggregation protocol-port
[Router-ns-aggregation-protport] enable
[Router-ns-aggregation-protport] ip netstream export host 4.1.1.1 3000
[Router-ns-aggregation-protport] quit
# Set the aggregation mode to source-prefix, and specify the destination host for the aggregation data export.
[Router] ip netstream aggregation source-prefix
[Router-ns-aggregation-srcpre] enable
[Router-ns-aggregation-srcpre] ip netstream export host 4.1.1.1 4000
[Router-ns-aggregation-srcpre] quit
# Set the aggregation mode to destination-prefix, and specify the destination host for the aggregation data export.
[Router] ip netstream aggregation destination-prefix
[Router-ns-aggregation-dstpre] enable
[Router-ns-aggregation-dstpre] ip netstream export host 4.1.1.1 6000
[Router-ns-aggregation-dstpre] quit
# Set the aggregation mode to prefix, and specify the destination host for the aggregation data export.
[Router] ip netstream aggregation prefix
[Router-ns-aggregation-prefix] enable
[Router-ns-aggregation-prefix] ip netstream export host 4.1.1.1 7000
[Router-ns-aggregation-prefix] quit
Verifying the configuration
# Display information about the NetStream data export.
[Router] display ip netstream export
as aggregation export information:
Flow source interface : Not specified
Flow destination VPN instance : Not specified
Flow destination IP address (UDP) : 4.1.1.1 (2000)
Version 8 exported flow number : 2
Version 8 exported UDP datagrams number (failed): 2 (0)
Version 9 exported flow number : 0
Version 9 exported UDP datagrams number (failed): 0(0)
protocol-port aggregation export information:
Flow source interface : Not specified
Flow destination VPN instance : Not specified
Flow destination IP address (UDP) : 4.1.1.1 (3000)
Version 8 exported flow number : 2
Version 8 exported UDP datagrams number (failed): 2 (0)
Version 9 exported flow number : 0
Version 9 exported UDP datagrams number (failed): 0 (0)
source-prefix aggregation export information:
Flow source interface : Not specified
Flow destination VPN instance : Not specified
Flow destination IP address (UDP) : 4.1.1.1 (4000)
Version 8 exported flow number : 2
Version 8 exported UDP datagrams number (failed): 2 (0)
Version 9 exported flow number : 0
Version 9 exported UDP datagrams number (failed): 0 (0)
destination-prefix aggregation export information:
Flow source interface : Not specified
Flow destination VPN instance : Not specified
Flow destination IP address (UDP) : 4.1.1.1 (6000)
Version 8 exported flow number : 2
Version 8 exported UDP datagrams number (failed): 2 (0)
Version 9 exported flow number : 0
Version 9 exported UDP datagrams number (failed): 0 (0)
prefix aggregation export information:
Flow source interface : Not specified
Flow destination VPN instance : Not specified
Flow destination IP address (UDP) : 4.1.1.1 (7000)
Version 8 exported flow number : 2
Version 8 exported UDP datagrams number (failed): 2 (0)
Version 9 exported flow number : 0
Version 9 exported UDP datagrams number (failed): 0 (0)
IP export information:
Flow source interface : Not specified
Flow destination VPN instance : Not specified
Flow destination IP address (UDP) : 4.1.1.1 (5000)
Version 5 exported flow number : 10
Version 5 exported UDP datagrams number (failed): 10 (0)
Version 9 exported flow number : 0
Version 9 exported UDP datagrams number (failed): 0 (0)
Configuring IPv6 NetStream
Overview
IPv6 NetStream is an accounting technology that provides statistics on a per-flow basis. An IPv6 flow is defined by the following 8-tuple elements:
· Destination IPv6 address.
· Source IPv6 address.
· Destination port number.
· Source port number.
· Protocol number.
· Traffic class.
· Flow label.
· Input or output interface.
IPv6 NetStream architecture
A typical IPv6 NetStream system includes the following elements:
· NetStream data exporter—A device configured with IPv6 NetStream. The NDE provides the following functions:
? Classifies traffic flows by using the 8-tuple elements.
? Collects data from the classified flows.
? Aggregates and exports the data to the NSC.
· NetStream collector—A program running in a Unix or Windows operating system. The NSC parses the packets received from the NDEs, and saves the data to its database.
· NetStream data analyzer—A network traffic analyzing tool. Based on the data in NSC, the NDA generates reports for traffic billing, network planning, and attack detection and monitoring. The NDA can collect data from multiple NSCs. Typically, the NDA features a Web-based system for easy operation.
NSC and NDA are typically integrated into a NetStream server.
H3C network devices act as NDEs in the IPv6 NetStream system. This document focuses on NDE configuration.
Figure 82 IPv6 NetStream system
Flow aging
IPv6 NetStream uses flow aging to enable the NDE to export IPv6 NetStream data to NetStream servers. IPv6 NetStream creates an IPv6 NetStream entry for each flow for storing the flow statistics in the cache.
When a flow is aged out, the NDE does the following operations:
· Exports the summarized data to NetStream servers in an IPv6 NetStream data export format.
· Clears IPv6 NetStream entry information in the cache.
For more information about flow aging types and configurations, see "Configuring IPv6 NetStream flow aging."
IPv6 NetStream data export
Traditional data export
IPv6 NetStream collects the statistics of each flow and exports the statistics to NetStream servers.
This method consumes a lot of bandwidth and CPU usage, and requires a large cache size. In addition, you do not need all of the data in most cases.
Aggregation data export
An IPv6 NetStream aggregation mode merges the flow statistics according to the aggregation criteria of the aggregation mode, and it sends the summarized data to NetStream servers. The IPv6 NetStream aggregation data export uses less bandwidth than the traditional data export.
Table 23 lists the available IPv6 NetStream aggregation modes. In each mode, the system merges multiple flows with the same values for all aggregation criteria into one aggregate flow. The system records the statistics for the aggregate flow. These aggregation modes work independently and can take effect concurrently.
Table 23 IPv6 NetStream aggregation modes
|
Aggregation mode |
Aggregation criteria |
|
AS aggregation |
· Source AS number · Destination AS number · Input interface index · Output interface index |
|
Protocol-port aggregation |
· Protocol number · Source port · Destination port |
|
Source-prefix aggregation |
· Source AS number · Source mask · Source prefix (source network address) · Input interface index |
|
Destination-prefix aggregation |
· Destination AS number · Destination mask · Destination prefix (destination network address) · Output interface index |
|
Source-prefix and destination-prefix aggregation |
· Source AS number · Source mask · Source prefix (source network address) · Input interface index · Destination AS number · Destination mask · Destination prefix (destination network address) · Output interface index |
|
BGP-nexthop |
· BGP next hop · Output interface index |
If IPv6 packets are not forwarded according to the BGP routing table, the AS number or BGP next hop cannot be obtained.
IPv6 NetStream data export format
IPv6 NetStream exports data in the version 9 format, which is template based.
The version 9 format supports exporting the IPv6 NetStream aggregation data and collecting statistics about BGP next hop and MPLS packets.
IPv6 NetStream filtering
IPv6 NetStream filtering uses an ACL to identify packets. Whether IPv6 NetStream collects data for identified packets depends on the action in the matching rule.
· IPv6 NetStream collects data for packets that match permit rules in the ACL.
· IPv6 NetStream does not collect data for packets that match deny rules in the ACL.
For more information about ACLs, see ACL and QoS Configuration Guide.
IPv6 NetStream sampling
IPv6 NetStream sampling collects statistics on fewer packets and is useful when the network has a large amount of traffic. IPv6 NetStream on sampled traffic lessens the impact on the device's performance. For more information about sampling, see "Configuring samplers."
Command and hardware compatibility
Commands and descriptions for centralized devices apply to the following routers:
· MSR810/810-W/810-W-DB/810-LM/810-W-LM/810-10-PoE/810-LM-HK/810-W-LM-HK/810-LMS/810-LUS.
· MSR2600-6-X1/2600-10-X1.
· MSR 2630.
· MSR3600-28/3600-51.
· MSR3600-28-SI/3600-51-SI.
· MSR3610-X1/3610-X1-DP/3610-X1-DC/3610-X1-DP-DC.
· MSR 3610/3620/3620-DP/3640/3660.
· MSR810-LM-GL/810-W-LM-GL/830-6EI-GL/830-10EI-GL/830-6HI-GL/830-10HI-GL/2600-6-X1-GL/3600-28-SI-GL.
Commands and descriptions for distributed devices apply to the following routers:
· MSR5620.
· MSR 5660.
· MSR 5680.
IPv6 NetStream configuration task list
When you configure IPv6 NetStream, choose the following configurations as needed:
· Select the device on which you want to enable IPv6 NetStream.
· If multiple service flows are passing through the NDE, use an ACL to select the target data.
· If the network has a large amount of traffic, configure IPv6 NetStream sampling.
· Determine the export format for the IPv6 NetStream data export.
· Configure IPv6 NetStream flow aging.
To reduce the bandwidth consumption of the IPv6 NetStream data export, configure IPv6 NetStream aggregation.
Figure 83 IPv6 NetStream configuration flow
To configure IPv6 NetStream, perform the following tasks:
|
Tasks at a glance |
|
(Required.) Enabling IPv6 NetStream on an interface |
|
(Optional.) Configuring IPv6 NetStream filtering |
|
(Optional.) Configuring IPv6 NetStream sampling |
|
(Optional.) Enabling IPv6 NetStream for outgoing IPsec packets before IPsec encapsulation |
|
(Optional.) Configuring attributes of the IPv6 NetStream data export |
|
(Optional.) Configuring IPv6 NetStream flow aging |
|
(Required.) Perform at least one of the following tasks to configure the IPv6 NetStream data export: |
Enabling IPv6 NetStream on an interface
|
Step |
Command |
Remarks |
|
1. Enter system view. |
system-view |
N/A |
|
2. Enter interface view. |
interface interface-type interface-number |
N/A |
|
3. Enable IPv6 NetStream on the interface. |
ipv6 netstream { inbound | outbound } |
By default, IPv6 NetStream is disabled on an interface. |
Configuring IPv6 NetStream filtering
When you configure IPv6 NetStream filtering, follow these restrictions and guidelines:
· The IPv6 NetStream filtering feature does not take effect on MPLS packets.
· If IPv6 NetStream filtering and sampling are both configured, IPv6 packets are filtered first, and then the permitted packets are sampled.
To configure IPv6 NetStream filtering:
|
Step |
Command |
Remarks |
|
1. Enter system view. |
system-view |
N/A |
|
2. Enter interface view. |
interface interface-type interface-number |
N/A |
|
3. Configure IPv6 NetStream filtering on the interface. |
ipv6 netstream { inbound | outbound } filter acl ipv6-acl-number |
By default, IPv6 NetStream filtering is disabled. IPv6 NetStream collects statistics of all IPv6 packets passing through the interface. |
Configuring IPv6 NetStream sampling
|
Step |
Command |
Remarks |
|
1. Enter system view. |
system-view |
N/A |
|
2. Create a sampler. |
sampler sampler-name mode { fixed | random } packet-interval rate |
For more information about samplers, see "Configuring samplers." |
|
3. Enter interface view. |
interface interface-type interface-number |
N/A |
|
4. Configure IPv6 NetStream sampling. |
ipv6 netstream [ inbound | outbound ] sampler sampler-name |
By default, IPv6 NetStream sampling is disabled. |
Enabling IPv6 NetStream for outgoing IPsec packets before IPsec encapsulation
|
Step |
Command |
Remarks |
|
1. Enter system view. |
system-view |
N/A |
|
2. Enter interface view. |
interface interface-type interface-number |
N/A |
|
3. Enable IPv6 NetStream the outbound direction of the interface. |
ipv6 netstream outbound |
By default, IPv6 NetStream is disabled in the outbound direction of an interface. |
|
4. Enable IPv6 NetStream for outgoing packets before IPsec encapsulation.. |
ipv6 netstream ipsec raw-packet |
By default, IPv6 NetStream is enabled for outgoing IPsec encapsulated packets. |
Configuring attributes of the IPv6 NetStream data export
Configuring the IPv6 NetStream data export format
An IPv6 NetStream entry for a flow records the source IPv6 address, destination IPv6 address, and their respective AS numbers. The origin-as and peer-as keywords in the ipv6 netstream export version 9 command specify the AS numbers to be exported.
· origin-as—Specifies the source AS of the source address and the destination AS of the destination address.
· peer-as—Specifies the ASs before and after the AS where the NetStream device resides as the source AS and the destination AS, respectively.
For example, as shown in Figure 84, a flow starts at AS 20, passes AS 21 through AS 23, and then reaches AS 24. IPv6 NetStream is enabled on the device in AS 22.
· The origin-as keyword defines AS 20 as the source AS and AS 24 as the destination AS.
· The peer-as keyword defines AS 21 as the source AS and AS 23 as the destination AS.
Figure 84 Recorded AS information varies by different keyword configurations
To configure the IPv6 NetStream data export format:
|
Step |
Command |
Remarks |
|
1. Enter system view. |
system-view |
N/A |
|
2. Configure the IPv6 NetStream data export format, and specify whether to record AS and BGP next hop information. |
ipv6 netstream export version 9 { origin-as | peer-as } [ bgp-nexthop ] |
By default: · The version 9 format is used to export IPv6 NetStream traditional data, IPv6 NetStream aggregation data, and MPLS flow data with IPv6 fields. · The peer AS numbers are recorded. · The BGP next hop is not recorded. |
Configuring the refresh rate for IPv6 NetStream version 9 templates
Version 9 is template-based and supports user-defined formats. An IPv6 NetStream device must send the updated template to NetStream servers regularly, because the servers do not permanently save templates.
For an IPv6 NetStream server to use correct version 9 templates, configure the refresh frequency or refresh interval for version 9 templates. If both settings are configured, templates are sent when either of the conditions is met.
To configure the refresh rate for IPv6 NetStream version 9 templates:
|
Step |
Command |
Remarks |
|
1. Enter system view. |
system-view |
N/A |
|
2. Configure the refresh rate for IPv6 NetStream version 9 templates. |
·
Refresh frequency: ·
Refresh interval: |
By default, the version 9 templates are sent: · Every 20 packets. · Every 30 minutes. |
Configuring MPLS-aware NetStream
An MPLS flow is identified by the same labels in the same position and the same 8-tuple elements. MPLS-aware NetStream collects and exports statistics on a maximum of three labels in the label stack, with or without IP fields.
To configure MPLS-aware IPv6 NetStream:
|
Step |
Command |
Remarks |
|
1. Enter system view. |
system-view |
N/A |
|
2. Collect and export statistics on MPLS packets. |
ip netstream mpls [ label-positions label-position1 [ label-position2 [ label-position3 ] ] ] [ no-ip-fields ] |
By default, statistics of MPLS packets are not collected or exported. |
Configuring IPv6 NetStream flow aging
Flow aging methods
Periodical aging
Periodical aging has the following methods:
· Inactive flow aging—A flow is inactive if no packet arrives for the IPv6 NetStream entry within the period specified by using the ipv6 netstream timeout inactive command. When the inactive flow aging timer expires, the following events occur:
? The inactive flow entry is aged out.
? The statistics of the flow are sent to NetStream servers and are cleared in the cache. The statistics can no longer be displayed by using the display ipv6 netstream cache command.
When you use the inactive flow aging method, the cache is large enough for new flow entries.
· Active flow aging—A flow is active if packets arrive for the IPv6 NetStream entry within the period specified by using the ipv6 netstream timeout active command. When the active flow aging timer expires, the statistics of the active flow are exported to NetStream servers. The device continues to collect its statistics, which can be displayed by using the display ipv6 netstream cache command. The active flow aging method periodically exports the statistics of active flows to NetStream servers.
Forced aging
To implement forced aging, use one of the following commands:
· Use the reset ipv6 netstream statistics command. This command ages out all IPv6 NetStream entries, and exports and clears the statistics.
· Use the ipv6 netstream max-entry command. This command provides the following processing options when the upper limit is reached:
? Age out the oldest entries.
? Disable creation of a new entry in the cache.
Configuration procedure
To configure IPv6 NetStream flow aging:
|
Step |
Command |
Remarks |
|
1. Enter system view. |
system-view |
N/A |
|
2. (Optional.) Configure periodical aging. |
·
Set the active flow aging timer: ·
Set the inactive flow aging timer: |
By default: · The active flow aging timer is 30 minutes. · The inactive flow aging timer is 30 seconds. |
|
3. (Optional.) Configure forced aging. |
·
Set the upper limit for IPv6 NetStream
entries: · Manually age out IPv6 NetStream entries: a. Return to user view: b. Age out IPv6 NetStream entries: |
By default, the upper limit for IPv6 NetStream entries is 10000. |
Configuring the IPv6 NetStream data export
Configuring the IPv6 NetStream traditional data export
|
Step |
Command |
Remarks |
|
1. Enter system view. |
system-view |
N/A |
|
2. Specify a destination host for IPv6 NetStream traditional data export. |
ipv6 netstream export host { ipv4-address | ipv6-address } udp-port [ vpn-instance vpn-instance-name ] |
By default, no destination host is specified. |
|
3. (Optional.) Specify the source interface for IPv6 NetStream data packets sent to the NetStream servers. |
ipv6 netstream export source interface interface-type interface-number |
By default, no source interface is specified for IPv6 NetStream data packets. The packets take the primary IPv6 address of the output interface as the source IPv6 address. As a best practice, connect the management Ethernet interface to a NetStream server, and configure the interface as the source interface. |
|
4. (Optional.) Limit the IPv6 NetStream data export rate. |
ipv6 netstream export rate rate |
By default, the data export rate is not limited. |
Configuring the IPv6 NetStream aggregation data export
Configurations in IPv6 NetStream aggregation mode view apply only to the IPv6 NetStream aggregation data export. Configurations in system view apply to the IPv6 NetStream traditional data export. When no configuration in IPv6 NetStream aggregation mode view is provided, the configurations in system view apply to the IPv6 NetStream aggregation data export.
To configure the IPv6 NetStream aggregation data export:
|
Step |
Command |
Remarks |
|
1. Enter system view. |
system-view |
N/A |
|
2. Specify an IPv6 NetStream aggregation mode and enter its view. |
ipv6 netstream aggregation { as | bgp-nexthop | destination-prefix | prefix | protocol-port | source-prefix } |
N/A |
|
3. Enable the IPv6 NetStream aggregation mode. |
enable |
By default, the IPv6 NetStream aggregation is disabled. |
|
4. Specify a destination host for IPv6 NetStream aggregation data export. |
ipv6 netstream export host { ipv4-address | ipv6-address } udp-port [ vpn-instance vpn-instance-name ] |
By default, no destination host is specified. If you expect only IPv6 NetStream aggregation data, specify the destination host only in the related IPv6 NetStream aggregation mode view. |
|
5. (Optional.) Specify the source interface for IPv6 NetStream data packets sent to the NetStream servers. |
ipv6 netstream export source interface interface-type interface-number |
By default, no source interface is specified for IPv6 NetStream data packets. The packets take the primary IPv6 address of the output interface as the source IPv6 address. You can configure different source interfaces in different IPv6 NetStream aggregation mode views. If no source interface is configured in IPv6 NetStream aggregation mode view, the source interface configured in system view applies. |
Displaying and maintaining IPv6 NetStream
Execute display commands in any view and reset commands in user view.
|
Task |
Command |
|
Display IPv6 NetStream entry information (centralized devices in standalone mode). |
display ipv6 netstream cache [ verbose ] [ type { ip | ipl2 | l2 | mpls [ label-position1 label-value1 [ label-position2 label-value2 [ label-position3 label-value3 ] ] ] } ] [ destination destination-ip | destination-port destination-port | interface interface-type interface-number | protocol protocol | source source-ip | source-port source-port ] * [ arrived-time start-date start-time end-date end-time ] |
|
Display IPv6 NetStream entry information (distributed devices in standalone mode/centralized devices in IRF mode). |
display ipv6 netstream cache [ verbose ] [ type { ip | ipl2 | l2 | mpls [ label-position1 label-value1 [ label-position2 label-value2 [ label-position3 label-value3 ] ] ] } ] [ destination destination-ip | destination-port destination-port | interface interface-type interface-number | protocol protocol | source source-ip | source-port source-port ] * [ arrived-time start-date start-time end-date end-time ] [ slot slot-number ] |
|
Display IPv6 NetStream entry information (distributed devices in IRF mode). |
display ipv6 netstream cache [ verbose ] [ type { ip | ipl2 | l2 | mpls [ label-position1 label-value1 [ label-position2 label-value2 [ label-position3 label-value3 ] ] ] } ] [ destination destination-ip | destination-port destination-port | interface interface-type interface-number | protocol protocol | source source-ip | source-port source-port ] * [ arrived-time start-date start-time end-date end-time ] [ chassis chassis-number slot slot-number ] |
|
Display information about the IPv6 NetStream data export. |
display ipv6 netstream export |
|
Display IPv6 NetStream template information (centralized devices in standalone mode). |
display ipv6 netstream template |
|
Display IPv6 NetStream template information (distributed devices in standalone mode/centralized devices in IRF mode). |
display ipv6 netstream template [ slot slot-number ] |
|
Display IPv6 NetStream template information (distributed devices in IRF mode). |
display ipv6 netstream template [ chassis chassis-number slot slot-number ] |
|
Age out, export all IPv6 NetStream data, and clear the cache. |
reset ipv6 netstream statistics |
IPv6 NetStream configuration examples
IPv6 NetStream traditional data export configuration example
Network requirements
As shown in Figure 85, configure IPv6 NetStream on the router to collect statistics on packets passing through the router.
· Enable IPv6 NetStream for incoming and outgoing traffic on GigabitEthernet 1/0/1.
· Configure the router to export the IPv6 NetStream traditional data to UDP port 5000 of the IPv6 NetStream server.
Configuration procedure
# Assign an IP address to each interface, as shown in Figure 85. (Details not shown.)
# Enable IPv6 NetStream for incoming and outgoing traffic on GigabitEthernet 1/0/1.
<Router> system-view
[Router] interface gigabitethernet 1/0/1
[Router-GigabitEthernet1/0/1] ipv6 netstream inbound
[Router-GigabitEthernet1/0/1] ipv6 netstream outbound
[Router-GigabitEthernet1/0/1] quit
# Specify 40::1 as the IP address of the destination host and UDP port 5000 as the export destination port number.
[Router] ipv6 netstream export host 40::1 5000
Verifying the configuration
# Display information about IPv6 NetStream entries.
<Router> display ipv6 netstream cache
IPv6 NetStream cache information:
Active flow timeout : 60 min
Inactive flow timeout : 10 sec
Max number of entries : 1000
IPv6 active flow entries : 2
MPLS active flow entries : 0
IPL2 active flow entries : 0
IPv6 flow entries counted : 10
MPLS flow entries counted : 0
IPL2 flow entries counted : 0
Last statistics resetting time : 01/01/2000 at 00:01:02
IPv6 packet size distribution (1103746 packets in total):
1-32 64 96 128 160 192 224 256 288 320 352 384 416 448 480
.249 .694 .000 .000 .000 .000 .000 .000 .000 .000 .000 .000 .000 .000 .000
512 544 576 1024 1536 2048 2560 3072 3584 4096 4608 >4608
.000 .000 .027 .000 .027 .000 .000 .000 .000 .000 .000 .000
Protocol Total Packets Flows Packets Active(sec) Idle(sec)
Flows /sec /sec /flow /flow /flow
--------------------------------------------------------------------------
TCP-Telnet 2656855 372 4 86 49 27
TCP-FTP 5900082 86 9 9 11 33
TCP-FTPD 3200453 1006 5 193 45 33
TCP-WWW 546778274 11170 887 12 8 32
TCP-other 49148540 3752 79 47 30 32
UDP-DNS 117240379 570 190 3 7 34
UDP-other 45502422 2272 73 30 8 37
ICMP 14837957 125 24 5 12 34
IP-other 77406 5 0 47 52 27
Type DstIP(Port) SrcIP(Port) Pro TC FlowLbl APPID If(Direct) Pkts
DstMAC(VLAN) SrcMAC(VLAN)
TopLblType(IP/MASK)Lbl-Exp-S-List
--------------------------------------------------------------------------
IP 2001::1(1024) 2002::1(21) 6 0 0x0 0x0 GE1/0/1(I) 42996
IP 2002::1(21) 2001::1(1024) 6 0 0x0 0x0 GE1/0/1(O) 42996
# Display information about the IPv6 NetStream data export.
[Router] display ipv6 netstream export
IPv6 export information:
Flow source interface : Not specified
Flow destination VPN instance : Not specified
Flow destination IPv6 address (UDP) : 40::1 (5000)
Version 9 exported flow number : 10
Version 9 exported UDP datagrams number (failed): 10 (0)
IPv6 NetStream aggregation data export configuration example
Network requirements
As shown in Figure 86, all routers in the network are running IPv6 EBGP. Configure IPv6 NetStream on the router to meet the following requirements:
· Export the IPv6 NetStream traditional data to port 5000 of the IPv6 NetStream server.
· Perform the IPv6 NetStream aggregation in the modes of AS, protocol-port, source-prefix, destination-prefix, and prefix.
· Export the aggregation data of different modes to UDP ports 2000, 3000, 4000, 6000, and 7000 of the IPv6 NetStream server.
Configuration procedure
# Assign an IP address to each interface, as shown in Figure 86. (Details not shown.)
# Enable IPv6 NetStream for incoming and outgoing traffic on GigabitEthernet 1/0/1.
<Router> system-view
[Router] interface gigabitethernet 1/0/1
[Router-GigabitEthernet1/0/1] ipv6 netstream inbound
[Router-GigabitEthernet1/0/1] ipv6 netstream outbound
[Router-GigabitEthernet1/0/1] quit
# Specify 40::1 as the IP address of the destination host and UDP port 5000 as the export destination port number.
[Router] ipv6 netstream export host 40::1 5000
# Set the aggregation mode to AS, and specify the destination host for the aggregation data export.
[Router] ipv6 netstream aggregation as
[Router-ns6-aggregation-as] enable
[Router-ns6-aggregation-as] ipv6 netstream export host 40::1 2000
[Router-ns6-aggregation-as] quit
# Set the aggregation mode to protocol-port, and specify the destination host for the aggregation data export.
[Router] ipv6 netstream aggregation protocol-port
[Router-ns6-aggregation-protport] enable
[Router-ns6-aggregation-protport] ipv6 netstream export host 40::1 3000
[Router-ns6-aggregation-protport] quit
# Set the aggregation mode to source-prefix, and specify the destination host for the aggregation data export.
[Router] ipv6 netstream aggregation source-prefix
[Router-ns6-aggregation-srcpre] enable
[Router-ns6-aggregation-srcpre] ipv6 netstream export host 40::1 4000
[Router-ns6-aggregation-srcpre] quit
# Set the aggregation mode to destination-prefix, and specify the destination host for the aggregation data export.
[Router] ipv6 netstream aggregation destination-prefix
[Router-ns6-aggregation-dstpre] enable
[Router-ns6-aggregation-dstpre] ipv6 netstream export host 40::1 6000
[Router-ns6-aggregation-dstpre] quit
# Set the aggregation mode to prefix, and specify the destination host for the aggregation data export.
[Router] ipv6 netstream aggregation prefix
[Router-ns6-aggregation-prefix] enable
[Router-ns6-aggregation-prefix] ipv6 netstream export host 40::1 7000
[Router-ns6-aggregation-prefix] quit
Verifying the configuration
# Display information about the IPv6 NetStream data export.
[Router] display ipv6 netstream export
as aggregation export information:
Flow source interface : Not specified
Flow destination VPN instance : Not specified
Flow destination IPv6 address (UDP) : 40::1 (2000)
Version 9 exported flow number : 0
Version 9 exported UDP datagrams number (failed): 0(0)
protocol-port aggregation export information:
Flow source interface : Not specified
Flow destination VPN instance : Not specified
Flow destination IPv6 address (UDP) : 40::1 (3000)
Version 9 exported flow number : 0
Version 9 exported UDP datagrams number (failed): 0 (0)
source-prefix aggregation export information:
Flow source interface : Not specified
Flow destination VPN instance : Not specified
Flow destination IPv6 address (UDP) : 40::1 (4000)
Version 9 exported flow number : 0
Version 9 exported UDP datagrams number (failed): 0 (0)
destination-prefix aggregation export information:
Flow source interface : Not specified
Flow destination VPN instance : Not specified
Flow destination IPv6 address (UDP) : 40::1 (6000)
Version 9 exported flow number : 0
Version 9 exported UDP datagrams number (failed): 0 (0)
prefix aggregation export information:
Flow source interface : Not specified
Flow destination VPN instance : Not specified
Flow destination IPv6 address (UDP) : 40::1 (7000)
Version 9 exported flow number : 0
Version 9 exported UDP datagrams number (failed): 0 (0)
IPv6 export information:
Flow source interface : Not specified
Flow destination VPN instance : Not specified
Flow destination IPv6 address (UDP) : 40::1 (5000)
Version 9 exported flow number : 0
Version 9 exported UDP datagrams number (failed): 0 (0)
Configuring sFlow
sFlow is a traffic monitoring technology.
As shown in Figure 87, the sFlow system involves an sFlow agent embedded in a device and a remote sFlow collector. The sFlow agent collects interface counter information and packet information and encapsulates the sampled information in sFlow packets. When the sFlow packet buffer is full, or the aging timer (fixed to 1 second) expires, the sFlow agent performs the following actions:
· Encapsulates the sFlow packets in the UDP datagrams.
· Sends the UDP datagrams to the specified sFlow collector.
The sFlow collector analyzes the information and displays the results. One sFlow collector can monitor multiple sFlow agents.
sFlow provides the following sampling mechanisms:
· Flow sampling—Obtains packet information.
· Counter sampling—Obtains interface counter information.
Figure 87 sFlow system
|
|
NOTE: sFlow is not supported on Layer 2 Ethernet interfaces and Layer-configurable Ethernet interfaces. |
Protocols and standards
· RFC 3176, InMon Corporation's sFlow: A Method for Monitoring Traffic in Switched and Routed Networks
· sFlow.org, sFlow Version 5
Feature and hardware compatibility
|
Hardware |
sFlow compatibility |
|
MSR810/810-W/810-W-DB/810-LM/810-W-LM/810-10-PoE/810-LM-HK/810-W-LM-HK/810-LMS/810-LUS |
No |
|
MSR2600-6-X1 |
No |
|
MSR2600-10-X1 |
Yes |
|
MSR 2630 |
Yes |
|
MSR3600-28/3600-51 |
Yes |
|
MSR3600-28-SI/3600-51-SI |
No |
|
MSR3610-X1/3610-X1-DP/3610-X1-DC/3610-X1-DP-DC |
Yes |
|
MSR 3610/3620/3620-DP/3640/3660 |
Yes |
|
MSR5620/5660/5680 |
No on the management Ethernet interfaces of the MPUs Yes on Ethernet interfaces of the SPUs |
|
Hardware |
sFlow compatibility |
|
MSR810-LM-GL |
No |
|
MSR810-W-LM-GL |
No |
|
MSR830-6EI-GL |
No |
|
MSR830-10EI-GL |
No |
|
MSR830-6HI-GL |
No |
|
MSR830-10HI-GL |
No |
|
MSR2600-6-X1-GL |
No |
|
MSR3600-28-SI-GL |
No |
sFlow configuration task list
|
Tasks at a glance |
|
(Required.) Configuring the sFlow agent and sFlow collector information |
|
Perform one or both of the following tasks: |
Configuring the sFlow agent and sFlow collector information
|
Step |
Command |
Remarks |
|
1. Enter system view. |
system-view |
N/A |
|
2. (Optional.) Configure an IP address for the sFlow agent. |
sflow agent { ip ipv4-address | ipv6 ipv6-address } |
By default, no IP address is configured for the sFlow agent. The device periodically checks whether the sFlow agent has an IP address. If the sFlow agent does not have an IP address, the device automatically selects an IPv4 address for the sFlow agent but does not save the IPv4 address in the configuration file. NOTE: · As a best practice, manually configure an IP address for the sFlow agent. · Only one IP address can be configured for the sFlow agent on the device, and a newly configured IP address overwrites the existing one. |
|
3. Configure the sFlow collector information. |
sflow collector collector-id [ vpn-instance vpn-instance-name ] { ip ipv4-address | ipv6 ipv6-address } [ port port-number | datagram-size size | time-out seconds | description string ] * |
By default, no sFlow collector information is configured. |
|
4. (Optional.) Specify the source IP address of sFlow packets. |
sflow source { ip ipv4-address | ipv6 ipv6-address } * |
By default, the source IP address is determined by routing. |
Configuring flow sampling
Perform this task to configure flow sampling on an Ethernet interface. The sFlow agent performs the following tasks:
1. Samples packets on that interface according to the configured parameters.
2. Encapsulates the packets into sFlow packets.
3. Encapsulates the sFlow packets in the UDP packets and sends the UDP packets to the specified sFlow collector.
To configure flow sampling:
|
Step |
Command |
Remarks |
|
1. Enter system view. |
system-view |
N/A |
|
2. Enter Layer 3 Ethernet interface view. |
interface interface-type interface-number |
N/A |
|
3. (Optional.) Set the flow sampling mode. |
sflow sampling-mode determine |
By default, fixed flow sampling mode is used. |
|
4. Enable flow sampling and specify the number of packets out of which flow sampling samples a packet on the interface. |
sflow sampling-rate rate |
By default, flow sampling is disabled. |
|
5. (Optional.) Set the maximum number of bytes (starting from the packet header) that flow sampling can copy per packet. |
sflow flow max-header length |
The default setting is 128 bytes. As a best practice, use the default setting. |
|
6. Specify the sFlow collector for flow sampling. |
sflow flow collector collector-id |
By default, no sFlow collector is specified for flow sampling. |
Configuring counter sampling
Perform this task to configure counter sampling on an Ethernet interface. The sFlow agent performs the following tasks:
1. Periodically collects the counter information on that interface.
2. Encapsulates the counter information into sFlow packets.
3. Encapsulates the sFlow packets in the UDP packets and sends the UDP packets to the specified sFlow collector.
To configure counter sampling:
|
Step |
Command |
Remarks |
|
1. Enter system view. |
system-view |
N/A |
|
2. Enter Layer 3 Ethernet interface view. |
interface interface-type interface-number |
N/A |
|
3. Enable counter sampling and set the counter sampling interval. |
sflow counter interval interval |
By default, counter sampling is disabled. |
|
4. Specify the sFlow collector for counter sampling. |
sflow counter collector collector-id |
By default, no sFlow collector is specified for counter sampling. |
Displaying and maintaining sFlow
Execute display commands in any view.
|
Task |
Command |
|
Display sFlow configuration. |
display sflow |
sFlow configuration example
Network requirements
As shown in Figure 88, perform the following tasks:
· Configure flow sampling and counter sampling on GigabitEthernet 1/0/1 of the device to monitor traffic on the port.
· Configure the device to send sampled information in sFlow packets through GigabitEthernet 1/0/3 to the sFlow collector.
Configuration procedure
1. Configure the IP addresses and subnet masks for interfaces, as shown in Figure 88. (Details not shown.)
2. Configure the sFlow agent and configure information about the sFlow collector:
# Configure the IP address for the sFlow agent.
<Device> system-view
[Device] sflow agent ip 3.3.3.1
# Configure information about the sFlow collector. Specify the sFlow collector ID as 1, IP address as 3.3.3.2, port number as 6343 (default), and description as netserver.
[Device] sflow collector 1 ip 3.3.3.2 description netserver
3. Configure counter sampling:
# Enable counter sampling and set the counter sampling interval to 120 seconds on GigabitEthernet 1/0/1.
[Device] interface gigabitethernet 1/0/1
[Device-GigabitEthernet1/0/1] sflow counter interval 120
# Specify sFlow collector 1 for counter sampling.
[Device-GigabitEthernet1/0/1] sflow counter collector 1
4. Configure flow sampling:
# Enable flow sampling, specify fixed flow sampling mode, and set the sampling interval to 4000.
[Device-GigabitEthernet1/0/1] sflow sampling-mode determine
[Device-GigabitEthernet1/0/1] sflow sampling-rate 4000
# Specify sFlow collector 1 for flow sampling.
[Device-GigabitEthernet1/0/1] sflow flow collector 1
Verifying the configurations
# Verify the following items:
· GigabitEthernet 1/0/1 enabled with sFlow is active.
· The counter sampling interval is 120 seconds.
· The flow sampling interval is 4000 (one packet is sampled from every 4000 packets).
[Device-GigabitEthernet1/0/1] display sflow
sFlow datagram version: 5
Global information:
Agent IP: 3.3.3.1(CLI)
Source address:
Collector information:
ID IP Port Aging Size VPN-instance Description
1 3.3.3.2 6343 N/A 1400 netserver
Port information:
Interface CID Interval(s) FID MaxHLen Rate Mode Status
GE1/0/1 1 120 1 128 4000 Determine Active
Troubleshooting sFlow configuration
The remote sFlow collector cannot receive sFlow packets
Symptom
The remote sFlow collector cannot receive sFlow packets.
Analysis
The possible reasons include:
· The sFlow collector is not specified.
· sFlow is not configured on the interface.
· The IP address of the sFlow collector specified on the sFlow agent is different from that of the remote sFlow collector.
· No IP address is configured for the Layer 3 interface that sends sFlow packets.
· An IP address is configured for the Layer 3 interface that sends sFlow packets. However, the UDP datagrams with this source IP address cannot reach the sFlow collector.
· The physical link between the device and the sFlow collector fails.
· The sFlow collector is bound to a non-existent VPN.
· The length of an sFlow packet is less than the sum of the following two values:
? The length of the sFlow packet header.
? The number of bytes that flow sampling can copy per packet.
Solution
To resolve the problem:
1. Use the display sflow command to verify that sFlow is correctly configured.
2. Verify that a correct IP address is configured for the device to communicate with the sFlow collector.
3. Verify that the physical link between the device and the sFlow collector is up.
4. Verify that the VPN bound to the sFlow collector already exists.
5. Verify that the length of an sFlow packet is greater than the sum of the following two values:
? The length of the sFlow packet header.
? The number of bytes (as a best practice, use the default setting) that flow sampling can copy per packet.
Configuring the information center
The information center on a device classifies and manages logs for all modules so that network administrators can monitor network performance and troubleshoot network problems.
Overview
The information center receives logs generated by source modules and outputs logs to different destinations according to user-defined output rules. You can classify, filter, and output logs based on source modules. To view the supported source modules, use info-center source ?.
Figure 89 Information center diagram
By default, the information center is enabled. It affects system performance to some degree while processing large amounts of information. If the system resources are insufficient, disable the information center to save resources.
Log types
Logs are classified into the following types:
· Standard system logs—Record common system information. Unless otherwise specified, the term "logs" in this document refers to standard system logs.
· Diagnostic logs—Record debug messages.
· Security logs—Record security information, such as authentication and authorization information.
· Hidden logs—Record log information not displayed on the terminal, such as input commands.
· Trace logs—Record system tracing and debug messages, which can be viewed only after the devkit package is installed.
Log levels
Logs are classified into eight severity levels from 0 through 7 in descending order. The information center outputs logs with a severity level that is higher than or equal to the specified level. For example, if you specify a severity level of 6 (informational), logs that have a severity level from 0 to 6 are output.
|
Severity value |
Level |
Description |
|
0 |
Emergency |
The system is unusable. For example, the system authorization has expired. |
|
1 |
Alert |
Action must be taken immediately. For example, traffic on an interface exceeds the upper limit. |
|
2 |
Critical |
Critical condition. For example, the device temperature exceeds the upper limit, the power module fails, or the fan tray fails. |
|
3 |
Error |
Error condition. For example, the link state changes or a storage card is unplugged. |
|
4 |
Warning |
Warning condition. For example, an interface is disconnected, or the memory resources are used up. |
|
5 |
Notification |
Normal but significant condition. For example, a terminal logs in to the device, or the device reboots. |
|
6 |
Informational |
Informational message. For example, a command or a ping operation is executed. |
|
7 |
Debugging |
Debug message. |
Log destinations
The system outputs logs to the following destinations: console, monitor terminal, log buffer, log host, and log file. Log output destinations are independent and you can configure them after enabling the information center.
Default output rules for logs
A log output rule specifies the source modules and severity level of logs that can be output to a destination. Logs matching the output rule are output to the destination. Table 25 shows the default log output rules.
|
Destination |
Log source modules |
Output switch |
Severity |
|
Console |
All supported modules |
Enabled |
Debug |
|
Monitor terminal |
All supported modules |
Disabled |
Debug |
|
Log host |
All supported modules |
Enabled |
Informational |
|
Log buffer |
All supported modules |
Enabled |
Informational |
|
Log file |
All supported modules |
Enabled |
Informational |
Default output rules for diagnostic logs
Diagnostic logs can only be output to the diagnostic log file, and cannot be filtered by source modules and severity levels. Table 26 shows the default output rule for diagnostic logs.
Table 26 Default output rule for diagnostic logs
|
Destination |
Log source modules |
Output switch |
Severity |
|
Diagnostic log file |
All supported modules |
Enabled |
Debug |
Default output rules for security logs
Security logs can only be output to the security log file, and cannot be filtered by source modules and severity levels. Table 27 shows the default output rule for security logs.
Table 27 Default output rule for security logs
|
Destination |
Log source modules |
Output switch |
Severity |
|
Security log file |
All supported modules |
Disabled |
Debug |
Default output rules for hidden logs
Hidden logs can be output to the log host, the log buffer, and the log file. Table 28 shows the default output rules for hidden logs.
Table 28 Default output rules for hidden logs
|
Destination |
Log source modules |
Output switch |
Severity |
|
Log host |
All supported modules |
Enabled |
Informational |
|
Log buffer |
All supported modules |
Enabled |
Informational |
|
Log file |
All supported modules |
Enabled |
Informational |
Default output rules for trace logs
Trace logs can only be output to the trace log file, and cannot be filtered by source modules and severity levels. Table 29 shows the default output rules for trace logs.
Table 29 Default output rules for trace logs
|
Destination |
Log source modules |
Output switch |
Severity |
|
Trace log file |
All supported modules |
Enabled |
Debugging |
Log formats
The format of logs varies by output destinations. Table 30 shows the original format of log information, which might be different from what you see. The actual format varies by the log resolution tool used.
|
Output destination |
Format |
Example |
|
Console, monitor terminal, log buffer, or log file |
Prefix Timestamp Sysname Module/Level/Mnemonic: Content |
%Nov 24 14:21:43:502 2016 Sysname SHELL/5/SHELL_LOGIN: VTY logged in from 192.168.1.26. |
|
Log host |
·
Standard format: ·
unicom format: ·
cmcc format: |
·
Standard format: ·
cmcc format: |
Table 31 describes the fields in a log message.
Table 31 Log field description
|
Field |
Description |
|
Prefix (information type) |
A log to a destination other than the log host has an identifier in front of the timestamp: · An identifier of percent sign (%) indicates a log with a level equal to or higher than informational. · An identifier of asterisk (*) indicates a debug log or a trace log. · An identifier of caret (^) indicates a diagnostic log. |
|
PRI (priority) |
A log destined to the log host has a priority identifier in front of the timestamp. The priority is calculated by using this formula: facility*8+level, where: · facility is the facility name. Facility names local0 through local7 correspond to values 16 through 23. The facility name can be configured using the info-center loghost command. It is used to identify log sources on the log host, and to query and filter the logs from specific log sources. · level is in the range of 0 to 7. See Table 24 for more information about severity levels. |
|
Timestamp |
Records the time when the log was generated. Logs sent to the log host and those sent to the other destinations have different timestamp precisions, and their timestamp formats are configured with different commands. For more information, see Table 32 and Table 33. |
|
Hostip |
Source IP address of the log. If the info-center loghost source command is configured, this field displays the IP address of the specified source interface. Otherwise, this field displays the sysname. This field exists only in logs in unicom format that are sent to the log host. |
|
Serial number |
Serial number of the device that generated the log. This field exists only in logs in unicom format that are sent to the log host. |
|
Sysname (host name or host IP address) |
The sysname is the host name or IP address of the device that generated the log. You can use the sysname command to modify the name of the device. |
|
%% (vendor ID) |
Indicates that the information was generated by an H3C device. This field exists only in logs sent to the log host. |
|
vv (version information) |
Identifies the version of the log, and has a value of 10. This field exists only in logs that are sent to the log host. |
|
Module |
Specifies the name of the module that generated the log. You can enter the info-center source ? command in system view to view the module list. |
|
Level |
Identifies the level of the log. See Table 24 for more information about severity levels. |
|
Mnemonic |
Describes the content of the log. It contains a string of up to 32 characters. |
|
Source |
Identifies the source of the log. It can take one of the following values: · Slot number of a card. (Distributed devices in standalone mode.) · IRF member ID. (Centralized devices in IRF mode.) · IRF member ID and card slot number. (Distributed device in IRF mode.) · IP address of the log sender. |
|
Content |
Provides the content of the log. |
Table 32 Timestamp precisions and configuration commands
|
Item |
Destined to the log host |
Destined to the console, monitor terminal, log buffer, and log file |
|
Precision |
Seconds |
Milliseconds |
|
Command used to set the timestamp format |
info-center timestamp loghost |
info-center timestamp |
Table 33 Description of the timestamp parameters
|
Timestamp parameters |
Description |
Example |
|
boot |
Time that has elapsed since system startup, in the format of xxx.yyy. xxx represents the higher 32 bits, and yyy represents the lower 32 bits, of milliseconds elapsed. Logs that are sent to all destinations other than a log host support this parameter. |
%0.109391473 Sysname FTPD/5/FTPD_LOGIN: User ftp (192.168.1.23) has logged in successfully. 0.109391473 is a timestamp in the boot format. |
|
date |
Current date and time, in the format of mmm dd hh:mm:ss yyy for logs that are output to a log host, or MMM DD hh:mm:ss:xxx YYYY for logs that are output to other destinations. All logs support this parameter. |
%May 30 05:36:29:579 2003 Sysname FTPD/5/FTPD_LOGIN: User ftp (192.168.1.23) has logged in successfully. May 30 05:36:29:579 2003 is a timestamp in the date format. |
|
iso |
Timestamp format stipulated in ISO 8601. Only logs that are sent to a log host support this parameter. |
<189>2003-05-30T06:42:44 Sysname %%10FTPD/5/FTPD_LOGIN(l): User ftp (192.168.1.23) has logged in successfully. 2003-05-30T06:42:44 is a timestamp in the iso format. |
|
none |
No timestamp is included. All logs support this parameter. |
% Sysname FTPD/5/FTPD_LOGIN: User ftp (192.168.1.23) has logged in successfully. No timestamp is included. |
|
no-year-date |
Current date and time without year information, in the format of MMM DD hh:mm:ss:xxx. Only logs that are sent to a log host support this parameter. |
<189>May 30 06:44:22 Sysname %%10FTPD/5/FTPD_LOGIN(l): User ftp (192.168.1.23) has logged in successfully. May 30 06:44:22 is a timestamp in the no-year-date format. |
Command and hardware compatibility
Commands and descriptions for centralized devices apply to the following routers:
· MSR810/810-W/810-W-DB/810-LM/810-W-LM/810-10-PoE/810-LM-HK/810-W-LM-HK/810-LMS/810-LUS.
· MSR2600-6-X1/2600-10-X1.
· MSR 2630.
· MSR3600-28/3600-51.
· MSR3600-28-SI/3600-51-SI.
· MSR3610-X1/3610-X1-DP/3610-X1-DC/3610-X1-DP-DC.
· MSR 3610/3620/3620-DP/3640/3660.
· MSR810-LM-GL/810-W-LM-GL/830-6EI-GL/830-10EI-GL/830-6HI-GL/830-10HI-GL/2600-6-X1-GL/3600-28-SI-GL.
Commands and descriptions for distributed devices apply to the following routers:
· MSR5620.
· MSR 5660.
· MSR 5680.
FIPS compliance
The device supports the FIPS mode that complies with NIST FIPS 140-2 requirements. Support for features, commands, and parameters might differ in FIPS mode and non-FIPS mode. For more information about FIPS mode, see Security Configuration Guide.
Information center configuration task list
|
Tasks at a glance |
|
|
Perform one or more of the following tasks: · Outputting logs to the console · Outputting logs to the monitor terminal |
|
|
(Optional.) Managing security logs |
|
|
(Optional.) Saving diagnostic logs to the diagnostic log file |
|
|
(Optional.) Configuring the maximum size of the trace log file |
|
|
(Optional.) Setting the minimum storage period for log files and logs in the log buffer |
|
|
(Optional.) Enabling synchronous information output |
|
|
(Optional.) Enabling duplicate log suppression |
|
|
(Optional.) Disabling an interface from generating link up or link down logs |
|
|
(Optional.) Enabling SNMP notifications for system logs |
Outputting logs to the console
|
Step |
Command |
Remarks |
|
1. Enter system view. |
system-view |
N/A |
|
2. Enable the information center. |
info-center enable |
By default, the information center is enabled. |
|
3. Configure an output rule for the console. |
info-center source { module-name | default } console { deny | level severity } |
For information about default output rules, see "Default output rules for logs." |
|
4. (Optional.) Configure the timestamp format. |
info-center timestamp { boot | date | none } |
By default, the timestamp format is date. |
|
5. Return to user view. |
quit |
N/A |
|
6. (Optional.) Enable log output to the console. |
terminal monitor |
The default setting is enabled. |
|
7. Enable the display of debug information on the current terminal. |
terminal debugging |
By default, the display of debug information is disabled on the current terminal. |
|
8. (Optional.) Set the lowest severity level of logs that can be output to the console. |
terminal logging level severity |
The default setting is 6 (informational). |
Outputting logs to the monitor terminal
Monitor terminals refer to terminals that log in to the device through the AUX, VTY, or TTY line.
The following matrix shows the feature and hardware compatibility:
|
Hardware |
AUX compatibility |
|
MSR810/810-W/810-W-DB/810-LM/810-W-LM/810-10-PoE/810-LM-HK/810-W-LM-HK/810-LMS/810-LUS |
No |
|
MSR2600-6-X1 |
No |
|
MSR2600-10-X1 |
Yes |
|
MSR 2630 |
Yes |
|
MSR3600-28/3600-51 |
Yes |
|
MSR3600-28-SI/3600-51-SI |
No |
|
MSR3610-X1/3610-X1-DP/3610-X1-DC/3610-X1-DP-DC |
No |
|
MSR 3610/3620/3620-DP/3640/3660 |
Yes |
|
MSR5620/5660/5680 |
No |
|
Hardware |
AUX compatibility |
|
MSR810-LM-GL |
No |
|
MSR810-W-LM-GL |
No |
|
MSR830-6EI-GL |
No |
|
MSR830-10EI-GL |
No |
|
MSR830-6HI-GL |
No |
|
MSR830-10HI-GL |
No |
|
MSR2600-6-X1-GL |
No |
|
MSR3600-28-SI-GL |
No |
To output logs to the monitor terminal:
|
Step |
Command |
Remarks |
|
1. Enter system view. |
system-view |
N/A |
|
2. Enable the information center. |
info-center enable |
By default, the information center is enabled. |
|
3. Configure an output rule for the monitor terminal. |
info-center source { module-name | default } monitor { deny | level severity } |
For information about default output rules, see "Default output rules for logs." |
|
4. (Optional.) Configure the timestamp format. |
info-center timestamp { boot | date | none } |
The default timestamp format is date. |
|
5. Return to user view. |
quit |
N/A |
|
6. Enable log output to the monitor terminal. |
terminal monitor |
By default, log output to the monitor terminal is enabled. |
|
7. Enable the display of debug information on the current terminal. |
terminal debugging |
By default, the display of debug information is disabled on the current terminal. |
|
8. (Optional.) Set the lowest level of logs that can be output to the monitor terminal. |
terminal logging level severity |
The default setting is 6 (informational). |
Outputting logs to log hosts
Restrictions and guidelines
The device supports the following methods (in descending order of priority) for outputting logs of a module to designated log hosts:
· Flow log.
For information about the modules that support flow log output and how to configure flow log output, see "Configuring flow log."
· Information center.
If you configure multiple log output methods for a module, only the method with the highest priority takes effect.
Configuration procedure
To output logs to log hosts:
|
Step |
Command |
Remarks |
|
1. Enter system view. |
system-view |
N/A |
|
2. Enable the information center. |
info-center enable |
By default, the information center is enabled. |
|
3. Configure an output rule for the log host. |
info-center source { module-name | default } loghost { deny | level severity } |
For information about default output rules, see "Default output rules for logs." |
|
4. (Optional.) Specify the source IP address for output logs. |
info-center loghost source interface-type interface-number |
By default, the source IP address of output logs is the primary IP address of their outgoing interfaces. |
|
5. (Optional.) Specify the format for logs to be output to log hosts. |
info-center format { cmcc | unicom } |
By default, logs are output to log hosts in standard format. |
|
6. (Optional.) Configure the timestamp format. |
info-center timestamp loghost { date | iso | no-year-date | none } |
The default timestamp format is date. |
|
7. Specify a log host and configure related parameters. |
info-center loghost [ vpn-instance vpn-instance-name ] { hostname | ipv4-address | ipv6 ipv6-address } [ port port-number ] [ facility local-number ] |
By default, no log hosts or related parameters are specified. The value for the port-number argument must be the same as the value configured on the log host. Otherwise, the log host cannot receive logs. The device supports a maximum of 20 log hosts. Support for the ipv6 ipv6-address option depends on the device model. For more information, see information center commands in Network Management and Monitoring Command Reference. |
Outputting logs to the log buffer
|
Step |
Command |
Remarks |
|
1. Enter system view. |
N/A |
|
|
2. Enable the information center. |
info-center enable |
By default, the information center is enabled. |
|
3. Enable log output to the log buffer. |
By default, log output to the log buffer is enabled. |
|
|
4. (Optional.) Set the maximum number of logs that can be stored in the log buffer. |
info-center logbuffer size buffersize |
By default, the log buffer can store 512 logs. |
|
5. Configure an output rule for the log buffer. |
info-center source { module-name | default } logbuffer { deny | level severity } |
For information about default output rules, see "Default output rules for logs." |
|
6. (Optional.) Configure the timestamp format. |
info-center timestamp { boot | date | none } |
The default timestamp format is date. |
Saving logs to the log file
By default, the log file feature saves logs from the log file buffer to the log file every 24 hours. You can adjust the saving interval or manually save logs to the log file. After saving logs to the log file, the system clears the log file buffer.
The device supports multiple log files. Each log file has a maximum capacity. The log files are named as logfile1.log, logfile2.log, and so on.
When logfile1.log is full, the system compresses logfile1.log as logfile1.log.gz and creates a new log file named logfile2.log. The process repeats until the last log file is full.
After the last log file is full, the device repeats the following process:
1. The device locates the oldest compressed log file logfileX.log.gz and creates a new file using the same name (logfileX.log).
2. When logfileX.log is full, the device compresses the log file as logfileX.log.gz to replace the existing file logfileX.log.gz.
As a best practice, back up the log files regularly to avoid loss of important logs.
You can enable log file overwrite-protection to stop the device from saving new logs when the last log file is full or the storage device runs out of space.
To save logs to the log file:
|
Step |
Command |
Remarks |
|
1. Enter system view. |
system-view |
N/A |
|
2. Enable the information center. |
info-center enable |
By default, the information center is enabled. |
|
3. Enable the log file feature. |
info-center logfile enable |
By default, the log file feature is enabled. |
|
4. Configure an output rule for sending logs to log files. |
info-center source { module-name | default } logfile { deny | level severity } |
For information about default output rules, see "Default output rules for logs." |
|
5. (Optional.) Set the maximum size for the log file. |
info-center logfile size-quota size |
The default setting is 5 MB. To ensure normal operation, set the size argument to a value between 1 MB and 10 MB. |
|
6. (Optional.) Specify the directory to save the log file. |
info-center logfile directory dir-name |
By default, log files are saved in the logfile directory under the root directory of the storage device. This command cannot survive a reboot. (Centralized devices in standalone mode.) This command cannot survive a reboot or an active/standby switchover. (Distributed devices in standalone mode.) This command cannot survive an IRF reboot or a master/subordinate switchover. (Centralized devices in IRF mode.) This command cannot survive an IRF reboot or a global active/standby switchover in an IRF fabric. (Distributed device in IRF mode.) |
|
7. Save the logs in the log file buffer to the log file. |
·
Configure the interval to perform the
save operation: ·
Manually save the logs in the log file buffer
to the log file: |
The default saving interval is 86400 seconds. The logfile save command is available in any view. |
Managing security logs
Security logs are very important for locating and troubleshooting network problems. Generally, security logs are output together with other logs. It is difficult to identify security logs among all logs.
To solve this problem, you can save security logs to the security log file without affecting the current log output rules.
Saving security logs to the security log file
After you enable the saving of the security logs to the security log file:
· The system first outputs security logs to the security log file buffer.
· The system saves the logs from the security log file buffer to the security log file at intervals (a user authorized the security-audit role can also manually save security logs to the security log file).
· After the security logs are saved, the buffer is cleared immediately.
The device supports only one security log file. To avoid security log loss, you can set an alarm threshold for the security log file usage. When the alarm threshold is reached, the system outputs a message to inform the administrator. The administrator can log in to the device with the security-audit user role and back up the security log file to prevent the loss of important data.
To save security logs to the security log file:
|
Step |
Command |
Remarks |
|
1. Enter system view. |
system-view |
N/A |
|
2. Enable the information center. |
info-center enable |
By default, the information center is enabled. |
|
3. Enable the saving of the security logs to the security log file. |
info-center security-logfile enable |
By default, saving security logs to the security log file is disabled. |
|
4. Set the interval at which the system saves security logs. |
info-center security-logfile frequency freq-sec |
The default saving interval is 86400 seconds. |
|
5. (Optional.) Set the maximum size for the security log file. |
info-center security-logfile size-quota size |
The default setting is 10 MB. |
|
6. (Optional.) Set the alarm threshold of the security log file usage. |
info-center security-logfile alarm-threshold usage |
By default, the alarm threshold of the security log file usage is 80. When the usage of the security log file reaches 80%, the system will inform the user. |
Managing the security log file
To use the security log file management commands, a local user must be authorized the security-audit user role. For information about configuring the security-audit user role, see Security Command Reference.
To manage the security log file:
|
Task |
Command |
Remarks |
|
Display a summary of the security log file. |
display security-logfile summary |
Available in user view. |
|
Change the directory of the security log file. |
a system-view b info-center security-logfile directory dir-name |
By default, the security log file is saved in the seclog directory in the root directory of the storage device. This command cannot survive a reboot. (Centralized devices in standalone mode.) This command cannot survive a reboot or an active/standby switchover. (Distributed devices in standalone mode.) This command cannot survive an IRF reboot or a master/subordinate switchover. (Centralized devices in IRF mode.) This command cannot survive an IRF reboot or a global active/standby switchover in an IRF fabric. (Distributed device in IRF mode.) |
|
Manually save all the contents in the security log file buffer to the security log file. |
security-logfile save |
Available in any view. |
Saving diagnostic logs to the diagnostic log file
By default, the device saves diagnostic logs from the diagnostic log file buffer to the diagnostic log file every 24 hours. You can adjust the saving interval or manually save diagnostic logs to the diagnostic log file. After saving diagnostic logs to the diagnostic log file, the system clears the diagnostic log file buffer.
The device supports multiple diagnostic log files. Each diagnostic log file has a maximum capacity. The diagnostic log files are named as diagfile1.log, diagfile2.log, and so on. When diagfile1.log is full, the system compresses diagfile1.log as diagfile1.log.gz and creates a new diagnostic log file named diagfile2.log. The process repeats until the last diagnostic log file is full.
After the last diagnostic log file is full, the device repeats the following process:
1. The device locates the oldest compressed diagnostic log file diagfileX.log.gz and creates a new file using the same name (diagfileX.log).
2. When diagfileX.log is full, the device compresses the log file as diagfileX.log.gz to replace the existing file diagfileX.log.gz.
As a best practice, back up the diagnostic log files regularly to avoid loss of important logs.
To enable saving diagnostic logs to the diagnostic log file:
|
Step |
Command |
Remarks |
|
1. Enter system view. |
system-view |
N/A |
|
2. Enable the information center. |
info-center enable |
By default, the information center is enabled. |
|
3. Enable saving diagnostic logs to the diagnostic log file. |
info-center diagnostic-logfile enable |
By default, saving diagnostic logs to the diagnostic log file is enabled. |
|
4. (Optional.) Set the maximum size for the diagnostic log file. |
info-center diagnostic-logfile quota size |
The default setting is 5 MB. To ensure normal operation, set the size argument to a value between 1 MB and 10 MB. |
|
5. (Optional.) Specify the directory to save the diagnostic log file. |
info-center diagnostic-logfile directory dir-name |
By default, diagnostic log files are saved in the diagfile directory under the root directory of the storage device. This command cannot survive a reboot. (Centralized devices in standalone mode.) This command cannot survive a reboot or an active/standby switchover. (Distributed devices in standalone mode.) This command cannot survive an IRF reboot or a master/subordinate switchover. (Centralized devices in IRF mode.) This command cannot survive an IRF reboot or a global active/standby switchover in an IRF fabric. (Distributed device in IRF mode.) |
|
6. Save diagnostic logs in the diagnostic log file buffer to the diagnostic log file. |
·
Configure the interval to perform the
saving operation: ·
Manually save diagnostic logs in the buffer to
the diagnostic log file: |
The default saving interval is 86400 seconds. The diagnostic-logfile save command is available in any view. |
Configuring the maximum size of the trace log file
The device has only one trace log file. When the trace log file is full, the device overwrites the oldest trace logs with new ones.
To set the maximum size for the trace log file:
|
Step |
Command |
Remarks |
|
1. Enter system view. |
system-view |
N/A |
|
2. Set the maximum size for the trace log file. |
By default, the maximum size of the trace log file is 1 MB. |
Setting the minimum storage period for log files and logs in the log buffer
Use this feature to set the minimum storage period for log files and logs in the log buffer.
Logs in the log buffer
By default, when the log buffer is full, new logs will automatically overwrite the oldest logs. After the minimum storage period is set, the system identifies the storage period of a log to determine whether to delete the log. The system current time minus a log's generation time is the log's storage period.
· If the storage period of a log is shorter than or equal to the minimum storage period, the system does not delete the log. The new log will not be saved.
· If the storage period of a log is longer than the minimum storage period, the system deletes the log to save the new log.
Log files
By default, when the last log file is full, the device locates the oldest compressed log file logfileX.log.gz and creates a new file using the same name (logfileX.log).
After the minimum storage period is set, the system identifies the storage period of the compressed log file before creating a new log file with the same name. The system current time minus the log file's last modification time is the log file's storage period.
· If the storage period of the compressed log file is shorter than or equal to the minimum storage period, the system stops saving new logs.
· If the storage period of the compressed log file is longer than the minimum storage period, the system creates a new file to save new logs.
For more information about log saving, see "Saving logs to the log file."
Configuration procedure
To set the minimum storage period for log files and logs in the log buffer:
|
Step |
Command |
Remarks |
|
1. Enter system view. |
system-view |
N/A |
|
2. Set the log minimum storage period. |
info-center syslog min-age min-age |
By default, the log minimum storage period is not set. |
Enabling synchronous information output
System log output interrupts ongoing configuration operations, obscuring previously entered commands. Synchronous information output shows the obscured commands. It also provides a command prompt in command editing mode, or a [Y/N] string in interaction mode so you can continue your operation from where you were stopped.
To enable synchronous information output:
|
Step |
Command |
Remarks |
|
1. Enter system view. |
system-view |
N/A |
|
2. Enable synchronous information output. |
info-center synchronous |
By default, synchronous information output is disabled. |
Enabling duplicate log suppression
The output of consecutive duplicate logs at an interval of less than 30 seconds wastes system and network resources.
With this feature enabled, the system starts a suppression period upon outputting a log:
· During the suppression period, the system does not output logs that have the same module name, level, mnemonic, location, and text as the previous log.
· After the suppression period expires, if the same log continues to appear, the system outputs the suppressed logs and the log number and starts another suppression period. The suppression period is 30 seconds for the first time, 2 minutes for the second time, and 10 minutes for subsequent times.
· If a different log is generated during the suppression period, the system aborts the current suppression period, outputs suppressed logs and the log number and then the different log, and starts another suppression period.
To enable duplicate log suppression:
|
Step |
Command |
Remarks |
|
1. Enter system view. |
system-view |
N/A |
|
info-center logging suppress duplicates |
By default, duplicate log suppression is disabled. |
Disabling an interface from generating link up or link down logs
By default, all interfaces generate link up or link down log information when the interface state changes. In some cases, you might want to disable certain interfaces from generating this information. For example:
· You are concerned only about the states of some interfaces. In this case, you can use this function to disable other interfaces from generating link up and link down log information.
· An interface is unstable and continuously outputs log information. In this case, you can disable the interface from generating link up and link down log information.
Use the default setting in normal cases to avoid affecting interface status monitoring.
To disable an interface from generating link up or link down logs:
|
Step |
Command |
Remarks |
|
1. Enter system view. |
system-view |
N/A |
|
2. Enter interface view. |
interface interface-type interface-number |
N/A |
|
3. Disable the interface from generating link up or link down logs. |
undo enable log updown |
By default, all interfaces generate link up and link down logs when the interface state changes. |
Enabling SNMP notifications for system logs
This feature enables the device to send an SNMP notification for each log message it outputs. The device encapsulates the logs in SNMP notifications and then sends them to the SNMP module and the log trap buffer.
You can configure the SNMP module to send received SNMP notifications in SNMP traps or informs to remote hosts. For more information, see "Configuring SNMP."
To view the traps in the log trap buffer, access the MIB corresponding to the log trap buffer.
To enable SNMP notifications for system logs:
|
Step |
Command |
Remarks |
|
1. Enter system view. |
system-view |
N/A |
|
2. Enable SNMP notifications for system logs. |
snmp-agent trap enable syslog |
N/A |
|
3. Set the maximum number of traps that can be stored in the log trap buffer. |
info-center syslog trap buffersize buffersize |
By default, the log trap buffer can store a maximum of 1024 traps. |
Displaying and maintaining information center
Execute display commands in any view and reset commands in user view.
|
Task |
Command |
|
Display the information of each output destination. |
display info-center |
|
Display the state and the log information of the log buffer (centralized devices in standalone mode). |
display logbuffer [ reverse ] [ level severity | size buffersize ] * |
|
Display the state and the log information of the log buffer (distributed devices in standalone mode/centralized devices in IRF mode). |
display logbuffer [ reverse ] [ level severity | size buffersize | slot slot-number ]* |
|
Display the state and the log information of the log buffer (distributed devices in IRF mode). |
display logbuffer [ reverse ] [ level severity | size buffersize | chassis chassis-number slot slot-number ] * |
|
Display a summary of the log buffer (centralized devices in standalone mode). |
display logbuffer summary [ level severity ] |
|
Display a summary of the log buffer (distributed devices in standalone mode/centralized devices in IRF mode). |
display logbuffer summary [ level severity | slot slot-number ] * |
|
Display a summary of the log buffer (distributed devices in IRF mode). |
display logbuffer summary [ level severity | chassis chassis-number slot slot-number ] * |
|
Display the log file configuration. |
display logfile summary |
|
Display the diagnostic log file configuration. |
|
|
Clear the log buffer. |
reset logbuffer |
Information center configuration examples
Configuration example for outputting logs to the console
Network requirements
Configure the device to output to the console FTP logs that have a minimum severity level of warning.
Figure 90 Network diagram
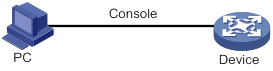
Configuration procedure
# Enable the information center.
<Device> system-view
[Device] info-center enable
# Disable log output to the console.
[Device] info-center source default console deny
To avoid output of unnecessary information, disable all modules from outputting log information to the specified destination (console in this example) before you configure the output rule.
# Configure an output rule to output to the console FTP logs that have a minimum severity level of warning.
[Device] info-center source ftp console level warning
[Device] quit
# Enable the display of logs on the console. (This function is enabled by default.)
<Device> terminal logging level 6
<Device> terminal monitor
The current terminal is enabled to display logs.
Now, if the FTP module generates logs, the information center automatically sends the logs to the console, and the console displays the logs.
Configuration example for outputting logs to a UNIX log host
Network requirements
Configure the device to output to the UNIX log host FTP logs that have a minimum severity level of informational.
Figure 91 Network diagram
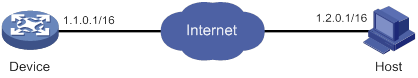
Configuration procedure
Before the configuration, make sure the device and the log host can reach each other. (Details not shown.)
1. Configure the device:
# Enable the information center.
<Device> system-view
[Device] info-center enable
# Specify log host 1.2.0.1/16 with local4 as the logging facility.
[Device] info-center loghost 1.2.0.1 facility local4
# Disable log output to the log host.
[Device] info-center source default loghost deny
To avoid output of unnecessary information, disable all modules from outputting logs to the specified destination (loghost in this example) before you configure an output rule.
# Configure an output rule to output to the log host FTP logs that have a minimum severity level of informational.
[Device] info-center source ftp loghost level informational
2. Configure the log host:
The following configurations were performed on Solaris. Other UNIX operating systems have similar configurations.
a. Log in to the log host as a root user.
b. Create a subdirectory named Device in directory /var/log/, and then create file info.log in the Device directory to save logs from Device.
# mkdir /var/log/Device
# touch /var/log/Device/info.log
c. Edit the file syslog.conf in directory /etc/ and add the following contents.
# Device configuration messages
local4.info /var/log/Device/info.log
In this configuration, local4 is the name of the logging facility that the log host uses to receive logs. The value of info indicates the informational severity level. The UNIX system records the log information that has a minimum severity level of informational to file /var/log/Device/info.log.
|
|
NOTE: Follow these guidelines while editing file /etc/syslog.conf: · Comments must be on a separate line and must begin with a pound sign (#). · No redundant spaces are allowed after the file name. · The logging facility name and the severity level specified in the /etc/syslog.conf file must be identical to those configured on the device by using the info-center loghost and info-center source commands. Otherwise, the log information might not be output correctly to the log host. |
d. Display the process ID of syslogd, kill the syslogd process, and then restart syslogd by using the –r option to validate the configuration.
# ps -ae | grep syslogd
147
# kill -HUP 147
# syslogd -r &
Now, the device can output FTP logs to the log host, which stores the logs to the specified file.
Configuration example for outputting logs to a Linux log host
Network requirements
Configure the device to output to the Linux log host 1.2.0.1/16 FTP logs that have a minimum severity level of informational.
Figure 92 Network diagram
Configuration procedure
Before the configuration, make sure the device and the log host can reach each other. (Details not shown.)
1. Configure the device:
# Enable the information center.
<Device> system-view
[Device] info-center enable
# Specify log host 1.2.0.1/16 with local5 as the logging facility.
[Device] info-center loghost 1.2.0.1 facility local5
# Disable log output to the log host.
[Device] info-center source default loghost deny
To avoid outputting unnecessary information, disable all modules from outputting log information to the specified destination (loghost in this example) before you configure an output rule.
# Configure an output rule to enable output to the log host FTP logs that have a minimum severity level of informational.
[Device] info-center source ftp loghost level informational
2. Configure the log host:
The following configurations were performed on Solaris. Other UNIX operating systems have similar configurations.
a. Log in to the log host as a root user.
b. Create a subdirectory named Device in the directory /var/log/, and create file info.log in the Device directory to save logs of Device.
# mkdir /var/log/Device
# touch /var/log/Device/info.log
c. Edit the file syslog.conf in directory /etc/ and add the following contents.
# Device configuration messages
local5.info /var/log/Device/info.log
In the above configuration, local5 is the name of the logging facility used by the log host to receive logs. info is the informational level. The Linux system will store the log information with a severity level equal to or higher than informational to the file /var/log/Device/info.log.
|
|
NOTE: Follow these guidelines while editing file /etc/syslog.conf: · Comments must be on a separate line and must begin with a pound sign (#). · No redundant spaces are allowed after the file name. · The logging facility name and the severity level specified in the /etc/syslog.conf file must be identical to those configured on the device by using the info-center loghost and info-center source commands. Otherwise, the log information might not be output correctly to the log host. |
d. Display the process ID of syslogd, kill the syslogd process, and then restart syslogd by using the -r option to apply the new configuration.
Make sure the syslogd process is started with the -r option on a Linux log host.
# ps -ae | grep syslogd
147
# kill -9 147
# syslogd -r &
Now, the system can record log information to the specified file.
Configuring flow log
About flow log
Flow log records users' access to external networks based on flows. Each flow is identified by a 5-tuple of the source IP address, destination IP address, source port, destination port, and protocol number.
Flow log creates entries based on NAT sessions.
Flow log export
You can export flow log entries in the following methods:
· Export flow log entries to log hosts. Flow log entries are sent as binary characters in UDP. One UDP packet can contain multiple log entries.
· Export flow log entries to the information center. Flow log entries are converted to syslog entries in ASCII format, with the informational severity level. The information center specifies the output destinations for the logs. Available output destinations include the console, log host, and log file. For more information about the information center, see "Configuring the information center."
Log entries in ASCII format are human readable. However, the log data volume is higher in ASCII format than in binary format.
Flow log versions
Flow log has three versions: version 1.0, version 3.0, and version 5.0. Table 34, Table 35, and Table 36 show the fields available in the versions.
|
Field |
Description |
|
SrcIP |
Source IP address before NAT. |
|
DestIP |
Destination IP address before NAT. |
|
SrcPort |
Source TCP/UDP port number before NAT. |
|
DestPort |
Destination TCP/UDP port number before NAT. |
|
StartTime |
Start time of the flow, in seconds. |
|
EndTime |
End time of the flow, in seconds. This field is 0 if the Operator field is 6 (regular connectivity check record for the active flow). |
|
Protocol |
Protocol number. |
|
Operator |
Reasons why a flow log entry was generated: · 0—Reserved. · 1—Flow was ended normally. · 2—Flow was aged out because of aging timer expiration. · 3—Flow was aged out because of configuration change or manual deletion. · 4—Flow was aged out because of insufficient resources. · 5—Reserved. · 6—Regular connectivity check record for the active flow. · 7—Flow was deleted because a new flow was created when the flow table was full. · 8—Flow was created. · FE—Other reasons. · 10-FE-1—Reserved for future use. |
|
Reserved |
Reserved for future use. |
Table 35 Flow log 3.0 fields
|
Field |
Description |
|
Protocol |
Protocol number. |
|
Operator |
Reasons why a flow log was generated: · 0—Reserved. · 1—Flow was ended normally. · 2—Flow was aged out because of aging timer expiration. · 3—Flow was aged out because of configuration change. · 4—Flow was aged out because of insufficient resources. · 5—Reserved. · 6—Regular connectivity check record for the active flow. · 7—Flow was deleted because a new flow was created when the flow table was full. · 8—Flow was created. · FE—Other reasons. · 10-FE-1—Reserved for future use. |
|
IPVersion |
IP packet version. |
|
TosIPv4 |
ToS field of the IPv4 packet. |
|
SourceIP |
Source IP address before NAT. |
|
SrcNatIP |
Source IP address after NAT. |
|
DestIP |
Destination IP address before NAT. |
|
DestNatIP |
Destination IP address after NAT. |
|
SrcPort |
Source TCP/UDP port number before NAT. |
|
SrcNatPort |
Source TCP/UDP port number after NAT. |
|
DestPort |
Destination TCP/UDP port number before NAT. |
|
DestNatPort |
Destination TCP/UDP port number after NAT. |
|
StartTime |
Start time of the flow, in seconds. |
|
EndTime |
End time of the flow, in seconds. This field is 0 when the Operator field is 6 (regular connectivity check record for the active flow). |
|
InTotalPkg |
Number of packets received for the session. |
|
InTotalByte |
Number of bytes received for the session. |
|
OutTotalPkg |
Number of packets sent for the session. |
|
OutTotalByte |
Number of bytes sent for the session. |
|
InVPNID |
ID of the source VPN instance. |
|
OutVPNID |
ID of the destination VPN instance. |
|
Reserved1 |
Reserved field. |
|
AppID |
Application protocol ID. |
|
Reserved3 |
Reserved field. |
|
Field |
Description |
|
Protocol |
Protocol number. |
|
Operator |
Reasons why a flow log was generated: · 0—Reserved. · 1—Flow was ended normally. · 2—Flow was aged out because of aging timer expiration. · 3—Flow was aged out because of configuration change. · 4—Flow was aged out because of insufficient resources. · 5—Reserved. · 6—Regular connectivity check record for the active flow. · 7—Flow was deleted because a new flow was created when the flow table was full. · 8—Flow was created. · FE—Other reasons. · 10-FE-1—Reserved for future use. |
|
IPVersion |
IP packet version. |
|
TosIPv4 |
ToS field of the IPv4 packet. |
|
SourceIP |
Source IP address before NAT. |
|
SrcNatIP |
Source IP address after NAT. |
|
DestIP |
Destination IP address before NAT. |
|
DestNatIP |
Destination IP address after NAT. |
|
SrcPort |
Source TCP/UDP port number before NAT. |
|
SrcNatPort |
Source TCP/UDP port number after NAT. |
|
DestPort |
Destination TCP/UDP port number before NAT. |
|
DestNatPort |
Destination TCP/UDP port number after NAT. |
|
StartTime |
Start time of the flow, in seconds. |
|
EndTime |
End time of the flow, in seconds. This field is 0 when the Operator field is 6 (regular connectivity check record for the active flow). |
|
InTotalPkg |
Number of packets received for the session. |
|
InTotalByte |
Number of bytes received for the session. |
|
OutTotalPkg |
Number of packets sent for the session. |
|
OutTotalByte |
Number of bytes sent for the session. |
|
InVPNID |
ID of the source VPN instance. |
|
OutVPNID |
ID of the destination VPN instance. |
|
AppID |
Application protocol ID. |
|
UserName |
Username. |
|
Reserved1 Reserved2 Reserved3 |
Reserved fields. |
Feature and hardware compatibility
|
Hardware |
Flow log compatibility |
|
MSR810/810-W/810-W-DB/810-LM/810-W-LM/810-10-PoE/810-LM-HK/810-W-LM-HK |
Yes |
|
MSR810-LMS/810-LUS |
No |
|
MSR2600-6-X1/2600-10-X1 |
Yes |
|
MSR 2630 |
Yes |
|
MSR3600-28/3600-51 |
Yes |
|
MSR3600-28-SI/3600-51-SI |
No |
|
MSR3610-X1/3610-X1-DP/3610-X1-DC/3610-X1-DP-DC |
Yes |
|
MSR 3610/3620/3620-DP/3640/3660 |
Yes |
|
MSR5620/5660/5680 |
Yes |
|
Hardware |
Flow log compatibility |
|
MSR810-LM-GL |
Yes |
|
MSR810-W-LM-GL |
Yes |
|
MSR830-6EI-GL |
Yes |
|
MSR830-10EI-GL |
Yes |
|
MSR830-6HI-GL |
Yes |
|
MSR830-10HI-GL |
Yes |
|
MSR2600-6-X1-GL |
Yes |
|
MSR3600-28-SI-GL |
No |
|
MSR5620/5660/5680 |
Yes |
Flow log configuration task list
|
Tasks at a glance |
|
(Required.) Perform one of the following tasks for flow log export: · Specifying a log host as the flow log export destination · Specifying the information center as the flow log export destination |
|
(Optional.) Configuring the flow log version |
|
(Optional.) Specifying a source IP address for flow log packets |
|
(Optional.) Configuring the timestamp of flow log entries |
|
(Optional.) Enabling load balancing for flow log entries |
|
(Optional.) Configuring flow log host groups |
Configuration prerequisites
Before you configure the flow log feature, complete the following tasks:
· Enable NAT logging by using the nat log enable command.
· Enable the following NAT logging features:
? Logging of active NAT flows (nat log flow-active).
? Logging of NAT session establishment events (nat log flow-begin).
? Logging of NAT session removal events (nat log flow-end).
For more information about the NAT logging commands, see Layer 3—IP Services Command Reference.
Specifying a flow log export destination
Configuration restrictions and guidelines
You can export flow log entries to log hosts or the information center, but not both. If you configure both methods, the system exports flow log entries to the information center.
As a best practice to improve log transmission efficiency, send flow log entries to log hosts (in binary format), because NAT session log data is usually very large.
Specifying a log host as the flow log export destination
|
Step |
Command |
Remarks |
|
1. Enter system view. |
system-view |
N/A |
|
2. Specify a log host as the destination for flow log export. |
By default, no log hosts are specified. To specify multiple log hosts, repeat this step. |
Specifying the information center as the flow log export destination
|
Step |
Command |
Remarks |
|
1. Enter system view. |
system-view |
N/A |
|
2. Specify the information center as the destination for flow log export. |
userlog flow syslog |
By default, flow log entries are not exported. |
Configuring the flow log version
|
Step |
Command |
Remarks |
|
1. Enter system view. |
system-view |
N/A |
|
2. Configure the flow log version. |
userlog flow export version version-number |
The default flow log version is 1.0. Make sure the specified flow log version is supported on the log host. If you configure the flow log version multiple times, the most recent configuration takes effect. |
Specifying a source IP address for flow log packets
By default, the source IP address for flow log packets is the IP address of their outgoing interface. For the log hosts to filter log entries by log sender, specify a source IP address for all flow log packets.
As a best practice, use a Loopback interface's address as the source IP address for flow log packets. A Loopback interface is always up. The setting avoids export failure on interfaces that might go down.
To configure the source IP address for flow log packets:
|
Step |
Command |
Remarks |
|
1. Enter system view. |
system-view |
N/A |
|
2. Specify a source IPv4 or IPv6 address for flow log packets. |
userlog flow export source-ip { ipv4-address | ipv6 ipv6-address } |
By default, the source IP address for flow log packets is the IP address of their outgoing interface. |
Configuring the timestamp of flow log entries
The device uses either the local time or the UTC time in the timestamp of flow log entries.
· UTC time—Standard Greenwich Mean Time (GMT).
· Local time—Standard GMT plus or minus the time zone offset.
The time zone offset can be configured by using the clock timezone command. For more information, see Fundamentals Command Reference.
By default, the UTC time is used.
To configure the device to use the local time in the flow log timestamp:
|
Step |
Command |
Remarks |
|
1. Enter system view. |
system-view |
N/A |
|
2. Configure the device to use the local time in the flow log timestamp. |
userlog flow export timestamp localtime |
By default, the UTC time is used in the flow log timestamp. |
Enabling load balancing for flow log entries
By default, the device sends a copy of each flow log entry to all available log hosts. When one log host fails, other log hosts still have complete flow log entries.
In load balancing mode, flow log entries are distributed among log hosts based on the source IP addresses (before NAT) that are recorded in the entries. The flow log entries generated for the same source IP address are sent to the same log host. If a log host goes down, the flow logs sent to it will be lost.
To enable load balancing for flow log entries:
|
Step |
Command |
Remarks |
|
1. Enter system view. |
system-view |
N/A |
|
2. Enable load balancing for flow log entries. |
userlog flow export load-balancing |
By default, load balancing is disabled. |
Configuring flow log host groups
About flow log host group
By default, the device sends a copy of each flow log entry to all available log hosts. To filter logs and reduce the log sending and processing workload of the device, configure the flow log host group feature.
The flow log host group feature allows you to classify flow log hosts into groups and specify an ACL for each group. A flow log matches a log host group if it matches the group's ACL, and it is sent only to the log hosts in the matching group.
If a flow log matches multiple log host groups, the device sends the log to the group that comes first in alphabetical order of the matching group names.
If a flow log does not match any log host groups, the device ignores the log host group configuration and sends the log to all configured log hosts.
If load balancing is enabled, flow logs sent to a log host group will be load-shared among the log hosts in the group. Flow logs generated for the same source IP address are sent to the same log host.
Prerequisites for configuring flow log host groups
Before you configure flow log host groups, complete the following tasks:
· Configure the ACLs to be used by the flow log host groups.
· Use the userlog flow export host command to configure the log hosts to be assigned to the flow log host groups.
Configuring an IPv4 flow log host group
|
Step |
Command |
Remarks |
|
1. Enter system view. |
system-view |
N/A |
|
2. Create an IPv4 flow log host group and enter its view. |
userlog host-group host-group-name acl { name acl-name | number acl-number } |
By default, no IPv4 flow log host groups exist. |
|
3. Assign an IPv4 log host to the flow log host group. |
userlog host-group [ vpn-instance vpn-instance-name ] host flow { hostname | ipv4-address } |
By default, an IPv4 flow log host group does not contain any log hosts. |
Configuring an IPv6 flow log host group
|
Step |
Command |
Remarks |
|
1. Enter system view. |
system-view |
N/A |
|
2. Create an IPv6 flow log host group and enter its view. |
userlog host-group ipv6 host-group-name acl { name acl-name | number acl-number } |
By default, no IPv6 flow log host groups exist. |
|
3. Assign an IPv6 log host to the flow log host group. |
userlog host-group [ vpn-instance vpn-instance-name ] host flow ipv6 { hostname | ipv6-address } |
By default, an IPv6 flow log host group does not contain any log hosts. |
Displaying and maintaining flow log
Execute display commands in any view.
|
Task |
Command |
|
Display flow log configuration and statistics. |
display userlog export |
|
Display flow log host group information. |
display userlog host-group [ ipv6 ] [ host-group-name ] |
|
Clear flow log statistics. |
reset userlog flow export |
Flow log configuration examples
Configuring flow log export
Network requirements
As shown in Figure 93, configure flow log on the device to send flow log entries generated for the user to the log host.
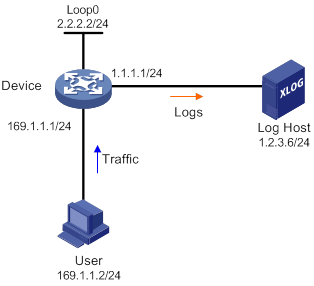
Configuration procedure
# Configure IP addresses, as shown in Figure 93. Make sure the device, user, and the log host can reach one another. (Details not shown.)
# Enable NAT logging.
<Device> system-view
[Device] nat log enable
# Enable NAT logging for session establishment events, session removal events, and active flows.
[Device] nat log flow-begin
[Device] nat log flow-end
[Device] nat log flow-active 10
# Set the flow log version to 3.0.
[Device] userlog flow export version 3
# Specify the log host at 1.2.3.6 as the destination for flow log export. Set the UDP port number to 2000.
[Device] userlog flow export host 1.2.3.6 port 2000
# Specify 2.2.2.2 as the source IP address for flow log packets.
[Device] userlog flow export source-ip 2.2.2.2
[Device] quit
Verifying the configuration
# Display the flow log configuration and statistics.
<Device> display userlog export
Flow:
Export flow log as UDP Packet.
Version: 3.0
Source address: 2.2.2.2
Log load balance function: Disabled
Number of log hosts: 1
Log host 1:
Host/Port: 1.2.3.6/2000
Total logs/UDP packets exported: 112/87
Configuring flow log export to a flow log host group
Network requirements
As shown in Figure 94, configure a flow log host group on the device to send flow log entries generated for the user only to Log Host 1.
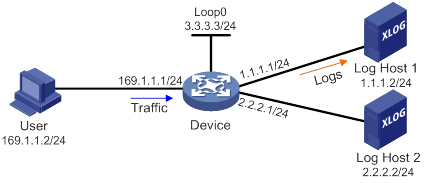
Configuration procedure
# Configure IP addresses, as shown in Figure 94. Make sure the device, user, and the log host can reach one another. (Details not shown.)
# Enable NAT logging.
<Device> system-view
[Device] nat log enable
# Enable NAT logging for session establishment events, session removal events, and active flows.
[Device] nat log flow-begin
[Device] nat log flow-end
[Device] nat log flow-active 10
# Specify Log Host 1 and Log Host 2 for flow log export.
[Device] userlog flow export host 1.1.1.2 port 2000
[Device] userlog flow export host 2.2.2.2 port 2000
# Specify 3.3.3.3 as the source IP address for flow log packets.
[Device] userlog flow export source-ip 3.3.3.3
# Create ACL 2000 to match packets sent by the user.
[Device] acl basic 2000
[Device-acl-ipv4-basic-2000] rule 1 permit source 169.1.1.2 0.0.0.0
[Device-acl-ipv4-basic-2000] quit
# Create an IPv4 flow log host group named test and specify ACL 2000 for it.
[Device] userlog host-group test acl number 2000
# Assign Log Host 1 to flow log host group test.
[Device-userlog-host-group-test] userlog host-group host flow 1.1.1.2
[Device-userlog-host-group-test] quit
Verifying the configuration
# Display information about flow log host group test.
[Device] display userlog host-group test
Userlog host-group test:
ACL number: 2000
Flow log host numbers: 1
Log host 1:
Host/port: 1.1.1.2/2000
# After the user comes online, display flow log export statistics.
[Device] display userlog export
Flow:
Export flow log as UDP Packet.
Version: 1.0
Source ipv4 address: 3.3.3.3
Source ipv6 address:
Log load balance function: Disabled
Local time stamp: Disabled
Number of log hosts: 2
Log host 1:
Host/Port: 1.1.1.2/2000
Total logs/UDP packets exported: 13/13
Log host 2:
Host/Port: 2.2.2.2/2000
Total logs/UDP packets exported: 0/0
Configuring the packet capture
The term "AC" in this document refers to MSR routers that can function as ACs. The term "AP" in this document refers to MSR routers that support WLAN.
The following routers cannot function as ACs:
· MSR3600-28-SI/3600-51-SI.
· MSR3610-X1/3610-X1-DP/3610-X1-DC/3610-X1-DP-DC.
· MSR5620/5660/5680.
The following routers can function as fat APs:
· MSR810-W.
· MSR810-W-DB.
· MSR810-W-LM.
· MSR810-W-LM-HK.
Overview
The packet capture feature captures incoming packets that are to be forwarded in CPU. The feature displays the captured packets in real time, and allows you to save the captured packets to a .pcap file for future analysis.
Packet capture modes
You can configure packet capture for only one user at a time.
Local packet capture
Local packet capture saves the captured packets to a remote file on an FTP server, to a local file, or displays the captured packets at the CLI.
Remote packet capture
Remote packet capture displays the captured packets on a Wireshark client. Before using remote packet capture, you must install the Wireshark software on a PC and connect the PC to the device to be used to capture packets. The device sends the packet data to be displayed to the Wireshark client.
Feature image-based packet capture
Feature image-based packet capture saves the captured packets to a local file or displays the captured packets on the terminal in a .pcap or .pcapng file.
If you uninstall the feature image, the remote and local packet capture are also uninstalled.
Filter elements
Packet capture supports capture filters and display filters. You can use expressions to match packets to capture or display.
A capture or display filter contains a keyword string or multiple keyword strings that are connected by operators.
Keywords include the following types:
· Qualifiers—Fixed keyword strings. For example, you must use the ip qualifier to specify the IPv4 protocol.
· Variables—Values supplied by users in the required format. For example, you can set an IP address to 2.2.2.2 or any other valid values.
A variable must be modified by one or multiple qualifiers. For example, to capture any packets sent from the host at 2.2.2.2, use the filter src host 2.2.2.2.
Operators include the following types:
· Logical operators—Perform logical operations, such as the AND operation.
· Arithmetic operators—Perform arithmetic operations, such as the ADD operation.
· Relational operators—Indicate the relation between keyword strings. For example, the = operator indicates equality.
This document provides basic information about these elements. For more information about capture and display filters, go to the following websites:
· http://wiki.wireshark.org/CaptureFilters.
· http://wiki.wireshark.org/DisplayFilters.
Capture filter keywords
Table 37 and Table 38 describe the qualifiers and variables for capture filters, respectively.
Table 37 Qualifiers for capture filters
|
Category |
Description |
Examples |
|
Protocol |
Matches a protocol. If you do not specify a protocol qualifier, the filter matches any supported protocols. |
· arp—Matches ARP. · icmp—Matches ICMP. · ip—Matches IPv4. · ip6—Matches IPv6. · tcp—Matches TCP. · udp—Matches UDP. |
|
Direction |
Matches packets based on its source or destination location (an IP address or port number). If you do not specify a direction qualifier, the src or dst qualifier applies. |
· src—Matches the source IP address field. · dst—Matches the destination IP address field. · src or dst—Matches the source or destination IP address field. NOTE: The src or dst qualifier applies if you do not specify a direction qualifier. For example, port 23 is equivalent to src or dst port 23. |
|
Type |
Specifies the direction type. |
· host—Matches the IP address of a host. · net—Matches an IP subnet. · port—Matches a service port number. · portrange—Matches a service port range. NOTE: The host qualifier applies if you do not specify any type qualifier. For example, src 2.2.2.2 is equivalent to src host 2.2.2.2. To specify an IPv6 subnet, you must specify the net qualifier. |
|
Others |
Any other qualifiers than the previously described qualifiers. |
· broadcast—Matches broadcast packets. · multicast—Matches multicast and broadcast packets. · less—Matches packets that are less than or equal to a specific size. · greater—Matches packets that are greater than or equal to a specific size. · len—Matches the packet length. · vlan—Matches VLAN packets. |
|
|
NOTE: The broadcast, multicast, and all protocol qualifiers cannot modify variables. |
Table 38 Variable types for capture filters
|
Variable type |
Description |
Examples |
|
|
Integer |
Represented in binary, octal, decimal, or hexadecimal notation. |
The port 23 expression matches traffic sent to or from port number 23. |
|
|
Integer range |
Represented by hyphenated integers. |
The portrange 100-200 expression matches traffic sent to or from any ports in the range of 100 to 200. |
|
|
IPv4 address |
Represented in dotted decimal notation. |
The src 1.1.1.1 expression matches traffic sent from the IPv4 host at 1.1.1.1. |
|
|
IPv6 address |
Represented in colon hexadecimal notation. |
The dst host 1::1 expression matches traffic sent to the IPv6 host at 1::1. |
|
|
IPv4 subnet |
Represented by an IPv4 network ID or an IPv4 address with a mask. |
Both of the following expressions match traffic sent to or from the IPv4 subnet 1.1.1.0/24: · src 1.1.1. · src net 1.1.1.0/24. |
|
|
IPv6 network segment |
Represented by an IPv6 address with a prefix length. |
The dst net 1::/64 expression matches traffic sent to the IPv6 network 1::/64. |
|
Capture filter operators
Capture filters support logical operators (Table 39), arithmetic operators (Table 40), and relational operators (Table 41). Logical operators can use both alphanumeric and nonalphanumeric symbols. The arithmetic and relational operators can use only nonalphanumeric symbols.
Logical operators are left associative. They group from left to right. The not operator has the highest priority. The and and or operators have the same priority.
Table 39 Logical operators for capture filters
|
Nonalphanumeric symbol |
Alphanumeric symbol |
Description |
|
! |
not |
Reverses the result of a condition. Use this operator to capture traffic that matches the opposite value of a condition. For example, to capture non-HTTP traffic, use not port 80. |
|
&& |
and |
Joins two conditions. Use this operator to capture traffic that matches both conditions. For example, to capture non-HTTP traffic that is sent to or from 1.1.1.1, use host 1.1.1.1 and not port 80. |
|
|| |
or |
Joins two conditions. Use this operator to capture traffic that matches either of the conditions. For example, to capture traffic that is sent to or from 1.1.1.1 or 2.2.2.2, use host 1.1.1.1 or host 2.2.2.2. |
Table 40 Arithmetic operators for capture filters
|
Nonalphanumeric symbol |
Description |
|
+ |
Adds two values. |
|
- |
Subtracts one value from another. |
|
* |
Multiplies one value by another. |
|
/ |
Divides one value by another. |
|
& |
Returns the result of the bitwise AND operation on two integral values in binary form. |
|
| |
Returns the result of the bitwise OR operation on two integral values in binary form. |
|
<< |
Performs the bitwise left shift operation on the operand to the left of the operator. The right-hand operand specifies the number of bits to shift. |
|
>> |
Performs the bitwise right shift operation on the operand to the left of the operator. The right-hand operand specifies the number of bits to shift. |
|
[ ] |
Specifies a byte offset relative to a protocol layer. This offset indicates the byte where the matching begins. You must enclose the offset value in the brackets and specify a protocol qualifier. For example, ip[6] matches the seventh byte of payload in IPv4 packets (the byte that is six bytes away from the beginning of the IPv4 payload). |
Table 41 Relational operators for capture filters
|
Nonalphanumeric symbol |
Description |
|
= |
Equal to. For example, ip[6]=0x1c matches an IPv4 packet if its seventh byte of payload is equal to 0x1c. |
|
!= |
Not equal to. For example, len!=60 matches a packet if its length is not equal to 60 bytes. |
|
> |
Greater than. For example, len>100 matches a packet if its length is greater than 100 bytes. |
|
< |
Less than. For example, len<100 matches a packet if its length is less than 100 bytes. |
|
>= |
Greater than or equal to. For example, len>=100 matches a packet if its length is greater than or equal to 100 bytes. |
|
<= |
Less than or equal to. For example, len<=100 matches a packet if its length is less than or equal to 100 bytes. |
Display filter keywords
Table 42 and Table 43 describe the qualifiers and variables for display filters, respectively.
Table 42 Qualifiers for display filters
|
Category |
Description |
Examples |
|
Protocol |
Matches a protocol. |
· eth—Matches Ethernet. · ftp—Matches FTP. · http—Matches HTTP. · icmp—Matches ICMP. · ip—Matches IPv4. · ipv6—Matches IPv6. · tcp—Matches TCP. · telnet—Matches Telnet. · udp—Matches UDP. |
|
Packet field |
Matches a field in packets by using a dotted string in the protocol.field[.level1-subfield]…[.leveln-subfield] format. |
· tcp.flags.syn—Matches the SYN bit in the flags field of TCP. · tcp.port—Matches the source or destination port field. |
|
|
NOTE: The protocol qualifiers cannot modify variables. |
Table 43 Variable types for display filters
|
Variable type |
Description |
|
Integer |
Represented in binary, octal, decimal, or hexadecimal notation. For example, to display IP packets that are less than or equal to 1500 bytes, use one of the following expressions: · ip.len le 1500. · ip.len le 02734. · ip.len le 0x436. |
|
Boolean |
This variable type has two values: true or false. This variable type applies if you use a packet field string alone to identify the presence of a field in a packet. · If the field is present, the match result is true. The filter displays the packet. · If the field is not present, the match result is false. The filter does not display the packet. For example, to display TCP packets that contain the SYN field, use tcp.flags.syn. |
|
MAC address (six bytes) |
Uses colons (:), dots (.), or hyphens (-) to break up the MAC address into two or four segments. For example, to display packets that contain a destination MAC address of ffff.ffff.ffff, use one of the following expressions: · eth.dst==ff:ff:ff:ff:ff:ff. · eth.dst==ff-ff-ff-ff-ff-ff. · eth.dst ==ffff.ffff.ffff. |
|
IPv4 address |
Represented in dotted decimal notation. For example: · To display IPv4 packets that are sent to or from 192.168.0.1, use ip.addr==192.168.0.1. · To display IPv4 packets that are sent to or from 129.111.0.0/16, use ip.addr==129.111.0.0/16. |
|
IPv6 address |
Represented in colon hexadecimal notation. For example: · To display IPv6 packets that are sent to or from 1::1, use ipv6.addr==1::1. · To display IPv6 packets that are sent to or from 1::/64, use ipv6.addr==1::/64. |
|
String |
Character string. For example, to display HTTP packets that contain the string HTTP/1.1 for the request version field, use http.request version=="HTTP/1.1". |
Display filter operators
Display filters support logical operators (Table 44) and relational operators (Table 45). Both operator types can use alphanumeric and nonalphanumeric symbols.
Logical operators are left associative. They group from left to right. Table 44 displays logical operators by priority, from the highest to the lowest. The and and or operators have the same priority:
Table 44 Logical operators for display filters
|
Nonalphanumeric symbol |
Alphanumeric symbol |
Description |
|
[ ] |
No alphanumeric symbol is available. |
Used with protocol qualifiers. For more information, see "The proto[…] expression." |
|
! |
not |
Displays packets that do not match the condition connected to this operator. |
|
&& |
and |
Joins two conditions. Use this operator to display traffic that matches both conditions. |
|
|| |
or |
Joins two conditions. Use this operator to display traffic that matches either of the conditions. |
Table 45 Relational operators for display filters
|
Nonalphanumeric symbol |
Alphanumeric symbol |
Description |
|
== |
eq |
Equal to. For example, ip.src==10.0.0.5 displays packets with the source IP address as 10.0.0.5. |
|
!= |
ne |
Not equal to. For example, ip.src!=10.0.0.5 displays packets whose source IP address is not 10.0.0.5. |
|
> |
gt |
Greater than. For example, frame.len>100 displays frames with a length greater than 100 bytes. |
|
< |
lt |
Less than. For example, frame.len<100 displays frames with a length less than 100 bytes. |
|
>= |
ge |
Greater than or equal to. For example, frame.len ge 0x100 displays frames with a length greater than or equal to 256 bytes. |
|
<= |
le |
Less than or equal to. For example, frame.len le 0x100 displays frames with a length less than or equal to 256 bytes. |
Building a capture filter
This section provides the most commonly used expression types for capture filters.
Logical expression
Use this type of expression to capture packets that match the result of logical operations.
Logical expressions contain keywords and logical operators. For example:
· not port 23 and not port 22—Captures packets with a port number that is not 23 or 22.
· port 23 or icmp—Captures packets with a port number 23 or ICMP packets.
In a logical expression, a qualifier can modify more than one variable connected by its nearest logical operator. For example, to capture packets sourced from IPv4 address 192.168.56.1 or IPv4 network 192.168.27, use either of the following expressions:
· src 192.168.56.1 or 192.168.27.
· src 192.168.56.1 or src 192.168.27.
The expr relop expr expression
Use this type of expression to capture packets that match the result of arithmetic operations.
This expression contains keywords, arithmetic operators (expr), and relational operators (relop). For example, len+100>=200 captures packets that are greater than or equal to 100 bytes.
The proto [ expr:size ] expression
Use this type of expression to capture packets that match the result of arithmetic operations on a number of bytes relative to a protocol layer.
This type of expression contains the following elements:
· proto—Specifies a protocol layer.
· []—Performs arithmetic operations on a number of bytes relative to the protocol layer.
· expr—Specifies the arithmetic expression.
· size—Specifies the byte offset. This offset indicates the number of bytes relative to the protocol layer. The operation is performed on the specified bytes. The offset is set to 1 byte if you do not specify an offset.
For example, ip[0]&0xf !=5 captures an IP packet if the result of ANDing the first byte with 0x0f is not 5.
To match a field, you can specify a field name for expr:size. For example, icmp[icmptype]=0x08 captures ICMP packets that contain a value of 0x08 in the Type field.
The vlan vlan_id expression
Use this type of expression to capture 802.1Q tagged VLAN traffic.
This type of expression contains the vlan vlan_id keywords and logical operators. The vlan_id variable is an integer that specifies a VLAN ID. For example, vlan 1 and ip6 captures IPv6 packets in VLAN 1.
To capture 802.1Q tagged traffic, you must use the vlan vlan_id expression prior to any other expressions. An expression matches untagged packets if it does not follow a vlan vlan_id expression. For example:
· vlan 1 and !tcp—Captures VLAN 1-tagged non-TCP packets.
· icmp and vlan 1—Captures untagged ICMP packets that are VLAN 1 tagged. This expression does not capture any packets because no packets can be both tagged and untagged.
Building a display filter
This section provides the most commonly used expression types for display filters.
Logical expression
Use this type of expression to display packets that match the result of logical operations.
Logical expressions contain keywords and logical operators. For example, ftp or icmp displays all FTP packets and ICMP packets.
Relational expression
Use this type of expression to display packets that match the result of comparison operations.
Relational expressions contain keywords and relational operators. For example, ip.len<=28 displays IP packets that contain a value of 28 or fewer bytes in the length field.
Packet field expression
Use this type of expression to display packets that contain a specific field.
Packet field expressions contain only packet field strings. For example, tcp.flags.syn displays all TCP packets that contain the SYN bit field.
The proto[…] expression
Use this type of expression to display packets that contain specific field values.
This type of expression contains the following elements:
· proto—Specifies a protocol layer or packet field.
· […]—Matches a number of bytes relative to a protocol layer or packet field. Values for the bytes to be matched must be a hexadecimal integer string. The expression in brackets can use the following formats:
? [n:m]—Matches a total of m bytes after an offset of n bytes from the beginning of the specified protocol layer or field. To match only 1 byte, you can use both [n] and [n:1] formats. For example, eth.src[0:3]==00:00:83 matches an Ethernet frame if the first three bytes of its source MAC address are 0x00, 0x00, and 0x83. The eth.src[2] == 83 expression matches an Ethernet frame if the third byte of its source MAC address is 0x83.
? [n-m]—Matches a total of (m-n+1) bytes, starting from the (n+1)th byte relative to the beginning of the specified protocol layer or packet field. For example, eth.src[1-2]==00:83 matches an Ethernet frame if the second and third bytes of its source MAC address are 0x00 and 0x83, respectively.
Packet capture configuration task list
|
Tasks at a glance |
Remarks |
|
Configuring local packet capture: · Configuring local packet capture (on wired devices) |
Perform one of the tasks. |
|
Configuring remote packet capture: · Configuring remote packet capture (on wired devices) |
|
|
N/A |
Configuring local packet capture (on wired devices)
Perform this task to capture incoming packets and save the captured packets to a local file or to a remote file on an FTP server. To display the captured packets on the FTP server, use the Wireshark client connected to the FTP server. To stop the packet capture, use the packet-capture stop command.
To configure local packet capture:
|
Task |
Command |
Remarks |
|
Configure local packet capture. |
packet-capture local interface interface-type interface-number [ capture-filter capt-expression | limit-frame-size bytes | autostop filesize kilobytes | autostop duration seconds ] * write { filepath | url url [ username username [ password { cipher | simple } string ] ] } |
After this command is executed, you can still configure other commands from the CLI. The operation does not affect the packet capture. |
Configuring local packet capture (on ACs)
Perform this task to capture incoming packets on an AP radio and save the captured packets to a file on an FTP server. To display the captured packets, use the Wireshark client connected to the FTP server. To stop the packet capture, use the packet-capture stop command.
To configure local packet capture on an AP radio:
|
Task |
Command |
Remarks |
|
Configure local packet capture on an AP radio. |
packet-capture local ap ap-name radio radio-id [ capture-filter capt-expression | limit-frame-size bytes | autostop filesize kilobytes | autostop duration seconds ] * write url url [ username username [ password { cipher | simple } string ] ] |
After this command is executed, you can still configure other commands from the CLI. The operation does not affect the packet capture. |
Configuring local packet capture (on fat APs)
Perform this task to capture incoming packets on a radio interface and save the captured packets to a local file or to a remote file on an FTP server. To display the captured packets on the local device, use the packet-capture read command. To display the captured packets on the FTP server, use the Wireshark client connected to the FTP server. To stop the packet capture, use the packet-capture stop command.
To configure local packet capture:
|
Task |
Command |
Remarks |
|
Configure local packet capture. |
packet-capture local interface interface-type interface-number [ capture-filter capt-expression | limit-frame-size bytes | autostop filesize kilobytes | autostop duration seconds ] * write { filepath | url url [ username username [ password { cipher | simple } string ] ] } |
After this command is executed, you can still configure other commands from the CLI. The operation does not affect the packet capture. |
Configuring remote packet capture (on wired devices)
|
Task |
Command |
Remarks |
|
Configure remote packet capture. |
packet-capture remote interface interface-type interface-number [ port port ] |
To stop the capture while it is capturing packets, use the packet-capture stop command. |
To display the captured packets, perform the following tasks:
1. Connect the Wireshark client to the device.
2. Start Wireshark and select Capture > Options.
3. Select Remote from the Interface list.
4. Enter the IP address of the remote interface and the RPCAP service port number on the window that appears, and click OK.
Make sure the interface IP address is reachable for the Wireshark. If you do not specify the RPCAP service port number, the default RPCAP service port 2002 is used.
5. Click Start.
Figure 95 Configuring Wireshark capture options

Configuring remote packet capture (on ACs)
|
Task |
Command |
Remarks |
|
Configure remote packet capture. |
·
Configure remote packet capture on an AP
radio: ·
Configure remote packet capture on an
interface: |
To stop the packet capture, use the packet-capture stop command. |
To display the captured packets, perform the following tasks:
1. Connect the Wireshark client to the device that captures packets. If you configured remote packet capture on an AP radio, connect the Wireshark client to the AP.
2. Start Wireshark and select Capture > Options.
3. Select Remote from the Interface list.
4. On the window that appears, enter the following items:
? IP address of the remote interface or AP
? RPCAP service port number.
Make sure the IP address is reachable for the Wireshark. If you do not specify the RPCAP service port number, the default RPCAP service port 2002 is used.
5. Click OK and then click Start.
Figure 96 Configuring Wireshark capture options

Configuring remote packet capture (on fat APs)
To configure remote packet capture:
|
Task |
Command |
Remarks |
|
Configure remote packet capture. |
packet-capture remote interface interface-type interface-number [ port port ] |
To stop the capture while it is capturing packets, use the packet-capture stop command. |
To display the captured packets, perform the following tasks:
1. Connect the Wireshark client to the device that captures packets.
2. Start Wireshark and select Capture > Options.
3. Select Remote from the Interface list.
4. Enter the IP address of the remote interface and the RPCAP service port number on the window that appears, and click OK.
Make sure the interface IP address is reachable for the Wireshark. If you do not specify the RPCAP service port number, the default RPCAP service port 2002 is used.
5. Click Start.
Figure 97 Configuring Wireshark capture options
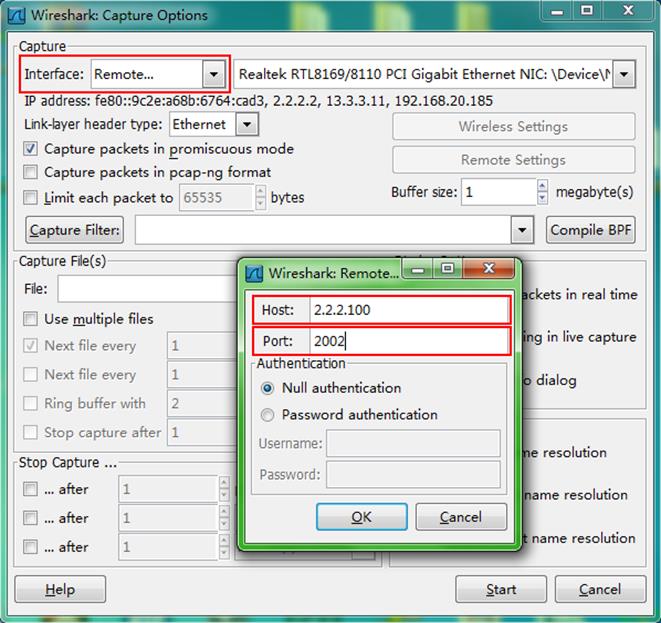
Displaying the contents in a packet file (on wired devices)
|
Task |
Command |
Remarks |
|
Display the contents in a packet file. |
packet-capture read filepath [ display-filter disp-expression ] [ raw | { brief | verbose } ] * |
To stop displaying the contents, press Ctrl+C. |
Displaying and maintaining packet capture
Execute display commands in any view.
|
Command |
|
|
Display the packet capture status. |
display packet-capture status |
Packet capture configuration examples
Remote packet capture configuration example (on wired devices)
Network requirements
As shown in Figure 98, capture packets on GigabitEthernet 1/0/1 and use Wireshark to display the captured packets.
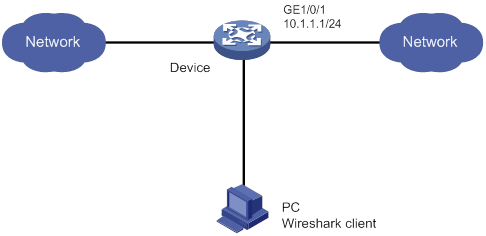
Configuration procedure
1. Configure remote packet capture on GigabitEthernet 1/0/1 and specify the RPCAP service port number as 2014.
<Device> packet-capture remote interface gigabitethernet 1/0/1 port 2014
2. Display captured packets on the PC:
a. Start Wireshark and select Capture > Options.
b. Select Remote from the Interface list.
c. Enter an IP address of 10.1.1.1 and a port number of 2014, and click OK.
d. Click Start.
The captured packets are displayed on the page that appears.
Figure 99 Displaying the captured packets on the Wireshark
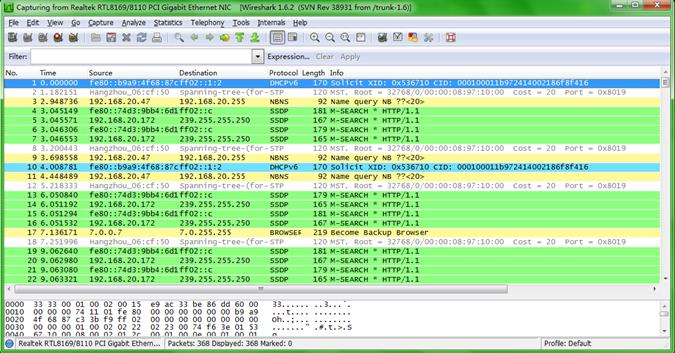
Local packet capture configuration example (on ACs)
Network requirements
As shown in Figure 100, enable local packet capture on radio 1 of the AP to capture 1 KB of TCP packets sourced from 192.168.20.173. Use the switch as the FTP server to store packets captured by the AP.
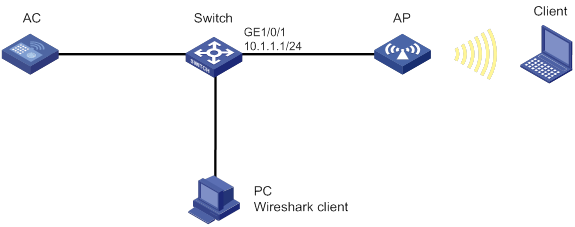
Configuration procedure
1. Configure the switch:
# Create a device management user.
<Switch> system-view
[Switch] local-user abc class manage
# Set the password to 123456 in plain text for the user.
[Switch-luser-abc] password simple 123456
# Assign the user the network-admin user role and specify a working directory for the user.
[Switch-luser-abc] authorization-attribute user-role network-admin work-directory flash:/
# Specify the FTP service type for the user.
[Switch-luser-abc] service-type ftp
[Switch-luser-abc] quit
# Enable the FTP server.
[Switch] ftp server enable
[Switch] quit
2. Configure the AC.
# Configure radio 1 of ap1 to capture 1 KB of TCP packets sourced from 192.168.20.173 and to save the captured packets to the abc.pcap file on FTP server 10.1.1.1. Specify the username as abc and the password as 123456.
<AC> packet-capture local ap ap1 radio 1 autostop filesize 1 capture-filter "src 192.168.20.173 and tcp" write url ftp://10.1.1.1/abc.pcap username abc password simple 123456
Verifying the configuration
# Execute the display packet-capture status command to display the capture status. (Details not shown.)
# Connect the Wireshark client to the FTP server and display the captured packets on the PC. (Details not shown.)
Remote packet capture configuration example (on ACs)
Network requirements
As shown in Figure 101, enable remote packet capture on radio 1 of the AP and use Wireshark to display the captured packets.
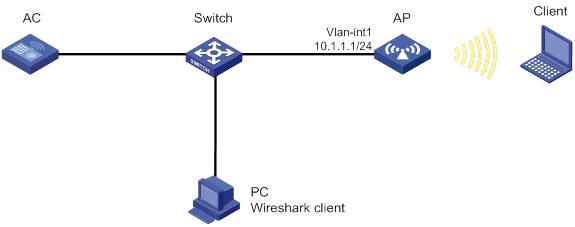
Configuration procedure
1. On the AC, configure remote packet capture on radio 1 of the AP and set the RPCAP service port number to 2014.
<AC> packet-capture remote ap ap1 radio 1 port 2014
2. Display captured packets on the PC:
a. Start Wireshark and select Capture > Options.
b. Select Remote from the Interface list.
c. Enter an IP address of 10.1.1.1 and a port number of 2014, and click OK.
d. Click Start.
The captured packets are displayed on the page that appears.
Figure 102 Displaying the captured packets on the Wireshark
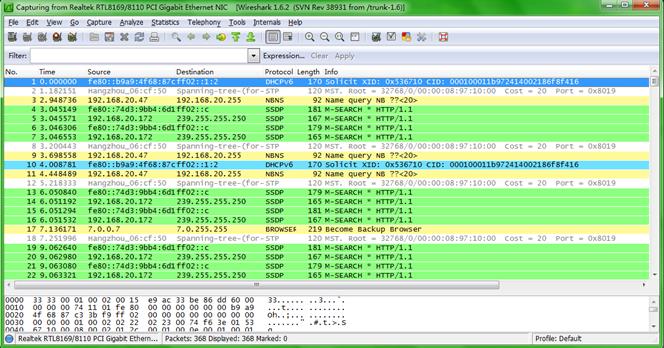
Local packet capture configuration example (on fat APs)
Network requirements
As shown in Figure 103, enable local packet capture on WLAN-Radio 1/0/1 of the AP to capture 1 KB of TCP packets sourced from 192.168.20.173. Use the switch as the FTP server to store packets captured by the AP.
Configuration procedure
1. Configure the switch:
# Create a device management user.
<Switch> system-view
[Switch] local-user abc class manage
# Set the password to 123456 in plain text for the user.
[Switch-luser-abc] password simple 123456
# Assign the user the network-admin user role and specify a working directory for the user.
[Switch-luser-abc] authorization-attribute user-role network-admin work-directory flash:/
# Specify the FTP service type for the user.
[Switch-luser-abc] service-type ftp
[Switch-luser-abc] quit
# Enable the FTP server.
[Switch] ftp server enable
[Switch] quit
2. Configure the AC.
# Configure WLAN-Radio 1/0/1 of the AP to capture 1 KB of TCP packets sourced from 192.168.20.173 and save the captured packets to the abc.pcap file on FTP server 10.1.1.1. Specify the username as abc and the password as 123456.
<AP> packet-capture local interface wlan-radio 1/0/1 autostop filesize 1 capture-filter "src 192.168.20.173 and tcp" write url ftp://10.1.1.1/abc.pcap username abc password simple 123456
Verifying the configuration
# Use the display packet-capture status command to display the capture status. (Details not shown.)
# Connect the Wireshark client to the FTP server and display the captured packets on the PC. (Details not shown.)
Remote packet capture configuration example (on fat APs)
Network requirements
As shown in Figure 104, enable remote packet capture on WLAN-Radio 1/0/1 of the AP and use Wireshark to display the captured packets.
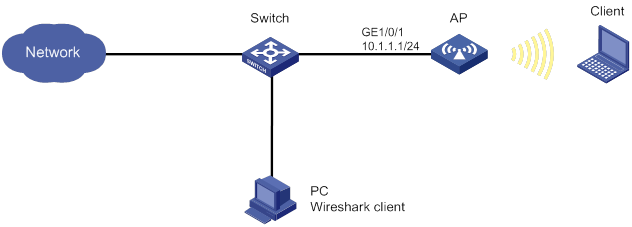
Configuration procedure
1. Configure remote packet capture on WLAN-Radio 0/0/1 of the AP and specify the RPCAP service port number as 2014.
<AP> packet-capture remote interface WLAN-Radio 1/0/1 port 2014
2. Display captured packets on the PC:
a. Start Wireshark and select Capture > Options.
b. Select Remote from the Interface list.
c. Enter an IP address of 10.1.1.1 and a port number of 2014, and click OK.
d. Click Start.
The captured packets are displayed on the page that appears.
Figure 105 Displaying the captured packets on the Wireshark

Feature image-based packet capture configuration example
Network configuration
Configure the device to capture incoming IP packets on Layer 3 interface GigabitEthernet 2/0/1.
Analysis
To capture packets forwarded through chips, first configure a traffic behavior to mirror the traffic to the CPU. To capture packets forwarded by the CPU, enable packet capture directly.
Configuration procedure
# Display the device version information.
<Device> display version
H3C Comware Software, Version 7.1.070, Demo 01
Copyright (c) 2004-2017 New H3C Technologies Co., Ltd. All rights reserved.
H3C MSR3610 uptime is 0 weeks, 0 days, 5 hours, 33 minutes
Last reboot reason : Cold reboot
Boot image: flash:/boot-01.bin
Boot image version: 7.1.070, Demo 01
Compiled Oct 20 2016 16:00:00
System image: flash:/system-01.bin
System image version: 7.1.070, Demo 01
Compiled Oct 20 2016 16:00:00
...
# Prepare a packet capture feature image that is compatible with the current boot and system images. (Details not shown.)
# Download the packet capture feature image to the device. In this example, the image is stored on the TFTP server at 192.168.1.26.
<Device> tftp 192.168.1.26 get packet-capture-01.bin
Press CTRL+C to abort.
% Total % Received % Xferd Average Speed Time Time Time Current
Dload Upload Total Spent Left Speed
100 11.3M 0 11.3M 0 0 155k 0 --:--:-- 0:01:14 --:--:-- 194k
Writing file...Done.
# (Centralized devices.) Install the packet capture feature image on the device and commit the software change.
<Device> install activate feature flash:/packet-capture-01.bin
<Device> install commit
# (Centralized IRF devices.) Install the packet capture feature image on all IRF member devices and commit the software change.
<Device> install activate feature flash:/packet-capture-01.bin slot 1
Verifying the file flash:/packet-capture-01.bin on slot 1....Done.
Identifying the upgrade methods....Done.
Upgrade summary according to following table:
flash:/packet-capture-01.bin
Running Version New Version
None Demo 01
Slot Upgrade Way
1 Service Upgrade
Upgrading software images to compatible versions. Continue? [Y/N]:y
This operation might take several minutes, please wait....................Done.
<Device> install activate feature flash:/packet-capture-01.bin slot 2
Verifying the file flash:/packet-capture-01.bin on slot 2....Done.
Identifying the upgrade methods....Done.
Upgrade summary according to following table:
flash:/packet-capture-01.bin
Running Version New Version
None Demo 01
Slot Upgrade Way
2 Service Upgrade
Upgrading software images to compatible versions. Continue? [Y/N]:y
This operation might take several minutes, please wait....................Done.
<Device> install commit
This operation will take several minutes, please wait.......................Done.
# (Distributed devices in standalone mode.) Install the packet capture feature image on all cards and commit the software change.
<Device> install activate feature flash:/packet-capture-01.bin slot 0
Verifying the file flash:/packet-capture-01.bin on slot 0....Done.
Identifying the upgrade methods....Done.
Upgrade summary according to following table:
flash:/packet-capture-01.bin
Running Version New Version
None Demo 01
Slot Upgrade Way
0 Service Upgrade
Upgrading software images to compatible versions. Continue? [Y/N]:y
This operation might take several minutes, please wait....................Done.
<Device> install activate feature flash:/packet-capture-01.bin slot 1
Verifying the file flash:/packet-capture-01.bin on slot 1....Done.
Identifying the upgrade methods....Done.
Upgrade summary according to following table:
flash:/packet-capture-01.bin
Running Version New Version
None Demo 01
Slot Upgrade Way
1 Service Upgrade
Upgrading software images to compatible versions. Continue? [Y/N]:y
This operation might take several minutes, please wait....................Done.
<Device> install commit
This operation will take several minutes, please wait.......................Done.
# Log out and then log in to the device again to execute the packet-capture command.
# Capture incoming traffic on GigabitEthernet 2/0/1. Set the maximum number of captured packets to 10. Save the captured packets to the flash:/a.pcap file.
<Device> packet-capture interface gigabitethernet 2/0/1 limit-captured-frames 10 write flash:/a.pcap
Capturing on 'GigabitEthernet2/0/1'
10
Verifying the configuration
# Display the contents in the packet file.
<Device> packet-capture read flash:/a.pcap
1 0.000000 192.168.56.1 -> 192.168.56.2 TCP 62 6325 > telnet [SYN] Seq=0 Win=65535 Len=0 MSS=1460 SACK_PERM=1
2 0.000061 192.168.56.1 -> 192.168.56.2 TCP 60 6325 > telnet [ACK] Seq=1 Ack=1 Win=65535 Len=0
3 0.024370 192.168.56.1 -> 192.168.56.2 TELNET 60 Telnet Data ...
4 0.024449 192.168.56.1 -> 192.168.56.2 TELNET 78 Telnet Data ...
5 0.025766 192.168.56.1 -> 192.168.56.2 TELNET 65 Telnet Data ...
6 0.035096 192.168.56.1 -> 192.168.56.2 TELNET 60 Telnet Data ...
7 0.047317 192.168.56.1 -> 192.168.56.2 TCP 60 6325 > telnet [ACK] Seq=42 Ack=434 Win=65102 Len=0
8 0.050994 192.168.56.1 -> 192.168.56.2 TCP 60 6325 > telnet [ACK] Seq=42 Ack=436 Win=65100 Len=0
9 0.052401 192.168.56.1 -> 192.168.56.2 TCP 60 6325 > telnet [ACK] Seq=42 Ack=438 Win=65098 Len=0
10 0.057736 192.168.56.1 -> 192.168.56.2 TCP 60 6325 > telnet [ACK] Seq=42 Ack=440 Win=65096 Len=0
Configuring SmartMC
About SmartMC
Smart Management Center (SmartMC) centrally manages and maintains dispersed network devices at network edges. In a SmartMC network, only one device acts as the TM and the remaining devices all act as TCs. SmartMC provides the following features for you to manage the TCs from the TM:
· Configuration file backup and download.
· Software upgrade.
· Configuration deployment.
· Faulty member replacement.
SmartMC network framework
Figure 106 shows the basic framework of a SmartMC network.
Figure 106 SmartMC network framework
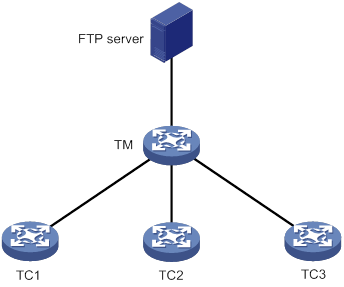
The SmartMC network contains the following elements:
· TM—Topology master, which manages all TCs in the SmartMC network.
· TC—Topology client, which is managed by the TM.
· FTP server—Stores startup software images and configuration files for the TM and TCs.
SmartMC network establishment
Automatic SmartMC network establishment
The TM and TCs use the following procedure to establish a SmartMC network:
1. After SmartMC is enabled, the TM broadcasts a SmartMC packet at an interval of 15 seconds to detect TCs in the network. The SmartMC packet contains information of the TM, such as its bridge MAC address and the IP address of VLAN-interface 1.
2. When a TC receives the packet, it records the TM information, and returns a response packet to the TM. The response packet contains information of the TC, such as its bridge MAC address and the IP address of VLAN-interface 1.
3. When the TM receives the response packet, it initiates a NETCONF session to the TC with the default username admin and the default password admin. The TM then obtains detailed information about the TC through the session, including port information, LLDP neighbor information, STP information, device type, and software version.
4. The TM establishes a connection to the TC for tracking the liveliness of the TC, and adds the TC to the SmartMC network.
5. Based on the LLDP neighbor information obtained from all TCs, the TM forms a SmartMC topology.
After the SmartMC network is established, the TM and TCs check for the existence of each other by exchanging SmartMC packets.
· When a TC receives a SmartMC broadcast packet from the TM, it compares the bridge MAC address in the packet with the recorded bridge MAC address. If the two bridge MAC addresses are the same, the TC returns a response packet to the TM. If the TC does not receive a broadcast packet from the TM within 45 seconds, the TC determines that the TM does not exist in the network anymore. Then, the TC clears the TM information.
· When the TM receives a response packet from a TC, it compares the bridge MAC address in the packet with the recorded bridge MAC address. If the two bridge MAC addresses are the same, the TM determines that the TC still exists in the network. If the TM does not receive a response packet from a TC within 150 seconds, the TM determines that the TC is offline. Then, the TM sets the status of the TC to offline.
Manual SmartMC network establishment
You can log in to the Web interface of the TM, and enter the IP address, username, and password of the TCs to manually add them to the network. The TCs can join the network without exchanging SmartMC packets with the TM.
After the TCs join the SmartMC network, the TM obtains the following information from the TCs to form a SmartMC topology:
· LLDP neighbor information (through NETCONF).
· Hardware information (through SNMP).
SmartMC features
Bulk configuration deployment
The procedure for bulk configuration deployment is as follows:
1. The TM acts as a Telnet client and establishes Telnet connections to the TCs.
2. The TM deploys a batch command line file to the TCs through Telnet connections. The batch command line file is created on the TM and contains command lines to be deployed.
3. The TCs run the command lines in the file.
Configuration file backup
You can use the following methods to back up the next-startup configuration file on the TM and TCs:
· Automatic backup—Enable this feature for the TM and all TCs in the network to immediately perform a backup. After that, the TM and TCs back up the configuration file at a user-specified interval.
· Manual backup—Manually trigger a backup on specified TCs or SmartMC group.
The TM instructs the TCs to back up the next-startup configuration file by unicasting a SmartMC packet to them. When a TC receives the packet, it saves the running configuration to the next-startup configuration file and uploads the file to the FTP server.
Startup software and configuration file upgrade
Before upgrade, you must upload the upgrade files to the FTP server and specify the upgrade files for the TCs from the TM.
The procedure for startup software and configuration file upgrade is as follows:
1. The TM instructs the TCs (or SmartMC group) to download the upgrade files from the FTP server.
2. The TCs download the upgrade files from the FTP server.
3. The TCs upgrade the startup software and configuration file as follows:
? Startup software upgrade—The TCs act as NETCONF clients, establish NETCONF sessions to themselves, and perform ISSU with the upgrade startup software files.
? Configuration file upgrade—The TCs act as Telnet clients, establish Telnet connections to themselves, and run the upgrade configuration file.
Faulty TC replacement
You can use the following methods to replace a faulty TC:
· Automatic replacement—Enables the TM to record the positions of all TCs in the topology for replacement. When the TM discovers that the new TC has physically replaced the faulty TC, it compares the new TC with the faulty one. The TM performs a replacement if the following requirements are met:
? The new TC is deployed at the same topological position as the faulty one.
? The models of the new TC and faulty TC must be the same.
The TM then instructs the new TC to download the configuration file of the faulty TC from the FTP server. After downloading the configuration file, the new TC runs the configuration file to complete the replacement.
· Manual replacement—After the faulty TC is physically replaced, you manually trigger a configuration replacement. The new TC will download the configuration file of the faulty TC from the FTP server and run the file to complete the replacement.
SmartMC configuration task list
To configure SmartMC, perform the following tasks:
|
Tasks at a glance |
Remarks |
|
(Required.) Enabling SmartMC |
Enable SmartMC on both the TM and TCs and perform all subsequent tasks only on the TM. |
|
(Optional.) Setting the FTP server information |
This task is required for configuring automatic configuration file backup, replacing faulty TCs, and upgrading the configuration file on TCs. |
|
(Optional.) Modifying the password of the default user for TCs |
N/A |
|
(Optional.) Creating a SmartMC group |
This task is required for upgrading the startup software and configuration file on TCs and deploying bulk command lines to a SmartMC group. |
|
(Optional.) Deploying bulk command lines |
N/A |
|
(Optional.) Backing up configuration files |
N/A |
|
(Optional.) Upgrading the startup software and configuration file on TCs |
N/A |
|
(Optional.) Managing the network topology |
N/A |
|
(Optional.) Saving the network topology |
N/A |
Prerequisites for SmartMC
Before you configure SmartMC, perform the following tasks on the TM and TCs:
· Enable the Telnet service, and configure scheme authentication for VTY user lines. For information about Telnet service and VTY user lines, see CLI login configuration in Fundamentals Configuration Guide.
· Configure a local user.
? Specify the username and password.
? Specify the Telnet, HTTP, and HTTPS services for the user.
? Set the RBAC role of the local user to network-admin.
For information about local users, see AAA configuration in Security Configuration Guide. For information about user roles, see RBAC configuration in Fundamentals Configuration Guide.
· Enable NETCONF over SOAP over HTTP. For information about NETCONF over SOAP, see NETCONF configuration in Network Management and Monitoring Configuration Guide.
· Enable LLDP globally. For information about LLDP, see Layer 2—LAN Switching Configuration Guide.
· To manage the TM and TCs through a Web interface, you must enable the HTTP and HTTPS services, and set the service type to HTTP and HTTPS for the local user. For information about Web login, HTTP, and HTTPS, see Fundamentals Configuration Guide.
· To manually establish a SmartMC network, you must configure the snmp-agent community read public and snmp-agent sys-info version all commands on the TCs. For information about SNMP, see Network Management and Monitoring Configuration Guide.
Enabling SmartMC
Restrictions and guidelines
A SmartMC network must have one and only one TM.
Perform this task on both the TM and TCs and perform all subsequent tasks only on the TM.
If you change the role of the TM to TC or disable SmartMC on the TM, all SmartMC settings in its running configuration will be cleared.
For manual SmartMC network establishment, the TM preferentially uses the user-specified username and password. If no username and password are specified, the TM uses the default username admin and password admin.
Configuration procedure
|
Step |
Command |
Remarks |
|
1. Enter system view. |
system-view |
N/A |
|
2. Enable SmartMC and set the device role. |
smartmc { tm [ username username password { cipher | simple } string ] | tc } enable |
By default, SmartMC is disabled. |
Setting the FTP server information
About files stored on the FTP server
In a SmartMC network, an FTP server is used to store the following files:
· Upgrade startup software files and upgrade configuration file for TCs.
· Backup configuration files of the TM and TCs.
Restrictions and guidelines
You can use the following methods to specify an FTP server:
· Specify the IP address of an FTP server.
· Specify the IP address of the TM. The TM will act as an FTP server.
To configure the TM to act as an FTP server, make sure the TM has enough storage space for storing the files required by TCs. For information about FTP, see Fundamentals Configuration Guide.
Configuration procedure
|
Step |
Command |
Remarks |
|
1. Enter system view. |
system-view |
N/A |
|
2. Set the FTP server information. |
smartmc ftp-server server-address username username password { cipher | simple } string |
By default, no FTP server information is set. |
Modifying the password of the default user for TCs
About modifying the password of the default user for TCs
During SmartMC network establishment, the TM establishes NETCONF sessions to TCs and adds them to the network. The default username and password on the TCs for NETCONF session establishment are admin and admin. To enhance security, you can perform this task to change the password for the default user admin of the TCs after the TM adds the TCs to the network.
Restrictions and guidelines
Do not modify the password for TCs that are manually added to the SmartMC network. If you modify the password for a manually added TC, you will not be able to manage that TC from the TM.
You can use the display smartmc tc verbose command to identify the method that is used to add the TCs.
Configuration procedure
|
Step |
Command |
|
1. Enter system view. |
system-view |
|
2. Modify the password of the default user for TCs. |
smartmc tc password string |
Creating a SmartMC group
About SmartMC groups
This feature allows you to create a SmartMC group on the TM and add TCs to the group. When you perform the following operations, you can specify a SmartMC group to apply the operations to all TCs in the group:
· Startup software upgrade.
· Configuration file upgrade.
· Configuration deployment.
Restrictions and guidelines
If the device type of the TCs is not predefined on the TM, you must manually add the device type to the TM. This enables TCs of an undefined type to join a SmartMC group created on the TM. The device types added to the TM cannot be the same as the predefined types on the TM. To view the predefined device types on the TM, use the match device-type ? command.
Configuration procedure
|
Step |
Command |
Remarks |
|
1. Enter system view. |
system-view |
N/A |
|
2. (Optional.) Add a device type to the TM. |
smartmc tc sysoid sysoid device-type device-type |
To obtain the SYSOID of a TC, execute the display smartmc tc verbose command. |
|
3. Create a SmartMC group and enter its view. |
smartmc group group-name |
N/A |
|
4. Set a match criterion. |
match { device-type device-type | ip-address ip-address { ip-mask-length | ip-mask } | mac-address mac-address mac-mask-length } |
By default, no match criterion is set. |
Deploying bulk command lines
|
Step |
Command |
Remarks |
|
1. Create a batch command line file and edit the command lines to be deployed to TCs. |
create batch-file cmd-filename |
Execute this command in user view. Each command occupies a line in the batch command line file. When you finish editing, enter a percent sign (%) to return to user view. Make sure the command lines that you enter are correct because the system does not verify whether the command lines are correct. |
|
2. Enter system view. |
system-view |
N/A |
|
3. Deploy the batch command line file to a list of TCs or SmartMC groups. |
smartmc batch-file cmd-filename deploy { group group-name-list | tc tc-id-list } |
N/A |
Backing up configuration files
Restrictions and guidelines
Configuration files backed up to the FTP server by automatic configuration file backup are named in the format of device bridge MAC address_backup.cfg.
When you change the TM in the SmartMC network, make sure the backup configuration file of the original TM on the FTP server is deleted. If the file still exists, the new TM might download the file and run the settings. This will cause a conflict in the network.
Configuration procedure
|
Step |
Command |
Remarks |
|
1. Enter system view. |
system-view |
N/A |
|
2. Set the maximum number of TCs that can perform configuration file backup at the same time. |
smartmc backup configuration max-number max-number |
N/A |
|
3. Back up configuration files. |
·
Enable automatic configuration file
backup and set the backup interval: ·
Manually back up the configuration file on
TCs: |
By default, automatic configuration file backup is disabled. |
Upgrading the startup software and configuration file on TCs
About upgrading the startup software and configuration file on TCs
You can use the following methods to upgrade the startup software and configuration file on TCs:
· Schedule an upgrade by specifying an upgrade time or upgrade delay.
· Upgrade immediately by not specifying an upgrade time or upgrade delay.
Restrictions and guidelines for startup software and configuration file upgrade
A TC can perform only one upgrade task at a time.
Upgrading the startup software and configuration file on TCs
Upgrading the startup software and configuration file in one step
|
Step |
Command |
|
1. Enter system view. |
system-view |
|
2. Upgrade the startup software on TCs in one step. |
smartmc upgrade boot-loader tc { tc-id-list { boot boot-filename system system-filename | file ipe-filename } }&<1-40> [ delay delay-time | time in-time ] |
|
3. Upgrade the configuration file on TCs in one step. |
smartmc upgrade startup-configuration tc { tc-id-list cfg-filename }&<1-40> [ delay delay-time | time in-time ] |
Configuring startup software and configuration file upgrade step by step
|
Step |
Command |
|
1. Enter system view. |
system-view |
|
2. Configure startup software upgrade for TCs step by step: |
a
Specify the upgrade startup software
files: b
Upgrade the startup software on TCs: |
|
3. Configure configuration file upgrade for TCs step by step: |
a
Specify the upgrade configuration
file: b
Upgrade the configuration file on TCs: |
Upgrading the startup software and configuration file on all TCs in SmartMC groups
Upgrading the startup software and configuration file in one step
|
Step |
Command |
|
1. Enter system view. |
system-view |
|
2. Upgrade the startup software on all TCs in SmartMC groups in one step. |
smartmc upgrade boot-loader group { group-name-list [ boot boot-filename system system-filename | file ipe-filename ] }&<1-40> [ delay minutes | time in-time ] |
|
3. Upgrade the configuration file on all TCs in SmartMC groups in one step. |
smartmc upgrade startup-configuration group { group-name-list cfg-filename }&<1-40> [ delay minutes | time in-time ] |
Configuring startup software and configuration file upgrade step by step
|
Step |
Command |
Remarks |
|
1. Enter system view. |
system-view |
N/A |
|
2. Enter SmartMC group view. |
smartmc group group-name |
N/A |
|
3. Specify the upgrade startup software files for the SmartMC group. |
boot-loader file { ipe-filename | boot boot-filename system system-filename } |
By default, no upgrade startup software files are specified for a SmartMC group. |
|
4. Specify the upgrade configuration file for the SmartMC group. |
startup-configuration cfgfile |
By default, no upgrade configuration file is specified for a SmartMC group. |
|
5. Return to system view. |
quit |
N/A |
|
6. Upgrade the startup software and configuration file on all TCs in the SmartMC group. |
·
Upgrade the startup software: ·
Upgrade the configuration file: |
N/A |
Managing the network topology
Refreshing the network topology
About refreshing the network topology
You can use the following methods to refresh the network topology:
· Automatic topology refresh—Specify the refresh interval to allow the TM to refresh the network topology periodically.
· Manual topology refresh—Execute the smartmc topology-refresh command to manually refresh the network topology.
Restrictions and guidelines
The topology refresh time depends on the number of TCs in the network.
Configuration procedure
To manually refresh the network topology, execute the smartmc topology-refresh command in any view.
To configure automatic network topology refresh:
|
Step |
Command |
Remarks |
|
1. Enter system view. |
system-view |
N/A |
|
2. Set the automatic topology refresh interval. |
smartmc topology-refresh interval interval |
By default, the automatic topology refresh interval is 60 seconds. |
Saving the network topology
About saving the network topology
This task allows you to save the current network topology to the topology.dba file in the flash memory. After the TM reboots, it uses the topology.dba file to restore the network topology.
Configuration procedure
|
Step |
Command |
|
1. Enter system view. |
system-view |
|
2. Save the network topology. |
smartmc topology-save |
Replacing faulty TCs
Restrictions and guidelines
Make sure the new TC for replacement and the faulty TC have the same neighbor relationship, model, and IRF member ID.
Prerequisites
Before you replace a faulty TC, perform the following tasks:
1. Install the new TC at the location where the faulty TC was installed.
2. Connect all cables to the new TC.
Configuration procedure
|
Step |
Command |
Remarks |
|
1. Enter system view. |
system-view |
N/A |
|
2. Replace faulty TCs. |
·
Enable automatic faulty TC replacement: ·
Manually replace a faulty TC: |
By default, automatic faulty TC replacement is disabled. |
Displaying and maintaining SmartMC
Execute display commands in any view.
|
Task |
Command |
|
Display the configuration file backup status on TCs. |
display smartmc backup configuration status |
|
Display the batch command line file execution results. |
display smartmc batch-file status [ last number ] |
|
Display SmartMC configuration. |
display smartmc configuration |
|
Display connections between the devices in the SmartMC network. |
display smartmc device-link |
|
Display SmartMC group information. |
display smartmc group [ group-name ] [ verbose ] |
|
Display the faulty TC replacement status. |
display smartmc replace status |
|
Display TC information. |
display smartmc tc [ tc-id ] [ verbose ] |
|
Display TC upgrade status. |
display smartmc upgrade status |
SmartMC configuration examples
Network requirements
As shown in Figure 107, TC 1, TC 2, and TC 3 belong to the same device type: S5560-EI series. The IP address of the FTP server is 192.168.2.1. The FTP username is admin and the FTP password is admin.
Perform the following tasks to establish a SmartMC network and upgrade the configuration file on the TCs:
1. Configure the TM and TCs to automatically establish a SmartMC network.
2. Create a SmartMC group and add the TCs to the group.
3. Upgrade the configuration file on all TCs in the SmartMC group.
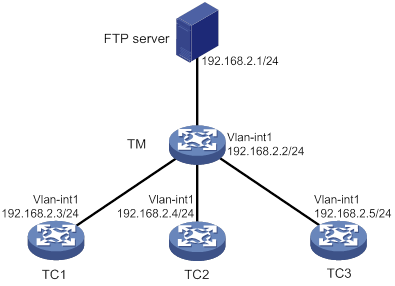
Configuration procedure
1. Configure TC 1:
# Configure VLAN-interface 1.
<TC1> system-view
[TC1] interface vlan-interface 1
[TC1-Vlan-interface1] ip address 192.168.2.3 24
# Enable the Telnet service on TC 1.
[TC1] telnet server enable
# Enable NETCONF over SOAP over HTTP.
[TC1] netconf soap http enable
Enable LLDP globally.
[TC1] lldp global enable
# Create a local user, and specify the username, password, service types, and RBAC role as admin, admin, Telnet, HTTP, and HTTPS, and network-admin, respectively.
[TC1] local-user admin
[TC1-luser-manage-admin] password simple admin
[TC1-luser-manage-admin] service-type telnet http https
[TC1-luser-manage-admin] authorization-attribute user-role network-admin
[TC1-luser-manage-admin] quit
# Set scheme authentication for VTY user lines 0 to 63.
[TC1] line vty 0 63
[TC1-line-vty0-63] authentication-mode scheme
[TC1-line-vty0-63] quit
# Enable SmartMC and set the device role to TC.
[TC1] smartmc tc enable
2. Configure TC 2 and TC 3 in the same way TC 1 is configured. (Details not shown.)
3. Configure the TM:
# Configure VLAN-interface 1.
<TM> system-view
[TM] interface vlan-interface 1
[TM-Vlan-interface1] ip address 192.168.2.2 24
[TM-Vlan-interface1] quit
# Enable the Telnet service.
[TM] telnet server enable
# Enable NETCONF over SOAP over HTTP.
[TM] netconf soap http enable
# Enable LLDP globally.
[TM] lldp global enable
# Create a local user, and specify the username, password, service types, and RBAC role as admin, admin, Telnet, HTTP, and HTTPS, and network-admin, respectively.
[TM] local-user admin
[TM-luser-manage-admin] password simple admin
[TM-luser-manage-admin] service-type telnet http https
[TM-luser-manage-admin] authorization-attribute user-role network-admin
[TM-luser-manage-admin] quit
# Set scheme authentication for VTY user lines 0 to 63.
[TM] line vty 0 63
[TM-line-vty0-63] authentication-mode scheme
[TM-line-vty0-63] quit
# Enable SmartMC and set the device role to TM.
[TM] smartmc tm enable
# Set the FTP server IP address, username, and plaintext password to 192.168.2.1, admin, and admin, respectively.
[TM] smartmc ftp-server 192.168.2.1 username admin password simple admin
# Create SmartMC group S1 and enter its view.
[TM] smartmc group S1
# Create a device type match criterion to add all TCs to SmartMC group S1.
[TM-smartmc-group-S1] match device-type s5560-ei
# Specify the upgrade configuration file startup.cfg for SmartMC group S1.
[TM-smartmc-group-S1] startup-configuration startup.cfg
[TM-smartmc-group-S1] quit
# Upgrade the configuration file on all TCs in SmartMC group S1.
[TM] smartmc upgrade startup-configuration group s1 startup.cfg
Verifying the configuration
# Display brief information about all TCs after the SmartMC network is established.
[TM] display smartmc tc
TCID DeviceType IpAddress MacAddress Status Version Sysname
1 S5560-EI 192.168.2.3 201c-e7c3-0300 Normal R1308 H3C
2 S5560-EI 192.168.2.4 201c-e7c3-0301 Normal R1308 H3C
3 S5560-EI 192.168.2.5 201c-e7c3-0302 Normal R1308 H3C
# Display the configuration file upgrade status on the TCs.
<TM> display smartmc upgrade status
ID IpAddress MacAddress Status UpdateTime UpdateFile
1 192.168.2.3 201c-e7c3-0300 Finished Immediately startup.cfg
2 192.168.2.4 201c-e7c3-0301 Finished Immediately startup.cfg
3 192.168.2.5 201c-e7c3-0302 Finished Immediately startup.cfg
About flow log,313
About SmartMC,345
Appendix A Supported NETCONF operations,191
Applying a QoS policy,251
Backing up configuration files,351
Command and hardware compatibility,259
Command and hardware compatibility,275
Command and hardware compatibility,222
Command and hardware compatibility,298
Command and hardware compatibility,233
Compatibility information,99
Compatibility information,242
Configuration prerequisites,316
Configuration restrictions and guidelines,95
Configuration restrictions and guidelines,61
Configuration task list,203
Configuration task list,61
Configuration task list,95
Configuring a monitor policy,223
Configuring a QoS policy,251
Configuring a traffic behavior,251
Configuring a traffic class,251
Configuring a trigger,140
Configuring a user-defined EAA environment variable,223
Configuring access control rights,65
Configuring ACS attributes,204
Configuring an event,139
Configuring attributes of the IPv6 NetStream data export,278
Configuring attributes of the NetStream data export,262
Configuring counter sampling,290
Configuring CPE attributes,206
Configuring Event MIB object lists,138
Configuring Event MIB sampling,138
Configuring flow log host groups,319
Configuring flow sampling,290
Configuring IPv6 NetStream filtering,277
Configuring IPv6 NetStream flow aging,280
Configuring IPv6 NetStream sampling,277
Configuring local packet capture (on ACs),332
Configuring local packet capture (on fat APs),332
Configuring local packet capture (on wired devices),332
Configuring local port mirroring,246
Configuring NETCONF over SOAP,157
Configuring NETCONF to use module-specific namespaces,158
Configuring NetStream filtering,261
Configuring NetStream flow aging,264
Configuring NetStream sampling,261
Configuring NQA operations on the NQA client,11
Configuring NTP association mode,62
Configuring NTP authentication,65
Configuring NTP optional parameters,71
Configuring PD detection,102
Configuring PoE monitoring,106
Configuring PoE power management,104
Configuring remote packet capture (on ACs),334
Configuring remote packet capture (on fat APs),335
Configuring remote packet capture (on wired devices),333
Configuring SNMP basic parameters,113
Configuring SNMP logging,117
Configuring SNMP notifications,118
Configuring SNTP authentication,96
Configuring the flow log version,317
Configuring the IPv6 NetStream data export,281
Configuring the local clock as a reference source,73
Configuring the maximum size of the trace log file,306
Configuring the NetStream data export,265
Configuring the NQA server,10
Configuring the PoE power,103
Configuring the RMON alarm function,129
Configuring the RMON statistics function,128
Configuring the sFlow agent and sFlow collector information,289
Configuring the timestamp of flow log entries,318
Creating a sampler,243
Creating a SmartMC group,350
CWMP configuration example,209
Deploying bulk command lines,350
Disabling an interface from generating link up or link down logs,308
Displaying and maintaining a sampler,243
Displaying and maintaining CWMP,209
Displaying and maintaining EAA settings,227
Displaying and maintaining flow log,320
Displaying and maintaining information center,308
Displaying and maintaining IPv6 NetStream,282
Displaying and maintaining NETCONF,190
Displaying and maintaining NetStream,266
Displaying and maintaining NQA,31
Displaying and maintaining NTP,74
Displaying and maintaining packet capture,336
Displaying and maintaining PoE,108
Displaying and maintaining port mirroring,248
Displaying and maintaining processes,233
Displaying and maintaining RMON settings,130
Displaying and maintaining sFlow,291
Displaying and maintaining SmartMC,354
Displaying and maintaining SNTP,97
Displaying and maintaining the Event MIB,144
Displaying and maintaining user processes,234
Displaying the contents in a packet file (on wired devices),336
Displaying the SNMP settings,120
EAA configuration examples,227
Enabling CWMP from the CLI,204
Enabling duplicate log suppression,307
Enabling IPv6 NetStream for outgoing IPsec packets before IPsec encapsulation,277
Enabling IPv6 NetStream on an interface,276
Enabling load balancing for flow log entries,318
Enabling NETCONF logging,158
Enabling NETCONF over SSH,157
Enabling NetStream for outgoing packets before IPsec encapsulation,261
Enabling NetStream on an interface,260
Enabling PoE,100
Enabling SmartMC,348
Enabling SNMP notifications for Event MIB,143
Enabling SNMP notifications for system logs,308
Enabling synchronous information output,307
Enabling the NQA client,11
Enabling the NTP service,62
Enabling the SNTP service,95
Establishing a NETCONF session,159
Event MIB configuration examples,144
Event MIB configuration task list,138
Feature and hardware compatibility,288
Feature and hardware compatibility,128
Feature and hardware compatibility,250
Feature and hardware compatibility,246
Feature and hardware compatibility,316
Filtering data,180
FIPS compliance,112
FIPS compliance,156
FIPS compliance,299
Flow log configuration examples,320
Flow log configuration task list,316
Flow mirroring configuration example,252
Flow mirroring configuration task list,250
Information center configuration examples,309
Information center configuration task list,299
IPv6 NetStream configuration examples,283
IPv6 NetStream configuration task list,275
Local port mirroring configuration example,248
Locking/unlocking the configuration,163
Managing security logs,303
Managing the network topology,353
Modifying the password of the default user for TCs,349
Monitoring kernel threads,237
NETCONF configuration task list,156
NetStream configuration examples,267
NetStream configuration task list,259
NQA configuration examples,31
NQA configuration task list,10
NTP configuration examples,74
Outputting logs to log hosts,301
Outputting logs to the console,299
Outputting logs to the log buffer,302
Outputting logs to the monitor terminal,300
Overview,272
Overview,200
Overview,56
Overview,245
Overview,255
Overview,324
Overview,233
Overview,294
Overview,219
Overview,8
Overview,242
Overview,126
Overview,111
Overview,136
Overview,153
Overview,99
Packet capture configuration examples,337
Packet capture configuration task list,331
Performing CLI operations through NETCONF,186
Performing service operations,165
Ping,1
PoE configuration example,108
PoE configuration task list,100
Prerequisites,138
Prerequisites for SmartMC,348
Protocols and standards,288
Replacing faulty TCs,354
Retrieving NETCONF session information,187
Returning to the CLI,190
RMON configuration examples,131
Sampler configuration example,243
Saving diagnostic logs to the diagnostic log file,305
Saving logs to the log file,302
Saving, rolling back, and loading the configuration,173
Setting the FTP server information,349
Setting the minimum storage period for log files and logs in the log buffer,306
sFlow configuration example,291
sFlow configuration task list,289
SmartMC configuration examples,355
SmartMC configuration task list,347
SNMPv1/SNMPv2c configuration example,121
SNMPv3 configuration example,122
SNTP configuration example,97
Specifying a flow log export destination,317
Specifying a source IP address for flow log packets,318
Specifying an NTP server for the device,95
Starting or stopping a third-party process,237
Subscribing to event notifications,161
Suspending monitor policies,227
System debugging,6
Terminating another NETCONF session,189
Tracert,3
Troubleshooting PoE,110
Troubleshooting sFlow configuration,292
Upgrading PSE firmware in service,107
Upgrading the startup software and configuration file on TCs,351