- Table of Contents
- Related Documents
-
| Title | Size | Download |
|---|---|---|
| 01-Text | 2.94 MB |
Contents
User Security Policy functions
Desktop Asset Management functions
Security level and security mode
Security check for smart devices
Security level, security mode, and device action
Desktop asset management procedure
Desktop asset registration and approval
Decentralized management of IMC functions
Decentralized management by operator and service groups
Configuring the security check for PCs
Viewing the security policy list
Viewing security policy details
Making a security level action take effect
Viewing the security level list
Viewing security level details
URL control policy list contents
Viewing the URL control policy list
Viewing the URL control policy details
Modifying a URL control policy
Domain URL group list contents
Viewing the domain URL group list
Viewing the domain URL group details
Configuring a domain URL group
Viewing the IP URL group details
Managing anti-virus software policies
Anti-virus software policy list contents
Anti-virus software policy details
Viewing the anti-virus software policy list
Viewing anti-virus software policy details
Adding an anti-virus software policy
Modifying an anti-virus software policy
Deleting an anti-virus software policy
Managing anti-spyware software policies
Anti-spyware software policy list contents
Anti-spyware software policy details
Viewing the anti-spyware software policy list
Viewing anti-spyware software policy details
Adding an anti-spyware software policy
Modifying an anti-spyware policy
Deleting an anti-spyware software policy
Managing firewall software policies
Firewall software policy list contents
Firewall software policy details
Viewing the firewall software policy list
Viewing firewall software policy details
Adding a firewall software policy
Modifying a firewall software policy
Deleting a firewall software policy
Managing anti-phishing software policies
Anti-phishing software policy list contents
Anti-phishing software policy details
Viewing the anti-phishing software policy list
Viewing anti-phishing software policy details
Adding an anti-phishing software policy
Modifying an anti-phishing software policy
Deleting an anti-phishing software policy
Managing hard disk encryption software policies
Hard disk encryption software policy list contents
Hard disk encryption software policy details
Viewing the hard disk encryption software policy list
Viewing hard disk encryption software policy details
Adding a hard disk encryption software policy
Modifying a hard disk encryption software policy
Deleting a hard disk encryption software policy
Managing PC software control groups
PC software control group list contents
Viewing the PC software control group list
Querying PC software control groups
Deleting a PC software control group
Managing software-type PC software control groups
Managing process-type PC software control groups
Managing service-type PC software control groups
Managing file-type PC software control groups
Configuring patch software management
Windows patch information details
Applicable Windows version list
Viewing the Windows patch list
Managing registry control policies
Registry control list contents
Viewing the registry control list
Viewing the share control list
Viewing the traffic control list
Viewing traffic control details
Modifying the password dictionary
Modifying the local password policy
Performing security check by using security policies
Configuring real-time monitoring
Configuring the default security policy for roaming users
Configuring Internet access control
Internet access control methods
Audit of unauthenticated Internet access
Audit of authenticated Internet access
Internet access logging parameters
Managing Internet access policies
Viewing the Internet access policy list
Viewing Internet access policy details
Adding an Internet access policy
Modifying an Internet access policy
Deleting an Internet access policy
Managing Internet access audit policies
Viewing the Internet access audit policy list
Viewing Internet access audit policy details
Adding an Internet access audit policy
Modifying an Internet access audit policy
Deleting an Internet access audit policy
Managing Internet access audit logs
Viewing the online audit log list
Viewing online audit log details
Viewing the offline audit log list
Configuring Internet access logging parameters
Applying Internet access policies
Configuring the default Internet access policy for an access service
Assigning an Internet access policy to an access scenario
Configuring the security check for smart devices
Configuring MDM vendor settings
Manually validating MDM vendor settings
Viewing the security policy list
Viewing security policy details
Viewing the security level list
Viewing security level details
Managing MDM collaboration policies
MDM collaboration policy list contents
MDM collaboration policy details
Viewing the MDM collaboration policy list
Viewing MDM collaboration policy details
Adding an MDM collaboration policy
Modifying an MDM collaboration policy
Deleting an MDM collaboration policy
Managing hierarchical EAD networks
Configuring the policy management mode
Managing nodes in a hierarchical EAD network
Modifying the name of the current node
Deploying services, security policies, and service parameters
Specifying the services to be deployed to a child node
Scheduling automatic deployment tasks
Manually deploying configurations to a child node
Managing the deployment and receipt history
Deployment history list contents
Viewing the deployment history list
Viewing the receipt history list
Querying the deployment history to a child node
Querying the receipt history of the current node
Managing the EAD node topology
Accessing the EAD node topology
Adding a node to the EAD node topology
Uploading a background picture
Using an existing picture as the background picture
Granting an operator privileges to manage asset groups
Viewing the asset verification list
Asset export function asset list
Asset export history list contents
Viewing the asset export history
Downloading the asset export history record
Deleting the asset export history record
Collecting statistics by asset type
Collecting statistics by hard disk
Collecting statistics by operating system
Collecting statistics by software installed
Viewing the export task management list
Configuring desktop control schemes and policies
Configuring desktop control schemes
Desktop control scheme list contents
Desktop control scheme details
Viewing the desktop control scheme list
Viewing desktop control scheme details
Adding a desktop control scheme
Modifying a desktop control scheme
Deleting a desktop control scheme
Configuring peripheral policies
Peripheral policy list contents
Viewing the peripheral policy list
Viewing peripheral policy details
Configuring energy-saving policies
Energy-saving policy list contents
Viewing the energy-saving policy list
Adding an energy-saving policy
Modifying an energy-saving policy
Deleting an energy-saving policy
Configuring monitoring alarm policies
Monitoring alarm policy list contents
Monitoring alarm policy details
Viewing the monitoring alarm policy list
Viewing monitoring alarm policy details
Adding a monitoring alarm policy
Modifying a monitoring alarm policy
Deleting a monitoring alarm policy
Asset hardware change record audit
Asset hardware change information list contents
Asset hardware change record details
Viewing the asset hardware change information list
Viewing asset hardware change record details
Querying asset hardware change records
Asset software change record audit
Asset software change information list contents
Asset software change record details
Viewing the asset software change record list
Viewing the asset software change record details
Querying the asset software change records
USB file transfer log list contents
Viewing the USB file transfer log list
Viewing the USB file transfer log details
Querying the USB file transfer logs
Exporting USB file transfer logs
Viewing the USB file transfer log export history
Viewing the printer use log list
Viewing the printer use log details
Exporting the printer use logs
Viewing the export history of the printer use logs
Printer use logs export history list contents
Unauthorized peripheral use record audit
Unauthorized peripheral use list contents
Unauthorized peripheral use log export history list contents
Viewing the unauthorized peripheral use record list
Viewing the export history of unauthorized peripheral use records
Querying the unauthorized peripheral use records
Exporting the unauthorized peripheral use records
Asset file check list contents
Viewing the terminal file audit task list
Querying terminal file audit tasks
Viewing the terminal file audit results
Exporting the terminal file audit results
Configuring software deployment
Preparing to use the software deployment function
Configuring software deployment server settings
Software server settings list contents
Software deployment server settings details
Viewing the software deployment server settings list
Viewing software deployment server settings details
Adding software deployment server settings
Modifying software deployment server settings
Deleting software deployment server settings
Configuring software deploy tasks
Software deploy task list contents
Viewing the software deploy task list
Viewing software deploy task details
Querying software deploy tasks
Modifying a software deploy task
Deleting software deploy tasks
Viewing client driver errors in the iNode Driver list
Security status audit for local and roaming online users
Local online user list contents
Roaming online user list contents
Viewing the local online user list
Viewing the roaming online user list
Customizing the local online user list
Performing a computer security check
Computer security check result details
Performing a computer security check
All-node online users 24-hour trend graph
Insecurity category statistic report
Multi-node user data statistics report
Online user security status report
Safe log gather statistic report
Single-node online users 24-hour trend graph
Single-node security check failure report
Insecurity category statistic report
Online user security status report
Safe log gather statistic report
Configuring service parameters
User security policy service parameters
Configuring EAD service parameters
Validating EAD service parameters
Configuring DAM service parameters
Validating DAM service parameters
Overview
As an IMC service component, EAD Security Policy (referred to as EAD) works with the IMC UAM component to provide endpoint security checking and asset management. It plays an essential role in both the EAD solution and BYOD solution.
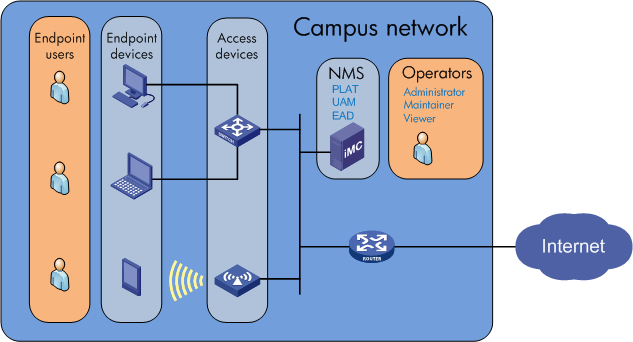
As shown in Figure 1, a network deployed with IMC EAD typically has the following elements:
· Access device—Access layer device that works with UAM to provide network access to endpoint users. Typically, switches with high port density serve as access devices in wired networks, and access controllers are used as access devices in wireless networks.
· Desktop asset—Windows PC managed as a desktop asset in EAD. Desktop asset management helps monitor the assets' operating status and usage information.
· EAD server—Server deployed with IMC EAD to provide security checking and asset management for endpoint devices.
· End user—User who accesses the network from an endpoint device by using an access user account stored in UAM.
· Endpoint device—Devices used by end user for network access. IMC classifies user endpoints into PCs and smart devices. PCs include desktop and laptop computers. Smart devices include mobile phones and tablets.
· IMC operator—Depending on the assigned administrative privileges, IMC classifies operators as administrators, maintainers, and viewers.
· UAM server—Server deployed with IMC UAM to provide authentication, authorization, and accounting services for endpoint users.
Figure 1 Elements involved in a network deployed with EAD
EAD functions
EAD consists of the User Security Policy service module and the Desktop Asset Management (DAM) service module.
User Security Policy functions
The User Security Policy module:
· Provides endpoint security and audit functions.
· Determines access user's security status by performing pre-configured checks on the user endpoint.
· Provides ability to take proactive actions on insecure users such as isolating, monitoring, and kicking out the users.
Table 1 lists the functionality provided by the User Security Policy module.
Table 1 User Security Policy module functions
|
Function |
Description |
|
Security policy management |
Provides the ability to customize security policies. |
|
Internet access control |
Provides the ability to configure the Internet access audit function and Internet access control policies. |
|
Hierarchical access service and security policy management |
Provides hierarchical management of access services and security policies, as well as the EAD global network monitoring function. |
|
Security audit |
Provides the ability to audit security check results. |
|
Security policy service report |
Provides the ability to generate reports based on security check results. |
|
Security policy service parameter configuration |
Provides the ability to configure security policy service parameters. |
Desktop Asset Management functions
DAM manages computers running a Windows operating system as assets. DAM centrally manages software and hardware of assets, controls and audits the assets' usage, and deploys other software products to assets.
Table 2 lists the functionality provided by the DAM module.
Table 2 DAM service module functions
|
Function |
Description |
|
Desktop asset management |
Provides the ability to collect asset information for audit. |
|
Desktop control |
Provides various functions to control the software and hardware of assets. |
|
Asset audit |
Provides various functions to verify assets. |
|
Software deployment |
Provides the ability to deploy software to assets. |
|
DAM service report |
Provides the ability to generate reports based on asset usage statistics. |
|
DAM service parameter configuration |
Provides the ability to configure DAM service parameters. |
EAD solution
The EAD solution enforces enterprise security policies on endpoint users to control network access, monitor network behavior, and build proactive defense capability. The solution requires cooperation of the iNode client, security policy server, network access device, and third-party software.
The EAD solution adopts a client-server model.
It includes IMC UAM on the server side and the iNode client on the client side.
· iNode client—Receives security policies and control schemes from the EAD server, performs security checking on the user endpoint, and reports the check results to the server.
· EAD server—Controls the user's network access based on the check results and collects information for audit.
EAD in the BYOD solution
The BYOD solution provides the technologies needed to bring mobile devices onboard (personal or company provided), and to consistently enforce access policies to safeguard the security for the network. It also provides device-specific monitoring, auditing, and reporting functions.
In the BYOD solution, EAD works with a third-party MDM server to manage mobile devices. The device management functions are implemented through APIs provided by the MDM server. All mobile devices are managed by the MDM server through the MDM client running on them.
Quick start guide
The following information guides you quickly through the main functions of the EAD component.
Accessing EAD
IMC provides the following EAD access modes:
· Classic—Log in to the classic IMC interface. Operators access EAD functions through the navigation menu. It is the default access mode.
· Desktop—Log in to the Web desktop. Operators add EAD functions to the Web desktop as applications and click the application icons to use EAD functions.
Operators can select the access mode on the IMC login page or on the upper right of an IMC operation page. This guide describes EAD functions in classic mode.
Classic mode
In classic mode, operators access EAD functions through the navigation menu. EAD provides a breadcrumb navigation menu and a navigation tree, which have the same navigation menu options.
· Breadcrumb navigation menu—Point to a menu option to display the submenu.
· Navigation tree—Click a menu option to display the submenu.
Unless otherwise stated, operation procedures in this guide use the navigation tree.
Breadcrumb navigation menu
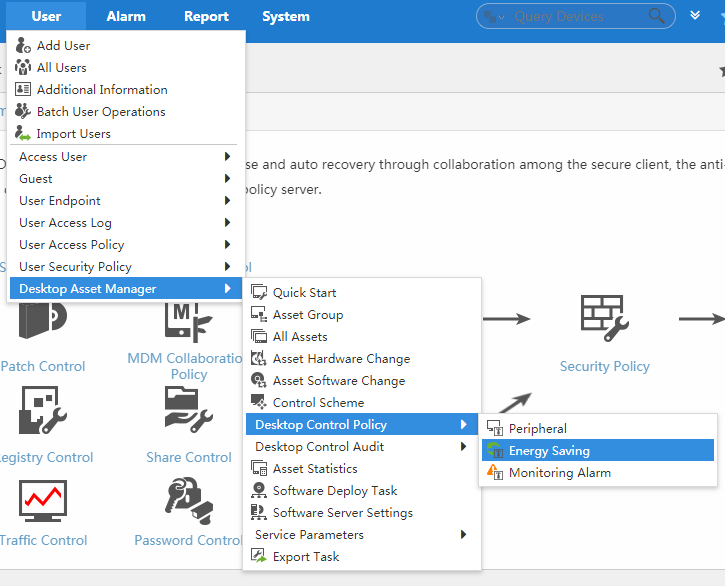
EAD has separate breadcrumb navigation menus for User Security Policy and DAM as shown in Figure 2 and Figure 3. Each breadcrumb navigation menu has three levels.
Figure 2 Breadcrumb navigation menu of User Security Policy
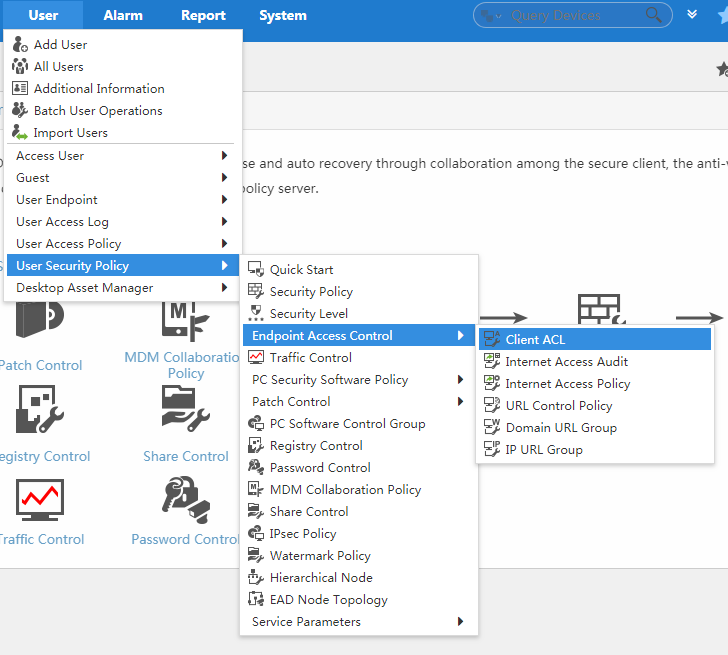
Figure 3 DAM breadcrumb navigation menu
EAD navigation tree
EAD has separate navigation trees for the User Security Policy and DAM modules as shown in Figure 4.
To expand the navigation menu:
1. Click the User tab.
2. From the navigation tree, click User Security Policy or Desktop Asset Manager.
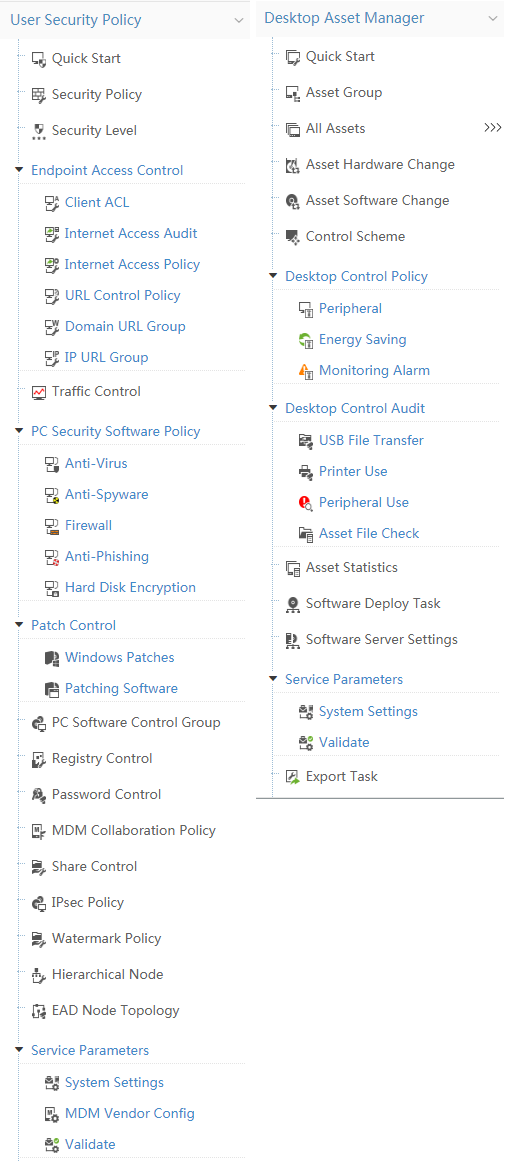
The EAD and DAM navigation menu options are shown in Table 3.and in Table 4.
Table 3 Navigation menu options of the User Security Policy module
|
Task |
|
|
Quick Start |
View the general operation process for the User Security Policy module and links to configuration tasks. |
|
Security Policy |
View, add, modify, and delete security policies. |
|
Security Level |
View, add, modify, and delete security levels. |
|
Endpoint Access Control |
Navigate to the following endpoint access control pages: · Client ACL—View, add, modify, and delete ACLs that are deployed to the iNode client. · Internet Access Audit—View, add, modify, and delete policies for auditing Internet access behavior. · Internet Access Policy—View, add, modify, and delete Internet access policies. · URL Control Policy—View, add, modify, and delete URL control policies. · Domain URL Group—View, add, modify, and delete domain URL groups. · IP URL Group—View, add, modify, and delete IP URL groups. |
|
Traffic Control |
View, add, modify, and delete traffic control policies. |
|
PC Security Software Policy |
Navigate to the following PC security software policy pages: · Anti-Virus—View, add, modify, and delete anti-virus software policies. · Anti-Spyware—View, add, modify, and delete anti-spyware software policies. · Firewall—View, add, modify, and delete firewall software policies. · Anti-Phishing—View, add, modify, and delete anti-phishing software policies. · Hard Disk Encryption—View, add, modify, and delete hard disk encryption software policies. |
|
Patch Control |
Navigate to the following patch control pages: · Windows Patches—Query, add, modify, and delete Windows patches, and manage Windows versions. · Patching Software—Enable check for patch software products on Linux or Mac OS. |
|
Software Control Group |
Query, view, add, modify, and delete software control groups. |
|
Registry Control |
View, add, modify, and delete registry control policies. |
|
Password Control |
View the current password dictionary and upload a new password dictionary. |
|
MDM Collaboration Policy |
View, add, modify, and delete MDM collaboration policies. |
|
Share Control |
View, add, modify, and delete share control policies. |
|
Hierarchical Node |
View, add, modify, and delete child nodes and confirm management from the parent node. |
|
EAD Node Topology |
View monitoring information for the current EAD node and all its child EAD nodes. |
|
Service Parameters |
Navigate to the following service parameter configuration pages: · System Settings—Configure User Security Policy service parameters. · MDM Vendor Config—Configure the MDM vendor and server to collaborate with. · Validate—Validate the service parameter settings immediately. |
Table 4 DAM navigation menu options
|
Navigation menu option |
Task |
|
Quick Start |
View the general operation process for the DAM module and links to configuration tasks. |
|
Asset Group |
Query, view, add, modify, and delete asset groups. |
|
All Assets |
Query, view, add, modify, and delete assets. |
|
Asset Hardware Change |
Query and view assets' hardware changes. |
|
Asset Software Change |
Query and view assets' software changes. |
|
Control Scheme |
View, add, modify, and delete desktop control schemes. |
|
Desktop Control Policy |
Navigate to the following desktop control policy pages: · Peripheral—View, add, modify, and delete peripheral policies. · Energy-Saving—View, add, modify, and delete energy-saving policies. · Monitoring Alarm—View, add, modify, and delete monitoring alarm policies. |
|
Desktop Control Audit |
Navigate to the following desktop control audit pages: · USB File Transfer—Query, view, and export USB file transfer logs. · Printer Use—Query, view, and export printer monitor logs. · Peripheral Use—Query, view, and export logs for unauthorized use of peripheral devices. · Asset File Check—Check suspicious files on assets in real time. |
|
Asset Statistics |
Displays the asset statistics by asset type, CPU, hard disk, OS, and software. |
|
Software Deploy Task |
Query, view, add, modify, and delete software deploy tasks. |
|
Software Server Settings |
View, add, modify, and delete servers for software distribution. |
|
Verify Asset |
Verify assets submitted for registration. This option is displayed when Verify Asset is enabled in DAM service parameters. |
|
Service Parameters |
Navigate to the following service parameter configuration pages: · System Settings—Configure DAM service parameters. · Validate—Validate the DAM service parameter settings immediately. |
|
Export Task |
Schedule a task to periodically export USB file transfer logs. |
Desktop mode
In desktop mode, click Add application to add EAD applications to the Web desktop. As shown in Figure 5, User Security Policy applications are enclosed by red lines and DAM applications are enclosed by orange lines.
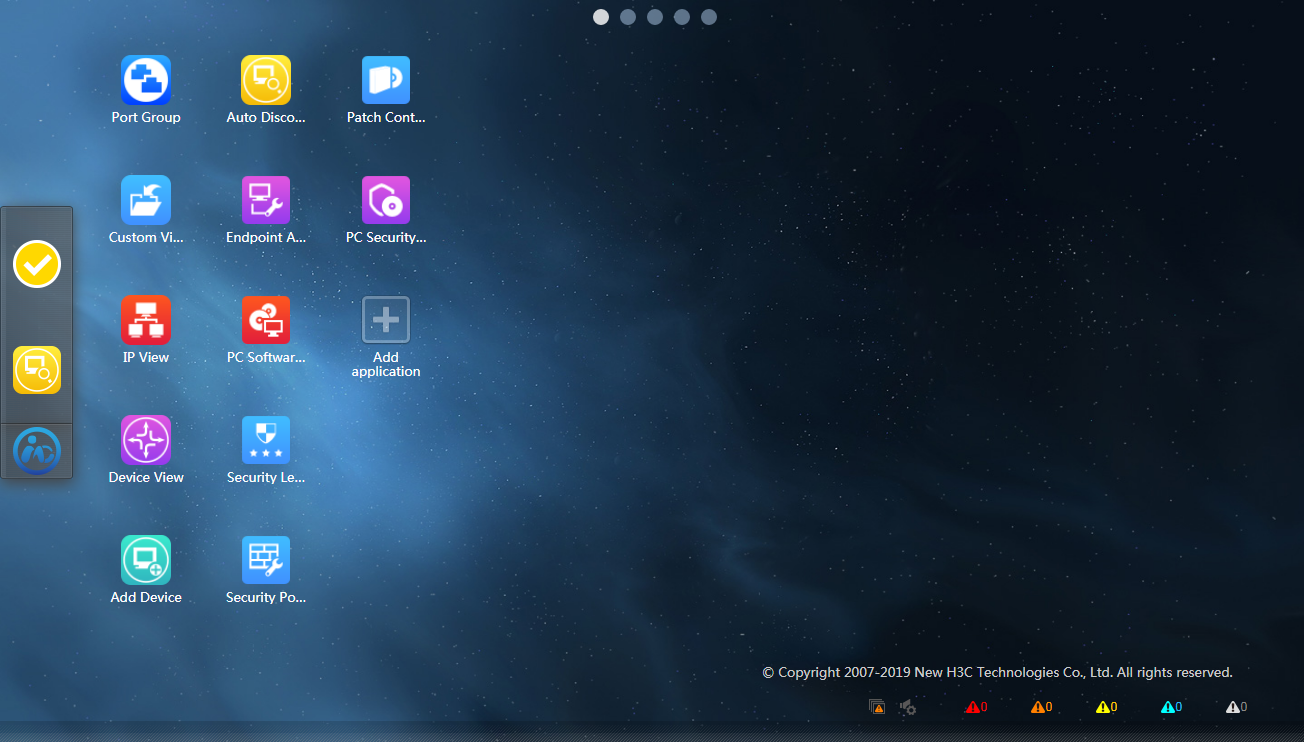
Table 5 and Table 6 show the supported EAD applications.
Table 5 User Security Policy applications
|
Application |
Task |
|
Quick Start |
View the general operation process for the User Security Policy module and links to configuration tasks. |
|
Security Policy |
View, add, modify, and delete security policies. |
|
Security Level |
View, add, modify, and delete security levels. |
|
Endpoint Access Control |
Navigate to the following endpoint access control pages: · Client ACL—View, add, modify, and delete ACLs that are deployed to the iNode client. · Internet Access Audit—View, add, modify, and delete policies for auditing Internet access behavior. · Internet Access Policy—View, add, modify, and delete Internet access policies. · URL Control Policy—View, add, modify, and delete URL control policies. · Domain URL Group—View, add, modify, and delete domain URL groups. · IP URL Group—View, add, modify, and delete IP URL groups. · Security Policy—View, add, modify, and delete security policies. |
|
Traffic Control |
View, add, modify, and delete traffic control policies. |
|
PC Security Software |
Navigate to the following PC security software policy pages: · Anti-Virus—View, add, modify, and delete anti-virus software policies. · Anti-Spyware—View, add, modify, and delete anti-spyware software policies. · Firewall—View, add, modify, and delete firewall software policies. · Anti-Phishing—View, add, modify, and delete anti-phishing software policies. · Hard Disk Encryption—View, add, modify, and delete hard disk encryption software policies. |
|
Patch Control |
Navigate to the following patch control pages: · Windows Patches—Query, add, modify, and delete Windows patches, and manage Windows versions. · Patching Software—Enable check for patch software products on Linux or Mac OS. |
|
PC Software Control Group |
Query, view, add, modify, and delete PC software control groups. |
|
Registry Control |
View, add, modify, and delete registry control policies. |
|
Password Control |
View the current password dictionary and upload a new password dictionary. |
|
MDM Collaboration |
View, add, modify, and delete MDM collaboration policies. |
|
Share Control |
View, add, modify, and delete share control policies. |
|
Hierarchical Node |
View, add, modify, and delete child nodes and confirm management from the parent node. |
|
EAD Node Topology |
View monitoring information for the current EAD node and all its child EAD nodes. |
|
Service Parameters |
Navigate to the following service parameter configuration pages: · System Settings—Configure User Security Policy service parameters. · MDM Vendor Config—Configure the MDM vendor and server to collaborate with. · Validate—Validate the service parameter settings immediately. |
Table 6 Desktop asset applications
|
Application |
Task |
|
Quick Start |
View the general operation process for the DAM module and links to configuration tasks. |
|
Asset Group |
Query, view, add, modify, and delete asset groups. |
|
All Assets |
Query, view, add, modify, and delete assets. |
|
Asset Hardware |
Query and view assets' hardware changes. |
|
Asset Software |
Query and view assets' software changes. |
|
Control Scheme |
View, add, modify, and delete desktop control schemes. |
|
Desktop Control Policy |
Navigate to the following desktop control policy pages: · Peripheral—View, add, modify, and delete peripheral policies. · Energy-Saving—View, add, modify, and delete energy-saving policies. · Monitoring Alarm—View, add, modify, and delete monitoring alarm policies. |
|
Desktop Control Audit |
Navigate to the following desktop control audit pages: · USB File Transfer—Query, view, and export USB file transfer logs. · Printer Use—Query, view, and export printer monitor logs. · Peripheral Use—Query, view, and export logs for unauthorized use of peripheral devices. · Asset File Check—Check suspicious files on assets in real time. |
|
Asset Statistics |
Displays the asset statistics by asset type, CPU, hard disk, OS, and software. |
|
Software Deploy Task |
Query, view, add, modify, and delete software deploy tasks. |
|
Software Server |
View, add, modify, and delete servers for software distribution. |
|
Verify Asset |
Verify assets submitted for registration. This application is available only when Verify Asset is enabled in DAM service parameters. |
|
Service Parameters |
Navigate to the following service parameter configuration pages: · System Settings—Configure DAM service parameters. · Validate—Validate the DAM service parameter settings immediately. |
|
Export Task |
Schedule a task to periodically export USB file transfer logs. |
Security check for PCs
Configuration procedure
To configure security checking for PCs:
1. Install the iNode client on PCs according to your operating system.
2. Configure check items to meet the network security requirements.
3. Select a security level and configure the security mode for each check item. The following security modes are supported for PCs:
¡ Kick out
¡ Isolate
¡ Inform
¡ Monitor
4. To isolate access users that fail the security check, configure an isolation mode and isolation rules.
5. Configure a remediation server and a knowledge base for users to access for remediation when users cannot access the network.
6. Configure a security policy to associate the selected security level with check items, isolation mode, and failure notifications.
7. To configure security policies for different access scenarios, repeat step 2 through step 6.
8. Configure access services and associate them with security policies.
9. Audit security logs and reports to identify any new trend of security threats in the network.
10. Adjust the security policies, security levels, and isolation rules based on audit result.
Security check items
The following security check items are available for a security policy that is to be assigned to a Windows, Linux, or Mac OS PC:
· URL access control
· Anti-virus software control
· Anti-spyware software control
· Firewall software control
· Anti-phishing software control
· Hard disk encryption software control
· PC software control
· Patch software control
· Windows patch control
· Registry control
· Share control
· Asset registration status check
· Windows system restore settings check
· Traffic control
· OS password control
Some of the check items also have sub items.
Security level and security mode
A security level for PCs contains check items and their respective security modes that define the actions to take in response to any detected security violations.
EAD supports the following security modes in descending order of severity:
· Kick Out—The EAD server works with the UAM server to log off noncompliant users and generates security logs for violations.
· Isolate—The EAD server isolates noncompliant users in a restricted area, informs the users of the security vulnerability and remediation methods, and generates security logs for violations.
· Inform—The EAD server informs noncompliant users of the security vulnerability and remediation methods on user endpoints, and generates security logs for violations.
· Monitor—The EAD server monitors noncompliant users and generates security logs for violations.
When the detected security violations of a single user require actions of different severities, the most severe action is taken.
The Action After parameter can be configured as a tolerance interval during which network access is permitted before a noncompliant user is isolated or logged off. In this time interval, the user can fix any detected security vulnerabilities and trigger a new security check.
Isolation mode
PC user isolation is implemented based on ACLs or VLANs, which are deployed to the access device or iNode client.
ACLs and VLANs can be defined for network security or for isolation.
· Security ACLs and VLANs define the accessible areas for users who pass the security check.
· Isolation ACLs and VLANs define the quarantine areas for users who fail the security check to fix security vulnerabilities.
EAD provides several isolation modes for PCs, as shown in Table 7.
|
Isolation mode |
Description |
Remarks |
|
Deploy ACLs to access device |
The EAD server deploys security and isolation ACLs to the access device for users' access control. The mechanism for processing ACLs depends on the device vendor and model. |
The access device must support the ACL deployment feature. |
|
Deploy ACLs to iNode client |
The EAD server deploys security and isolation ACLs to the iNode client for users' access control. The mechanism for processing ACLs is not affected by the device vendor or model. |
The iNode client must support the client ACL feature. |
|
Deploy VLANs to access device |
The EAD server deploys security and isolation VLANs to the access device for users' access control. The mechanism for processing VLANs depends on the device vendor and model. |
The access device must support the VLAN deployment feature. |
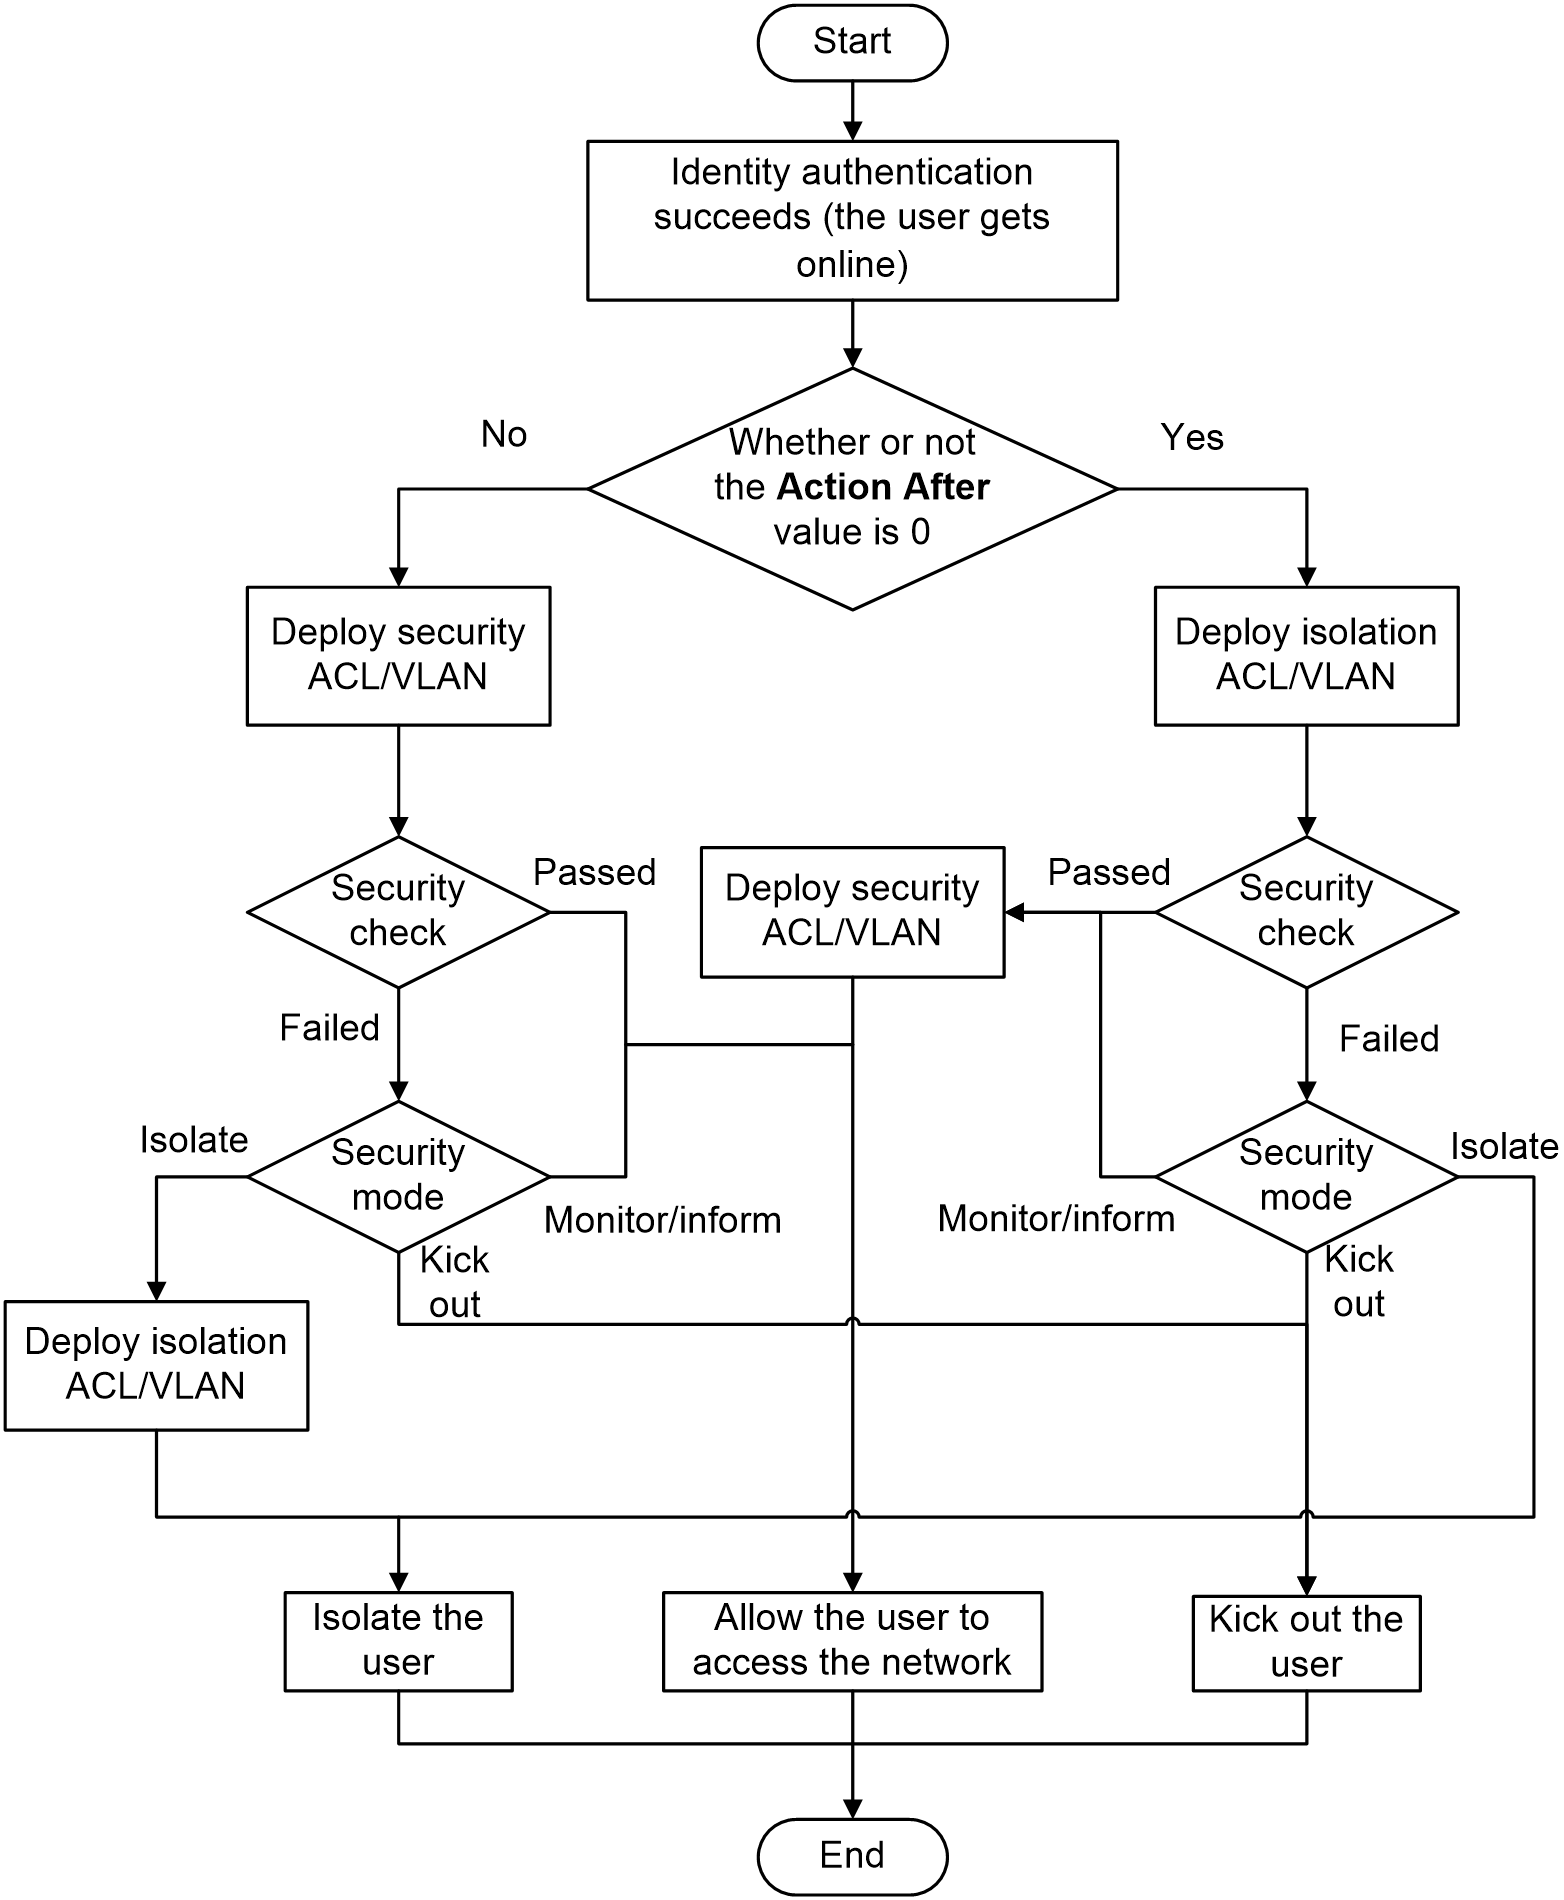
Security check flow chart
PC security check procedures depend on the security mode and isolation mode configured in the User Security Policy module. Figure 6 shows the process by which the EAD server performs a security check for PCs.
Figure 6 PC security check procedures
Security check for smart devices
EAD can cooperate with a third-party MDM server and client to perform a security check on Android or iOS smart devices.
Configuration procedure
To configure security checking for smart devices:
1. Obtain the MDM vendor information and permissions to use the MDM API. EAD supports Citrix and MobileIron.
2. Configure the MDM vendor in the User Security Policy service parameter settings.
3. Configure check items to meet the network security requirements and configure an MDM collaboration policy.
4. Select a security level and configure the security mode and device action for each check item.
The following security modes are supported for smart devices:
¡ Kick out
¡ Isolate
¡ Inform
¡ Monitor
The following device actions are supported:
¡ Lock
¡ Wipe corporation data
¡ Wipe data
5. To isolate access users that fail the security check, configure an isolation mode and isolation rules.
6. Configure a security policy to associate the selected security level with check items, isolation mode, and MDM collaboration policy.
7. To configure security policies for different access scenarios, repeat step 3 through step 6.
8. Configure access services and associate them with security policies.
9. Audit MDM security logs to identify any new trend of security threats in the network.
10. Adjust the security policies, security levels, and isolation rules based on audit results.
Security check items
Security check items for smart devices vary with the MDM vendor.
Citrix provides the following check items:
· Endpoint enrollment check
· Endpoint compliance check
· Jailbreak or root permission check
· Storage encryption check
MobileIron provides the following check items:
· Endpoint registration check
· Endpoint compliance check
· GPS service check
· Auto-lock check
· Bluetooth service check
· Camera service check
· Jailbreak or root permission check
· Password lock check
· Storage encryption check
Security level, security mode, and device action
A security level for smart devices contains check items and their respective security modes and device actions. Security modes define actions to take in response to noncompliant users. Device actions are taken on any smart devices used by noncompliant users.
EAD supports the following security modes in descending order of severity:
· Kick Out—The EAD server works with the UAM server to log off noncompliant users and generates security logs for violations.
· Isolate—The EAD server isolates noncompliant users in a restricted area, informs the users of the security vulnerability and remediation methods, and generates security logs for violations.
· No Action—The EAD server only generates security logs for violations.
EAD supports the following device actions in descending order of severity:
· Wipe Data—The EAD server works with the MDM server to wipe all data and restore factory settings on the smart device, and generates security logs for violations.
· Wipe Corporation Data—The EAD server works with the MDM server to wipe the corporation data on the smart device and generates security logs for violations.
· Lock—The EAD server works with the MDM server to lock the smart device and generates security logs for violations.
When a smart device fails the security check, EAD immediately takes the configured actions for the noncompliant user and smart device, regardless of the Action After parameter setting.
Isolation mode
Smart device user isolation is implemented based on ACLs or VLANs which are deployed to the access device.
ACLs and VLANs can be defined for network security or for isolation.
· Security ACLs and VLANs define the accessible areas for users who pass the security check.
· Isolation ACLs and VLANs define the quarantine areas for users who fail the security check to fix security vulnerabilities.
EAD provides several isolation modes for smart devices, as shown in Table 8.
Table 8 Smart device isolation modes
|
Isolation mode |
Description |
Remarks |
|
Deploy ACLs to access device |
The EAD server deploys security and isolation ACLs to the access device for users' access control. The mechanism for processing ACLs depends on the device vendor and model. |
The access device must support the ACL deployment feature. |
|
Deploy VLANs to access device |
The EAD server deploys security and isolation VLANs to the access device for users' access control. The mechanism for processing VLANs depends on the device vendor and model. |
The access device must support the VLAN deployment feature. |
SCC collaboration
Security Control Center (SCC) is the network attack analyzer of the IMC platform which generates attack alarms and takes action in response to the attack.
EAD can work with SCC to isolate users when a network attack occurs. For SCC to block the attack source, enable the option Isolates users by using EAD. When a network attack occurs, SCC locates the endpoint IP address and notifies EAD of the IP address. EAD searches the online user by the IP address and isolates the user based on the assigned security policy.
Desktop asset management
The DAM module manages Windows PCs as desktop assets.
Desktop asset management procedure
To manage desktop assets:
1. Install the iNode client on the PCs.
2. Create asset groups to manage desktop assets in different groups.
3. Identify owners of desktop assets, set the numbering mode of desktop assets, and register the assets to EAD.
4. Configure the desktop control schemes and assign them to asset groups or assets to monitor the use and changes of assets.
5. Regularly audit asset logs and statistics reports, and check use and changes of assets.
The owner of an asset is responsible for maintaining the security of the asset. The user of an asset might not be the owner of the asset. As a best practice, make asset usage regulations for desktop assets managed in DAM to clearly define the rights and responsibilities of users and owners.
Desktop asset grouping type
EAD supports the following ways of creating asset groups:
· Manually create asset groups—Operators must manually create asset groups and subgroups in DAM. Assets are manually assigned to asset groups.
· Use user groups—DAM automatically creates asset groups and subgroups based on existing user groups on the IMC Platform. Every asset is automatically added to the group to which its owner belongs. When the user groups of asset owners are changed, DAM automatically changes assets among asset groups.
Desktop asset numbering mode
EAD supports the following modes of numbering desktop assets:
· Manual numbering—Operators must manually number desktop assets and specify the asset information such as owners, asset types, and physical locations in DAM. To complete registration, the user of an asset must enter the asset number specified by the operator.
· Automatic numbering—DAM automatically numbers desktop assets. A prefix can be specified for automatic numbering. The owner of an asset is the access user who registers the asset.
Desktop asset registration and approval
DAM manages only registered assets. When an asset is registered, the hardware and software information of the asset is recorded by the EAD server. The asset registration process varies by asset numbering mode.
· If manual numbering is used, an access user is prompted to enter the asset number specified by the operator when the user comes online. After the asset number is entered, the iNode client reports the asset information to the EAD server for registration.
· If automatic numbering is used, the iNode client does one of the following depending on whether Auto Register is enabled in the DAM service parameters:
¡ If Auto Register is enabled: When an access user comes online, DAM automatically reports the asset information to the EAD server for registration.
¡ If Auto Register is disabled: When an access user comes online, the user is prompted to enter the asset information. Then the iNode client reports the asset information to the EAD server for registration.
When automatic numbering is used, the asset information is sent for approval. If the asset information is:
· Approved, the asset is registered successfully to the EAD server.
· Not approved, the operator can require the user to re-enter the asset information.
Desktop control scheme
A desktop control scheme contains a set of desktop monitoring policies distributed by the DAM server to each iNode client for controlling desktop assets. EAD supports the following types of desktop monitoring policies:
· Peripheral policy—Allows you to manage peripherals such as prohibiting use of peripherals and monitoring the use of USB storage devices and printers.
· Energy-saving policy—Allows you to implement a scheduled shutdown of assets. At the scheduled time, the iNode client displays a message that requires the user to shut down the asset. If the message is ignored, the iNode client forcibly shuts down the asset.
· Monitoring alarm policy—Allows you to monitor use and changes of assets, including software and hardware changes, unauthorized copying of files to USB storage devices, and printing of sensitive files. The monitoring information is converted to syslogs for triggering alarms.
The desktop control scheme configuration can be managed on a group basis or an asset basis. The group basis configuration applies to all assets in the same group, but it can be overridden by the asset basis configuration. The desktop control scheme configured for a subgroup has a higher priority than the desktop control scheme configured for the group that contains the subgroup.
Decentralized management of IMC functions
Operators can grant or restrict access to IMC functions based on operator groups and service groups.
Operator role and group
Access to IMC functions can be granted or restricted according to operator roles. IMC has the following operator roles with different management privilege levels: administrator, maintainer, and viewer. The administrator has the right of Operator Management to modify the management privileges of the maintainer and viewer roles.
An operator group and all its operators are granted management privileges by the operator role. For more information about operator groups, see HPE Intelligent Management Center v7.0 Enterprise and Standard Administrator Guide.
Service group
The Service Group function is provided in UAM to grant or restrict access to IMC functions based on service groups. The service groups to which IMC functions are assigned can be configured with specific operators for group management.
An administrator can specify a service group for a function module. A maintainer or viewer can only select a service group they can manage for a function module. For more information about service groups, see HPE IMC User Access Manager Administrator Guide.
Decentralized management by operator and service groups
The operator groups and service groups both affect operators' permissions. The management rights of an operator are determined by the following:
· Operator group to which the operator belongs.
· Service groups the operator can manage.
Table 9 and Table 10 are examples of operator and service groups. The service groups are created by Operator A.
Table 9 Operator groups and management rights
|
Operator |
Role |
Operator group |
Management rights |
|
Operator A |
Administrator |
Administrator group |
The operator has the following management rights: · IMC Platform > Resource > System > Operator Management · UAM > User > Service Group > View/Add/Modify/Delete · EAD > User > User Security Policy > Security Policy > View/Add/Modify/Delete · EAD > User > User Security Policy > Registry Control > View/Add/Modify/Delete |
|
Operator B1 |
Maintainer |
Maintainer group B1 |
The operator has the following management rights: · EAD > User > User Security Policy > Security Policy > View/Modify · EAD > User > User Security Policy > Registry Control > View/Add/Modify/Delete |
|
Operator B2 |
Viewer |
Viewer group B2 |
The operator has the following management rights: · EAD > User > User Security Policy > Security Policy > View · EAD > User > User Security Policy > Registry Control > View |
|
Operator C |
Maintainer |
Maintainer group C |
The operator has the following management rights: · EAD > User > User Security Policy > Security Policy > View/Modify · EAD > User > User Security Policy > Registry Control > View/Add/Modify/Delete |
Table 10 Service groups and functions
|
Service group |
Operators |
Functions |
|
Service group B |
Operator B1 Operator B2 |
Security policy B Registry control policy B |
|
Service group C |
Operator C |
Security policy C Registry control policy C |
Table 11 displays each operator's management rights that are controlled by both the operator and service groups. Operator A is not listed because its management rights are not changed.
Table 11 Management rights of each operator in decentralized management
|
Operator |
Management rights |
|
Operator B1 |
The operator has the following management rights: · EAD > User > User Security Policy > Security Policy > View/Modify security policy B. · EAD > User > User Security Policy > Registry Control > View/Modify/Delete registry control policy B. · EAD > User > User Security Policy > Registry Control > Add new registry control policies to service group B. · Viewing all registry control policies in service group B and ungrouped registry control policies when modifying security policy B. |
|
Operator B2 |
The operator has the following management rights: · EAD > User > User Security Policy > Security Policy > View security policy B. · EAD > User > User Security Policy > Registry Control > View registry control policy B. |
|
Operator C |
The operator has the following management rights: · EAD > User > User Security Policy > Security Policy > View/Modify security policy C. · EAD > User > User Security Policy > Registry Control > View/Modify/Delete registry control policy C. · EAD > User > User Security Policy > Registry Control > Add new registry control policies to service group C. · Viewing all registry control policies in service group C and ungrouped registry control policies when modifying security policy C. |
Common operations
Navigating a list
If a list contains enough entries, use the following aids to navigate the list:
· To page forward in the list, click the Next Page icon ![]() .
.
· To page forward to the end of the list, click the Last Page
icon ![]() .
.
· To page backward in the list, click the Previous Page
icon ![]() .
.
· To page backward to the front of the list, click
the First Page icon ![]() .
.
· To display a page in the list, click the page number. The list can display up to 10 page numbers.
· To configure how many items per page you want to display, at the bottom of the list select 8, 15, 50, 100, 200, or 1000.
Sorting a list
You can sort a list by every field that
contains a Sort icon ![]() in the column
heading. When the list is sorted by a field in:
in the column
heading. When the list is sorted by a field in:
· Ascending order, the column heading of the
selected field is blue and contains an Ascending
icon ![]() .
.
· Descending order, the column heading of the
selected field is blue and contains a Descending
icon ![]() .
.
Configuring the security check for PCs
EAD works with the iNode client to perform security check on PCs. When a user accesses the network, the iNode client requests security policies from the EAD server according to the access service of the user. The iNode client then performs a security check on the user's PC and reports the check results to the EAD server.
Security policy contents
A security policy consists of a security level, an isolation mode, and security check items.
Security level
A security level specifies the security modes (actions) to implement in response to the detected security violations. When the detected security violations of a single user require security modes of different severities, the most severe security mode is implemented.
EAD supports the following system-defined security levels in descending order of severity as shown in Table 12. For more information about configuring security levels, see "Managing security levels."
Table 12 Security levels and actions
|
Security level |
Actions in response to detected security violations |
|
Blacklist and Kick Out mode |
Adds noncompliant users to the blacklist, logs off the users, generates security logs for violations, and informs the noncompliant users of the security vulnerability and remediation methods. |
|
Kick out mode |
Logs off noncompliant users and generates security logs for violations. |
|
Guest mode |
Informs noncompliant users of the security vulnerability, logs off the users, and generates security logs for violations. |
|
Isolate mode |
Isolates noncompliant users in a restricted area, informs the users of the security vulnerability and remediation methods, and generates security logs for violations. |
|
VIP mode |
Informs noncompliant users of the security vulnerability and remediation methods and generates security logs for violations. |
|
Monitor mode |
Generates security logs for violations. |
Isolation mode
EAD provides the following isolation modes for PCs as shown in Table 13.
|
Isolation mode |
Method |
Remarks |
|
Deploy ACLs to the access device |
· Non-HP ProCurve devices—EAD deploys the ACL number or name to the access device. · HP ProCurve devices—EAD deploys the name of an access ACL defined in UAM to the HP ProCurve device. |
For non-HP ProCurve devices: · The ACLs must already exist on the access device. Otherwise, the user is logged off after ACLs are deployed. · Configurations for ACLs vary by vendor and device model. For more information about configuring ACLs, see the configuration guide for the access device. For HP ProCurve devices, the access ACLs must already exist in UAM. For more information, see HPE IMC User Access Manager Administrator Guide. |
|
Deploy ACLs to the iNode client |
EAD deploys the name of a client ACL to the Node client. |
The iNode client must support the client ACL feature. Otherwise, the user is logged off after ACLs are deployed. For more information about configuring client ACLs, see "Managing client ACLs." |
|
Deploy VLANs to the access device |
EAD deploys the VLAN ID to the access device. |
The VLANs must already exist on the access device. Otherwise, the user is logged off after ACLs are deployed. VLAN configurations vary by vendor and device model. For more information about configuring VLANs, see the configuration guide for the access device. |
Security check items
EAD supports the following security check items for PCs, as shown in Table 14. Most of the security check items have sub-items and you can configure contents to be checked for them.
Table 14 Security check items for PCs
|
Security check item |
Sub-items and contents |
|
URL access control |
Configure the following sub-items in a URL control policy: · IP URL check—Configure the IP URL group. · Domain URL check—Configure the domain URL group. You can also configure the Hosts file check. |
|
Anti-virus software control |
Configure the following sub-items in an anti-virus software policy: · Software installed required check · Software running required check · Software or engine version check · Software virus signature version check |
|
Anti-spyware software control |
Configure the following sub-items in an anti-spyware software policy: · Software installed required check · Software running check · Software or engine version check · Software virus signature version check |
|
Firewall software control |
Configure the following sub-items in a firewall software policy: · Software installed required check · Software running required check |
|
Anti-phishing software control |
Configure the following sub-items in an anti-phishing software policy: · Software installed required check · Software running required check |
|
Hard disk encryption software control |
Configure a hard disk encryption software policy to require the software to be installed on the endpoints. |
|
PC software control |
Configure the following sub-items in a PC software control policy: · Software installation status check for a software-type PC software control group · Software running status check for a process-type PC software control group · Software start status check for a service-type PC software control group · Software existence status check for a file-type PC software control group You can also configure a list of common software products. |
|
Patch software control |
Configure the following sub-items: · Software installed required check · Software running required check |
|
Windows patch control |
Configure the following sub-items: · Collaboration with Windows patch server check · Patch auto-installation results check · Patch level check |
|
Registry control |
Configure the following contents in a registry control policy: · Registry key existence check · Registry key value match check |
|
Share control |
Configure the following contents in a share control policy: · Allow share check · Share type check · User share right check |
|
Asset registration status check |
N/A |
|
Windows system restore settings check |
N/A |
|
Traffic control |
Configure the following sub-items in a traffic control policy: · IP traffic check · Broadcast packets number check · Packets number check · TCP/UDP connections number check Configure normal, abnormal, and severe thresholds for each sub-item. |
|
OS password control |
Configure a password dictionary. |
Managing security policies
When the EAD hierarchical node management feature is enabled, the parent node deploys the patch server address to a child node only for the first deployment of the policy. To prevent the custom patch server address information from being overwritten on the child node, the parent node does not deploy the patch server address for subsequent deployments.
Security policy list contents
The security policy list has the following parameters:
· Policy Name—Name of the security policy. Click the name to view policy details.
· Security Level—Name of the security level used by the security policy. Click the name to view detailed information. For more information, see "Security level details."
· Isolation Mode—Isolation mode of the security policy:
¡ Not Deploy—No isolation mode is specified.
¡ Deploy ACLs to Access Device—Isolates illegal users by using access device ACLs.
¡ Deploy ACLs to iNode Client—Isolates illegal users by using iNode client ACLs.
¡ Deploy VLANs to Access Device—Isolates illegal users by using VLANs.
· Security ACL or VLAN—Security ACL or VLAN of the security policy. The security ACL or VLAN applies to all online users who are not isolated. The parameter is based on the configured isolation mode.
¡ To deploy ACLs to non-HP ProCurve devices, the parameter is an ACL number or name.
¡ To deploy ACLs to HP ProCurve devices, the parameter is the name of an access ACL defined in UAM. Click the ACL name to view the ACL rules deployed to the access device.
¡ To deploy ACLs to the iNode client, the parameter is the name of a client ACL. Click the ACL name to view the ACL rules deployed to the iNode client.
¡ To deploy VLANs to access devices, the parameter is a VLAN ID.
· Isolation ACL or VLAN—Isolation ACL or VLAN of the security policy. The isolation ACL or VLAN applies to online users who must be isolated. The parameter can be an ACL number or name, access ACL name, client ACL name, or VLAN ID, based on the configured isolation mode. For more information, see the parameter descriptions for Security ACL or VLAN.
· Service Group—Service group to which the security policy belongs.
· Modify—To modify the security policy settings,
click the Modify icon ![]() .
.
· Delete—To delete the security policy, click the Delete icon ![]() .
.
Security policy details
The security policy details page has the following areas:
· Common Configuration—Basic information about the security policy and the isolation mode configuration.
· PC—Security check items for PCs.
· Smart Device—Security check items for smart devices.
UAM identifies the check items for PCs from smart device check items in the same security policy based on the endpoint type and access scenario. EAD performs the security check after it is informed of the check items by UAM.
The following information describes security check items for PCs. For more information about configuring security check items for smart devices, see "Configuring the security check for smart devices."
EAD supports security checks on IPv6 hosts only when the Enable IPv6 parameter is set to Yes in the UAM service parameter configuration. The default setting of this parameter is No. For more information, see HPE IMC User Access Manager Administrator Guide.
Basic Information area
· Policy Name—Unique name of the security policy.
· Service Group—Service group to which the security policy belongs.
· Security Level—Name of the security level used in the security policy. Click the name to view detailed information. For more information, see "Security level details."
· Monitor in Real Time—When selected, this parameter enables real-time monitoring of user endpoints in the security policy. For more information, see "Configuring real-time monitoring."
· Process After—The amount of time, in minutes, that the iNode client waits before it isolates or kicks out an access user for whom a violation is detected during real-time monitoring. The iNode client prompts the user to make the necessary remediation and initiate a new security check to avoid being isolated or kicked out.
This parameter is displayed only when the Monitor in Real Time option is selected.
· Set as Default Policy for Roaming Users—When selected, this parameter makes the security policy the default security policy for roaming users. You can specify only one security policy as the default security policy for roaming users. For more information, see "Configuring the default security policy for roaming users."
· Description—Description of the security policy.
· Check Passed Message—Message that the iNode client displays when an access user passes the security check.
Isolation Mode area
· Configure Isolation Mode—Indicates whether an isolation mode is configured. When this parameter is:
¡ not selected, the security policy does not have an isolation mode.
¡ selected, the security policy can use any of the following isolation modes: Deploy ACLs to Access Device, Deploy ACLs to iNode Client, or Deploy VLANs to Access Device.
The following parameters are displayed only when the Configure Isolation Mode option is selected. The parameters vary by isolation mode.
· Deploy ACLs to Access Device—This isolation mode deploys ACLs to access devices. For non-HP ProCurve devices, EAD deploys ACL numbers or names through RADIUS packets. For HP ProCurve devices, EAD deploys access ACL rules through extended RADIUS packets. The isolation mode has the following parameters:
¡ Security ACL (for non-HP ProCurve)—Number or name of the security ACL deployed to non-HP ProCurve devices.
¡ Isolation ACL (for non-HP ProCurve)—Number or name of the isolation ACL deployed to non-HP ProCurve devices.
¡ Security ACL (for HP ProCurve)—Name of the access ACL deployed to HP ProCurve devices as the security ACL. Click the ACL name to view the ACL rules in the access ACL. For information about access ACLs, see HPE IMC User Access Manager Administrator Guide.
¡ Isolation ACL (for HP ProCurve)—Name of the access ACL deployed to HP ProCurve devices as the isolation ACL. Click the ACL name to view the ACL rules in the access ACL. For information about access ACLs, see HPE IMC User Access Manager Administrator Guide.
· Deploy ACLs to iNode Client—This isolation mode deploys ACL rules to the iNode client through EAD messages. For more information about configuring client ACLs, see "Managing client ACLs." The isolation mode has the following parameters:
¡ Security ACL—Name of the security ACL deployed to the iNode client. Click the ACL name to view the ACL rules in the client ACL.
¡ Isolation ACL—Name of the isolation ACL deployed to the iNode client. Click the ACL name to view the ACL rules in the client ACL.
· Deploy VLANs to Access Device—This isolation mode deploys VLAN IDs to access devices through RADIUS packets. The VLANs corresponding to the VLAN IDs must exist on the devices. The isolation mode has the following parameters:
¡ Security VLAN—ID of the security VLAN deployed to access devices.
¡ Isolation VLAN—ID of the isolation VLAN deployed to access devices.
· Deploy User Groups to Access Device—This isolation mode deploys user groups to access devices. You can specify multiple user groups that are separated by semicolons (;). This feature takes effect only when EAD works with SSL VPN devices. The isolation mode has the following parameters:
¡ Security User Group—User groups deployed to access devices when users pass the security check.
¡ Isolation User Group—User groups deployed to access devices when users fail the security check.
URL Control area
· Enable URL Access Control—Indicates whether to check URLs accessed by the access users.
The following parameters are displayed only when the Enable URL Access Control option is selected:
· URL Control Policy—Name of the URL control policy used in the security policy. The URL control policy controls user access to specified websites by domain name or IP address.
· Check Hosts File—Indicates whether to check the Hosts file on the user endpoint. When this option is enabled, the iNode client checks the Hosts file against the IP address list next to the Check Hosts File field. When the Hosts file of a user endpoint contains an IP address that is not on the list, the iNode client forces the user to log out. This feature prevents users from accessing unauthorized websites by modifying the Hosts file.
The Hosts file check can serve as a supplement to the URL control policy. A user might bypass the URL control policy by modifying the Hosts file to access a prohibited URL. The Hosts file check applies only to access users using Windows. For example, the path of the Hosts file on Windows 7 is C:\WINDOWS\system32\drivers\etc\hosts.
Anti-Virus Software Control area
The anti-virus software check takes effect on Windows, Linux, and Mac OS PCs.
· Check Anti-Virus Software—Indicates whether to check the anti-virus software on the user endpoint. The check items include the anti-virus definition version, engine version, software installation status, and software running status.
The following parameters are displayed only when the Check Anti-Virus Software option is selected:
· PC Anti-Virus Software Policy—Name of the anti-virus software policy used in the security policy.
· Server Address—IPv4 address of a file server from which users can download anti-virus software and update packages. The IP address is sent only to IPv4 users who fail the anti-virus software check.
· IPv6 Server Address—IPv6 address of a file server from which users can download anti-virus software and update packages. The IP address is sent only to IPv6 users who fail the anti-virus software check.
· Failure Notification—Message that the iNode client displays when an access user fails the anti-virus software check.
Anti-Spyware Software Control area
The anti-spyware software check takes effect on Windows and Mac OS PCs.
· Check Anti-Spyware Software—Indicates whether to check the anti-spyware software on the user endpoint. The check items include the anti-spyware definition version, engine version, software installation status, and software running status.
The following parameters are displayed only when the Check Anti-Spyware Software option is selected:
· Anti-Spyware Software Policy—Name of the anti-spyware software policy used in the security policy.
· Server Address—IPv4 address of a file server from which users can download anti-spyware software and update packages.
· IPv6 Server Address—IPv6 address of a file server from which users can download anti-spyware software and update packages.
· Failure Notification—Message that the iNode client displays when an access user fails the anti-spyware software check.
When an access user fails the anti-spyware software check, EAD sends the IPv4 address of the server to a user using IPv4 address, or the IPv6 address of the server to a user using IPv6 address. Operators can configure a file server, HTTP server, or FTP server to provide the download services.
Firewall Software Control area
The firewall software check takes effect only on Windows, Linux, and Mac OS PCs.
· Check Firewall Software—Indicates whether to check the firewall software on the user endpoint. The check items include the firewall installation status and running status.
The following parameters are displayed only when the Check Firewall Software option is selected:
· Firewall Software Policy—Name of the firewall software policy used in the security policy.
· Server Address—IPv4 address of a file server from which users can download the firewall software.
· IPv6 Server Address—IPv6 address of a file server from which users can download the firewall software.
· Failure Notification—Message that the iNode client displays when an access user fails the firewall software check.
When an access user fails the firewall software check, EAD sends the IPv4 address of the server to a user using IPv4 address, or the IPv6 address of the server to a user using IPv6 address. Operators can configure a file server, HTTP server, or FTP server to provide the download services.
Anti-Phishing Software Control area
The anti-phishing software check takes effect only on Windows and Mac OS PCs.
· Check Anti-Phishing Software—Indicates whether to check the anti-phishing software on the user endpoint. The check items include the anti-phishing software installation status and the software running status.
The following parameters are displayed only when the Check Anti-Phishing Software option is selected:
· Anti-Phishing Software Policy—Name of the anti-phishing software policy used in the security policy.
· Server Address—IPv4 address of a file server from which users can download the anti-phishing software and update packages.
· IPv6 Server Address—IPv6 address of a file server from which users can download the anti-phishing software and update packages.
· Failure Notification—Message that the iNode client displays when an access user fails the anti-phishing software check.
When an access user fails the anti-phishing software check, EAD sends the IPv4 address of the server to a user using IPv4 address, or the IPv6 address of the server to a user using IPv6 address. Operators can configure a file server, HTTP server, or FTP server to provide the download services.
Hard Disk Encryption Software Control area
The hard disk encryption software check takes effect only on Windows PCs.
· Check Hard Disk Encryption Software—Indicates whether to check the installation status of the hard disk encryption software on the user endpoint.
The following parameters are displayed only when the Check Hard Disk Encryption Software option is selected:
· Hard Disk Encryption Software Policy—Name of the hard disk encryption software policy used in the security policy.
· Server Address—IPv4 address of a file server from which users can download the hard disk encryption software.
· IPv6 Server Address—IPv6 address of a file server from which users can download the hard disk encryption software.
· Failure Notification—Message that the iNode client displays when an access user fails the hard disk encryption software check.
When an access user fails the hard disk encryption software check, EAD sends the IPv4 address of the server to a user using IPv4 address, or the IPv6 address of the server to a user using IPv6 address. Operators can configure a file server, HTTP server, or FTP server to provide the download services.
PC Software Control area
The PC software control check takes effect only on Windows, Linux, and Mac OS PCs. The check items include software, processes, services, and files.
This area lists the configurations of PC software control groups, including the group name, PC software control type, and check type.
· Check PC Software Control—Indicates whether to check the software, processes, services, and files on the PC.
The following parameters are displayed only when the Check PC Software Control option is selected:
· Group Name—Name of the PC software control group to be checked.
· Type—Type of the PC software control group to be checked: Software, Process, Service, or File.
· Check Type—Check type of the PC software control group. The check type options vary with the PC software control types as shown in Table 15.
· Server Address—IPv4 address of a file server from which access users can download the required software, update files, and repair tools.
· IPv6 Server Address—IPv6 address of a file server from which access users can download the required software, update files, and repair tools.
· Failure Notification—Message that the iNode client displays when an access user fails the PC software control group check.
When an access user fails the PC software control group check, EAD sends the IPv4 address of the server to a user using IPv4 address, or the IPv6 address of the server to a user using IPv6 address. Operators can configure a file server, HTTP server, or FTP server to provide the download services.
Table 15 PC software control groups and check types
|
Group type |
Check types |
|
Software |
· Installed Forbidden—Prohibits any software products in the control group from being installed on the user endpoint. · Installed Required—Requires all software products in the control group to be installed on the user endpoint. · Installed Allowed—Allows only the software products in the control group to be installed on the user endpoint. Only one control group can be set as Installed Allowed. |
|
Process |
· Running Forbidden—Prohibits any processes in the control group from running on the user endpoint. · Running Required—Requires all processes in the control group to be running on the user endpoint. |
|
Service |
· Started Forbidden—Prohibits any services in the control group from being started on the user endpoint. · Started Required—Requires all services in the control group to be started on the user endpoint. |
|
File |
· Non-Existent—Prohibits any files in the control group from being stored on the user endpoint. · Existent—Requires all files in the control group to exist on the user endpoint. |
Patch Software Control area
The patch management software control check takes effect only on Linux and Mac OS PCs.
· Check Patch Software—Indicates whether to check the patch software on the user endpoint.
· Failure Notification—Message that the iNode client displays when an access user fails the patch software check. This parameter is displayed only when the Check Patch Software option is selected.
Windows Patch Control area
This area has the following option:
· Check Windows Patches—Indicates whether to check the Windows patches on the user endpoint.
The following methods are displayed only when the Check Windows Patches option is selected:
· Check Through Microsoft Server—Enables the iNode client to check for missing patches and patch severity levels by connecting to the Microsoft WSUS or SMS server. Patches are then downloaded and installed automatically.
· Check Manually—Enables the iNode client to check for missing patches and patch severity levels by connecting to the EAD server. The user can then download and install the required patches manually.
The following parameters are displayed only when the Check Through Microsoft Server option is selected:
· Patch Check Interval—Specifies the number of days to skip patch checking for an access user who has passed the patch check. When the Patch Check Interval is set to 0, EAD never skips patch checking. You can configure how many days the user can access the network when the PC fails the patch check. For more information about configuring the patch check interval and the grace days for patch noncompliance, see "User security policy service parameters."
· Flexible Patching—Arranges the patch check and installation work for PCs at different time of the week to improve efficiency and reduce workload on the patch server. If patches are not checked on a user's PC in the recent 21 days, EAD performs patch checking as soon as the user comes online. When this option is selected, the Patch Check Interval parameter becomes invalid and disappears from the page.
· Server Address—IPv4 address of the Microsoft WSUS or SMS server.
· IPv6 Server Address—IPv6 address of the Microsoft WSUS or SMS server.
When checking the Windows patches for an access user, EAD sends the IPv4 address of the WSUS or SMS server to a user using IPv4 address, or a IPv6 address of the server to a user using IPv6 address. The iNode client checks and repairs Windows according to the address it receives.
Microsoft WSUS patch server or SMS server address is in the format of http://host:port or https://host:port. If you do not specify the protocol, the system automatically adds http:// to the address during communication. The host string can be an IP address, computer name, or full computer name with a domain name. If you do not specify the port number, the system uses the default port setting, which is HTTP 80 or HTTPS 8443. Valid server addresses can be wsus.contoso.com (wsus is a computer name and contoso.com is a domain name), 10.153.128.57:8080, http://wsus, and https://wsus.contoso.com:8443.
· Failure Notification—Message that the iNode client displays when an access user fails the Windows patch check.
The following parameters are displayed only when the Check Manually option is selected:
· Patch Check Interval—Specifies the number of days to skip patch checking for an access user after the user has passed the patch check. When the Patch Check Interval is set to 0, EAD never skips patch checking.
· Patch Level—Severity levels of the Windows patches: Critical, Important, Moderate, and Low. EAD checks all patches of the selected severity levels.
· Patch Server Address—IPv4 address of the server from which users can download the required patches.
· IPv6 Patch Server Address—IPv6 address of the server from which users can download the required patches.
When an access user fails the Windows patch check, EAD sends the IPv4 address of the patch server to a user using IPv4 address, or the IPv6 address of the patch server to a user using IPv6 address. Operators can configure a file server, HTTP server, or FTP server to provide download services.
· Failure Notification—Message that the iNode client displays when an access user fails the Windows patch check.
Registry Control area
The registry control check takes effect only on Windows PCs.
· Check Registry—Indicates whether to check the registries on the user endpoint.
The following parameters are displayed only when the Check Registry option is selected:
· Registry Control Name—Name of the registry control policy used in the security policy. EAD checks registries on the user endpoint according to the selected registry control policies.
· Failure Notification—Message that the iNode client displays when an access user fails the registry control check.
Share Control area
The share control check takes effect only on Windows PCs.
· Check Share—Indicates whether to check the share directories on the user endpoint.
The following parameters are displayed only when the Check Share option is selected:
· Share Control—Name of the share control policy used in the security policy.
· Failure Notification—Message that the iNode client displays when an access user fails the share check.
Asset Registration Status Check area
The asset registration status check takes effect only on Windows PCs.
· Check Asset Registration Status—Indicates whether to check the asset registration status of the user endpoint.
· Grace Days for Unregistered Assets—Specifies how many days the system allows unregistered assets to pass the security check. During the grace days, the system sends a daily reminder for asset registration. After the grace days expire, the system executes the specified security mode in the security level settings if the assets are still not registered. The value of 0 indicates that unregistered assets cannot pass the security check.
· Failure Notification—Message that the iNode client displays when an access user fails the asset registration status check. This parameter is displayed only when the Check Asset Registration Status option is selected.
Windows System Restore area
This area has the following parameters:
· Check Windows System Restore—Check whether Windows system restore is enabled.
· Enable Data Execution Prevention—Checks whether data execution prevention is enabled. If the feature is disabled, the system automatically enables the feature on the user endpoint and the change takes effect after an operating system restart.
· Disable Guest Account—Checks whether the guest account is disabled. If the feature is enabled, the system automatically disables the feature on the user endpoint.
· Failure Notification—Message that the iNode client displays when an access user fails the Windows system restore check, data execution prevention check, or guest account check.
Periodic Check area
After a user comes online, the iNode client checks the endpoint of the user at regular intervals. The periodic check monitors the traffic and OS password settings on Windows PCs.
· Traffic Control—Name of the traffic control policy used in the security policy. It determines whether traffic processed by the endpoint is reasonable.
· Check Operating System Password—Indicates whether to periodically check the operating system password for the user endpoint.
The following parameters are displayed only when the Check Operating System Password option is selected:
· Check All Local Users—Select this option to check the operating system passwords of all local user accounts for the endpoint. If this option is not selected, EAD checks the password of the current login user only.
An endpoint fails the security check if the operating system password of the user is included in the IMC password dictionary or meets the built-in password rules on the iNode client.
· Check Dictionary File Only for IMC—Select this option to consult only the IMC password dictionary for password checking. If this option is not selected, EAD consults both IMC password dictionary and iNode client password rules for password checking.
· Add to Security Check—Select this option to check the operating system password of at the user login and during the periodic check. If this option is not selected, the iNode client checks the operating system password during the periodic check.
When the IMC password dictionary contains large number of entries, the security check will take a long time period.
· Failure Notification—Message that the iNode client displays when an access user fails the operating system password check.
External Storage Device Control area
If the Read-Only option is selected, endpoints that use the security policy can read data from external storage devices but cannot write data to storage devices.
Viewing the security policy list
1. Click the User tab.
2. From the navigation tree, select User Security Policy > Security Policy.
The security policy list displays all security policies.
3. Click Refresh to refresh the security policy list.
Viewing security policy details
To view IPv6 configurations, operators must enable IPv6 address support on UAM and EAD components by modifying UAM service parameters. For instructions on how to modify UAM service parameters, see HPE IMC User Access Manager Administrator Guide.
To view the details of a security policy:
1. Click the User tab.
2. From the navigation tree, select User Security Policy > Security Policy.
The security policy list displays all security policies.
3. Click the name of a security policy to view detailed information.
The View Security Policy page opens.
4. Click Back to return to the security policy list.
Adding a security policy
To perform IPv6 configurations, operators must enable IPv6 address support on UAM and EAD components by modifying UAM service parameters. For information about modifying UAM service parameters, see HPE IMC User Access Manager Administrator Guide.
To add a security policy:
1. Click the User tab.
2. From the navigation tree, select User Security Policy > Security Policy.
The security policy list displays all security policies.
3. Click Add.
The Add Security Policy page opens.
4. Configure the basic information for the security policy. The policy name must be unique in EAD.
5. Configure the parameters in the following areas as needed:
¡ Isolation Mode
¡ URL Control
¡ Anti-Virus Software Control
¡ Anti-Spyware Software Control
¡ Firewall Software Control
¡ Anti-Phishing Software Control
¡ Hard Disk Encryption Software Control
¡ Patch Software Control
¡ Windows Patch Control
¡ Registry Control
¡ Share Control
¡ Asset Registration Status Check
¡ Windows System Restore
¡ Periodic Check
¡ External Storage Device Control
6. To configure the parameters in the PC Software Control area:
a. Select Check PC Software Control.
b. Click Per-group Configuration.
The page for configuring software control groups opens.
c. Enter query criteria in the Query Software Control Groups area.
d. Click Query.
e. In the PC software control group list, select one or more PC software control groups.
f. From the Check Type list, select a check type for each PC software group.
g. In the Server Address field, enter a server address.
h. In the Failure Notification field, enter the notification message to be displayed on the user endpoint when PC software does not meet the requirements.
i. Click OK.
7. Click OK.
Modifying a security policy
To perform IPv6 configurations, operators must enable IPv6 address support on UAM and EAD components by modifying UAM service parameters. For information about modifying UAM service parameters, see HPE IMC User Access Manager Administrator Guide.
To modify a security policy:
1. Click the User tab.
2. From the navigation tree, select User Security Policy > Security Policy.
The security policy list displays all security policies.
3. For the security
policy you want to modify, click the Modify icon ![]() .
.
The Modify Security Policy page opens.
4. Modify the basic information for the security policy. You cannot modify Policy Name or Service Group.
5. Modify the parameters in the following areas as needed:
¡ Isolation Mode
¡ URL Control
¡ Anti-Virus Software Control
¡ Anti-Spyware Software Control
¡ Firewall Software Control
¡ Anti-Phishing Software Control
¡ Hard Disk Encryption Software Control
¡ Patch Software Control
¡ Windows Patch Control
¡ Registry Control
¡ Share Control
¡ Asset Registration Status Check
¡ Windows System Restore
¡ Periodic Check
6. To modify the parameters in the PC Software Control area:
a. Click Per-group Configuration.
The page for configuring software control groups opens.
b. In the Query Software Control Groups area, enter query criteria.
c. Click Query.
d. In the PC software control group list, select one or more PC software control groups.
e. From the Check Type list, select a check type for each PC software group.
f. Click OK.
7. Click OK.
Deleting a security policy
Before you delete a security policy, make sure it is not assigned to an access service.
To delete a security policy:
1. Click the User tab.
2. From the navigation tree, select User Security Policy > Security Policy.
The security policy list displays all security policies.
3. For the security
policy you want to delete,
click the Delete icon ![]() .
.
A confirmation dialog box opens.
4. Click OK.
Managing security levels
Making a security level action take effect
For the action specified for a check item in the security level to take effect, you must complete the following tasks:
1. Enable the security check item.
2. In the security policy, specify an associated control policy.
For example, to perform the specified action on an access user who fails the anti-virus software check:
1. In the security policy, enable the anti-virus software check.
2. Specify an anti-virus software policy.
Special cases
Abnormal traffic
For the action specified for abnormal traffic in the security level to take effect, you must enable the traffic monitoring function in the security policy and specify the items to be checked in the traffic monitoring policy.
For example, to enable the iNode client to perform the specified action on an access user whose IP traffic running on the authenticated NIC exceeds the minor threshold or severe threshold:
1. In the security policy, enable the traffic monitoring function.
2. Set the IP traffic thresholds.
WSUS/SMS Server Collaboration Failure and Auto-Installation Failure
For the action specified in the security level for WSUS/SMS Server Collaboration Failure and Auto-Installation Failure to take effect, enable the Check Through Microsoft Server feature in the security policy.
Security level list contents
The security level list has the following parameters:
· Security Level Name—Name of the security level. Click the name to view detailed information.
· Description—Description of the security level.
· Service Group—Service group to which the security level belongs.
· Modify—Click the Modify icon ![]() to modify the
security level settings.
to modify the
security level settings.
· Delete—Click the Delete icon ![]() to delete the
security level.
to delete the
security level.
Security level details
The security policy details page has the following areas:
· Basic Information—Basic information about the security level, including the security level name and the Action After parameter.
· PC—Security modes that define the actions to take in response to detected security violations for PCs.
· Smart Device—Security modes that define the actions to take in response to detected security violations for smart devices.
UAM identifies the security modes for PCs from the security modes for smart devices in the same security level according to the security policies used by the endpoints.
EAD supports the following security modes in descending order of severity:
· Blacklist and Kick Out—The EAD server works with the iNode client to add noncompliant users to the blacklist and log them off, and generates security logs for violations.
· Kick Out—The EAD server works with the iNode client to log off noncompliant users and generates security logs for violations.
· Isolate—The EAD server isolates noncompliant users in a restricted area, informs the users of the security vulnerability and remediation methods, and generates security logs for violations.
· Inform—The EAD server informs noncompliant users of the security vulnerability and remediation methods on user endpoints and generates security logs for violations.
· Monitor—The EAD server monitors noncompliant users and generates security logs for violations.
The following information describes security level parameters for PCs. For more information about configuring the security level for smart devices, see "Configuring the security check for smart devices."
Basic Information area
· Security Level Name—Name of the security level.
· Action After—Amount of time, in minutes, that the access user with a security check failure can access the network before being isolated or kicked out. During that time, the user can make the necessary remediation and initiate a new security check to prevent being isolated or kicked out. This parameter is available only when the Isolate, Kick Out, Guest, or Blacklist and Kick Out action is configured for a check item, excluding the traffic monitoring check and the operating system password check.
· Description—Description of the security level.
· Service Group—Service group to which the security level belongs.
Traffic Monitoring area
· IP Traffic Minor Threshold Exceeded—Action to take when the total IP traffic of all NICs on the user endpoint is above or equal to the IP Traffic Minor Threshold and below the IP Traffic Severe Threshold configured in the traffic control policy.
· IP Traffic Severe Threshold Exceeded—Action to take when the total IP traffic of all NICs on the user endpoint is above or equal to the IP Traffic Severe Threshold configured in the traffic control policy.
· Broadcast Packets Minor Threshold Exceeded—Action to take when the total number of broadcast packets sent by all NICs on the user endpoint is above or equal to the Broadcast Packets Minor Threshold and below the Broadcast Packets Severe Threshold configured in the traffic control policy.
· Broadcast Packets Severe Threshold Exceeded—Action to take when the total number of broadcast packets sent by all NICs on the user endpoint is above or equal to the Broadcast Packets Severe Threshold configured in the traffic control policy.
· Packets Minor Threshold Exceeded—Action to take when the total number of packets passing the authenticated NIC of the user endpoint is above or equal to the Packets Minor Threshold and below the Packets Severe Threshold configured in the traffic control policy.
· Packets Severe Threshold Exceeded—Action to take when the total number of packets passing the authenticated NIC of the user endpoint is above or equal to the Packets Severe Threshold configured in the traffic control policy. The authenticated NIC is used by an access user to pass identity authentication and to access the network.
· TCP/UDP Connections Minor Threshold Exceeded—Action to take when the total number of TCP/UDP connections of all NICs on the user endpoint is above or equal to the TCP/UDP Connections Minor Threshold and below the TCP/UDP Connections Severe Threshold configured in the traffic control policy.
· TCP/UDP Connections Severe Threshold Exceeded—Action to take when the total number of TCP/UDP connections of all NICs on the user endpoint is above or equal to the TCP/UDP Connections Severe Threshold configured in the traffic control policy.
Check Anti-Virus Software area
· Anti-Virus Software Not Installed—Action to take on an access user whose endpoint does not have anti-virus software installed.
· Anti-Virus Client Runtime Error—Action to take on an access user whose anti-virus software is faulty.
· Old Anti-Virus Software/Engine Version—Action to take on an access user whose anti-virus software version on the smart device or anti-virus engine version on the PC is lower than the version configured in the anti-virus software policy.
· Old Virus Definition Version—Action to take on an access user whose virus definition version is lower than the version configured in the anti-virus software policy.
Check Anti-Spyware Software area
· Anti-Spyware Software Not Installed—Action to take on an access user whose endpoint does not have the anti-spyware software installed.
· Anti-Spyware Client Runtime Error—Action to take on an access user whose anti-spyware software is faulty.
· Old Anti-Spyware Software/Engine Version—Action to take on an access user whose anti-spyware software version on the smart device or anti-spyware engine version on the PC is lower than the version configured in the anti-spyware software policy.
· Old Spyware Definition Version—Action to take on an access user whose spyware definition version is lower than the version configured in the anti-spyware software policy.
Check Firewall Software area
· Firewall Software Not Installed—Action to take on an access user whose endpoint does not have firewall software installed.
· Firewall Client Runtime Error—Action to take on an access user whose firewall software is faulty.
Check Anti-Phishing Software area
· Anti-Phishing Software Not Installed—Action to take on an access user whose endpoint does not have anti-phishing software installed.
· Anti-Phishing Software Runtime Error—Action to take on an access user whose anti-phishing software is faulty.
Check Hard Disk Encryption Software area
Hard Disk Encryption Software Not Installed—Action to take on an access user whose endpoint does not have hard disk encryption software installed.
Check PC Software Control Group area
· Global Security Mode—Action to take on an access user who violates any PC software control group specified for check in the security policy. In global security mode, you cannot view the names of the PC software control groups.
· Security Mode of a PC Software Control Group—Action to take on an access user who violates the PC software control group. When you configure actions specific to the PC software control groups, the Global Security Mode option is not displayed.
Check Patch Management Software area
· Patch Manager Software Not Installed—Action to take on an access user whose endpoint does not have patch software installed.
· Patch Manager Software Runtime Error—Action to take on an access user whose patch software is faulty.
Check Windows Patches area
· WSUS/SMS Server Collaboration Failure—Action to take on an access user when the iNode client cannot connect to the Microsoft WSUS or SMS server.
· Auto-Installation Failure—Action to take on an access user when automatic patch installation fails on the user endpoint.
· Critical—Action to take on an access user whose endpoint lacks a critical-level patch.
· Important—Action to take on an access user whose endpoint lacks an important-level patch.
· Moderate—Action to take on an access user whose endpoint lacks a moderate-level patch.
· Low—Action to take on an access user whose endpoint lacks a low-level patch.
Check Registry area
· Global Security Mode—Action to take on an access user who violates any registry control policies specified for check in the security policy. In global security mode, you cannot view the names of the registry control policies.
· Security Mode of a Specific Registry Control Policy—Action to take on an access user who violates the registry control policies. When you configure actions specific to the registry control policies, the Global Security Mode option is not displayed.
Check Share area
· Global Security Mode—Action to take on an access user who violates any share control policy specified for check in the security policy. In global security mode, you cannot view the names of the share control policies.
· Security Mode of a Specific Share Control Policy—Action to take on an access user who violates the share control policy. When you configure actions specific to each share control policy, the Global Security Mode option is not displayed.
Check Asset Registration Status area
Unregistered Assets—Action to take on an access user who uses an unregistered asset for network access.
Check Windows System Restore
· System Restore Disabled—Action to take on an access user who fails the Windows system restore check.
· Enable Data Execution Prevention—Action to take on an access user who fails the data execution prevention check.
· Disable Guest Account—Action to take on an access user who fails the guest account check.
Check Operating System Password area
Operating System Password Check Failed—Action to take on an access user who fails the operating system password check.
Viewing the security level list
1. Click the User tab.
2. From the navigation tree, select User Security Policy > Security Level.
The Security Level List displays all security levels.
3. Click Refresh to refresh the Security Level List.
Viewing security level details
1. Click the User tab.
2. From the navigation tree, select User Security Policy > Security Level.
The Security Level List displays all security levels.
3. Click the name of a security level to view detailed information.
The View Security Level page opens.
4. Click Back to return to the security level list.
Adding a security level
1. Click the User tab.
2. From the navigation tree, select User Security Policy > Security Level.
The Security Level List displays all security levels.
3. Click Add.
The Add Security Level page opens.
4. Configure the basic information for the security level. The name of the security level must be unique in EAD.
5. Configure the parameters in the following areas:
¡ Traffic Monitoring
¡ Check Anti-Virus Software
¡ Check Anti-Spyware Software
¡ Check Firewall Software
¡ Check Anti-Phishing Software
¡ Check Hard Disk Encryption Software
¡ Check PC Software Control Group
¡ Check Patch Management Software
¡ Check Windows Patches
¡ Check Registry
¡ Check Share
¡ Check Asset Registration Status
¡ Check Windows System Restore
¡ Check Operating System Password
6. Click OK.
Modifying a security level
The system-defined and user-defined security levels are displayed in the security level list and can be modified. During the real-time check, the EAD server determines whether a user who fails the check should be monitored, informed, isolated, or kicked out according to the modified security level.
To modify a security level:
1. Click the User tab.
2. From the navigation tree, select User Security Policy > Security Level.
The Security Level List displays all security levels.
3. For the security
level you want to modify, click the Modify icon ![]() .
.
The Modify Security Level page opens.
4. Modify the basic information for the security level. You cannot modify Security Level Name or Service Group.
5. Modify the parameters in the following areas:
¡ Traffic Monitoring
¡ Check Anti-Virus Software
¡ Check Anti-Spyware Software
¡ Check Firewall Software
¡ Check Anti-Phishing Software
¡ Check Hard Disk Encryption Software
¡ Check PC Software Control Group
¡ Check Patch Management Software
¡ Check Windows Patches
¡ Check Registry
¡ Check Share
¡ Check Asset Registration Status
¡ Check Windows System Restore
¡ Check Operating System Password
6. Click OK.
Deleting a security level
You cannot delete a security level that is assigned to a security policy. To delete the security level, make sure it is not assigned to a security policy. For more information about modifying a security policy, see "Modifying a security policy."
To delete a security level:
1. Click the User tab.
2. From the navigation tree, select User Security Policy > Security Level.
The Security Level List displays all security levels.
3. For the security
level you want to delete, click
the Delete icon ![]() .
.
A confirmation dialog box opens.
4. Click OK.
Managing client ACLs
Operators can use client ACLs to enhance network security for users connecting to access devices that do not support receiving the ACLs or ACL numbers deployed by EAD. EAD deploys client ACLs to endpoints that have the iNode client installed. Client ACLs might not be protected as well as device ACLs.
EAD deploys the client ACLs to endpoints of access users that pass identify authentication, and applies the client ACLs to the outgoing traffic of their respective authentication NICs. Client ACLs can be classified as follows:
· Isolation ACL—Allows insecure users to access only a restricted area to rectify security problems and reinitiate security authentication.
· Security ACL—Applies to all online access users that are not isolated.
Operators can add, modify, and delete client ACLs. Configure client ACLs only when the iNode client on the target user endpoints supports the client ACL feature. Otherwise, access users cannot log in after the client ACL deployment. The client ACL feature is available for Windows operating systems only.
Client ACL list contents
The client ACL list has the following parameters:
· ACL Name—Name of the client ACL. Click the name to view detailed information.
· Service Group—Name of the service group to which the client ACL belongs.
· Description—Description of the associated client ACL.
· Modify—Click the Modify icon ![]() to
modify the client ACL settings.
to
modify the client ACL settings.
· Delete—Click the Delete icon ![]() to delete the
client ACL.
to delete the
client ACL.
Client ACL details
The client ACL details page has a basic information area and an ACL rule list area.
Basic Information area
· ACL Name—Name of the client ACL.
· Default Action of ACL Rule—Action to take on IP packets that do not match any ACL rule.
¡ Permit—Permits IP packets that do not match any ACL rule on the ACL rule list to pass through.
¡ Deny—Drops IP packets that do not match any ACL rule on the ACL rule list.
· Description—Description of the client ACL.
· Service Group—Name of the service group to which the client ACL belongs.
ACL Rule List
· Matching Action—Action to take on IP packets that match the ACL rule.
¡ Permit—Permits IP packets that match the ACL rule to pass through.
¡ Deny—Drops IP packets that match the ACL rule.
· Protocol—Transport-layer protocol that the ACL rule matches. A protocol name (ICMP, TCP, or UDP) or protocol number matches the corresponding transport-layer protocol. If the ACL rule matches all transport-layer protocols, this field displays two hyphens (--).
· Dest IP—Destination IP address that the ACL rule matches.
· Mask—Subnet mask of the destination IP address.
· Dest Port—Destination port of IP packets. This field displays a value only when the transport-layer protocol of the ACL rule is TCP or UDP (if you selected TCP or UDP in the Protocol list). Otherwise, this field displays two hyphens (--).
The default setting is 0, which matches all destination ports.
· Source Port—Source port of IP packets. This field displays a value only when the transport-layer protocol of the ACL rule is TCP or UDP (if you selected TCP or UDP in the Protocol list). Otherwise, this field displays two hyphens (--).
The default setting is 0, which matches all source ports.
· Priority—Priority of the ACL rule. The ACL rules are arranged in descending
priority order. An ACL rule with a higher priority is preferentially matched. To
adjust the list, click the Move Up icon ![]() or Move Down icon
or Move Down icon ![]() .
.
Viewing the client ACL list
1. Click the User tab.
2. From the navigation tree, select User Security Policy > Endpoint Access Control > Client ACL.
The Client ACL List displays all client ACLs.
3. Click Refresh to refresh the Client ACL List.
Viewing client ACL details
1. Click the User tab.
2. From the navigation tree, select User Security Policy > Endpoint Access Control > Client ACL.
The Client ACL List displays all client ACLs.
3. Click the name of a client ACL to view detailed information.
The View Client ACL page opens.
4. Click Back to return to the client ACL list.
Adding a client ACL
1. Click the User tab.
2. From the navigation tree, select User Security Policy > Endpoint Access Control > Client ACL.
The client ACL list displays all client ACLs.
3. Click Add.
The Add Client ACL page opens.
4. Configure basic information for the client ACL. The ACL name must be unique in EAD.
5. In the ACL Rule Information area, click Add.
The Add Client ACL Rule page opens.
6. Configure the ACL rule parameters and click OK.
The new ACL rule opens on the ACL Rule List.
Repeat step 5 and step 6 to add more ACL rules as needed.
7. Adjust priorities for the ACL rules.
ACL rules are sorted in descending
priority order. To change rule positions
on the ACL Rule List, click
the Move
Up icon ![]() or Move Down icon
or Move Down icon ![]() .
.
8. Click OK.
Modifying a client ACL
1. Click the User tab.
2. From the navigation tree, select User Security Policy > Endpoint Access Control > Client ACL.
The client ACL list displays all client ACLs.
3. For the client ACL
you want to modify, click the Modify icon ![]() .
.
The Modify Client ACL page opens.
4. Modify the basic information for the client ACL. The ACL Name and Service Group fields cannot be modified.
5. Modify the ACL rules by using one or more of the following methods:
¡ To add an ACL rule to the end of the ACL rule list, in the ACL Rule Information area click Add.
¡ To
insert a new ACL rule after an existing ACL rule, click the Add icon ![]() .
.
¡ To
modify an existing ACL rule on the ACL Rule List, click
the Modify icon ![]() .
.
¡ To
delete an unwanted ACL rule, click the Delete icon ![]() .
.
6. Adjust priorities for the ACL rules.
ACL rules are sorted in descending
priority order. To change rule
positions on the ACL Rule List,
click the Move
Up icon ![]() or the Move Down icon
or the Move Down icon ![]() .
.
7. Click OK.
Deleting a client ACL
A client ACL cannot be deleted when it is assigned to a security policy. To delete the client ACL, first remove it from the security policy. For more information about modifying a security policy, see "Modifying a security policy."
To delete a client ACL:
1. Click the User tab.
2. From the navigation tree, select User Security Policy > Endpoint Access Control > Client ACL.
The client ACL list displays all client ACLs.
3. For the client ACL
you want to delete, click the Delete icon ![]() .
.
A confirmation dialog box opens.
4. Click OK.
Managing URL control policies
URL access control can be implemented through a URL control policy and an optional Hosts file check. When a user accesses the network, EAD sends the URL control policy and the Hosts file contents to the iNode client to check HTTP access.
· URL control policy—The iNode client:
¡ Parses the HTTP packets of access users according to the URL control policy.
¡ Prevents users from accessing specified websites by IP address and domain name.
You can configure the following contents in a URL control policy:
¡ An IP URL default action
¡ A domain URL default action
¡ An action (permit or deny) for an IP URL group or domain URL group
Before you configure a URL control policy, first configure domain URL groups and IP URL groups. For more information about configuring:
¡ An IP URL group, see "Managing IP URL groups."
¡ A domain URL group, see "Managing domain URL groups."
· Hosts file check—A user might bypass the URL control policy by modifying the Hosts file of the operating system to access a prohibited URL. For example, a Windows 7 user can locate and modify the Hosts file in the directory C:\WINDOWS\system32\drivers\etc\hosts. Enable Hosts file checking and configure the contents to be checked in the security policy. When the Hosts file contains items that are not URL check items, the iNode client immediately logs out the user and displays a security violation message.
URL control policy list contents
The URL control policy list has the following parameters:
· URL Control Policy Name—Name of the URL control policy.
· Description—Description of the URL control policy.
· Service Group—Name of the service group to which the URL control policy belongs.
· Modify—Click the Modify icon ![]() to modify
settings of the URL control policy.
to modify
settings of the URL control policy.
· Delete—Click the Delete icon ![]() for the URL
control policy you want to delete.
for the URL
control policy you want to delete.
URL control policy details
The URL control policy details page has basic information area, a domain URL check item list area, and an IP URL check item list area.
Basic Information area
· URL Control Policy Name—Name of the URL control policy.
· Domain URL Default Action—Action to take on domain URL accesses that do not match a domain URL check item. The action can be Permit or Deny. The domain URL default action is applied to any domain URL accesses that do not match a domain URL check item.
· IP URL Default Action—Action to take on IP URL accesses that do not match an IP URL check item. The action can be Permit or Deny. The IP URL default action applies to any IP URL accesses that do not match an IP URL check item.
· Service Group—Name of the service group to which the URL control policy belongs.
· Description—Description of the URL control policy.
Domain URL Check Item List
· Domain URL Group—Name of the domain URL group. For more information, see "Adding a domain URL group."
· Action—Action to take on domain URL accesses that match the domain URL group. The action can be Permit or Deny.
· Description—Description of the domain URL group.
· Priority (Descending)—Priority of the domain URL group. Domain URL groups are
arranged in descending priority order. When the domain URL of the website to be
accessed matches multiple groups,
the domain URL group with the
highest priority applies. To adjust the list, click the Move
Up icon ![]() or Move Down icon
or Move Down icon ![]() .
.
IP URL Check Item List
· IP URL Group—Name of the IP URL group. For more information, see "Adding an IP URL group."
· Action—Action to take on IP URL accesses that match the IP URL group. The action can be Permit or Deny.
· Description—Description of the IP URL check item.
· Priority (Descending)—Priority of the IP URL check item. IP URL check items are arranged
in descending priority order. When the IP URL of the website to be accessed
matches multiple groups, the IP
URL check item with the highest priority applies. To adjust the list, click the
Move Up icon ![]() or Move Down icon
or Move Down icon ![]() .
.
Viewing the URL control policy list
1. Click the User tab.
2. From the navigation tree, select User Security Policy > Endpoint Access Control > URL Control Policy.
The URL control policy list displays all URL control policies.
3. Click Refresh to refresh the URL control policy list.
Viewing the URL control policy details
1. Click the User tab.
2. From the navigation tree, select User Security Policy > Endpoint Access Control > URL Control Policy.
The URL control policy list displays all URL control policies.
3. Click the name of a URL control policy to view detailed information.
The URL Control Policy Details page opens.
4. Click Back to return to the URL control policy list.
Adding a URL control policy
1. Click the User tab.
2. From the navigation tree, select User Security Policy > Endpoint Access Control > URL Control Policy.
The URL control policy list displays all URL control policies.
3. Click Add.
The Add URL Control Policy page opens.
4. Configure basic information for the URL control policy. The policy name must be unique in EAD.
5. In the Domain URL Check Items List area, click Add.
The Add Domain URL Group page opens.
6. Configure the parameters and click OK.
The new domain URL check item is added to the Domain URL Check Item List area.
Repeat step 5 and step 6 to add more domain URL check items, as needed.
7. Adjust priorities for the domain URL check items.
Domain URL check items are sorted in
descending priority order. To adjust the list, click the Move Up icon ![]() or Move Down icon
or Move Down icon ![]() .
.
8. In the IP URL Check Items List area, click Add.
The Add IP URL Check Group page opens.
9. Configure the parameters and click OK.
The new IP URL check item is added to the IP URL Check Item List area.
To add more IP URL check items as needed, repeat step 8 and step 9.
10. Adjust priorities for the IP URL check items.
IP URL check items are sorted in
descending priority order. To adjust the list, click the
Move Up icon ![]() or Move Down icon
or Move Down icon ![]() .
.
11. Click OK.
Modifying a URL control policy
1. Click the User tab.
2. From the navigation tree, select User Security Policy > Endpoint Access Control > URL Control Policy.
The URL control policy list displays all URL control policies.
3. For the URL control policy you want to
modify, click the Modify icon ![]() .
.
The Modify URL Control Policy page opens.
4. Configure basic information for the URL control policy. You cannot modify URL Control Policy Name or Service Group.
5. Modify the domain URL check items by using one or more of the following methods:
¡ To add a domain URL check item, in the Domain URL Check Item List area click Add .
¡ For an
unwanted domain URL check item, click the Delete
icon ![]() to
delete the item.
to
delete the item.
6. Adjust priorities for the domain URL check items.
Domain URL check items are sorted in
descending priority order. To adjust the list, click the Move Up icon ![]() or Move Down icon
or Move Down icon ![]() .
.
7. Modify the IP URL check items by using one or more of the following methods:
¡ To add an IP URL check item, in the IP URL Check Item List area Click Add.
¡ For an
unwanted IP URL check item, click the Delete icon ![]() to delete the
item.
to delete the
item.
8. Adjust priorities for the IP URL check items.
IP URL check items are sorted in
descending priority order. To adjust the list, click the Move Up icon ![]() or Move Down icon
or Move Down icon ![]() .
.
9. Click OK.
Deleting a URL control policy
Before deleting a URL control policy that is assigned to a security policy, you must first remove their associations. For more information about deleting a URL control policy, see "Modifying a security policy."
To delete a URL control policy:
1. Click the User tab.
2. From the navigation tree, select User Security Policy > Endpoint Access Control > URL Control Policy.
The URL control policy list displays all URL control policies.
3. For the URL control policy you want to delete, click the Delete icon ![]() .
.
A confirmation dialog box opens.
4. Click OK.
Managing domain URL groups
A domain URL group is a set of website domain names. The iNode client parses the HTTP packets of access users, compares the domain names to be accessed with the domain URL check items in the URL control policy, and permits or denies user access based on the comparison results.
The domain URL check supports fuzzy matching. For example, when you specify yahoo in the domain URL group, a user's access to the websites www.yahoo.com, mail.yahoo.com, and www.yahoo.org, which contain yahoo, is permitted or denied as configured.
Domain URL group list contents
The domain URL group list has the following parameters:
· Domain URL Group Name—Name of the domain URL group.
· Description—Description of the domain URL group.
· Service Group—Name of the service group to which the domain URL group belongs.
· Config—To configure URL check items for the domain
URL group, click the Config icon ![]() .
.
· Modify—To modify the domain URL group settings,.click the Modify icon ![]()
· Delete—To delete the domain URL group, click the Delete icon ![]() .
.
Domain URL group details
The domain URL group details page has the following basic parameters:
· Domain URL Group Name—Name of the domain URL group.
· Service Group—Name of the service group to which the domain URL group belongs.
· Description—Description of the domain URL group.
Domain URL item list contents
The domain URL item list has the following parameters:
· Domain—Domain name of the website.
· Description—Description of the domain name.
· Modify—To modify the domain URL check item, click the Modify icon ![]() .
.
· Delete—To delete the domain URL check item, click the Delete icon ![]() .
.
Viewing the domain URL group list
To view the domain URL group list:
1. Click the User tab.
2. From the navigation tree, select User Security Policy > Endpoint Access Control > Domain URL Group.
The domain URL group list displays all domain URL groups.
3. Click Refresh to refresh the domain URL group list.
Viewing the domain URL group details
To view the domain URL group details:
1. Click the User tab.
2. From the navigation tree, select User Security Policy > Endpoint Access Control > Domain URL Group.
The domain URL group list displays all domain URL groups.
3. Click the name of a domain URL group to view detailed information.
The Domain URL Group Details page opens.
4. Click Back to return to the domain URL group list.
Adding a domain URL group
To add a domain URL group:
1. Click the User tab.
2. From the navigation tree, select User Security Policy > Endpoint Access Control > Domain URL Group.
The domain URL group list displays all domain URL groups.
3. Click Add.
The Add Domain URL Group page opens.
4. Configure the basic information for the domain URL group.
5. Click OK.
Configuring a domain URL group
To configure domain URL group:
1. Click the User tab.
2. From the navigation tree, select User Security Policy > Endpoint Access Control > Domain URL Group.
The domain URL group list displays all domain URL groups.
3. For a target domain URL group,
click the Config
icon ![]() .
.
The domain URL item list displays all domain URL items in the domain URL group.
4. To add a domain URL item, click Add.
a. In the Domain
field, enter the domain name of the website.
In the Description field, enter a description of
the domain name.
b. Click OK.
To add more domain URL check items, repeat Step 4 as needed.
5. To import domain URL check items, click Import:
a. Browse to and select the file to be imported, and then select a column separator for the file. Options are space, tab character, comma (,), colon (:), pound sign (#), and dollar sign ($). The file must be in TXT format.
b. Click Next.
c. From the Domain list, select the column that contains the domain names. Then from the Description list, select the column that contains the domain URL check item descriptions. When you select Not Import from File from the Description list, in the field to the right enter a description for all imported domain URL check items.
d. Click Preview to preview the file import result.
e. Click OK.
f. Click Back to return to the Config Domain URL Group page.
6. Query domain URL items:
a. In the Domain field, enter a partial or complete domain name of the website.
b. Click Query.
The Domain URL Item List displays all domain URL items that match the query criterion.
c. Click Reset to clear the query criterion.
The domain URL item list displays all domain URL items in the domain URL group.
7. Modify a domain URL item:
a. For the target domain URL item, click the Modify icon ![]() .
.
The Modify Domain URL Item page opens.
b. For the domain URL item, modify the following parameters:
Domain—Modify the domain name of the website.
Description—Modify the description of the domain name.
c. Click OK.
8. To delete a domain URL item:
a. For the target domain URL item, click the Delete icon ![]() .
.
b. Click OK.
9. Click OK.
Modifying a domain URL group
To modify a domain URL group:
1. Click the User tab.
2. From the navigation tree, select User Security Policy > Endpoint Access Control > Domain URL Group.
The domain URL group list displays all domain URL groups.
3. For a target domain URL group,
click the Modify icon ![]() .
.
4. Modify the domain URL group. The Domain URL Group Name and Service Group cannot be modified.
5. Click OK.
Deleting a domain URL group
If a domain URL group is assigned to a URL control policy, it cannot be deleted. To delete the domain URL group, first remove it from the URL control policy. For more information, see "Modifying a URL control policy."
To delete a domain URL group:
1. Click the User tab.
2. From the navigation tree, select User Security Policy > Endpoint Access Control > Domain URL Group.
The domain URL group list displays all domain URL groups.
3. For the domain URL group you want to delete, click the Delete icon ![]() .
.
A confirmation dialog box opens.
4. Click OK.
Managing IP URL groups
An IP URL group is a set of website IP addresses. Access users can access these websites through IP addresses without DNS. The iNode client:
· Parses the HTTP packets of access users.
· Compares the IP addresses to be accessed with the IP URL check items in the URL control policy.
· Permits or denies user access based on the comparison result.
IP URL group list contents
The IP URL group list has the following parameters:
· IP URL Group Name—Name of the IP URL group.
· Description—Description of the IP URL group.
· Service Group—Name of the service group to which the IP URL group belongs.
· Modify—To modify the IP URL group settings, click the Modify icon ![]() .
.
· Delete—To delete the IP URL group, click the Delete icon ![]() .
.
IP URL group details
The IP URL group details page has a basic information area and an IP URL item list area.
Basic Information area
· IP URL Group Name—Name of the IP URL group.
· Service Group—Name of the service group to which the IP URL group belongs.
· Description—Description of the IP URL group.
IP URL Item List area
· Start IP—Start IP address of the IP URL check item.
· End IP—End IP address of the IP URL check item.
· Description—Description of the IP segment.
Viewing the IP URL group list
1. Click the User tab.
2. From the navigation tree, select User Security Policy > Endpoint Access Control > IP URL Group.
The IP URL group list displays all IP URL groups.
3. Click Refresh to refresh the IP URL group list.
Viewing the IP URL group details
1. Click the User tab.
2. From the navigation tree, select User Security Policy > Endpoint Access Control > IP URL Group.
The IP URL group list displays all IP URL groups.
3. Click the name of an IP URL group to view detailed information.
The IP URL Group Details page opens.
4. Click Back to return to the IP URL Group List.
Adding an IP URL group
1. Click the User tab.
2. From the navigation tree, select User Security Policy > Endpoint Access Control > IP URL Group.
The IP URL group list displays all IP URL groups.
3. Click Add.
The Add IP URL Group page opens.
4. Configure the basic information for the IP URL group.
5. Add an IP URL item:
a. Click Add.
The Add IP URL Item page opens.
b. Configure the following parameters:
- Start IP—Enter the start IP address of the website IP segment.
- End IP—Enter the end IP address of the website IP segment.
- Description—Enter the description of the website IP segment.
c. Click OK to add the IP URL item.
6. Click OK.
Modifying an IP URL group
1. Click the User tab.
2. From the navigation tree, select User Security Policy > Endpoint Access Control > IP URL Group.
The IP URL group list displays all IP URL groups.
3. To modify an IP URL group, click the Modify icon ![]() .
.
The IP URL Group Name and Service Group cannot be modified.
4. To add an new IP URL item:
a. Click Add.
b. Configure the following parameters:
- Start IP—Enter the start IP address of the website IP segment.
- End IP—Enter the end IP address of the website IP segment.
- Description—Enter the description of the website IP segment.
c. Click OK.
To add IP URL items, repeat Step 4 as needed.
5. To modify an IP URL item:
a. For the target IP URL item, click the Modify icon ![]() .
.
The Modify IP URL Item page opens.
b. Modify the following parameters for the IP URL:
- Start IP—Modify the start IP address of the website IP segment.
- End IP—Modify the end IP address of the website IP segment.
- Description—Modify the description of the website IP segment.
c. Click OK.
6. To delete an IP URL item:
a. For the target IP URL item, click the Delete icon ![]() .
.
b. Click OK.
7. Click OK.
Deleting an IP URL group
If an IP URL group is assigned to a URL control policy, it cannot be deleted. To delete the IP URL group, first remove it from the URL control policy. For more information, see "Modifying a URL control policy."
To delete an IP URL group:
1. Click the User tab.
2. From the navigation tree, select User Security Policy > Endpoint Access Control > IP URL Group.
The IP URL group list displays all IP URL groups.
3. For the IP URL group you want to delete, click the Delete icon ![]() .
.
A confirmation dialog box opens.
4. Click OK.
Managing anti-virus software policies
The system defines anti-virus software control for several types of anti-virus software in Windows, Linux, and Mac OS. You can enable anti-virus software control in a security policy and specify an anti-virus software policy. The anti-virus software policy determines whether:
· An anti-virus software type application control is installed and running.
· The anti-virus engine version and virus definition version match the policy.
When an access user is authenticated, the iNode client checks the anti-virus software on the user endpoint according to the configuration in the security policy.
Anti-virus software policy management allows you to view, add, modify, and delete an anti-virus software policy. You can specify the anti-virus software type application controls to be checked and the anti-virus engine version and virus definition version.
Anti-virus software policy list contents
The anti-virus software policy list has the following parameters:
· Anti-Virus Software Policy Name—Name of the anti-virus software policy. Click the name to view detailed information.
· Service Group—Service group to which the anti-virus software policy belongs.
· Description—Description of the anti-virus software policy.
· Modify—To modify the anti-virus software policy, click the Modify icon ![]() .
.
· Delete—To delete the anti-virus software policy, click the Delete icon ![]() .
.
Anti-virus software policy details
The anti-virus software policy details page has a basic information area and areas for Windows, Linux, and Mac OS.
Basic information area
· Policy Name—Name of the anti-virus software policy.
· Service Group—Service group to which the anti-virus software policy belongs.
· Description—Description of the anti-virus software policy.
Windows, Linux, and Mac OS areas
The Windows, Linux, and Mac OS areas list the anti-virus software that can be checked by the iNode client.
· Anti-Virus Software—Name of the anti-virus software.
· Vendor—Vendor name of the anti-virus software.
· Check Items—Indicates whether the anti-virus engine version and virus definition version are checked for the corresponding anti-virus software.
¡ Check anti-virus engine version—When this parameter is selected, the anti-virus engine version must be checked. Otherwise, the anti-virus engine version is not checked.
¡ Check virus definition version—When this parameter is selected, the virus definition version must be checked. Otherwise, the virus definition version is not checked.
· Restriction—Check rules for the anti-virus software policy. When this field is empty, no rules are set for the anti-virus software.
¡ Anti-Virus Engine Adaptation Period (in days)—Adaptation period for the anti-virus engine. This option is valid only when the anti-virus engine is in YYYY-MM-DD format. When the anti-virus engine is updated within the adaptation period, the anti-virus engine version check is passed.
¡ Lowest Version of Anti-Virus Engine—Lowest version of the anti-virus engine allowed by the anti-virus software policy. An anti-virus software policy supports two anti-virus engine version formats: YYYY-MM-DD, where YYYY is the four-digit year, MM is the two-digit month, and DD is the two-digit day; and XX.XX.XX, for example, 7.100.1003.
¡ Virus Definition Adaptation Period (in days)—Adaptation period for the virus definition of the anti-virus software. This option is valid only when the virus definition is in YYYY-MM-DD format. When the virus definition is updated within the adaptation period, the virus definition version check is passed.
¡ Lowest Version of Virus Definition—Lowest version of the virus definition allowed by the anti-virus software policy. An anti-virus software policy supports two virus definition version formats: YYYY-MM-DD, where YYYY is the four-digit year, MM is the two-digit month, and DD is the two-digit day; and XX.XX.XX, for example, 2.343.000.
· Check—Indicates whether the corresponding anti-virus software will be checked.
· Priority—The iNode client checks the anti-virus software based on the
priority. Items are listed in descending priority order (most important first).
To adjust the list, click the Move Up icon ![]() or Move Down icon
or Move Down icon ![]() .
.
Viewing the anti-virus software policy list
1. Click the User tab.
2. From the navigation tree, select User Security Policy > Security Software Policy > Anti-Virus.
The anti-virus software policy list displays all anti-virus software policies.
3. Click Refresh to refresh the anti-virus software policy list.
Viewing anti-virus software policy details
1. Click the User tab.
2. From the navigation tree, select User Security Policy > Security Software Policy > Anti-Virus.
The anti-virus software policy list displays all anti-virus software policies.
3. Click the name of an anti-virus software policy to view detailed information.
The View Anti-Virus Software Policy page opens.
4. Click Back to return to the anti-virus software policy list.
Adding an anti-virus software policy
1. Click the User tab.
2. From the navigation tree, select User Security Policy > Security Software Policy > Anti-Virus.
The anti-virus software policy list displays all anti-virus software policies.
3. Click Add.
The Add Anti-Virus Software Policy page opens.
4. Configure the basic information for the anti-virus software policy.
5. Configure the Second-Check Interval parameter.
If the first check fails, the system does not report the check result. After the second-check interval expires, the system performs another check, and reports the check result if the check still fails. The value range for this parameter is 0 to 60 seconds. A value of 0 causes the system to immediately report the check failure result.
6. To check an anti-virus software product in the anti-virus software policy, in the Check field select the box for the anti-virus software.
7. Modify the anti-virus software check:
a. For the anti-virus software
you want to modify, click the Modify icon ![]() .
.
The Anti-Virus Software Settings dialog box opens.
b. In the Anti-Virus software field, modify the anti-virus software name as needed.
c. To check the anti-virus engine version, select the box next to Check anti-virus engine version and select an anti-virus engine version format:
- Dotted format—Valid version format is XX.XX.XX, for example, 7.100.1003.
- Date format—Valid date format is YYYY-MM-DD, where YYYY is the four-digit year, MM is the two-digit month, and DD is the two-digit day.
- Date or dotted format—Dotted format and date format are valid.
Different version formats require different parameters, as shown in Table 16.
Table 16 Version formats and parameters
|
Version format |
Notification |
Version check mode |
Parameter |
|
Date format |
YYYY-MM-DD |
Specified Version |
Lowest Version of Anti-Virus Engine |
|
Auto Adaptive |
Adaptation Period (in days) |
||
|
Dotted format |
XX.XX.XX |
Specified Version |
Lowest Version of Anti-Virus Engine |
d. From the Version Check Mode list, select a version check mode: Specified Version or Auto Adaptive.
- Specified Version—If the user endpoint is a later version than the specified version, the version check is passed. If not, the version check fails.
If the version check mode is Specified Version and the version
format is Date format, either enter the date manually or click the Calendar icon ![]() next to the Lowest Version of Anti-Virus Engine field to select a date.
next to the Lowest Version of Anti-Virus Engine field to select a date.
If the version check mode is Specified Version and the version format is Dotted format, enter the version in the Lowest Version of Anti-Virus Engine field. A valid version format is XX.XX.XX, for example, 7.100.1003.
- Auto Adaptive—If the user endpoint version has been updated within the adaptation period, the version check is passed. If not, the version check fails.
If the version check mode is Auto Adaptive and the version format is Date format, in the Adaptation Period (in days) field manually enter the adaptation period.
e. To check the virus definition version, select the box next to Check virus definition version and select a virus definition version format:
- Dotted format—Valid version format is XX.XX.XX, for example, 2.343.00.
- Date format—Valid date format is YYYY-MM-DD, where YYYY is the four-digit year, MM is the two-digit month, and DD is the two-digit day.
- Date or dotted format—Dotted format and date format are valid.
Different version formats require different parameters, as shown in Table 17.
Table 17 Version formats and parameters
|
Version format |
Notification |
Version check mode |
Parameter |
|
Date format |
YYYY-MM-DD |
Specified Version |
Lowest Version of Virus Definition |
|
Auto Adaptive |
Adaptation Period (in days) |
||
|
Dotted format |
XX.XX.XX |
Specified Version |
Lowest Version of Virus Definition |
f. From the Version Check Mode list, select a version check mode: Specified Version or Auto Adaptive. For more information about check modes, see the documentation for the Anti-Virus Engine version.
g. Click OK.
8. To adjust the
anti-virus software position in the list, in the Priority field
of the anti-virus software policy list, click the Move Up icon ![]() or Move Down icon
or Move Down icon ![]() .
.
The iNode client checks whether any anti-virus software in the anti-virus software list runs on the terminal in the order of priority. The iNode client only reports the status of the first detected anti-virus software to the security policy server and ignores other anti-virus software.
9. Click OK.
The added anti-virus software policy is also available on the security policy configuration page. For more information, see "Managing security policies."
Modifying an anti-virus software policy
1. Click the User tab.
2. From the navigation tree, select User Security Policy > Security Software Policy > Anti-Virus.
The anti-virus software policy list displays all anti-virus software policies.
3. For the anti-virus software policy you want
to modify, click the Modify icon ![]() .
.
The Modify Anti-Virus Software Policy page opens.
4. Modify the basic information for the anti-virus software policy. You cannot modify Policy Name or Service Group.
5. To check an anti-virus software product in the anti-virus software policy, in the Check field select the box for the anti-virus software.
6. Modify the anti-virus software check:
a. For the anti-virus software you want to
modify, click the Modify icon ![]() .
.
The Anti-Virus Software Settings dialog box opens.
b. In the Anti-Virus software field, modify the anti-virus software name as needed.
c. To check the anti-virus engine version, select the box next to Check anti-virus engine version and select an anti-virus engine version format:
- Dotted format—Valid version format is XX.XX.XX, for example, 7.100.1003.
- Date format—Valid date format is YYYY-MM-DD, where YYYY is the four-digit year, MM is the two-digit month, and DD is the two-digit day.
- Date or dotted format—Dotted format and date format are valid.
Different version formats require different parameters as shown in Table 18.
Table 18 Version formats and parameters
|
Version format |
Notification |
Version check mode |
Parameter |
|
Date format |
YYYY-MM-DD |
Specified Version |
Lowest Version of Anti-Virus Engine |
|
Auto Adaptive |
Adaptation Period (in days) |
||
|
Dotted format |
XX.XX.XX |
Specified Version |
Lowest Version of Anti-Virus Engine |
d. From the Version Check Mode list, select a version check mode: Specified Version or Auto Adaptive,.
- Specified Version—If the user endpoint is a later version than the specified version, the version check is passed. If not, the version check fails.
If the version check mode is Specified Version and the version
format is Date format, either enter the date manually or click the Calendar icon ![]() next to the Lowest Version of Anti-Virus Engine field to select a date.
next to the Lowest Version of Anti-Virus Engine field to select a date.
If the version check mode is Specified Version and the version format is Dotted format, enter the version in the Lowest Version of Anti-Virus Engine field. A valid version format is XX.XX.XX, for example, 7.100.1003.
- Auto Adaptive—If the user endpoint version has been updated within the adaptation period, the version check is passed. If not, the version check fails.
If the version check mode is Auto Adaptive and the version format is Date format, manually enter the adaptation period in the Adaptation Period (in days) field.
e. To check the virus definition version, select the box next to Check virus definition version and select a virus definition version format:
- Dotted format—Valid version format is XX.XX.XX, for example, 2.343.00.
- Date format—Valid date format is YYYY-MM-DD, where YYYY is the four-digit year, MM is the two-digit month, and DD is the two-digit day.
- Date or dotted format—Dotted format and date format are valid.
Different version formats require different parameters as shown in _Ref349821206.
Table 19 Version formats and parameters
|
Version format |
Notification |
Version check mode |
Parameter |
|
Date format |
YYYY-MM-DD |
Specified Version |
Lowest Version of Virus Definition |
|
Auto Adaptive |
Adaptation Period (in days) |
||
|
Dotted format |
XX.XX.XX |
Specified Version |
Lowest Version of Virus Definition |
f. From the Version Check Mode list, select a version check mode: Specified Version or Auto Adaptive. For more information about check modes, see the documentation for the Anti-Virus Engine version.
g. Click OK.
7. To adjust the
anti-virus software position in the list, in the Priority field
of the anti-virus software policy list click the Move Up icon ![]() or Move Down icon
or Move Down icon ![]() .
.
8. Click OK.
Deleting an anti-virus software policy
If an anti-virus software policy is assigned to a security policy, it cannot be deleted. To delete the anti-virus software policy, first remove it from the security policy. For more information, see "Modifying a security policy."
To delete an anti-virus software policy:
1. Click the User tab.
2. From the navigation tree, select User Security Policy > Security Software Policy > Anti-Virus.
The anti-virus software policy list displays all anti-virus software policies.
3. For the anti-virus software policy you want
to delete, click the Delete icon ![]() .
.
A confirmation dialog box opens.
4. Click OK.
Managing anti-spyware software policies
The system defines anti-spyware software control for several types of anti-spyware software in both Windows and Mac OS. You can enable anti-spyware software control in a security policy and specify an anti-spyware software policy. The anti-spyware software policy determines whether:
· An anti-spyware software type application control is installed and running.
· The anti-spyware engine version and spyware definition version match the policy.
When an access user is authenticated, the iNode client checks the anti-spyware software on the user endpoint according to the configuration in the security policy.
Anti-spyware software policy management allows you to view, add, modify, and delete an anti-spyware software policy. You can specify the anti-spyware products to be checked and the spyware definition version and anti-spyware engine version.
Anti-spyware software policy list contents
The anti-spyware software policy list has the following parameters:
· Anti-Spyware Software Policy Name—Name of the anti-spyware software policy. Click the name to view detailed information.
· Service Group—Service group to which the anti-spyware software policy belongs.
· Description—Description of the anti-spyware software policy.
· Modify—To modify the anti-spyware software policy, click the Modify icon ![]() .
.
· Delete—To delete the anti-spyware software policy, Click the Delete icon ![]() .
.
Anti-spyware software policy details
The anti-spyware software policy details page has a basic information area and areas for Windows and Mac OS.
Basic information area
· Policy Name—Name of the anti-spyware software policy.
· Service Group—Service group to which the anti-spyware software policy belongs.
· Description—Description of the associated anti-spyware software policy.
Windows and Mac OS areas
These areas list the anti-spyware software that can be checked by the iNode client on the corresponding operating system.
· Anti-Spyware Software—Name of the anti-spyware software.
· Vendor—Vendor name of the anti-spyware software.
· Check Items—Indicates whether the engine version and spyware definition version of the anti-spyware software are checked.
¡ Check anti-spyware engine version—When this parameter is selected, the engine version must be checked. Otherwise, engine version is not checked.
¡ Check spyware definition version—When this parameter is selected, the spyware definition version must be checked. Otherwise, the spyware definition version is not checked.
· Restriction—Check rules for the anti-spyware software policy. When this field is empty, no rules are set for the anti-spyware software.
¡ Lowest Version of Anti-Spyware Engine—Lowest version of the anti-spyware engine allowed by the anti-spyware software policy. An anti-spyware software policy supports the format XX.XX.XX, for example, 2009.6.18.169.
¡ Lowest Version of Anti-Spyware Definition—Lowest version of the anti-spyware definition allowed by the anti-spyware software policy. An anti-spyware software policy supports the format YYYY-MM-DD, where YYYY is the four-digit year, MM is the two-digit month, and DD is the two-digit day.
· Check—Indicates whether the corresponding anti-spyware software will be checked.
· Priority—Order (descending) in which the iNode client checks the anti-spyware software.
Viewing the anti-spyware software policy list
1. Click the User tab.
2. From the navigation tree, select User Security Policy > Security Software Policy > Anti-Spyware.
The anti-spyware software policy list displays all anti-spyware software policies.
3. Click Refresh to refresh the anti-spyware software policy list.
Viewing anti-spyware software policy details
To view details of an anti-spyware software policy:
1. Click the User tab.
2. From the navigation tree, select User Security Policy > Security Software Policy > Anti-Spyware.
The anti-spyware software policy list displays all anti-spyware software policies.
3. Click the name of an anti-spyware software policy to view detailed information.
The View Anti-Spyware Software Policy page opens.
4. Click Back to return to the anti-spyware software policy list.
Adding an anti-spyware software policy
To add an anti-spyware software policy:
1. Click the User tab.
2. From the navigation tree, select User Security Policy > Security Software Policy > Anti-Spyware.
The anti-spyware software policy list displays all anti-spyware software policies.
3. Click Add.
The Add Anti-Spyware Software Policy page opens.
4. Configure the basic information for the anti-spyware software policy.
5. Configure the Second-Check Interval parameter.
If the first check fails, the system does not report the check result. After the second-check interval expires, the system performs another check, and reports the check result if the check still fails. The value range of this parameter is 0 to 60 seconds. A value of 0 causes the system to immediately report the check failure result.
6. To check an anti-spyware software product in the anti-spyware software policy, in the Check field select the box for the anti-spyware software you want to check.
7. Modify the anti-spyware software check:
a. For the anti-spyware
software you want to modify, click the Modify icon ![]() .
.
The Anti-Spyware Software Settings dialog box opens.
b. To check the anti-spyware engine version, select the box next to Check anti-spyware engine version.
c. From the Version Check Mode list, select Specified Version.
If the anti-spyware engine of an access user is a later version than the specified version, the anti-spyware engine version check is passed. If not, the anti-spyware engine version check fails.
d. Enter the anti-spyware engine version in the Lowest Version of Anti-Spyware Engine field, in the format XX.XX.XX, for example, 2009.6.18.169.
For an anti-spyware engine version, you must use dotted format.
e. To check the anti-spyware definition version, select the box next to Check spyware definition version.
f. Fom the Version Check Mode list, select a version check mode: Specified Version or Auto Adaptive,.
- Specified Version—If the anti-spyware definition version of an access user is a later version than the specified version, the anti-spyware definition version check is passed. If not, the anti-spyware definition version check fails.
When the anti-spyware definition version
check mode is Specified Version, either enter the date manually or click the Calendar icon ![]() next to the Lowest Version of Spyware Definition field to select a date. The valid date format is YYYY-MM-DD, where YYYY is the
four-digit year, MM is the two-digit month, and DD is the two-digit day.
next to the Lowest Version of Spyware Definition field to select a date. The valid date format is YYYY-MM-DD, where YYYY is the
four-digit year, MM is the two-digit month, and DD is the two-digit day.
- Auto Adaptive—If the anti-spyware definition version of an access user has been updated within the adaptation period, the anti-spyware definition version check is passed. If not, the anti-spyware definition version check fails.
When the anti-spyware definition version check mode is Auto Adaptive, in the Adaptation Period manually enter the adaptation period (in days) field.
g. Click OK.
8. To adjust the position of the anti-spyware
software in the list, in the Priority field click
the Move Up icon ![]() or Move
Down icon
or Move
Down icon ![]() .
.
The iNode client checks the anti-spyware software of access users based on descending priority order (most important first).
9. Click OK.
The added anti-spyware software policy is also available on the security policy configuration page. For more information, see "Managing security policies."
Modifying an anti-spyware policy
1. Click the User tab.
2. From the navigation tree, select User Security Policy > Security Software Policy > Anti-Spyware.
The anti-spyware software policy list displays all anti-spyware software policies.
3. For the anti-spyware
software policy you want to modify, click the Modify
icon ![]() .
.
The Modify Anti-Spyware Software Policy page opens.
4. Modify the basic information for the anti-spyware software policy. You cannot modify Policy Name or Service Group.
5. To check an anti-spyware software product in the anti-spyware software policy, in the Check field select the box for the anti-spyware software you want to check.
6. Modify the anti-spyware software check:
a. For the anti-spyware
software you want to modify, click the Modify icon ![]() .
.
The Anti-Spyware Software Settings dialog box opens.
b. To check the anti-spyware engine version, select the box next to Check anti-spyware engine version.
c. From the Version Check Mode list, select Specified Version.
If the anti-spyware engine of an access user is a later version than the specified version, the anti-spyware engine version check is passed. If not, the anti-spyware engine version check fails.
d. Enter the anti-spyware engine version in the Lowest Version of Anti-Spyware Engine field in the format XX.XX.XX, for example, 2009.6.18.169.
For an anti-spyware engine version, you must use dotted format.
e. To check the anti-spyware definition version, select the box next to Check spyware definition version.
f. From the Version Check Mode list, select a version check mode: Specified Version or Auto Adaptive,.
- Specified Version—If the anti-spyware definition of an access user is a later version than the specified version, the anti-spyware definition version check is passed. If not, the anti-spyware definition version check fails.
When the anti-spyware definition version
check mode is Specified Version, either enter the date manually or click the Calendar icon ![]() next to the Lowest Version of Spyware Definition field to select a date. The valid date format is YYYY-MM-DD, where YYYY is the
four-digit year, MM is the two-digit month, and DD is the two-digit day.
next to the Lowest Version of Spyware Definition field to select a date. The valid date format is YYYY-MM-DD, where YYYY is the
four-digit year, MM is the two-digit month, and DD is the two-digit day.
- Auto Adaptive—If the anti-spyware definition version of an access user has been updated within the adaptation period, the anti-spyware definition version check is passed. If not, the anti-spyware definition version check fails.
If the anti-spyware definition version check mode is Auto Adaptive, manually enter the adaptation period in the Adaptation Period (in days) field.
g. Click OK.
7. To adjust the position of the anti-spyware
software in the list, in the Priority field click
the Move Up icon ![]() or Move
Down icon
or Move
Down icon ![]() .
.
The iNode client checks the anti-spyware software of access users based on descending priority order (most important first).
8. Click OK.
Deleting an anti-spyware software policy
If an anti-spyware software policy is assigned to a security policy, it cannot be deleted. To delete the anti-spyware software policy, first remove it from the security policy. For more information, see "Modifying a security policy."
To delete an anti-spyware software policy:
1. Click the User tab.
2. From the navigation tree, select User Security Policy > Security Software Policy > Anti-Spyware.
The anti-spyware software policy list displays all anti-spyware software policies.
3. For the anti-spyware
software policy you want to delete, click the Delete icon ![]() .
.
A confirmation dialog box opens.
4. Click OK.
Managing firewall software policies
The system defines firewall software control for several types of firewall software in Windows, Linux, and Mac OS. You can enable firewall software control in a security policy and specify a firewall software policy. The firewall software policy determines whether a firewall software product is installed and running. When an access user is authenticated, the iNode client checks the firewall software on the user endpoint according to the configuration in the security policy.
Firewall software policy management allows you to view, add, modify, and delete a firewall software policy. You can specify the firewall software to be checked as needed.
Firewall software policy list contents
The firewall software policy list has the following parameters:
· Firewall Software Policy Name—Name of the firewall software policy. Click the name to view detailed information.
· Service Group—Service group to which the firewall software policy belongs.
· Description—Description of the firewall software policy.
· Modify—To modify the firewall software policy, click
the Modify icon ![]() .
.
· Delete—To delete the firewall software policy, click the Delete icon ![]() .
.
Firewall software policy details
The firewall software policy details page has a basic information area and areas for Windows, Linux , and Mac OS.
Basic information area
· Policy Name—Name of the firewall software policy.
· Service Group—Service group to which the firewall software policy belongs.
· Description—Description of the firewall software policy.
Windows , Linux, and Mac OS areas
These areas list the firewall software that can be checked by the iNode client on the corresponding operating system.
· Firewall Software—Name of the firewall software.
· Vendor—Vendor name of the firewall software.
· Check—Indicates whether the corresponding firewall software will be checked.
· Priority—Order (descending) in which the iNode client checks the firewall software.
Viewing the firewall software policy list
1. Click the User tab.
2. From the navigation tree, select User Security Policy > Security Software Policies > Firewall.
The firewall software policy list displays all firewall software policies.
3. Click Refresh to refresh the firewall software policy list.
Viewing firewall software policy details
1. Click the User tab.
2. From the navigation tree, select User Security Policy > Security Software Policies > Firewall.
The firewall software policy list displays all firewall software policies.
3. Click the name of a firewall software policy to view detailed information.
The View Firewall Software Policy page opens.
4. Click Back to return to the firewall software policy list, click Back.
Adding a firewall software policy
1. Click the User tab.
2. From the navigation tree, select User Security Policy > Security Software Policies > Firewall.
The firewall software policy list displays all firewall software policies.
3. Click Add.
The Add Firewall Software Policy page opens.
4. Configure the basic information for the firewall software policy.
5. Configure the Second-Check Interval parameter.
If the first check fails, the system does not report the check result. After the second-check interval expires, the system performs another check, and reports the check result if the check still fails. The value range of this parameter is 0 to 60 seconds. A value of 0 causes the system to immediately report the check failure result.
6. To configure checking a firewall software product in the firewall software policy, in the Check field select the box for the firewall software.
7. To adjust the position of the firewall
software policy in the list, in the Priority field click the Move Up icon ![]() or the Move Down
icon
or the Move Down
icon ![]() .
.
The iNode client checks the firewall software of access users based on descending priority order (most important first).
8. Click OK.
The added firewall software policy is also available on the security policy configuration page. For more information, see "Managing security policies."
Modifying a firewall software policy
1. Click the User tab.
2. From the navigation tree, select User Security Policy > Security Software Policies > Firewall.
The firewall software policy list displays all firewall software policies.
3. For the firewall
software policy you want to modify, click the Modify
icon ![]() .
.
The Modify Firewall Software Policy page opens.
4. Modify the basic information for the firewall software policy. You cannot modify Policy Name or Service Group.
5. To configure checking a firewall software product in the firewall software policy, in the Check field select the box for the firewall software.
6. To adjust the position of the firewall
software in the list, in the Priority field click the Move Up icon ![]() or the Move Down
icon
or the Move Down
icon ![]() .
.
The iNode client checks the firewall software of access users based on descending priority order (most important first).
7. Click OK.
Deleting a firewall software policy
If a firewall software policy is assigned to a security policy, it cannot be deleted. To delete the firewall software policy, first remove it from the security policy. For more information, see "Modifying a security policy."
To delete a firewall software policy:
1. Click the User tab.
2. From the navigation tree, select User Security Policy > Security Software Policies > Firewall.
The firewall software policy list displays all firewall software policies.
3. For the firewall
software policy you want to delete, click the Delete icon ![]() .
.
A confirmation dialog box opens.
4. Click OK.
Managing anti-phishing software policies
The system defines anti-phishing software control for several types of anti-phishing software in Windows and Mac OS. You can enable anti-phishing software control in a security policy, and specify an anti-phishing software policy. The anti-phishing software policy determines whether an anti-phishing software type application control is installed and running. When an access user is authenticated, the iNode client checks the anti-phishing software on the user endpoint according to the configuration in the security policy.
Anti-phishing software policy management allows you to view, add, modify, and delete an anti-phishing software policy. You can specify the anti-phishing software to be checked as needed.
Anti-phishing software policy list contents
The anti-phishing software policy list has the following parameters:
· Anti-Phishing Software Policy Name—Name of the anti-phishing software policy. Click the name to view detailed information.
· Service Group—Service group to which the anti-phishing software policy belongs.
· Description—Description of the anti-phishing software policy.
· Modify—To modify the anti-phishing software policy, click the Modify icon ![]() .
.
· Delete—To delete the anti-phishing software policy, click the Delete icon ![]() .
.
Anti-phishing software policy details
The anti-phishing software policy details page has a basic information area and areas for Windows and Mac OS.
Basic information area
· Policy Name—Name of the anti-phishing software policy.
· Service Group—Service group to which the anti-phishing software policy belongs.
· Description—Description of the anti-phishing software policy.
Windows and Mac OS areas
These areas list the anti-phishing software that can be checked by the iNode client on the corresponding operating system.
· Anti-Phishing Software—Name of the anti-phishing software.
· Vendor—Vendor name of the anti-phishing software.
· Check—Indicates whether the corresponding anti-phishing software will be checked.
· Priority—Order (descending) in which the iNode client checks the anti-phishing software.
Viewing the anti-phishing software policy list
To view the anti-phishing software policy list:
1. Click the User tab.
2. From the navigation tree, select User Security Policy > Security Software Policies > Anti-Phishing.
The anti-phishing software policy list displays all anti-phishing software policies.
3. Click Refresh to refresh the anti-phishing software policy list.
Viewing anti-phishing software policy details
1. Click the User tab.
2. From the navigation tree, select User Security Policy > Security Software Policies > Anti-Phishing.
The anti-phishing software policy list displays all anti-phishing software policies.
3. Click the name of an anti-phishing software policy view detailed information.
The View Anti-Phishing Software Policy page opens.
4. Click Back to return to the anti-phishing software policy list.
Adding an anti-phishing software policy
1. Click the User tab.
2. From the navigation tree, select User Security Policy > Security Software Policies > Anti-Phishing.
The anti-phishing software policy list displays all anti-phishing software policies.
3. Click Add.
The Add Anti-Phishing Software Policy page opens.
4. Configure basic information for the anti-phishing software policy.
5. To check an anti-phishing software product in the anti-phishing software policy list, in the Check field select the box for the anti-phishing software.
6. To adjust the position of the anti-phishing software
in the policy list, in the Priority field click the Move Up icon ![]() or the Move Down
icon
or the Move Down
icon ![]() .
.
The iNode client checks the anti-phishing software of access users based on descending priority order (most important first).
7. Click OK.
The added anti-phishing software policy is available on the security policy configuration page. For more information, see "Managing security policies."
Modifying an anti-phishing software policy
1. Click the User tab.
2. From the navigation tree, select User Security Policy > Security Software Policies > Anti-Phishing.
The anti-phishing software policy list displays all anti-phishing software policies.
3. For the
anti-phishing software policy you want to modify, click the Modify icon ![]() .
.
The Modify Anti-Phishing Software Policy page opens.
4. Modify the basic information for the anti-phishing software policy. You cannot modify Policy Name or Service Group.
5. To check an anti-phishing software product in the anti-phishing software policy list, select the box in the Check field for the anti-phishing software.
6. To adjust the position of the anti-phishing
software anti-phishing software policy list, in the Priority field click the Move Up icon ![]() or the Move Down
icon
or the Move Down
icon ![]() .
.
The iNode client checks the anti-phishing software of access users based on descending priority order (most important first).
7. Click OK.
Deleting an anti-phishing software policy
If an anti-phishing software policy is assigned to a security policy, it cannot be deleted. To delete the anti-phishing software policy, first remove it from the security policy. For more information, see "Modifying a security policy."
To delete an anti-phishing software policy:
1. Click the User tab.
2. From the navigation tree, select User Security Policy > Security Software Policies > Anti-Phishing.
The anti-phishing software policy list displays all anti-phishing software policies.
3. For the
anti-phishing software policy you want to delete, click the Delete icon ![]() .
.
A confirmation dialog box opens.
4. Click OK.
Managing hard disk encryption software policies
The system defines hard disk encryption software control for several types of hard disk encryption software in Windows. You can enable hard disk encryption software control for a security policy and specify a hard disk encryption software policy.
The hard disk encryption software policy determines whether the hard disk encryption software is installed on a user endpoint. When an access user is authenticated, the iNode client checks the hard disk encryption software on the user endpoint according to the configuration in the security policy.
Hard disk encryption software policy management allows you to view, add, modify, and delete a hard disk encryption software policy. You can specify the hard disk encryption policies to be checked as needed.
Hard disk encryption software policy list contents
The hard disk encryption software policy list has the following parameters:
· Hard Disk Encryption Software Policy Name—Name of the hard disk encryption software policy. Click the name to view detailed information.
· Service Group—Service group to which the hard disk encryption software policy belongs.
· Description—Description of the associated hard disk encryption software policy.
· Modify—To modify the hard disk encryption software policy, click the Modify icon ![]() .
.
· Delete—To delete the hard disk encryption software policy, click the Delete icon ![]() .
.
Hard disk encryption software policy details
The hard disk encryption software policy details page has a basic information area and a Windows area.
Basic information area
· Policy Name—Name of the hard disk encryption software policy.
· Service Group—Service group to which the hard disk encryption software policy belongs.
· Description—Description of the hard disk encryption software policy.
Windows area
This area lists the hard disk encryption software that can be checked by the iNode client in Windows.
· Hard Disk Encryption Software—Name of the hard disk encryption software.
· Vendor—Vendor name of the hard disk encryption software.
· Check—Indicates whether the corresponding hard disk encryption software will be checked.
· Priority—Order (descending) in which the iNode client checks the hard disk encryption software.
Viewing the hard disk encryption software policy list
1. Click the User tab.
2. From the navigation tree, select User Security Policy > Security Software Policies > Hard Disk Encryption.
The hard disk encryption software policy list displays all hard disk encryption software policies.
3. Click Refresh to refresh the hard disk encryption software policy list.
Viewing hard disk encryption software policy details
1. Click the User tab.
2. From the navigation tree, select User Security Policy > Security Software Policies > Hard Disk Encryption.
The hard disk encryption software policy list displays all hard disk encryption software policies.
3. Click the name of a hard disk encryption software policy to view detailed information.
The View Hard Disk Encryption Software Policy page opens.
4. Click Back to return to the hard disk encryption software policy list.
Adding a hard disk encryption software policy
1. Click the User tab.
2. From the navigation tree, select User Security Policy > Security Software Policies > Hard Disk Encryption.
The hard disk encryption software policy list displays all hard disk encryption software policies.
3. Click Add.
The Add Hard Disk Encryption Software Policy page opens.
4. Configure basic information for the hard disk encryption software policy.
5. To configure checking a hard disk encryption software product in the firewall software policy, select the box in the Check field for the hard disk encryption software.
6. To adjust the position of the hard disk
encryption software in the list, in the Priority field click the Move Up ![]() icon or Move Down
icon or Move Down ![]() icon.
icon.
The iNode client checks the hard disk encryption software of access users based on descending priority order (most important first).
7. Click OK.
The added hard disk encryption software policy is also available on the security policy configuration page. For more information, see "Managing security policies."
Modifying a hard disk encryption software policy
1. Click the User tab.
2. From the navigation tree, select User Security Policy > Security Software Policies > Hard Disk Encryption.
The hard disk encryption software policy list displays all hard disk encryption software policies.
3. For the hard disk encryption software policy 81
4. you want to modify, click the Modify icon ![]() .
.
The Modify Hard Disk Encryption Software Policy page opens.
5. Modify the basic information for the hard disk encryption software policy. You cannot modify the Policy Name or Service Group.
6. To configure checking a hard disk encryption software product in the hard disk encryption software policy, in the Check field select the box for the hard disk encryption software.
7. To adjust the position of the hard disk
encryption software in the list, in the Priority field click the Move Up ![]() icon or Move Down
icon or Move Down ![]() icon.
icon.
The iNode client checks the hard disk encryption software of access users based on descending priority order (most important first).
8. Click OK.
Deleting a hard disk encryption software policy
If a hard disk encryption software policy is assigned to a security policy, it cannot be deleted. To delete the hard disk encryption software policy, first remove it from the security policy. For more information, see "Modifying a security policy."
To delete a hard disk encryption software policy:
1. Click the User tab.
2. From the navigation tree, select User Security Policy > Security Software Policies > Hard Disk Encryption.
The hard disk encryption software policy list displays all hard disk encryption software policies.
3. For the hard disk
encryption software policy you want to delete, click the Delete icon ![]() .
.
A confirmation dialog box opens.
4. Click OK.
Managing PC software control groups
You can enable PC software control in a security policy and specify PC software control groups to be checked. When an access user is authenticated, the iNode client checks software, processes, services, and files on the PC according to the configuration in the security policy.
PC software control management allows you to view, add, modify, and delete a PC software control group. Table 20 describes the check type for each type of PC software control group.
Table 20 PC software control groups and check types
|
Group type |
Check types |
|
Software |
A software-type PC software control group applies only to Windows operating systems. It has the following check types: · Installed Forbidden—Prohibits any software products in the control group from being installed on the user endpoint. · Installed Required—Requires all software products in the control group to be installed on the user endpoint. · Installed Allowed—Allows only the software products in the control group to be installed on the user endpoint. Only one control group can be set as Installed Allowed. |
|
Process |
A process-type PC software control group has the following check types: · Running Forbidden—Prohibits any processes in the control group from running on the user endpoint. · Running Required—Requires all processes in the control group to be running on the user endpoint. |
|
Service |
A service-type PC software control group has the following check types: · Started Forbidden—Prohibits any services in the control group from being started on the user endpoint. · Started Required—Requires all services in the control group to be started on the user endpoint. |
|
File |
A file-type PC software control group has the following check types: · Non-Existent—Prohibits any files in the control group from being stored on the user endpoint. · Existent—Requires all files in the control group to exist on the user endpoint. |
PC software control group list contents
The PC software control group list has the following parameters:
· Group Name—Name of the PC software control group. Click the name to view detailed information.
· Type—Type of the PC software control group, which can be:
¡ Software
¡ Process
¡ Service
¡ File
· Description—Description of the PC software control group.
· Default Action for Check Failure—Default action of the PC software control group when the check fails, which can be:
¡ Monitor (default)—After going online, the user is not informed of security problems and can access the network. Security check results are recorded in security logs.
¡ Inform— After going online, the user is informed of security problems. The system prompts the user for modification, and the user can access the network. Security check results are recorded in security logs.
¡ Isolate— After going online, the user is informed of security problems. The system prompts the user to solve problems, and the user can access resources in the isolation area according to the configured ACL. Security check results are recorded in security logs.
¡ Kick Out— After going online, the user is informed of security problems. The authentication fails and the user is logged off. Security check results are recorded in security logs.
¡ Blacklist and Kick Out—When the security check fails, the user is logged off and added to the blacklist. The security check result is recorded in security logs.
A new PC software control group uses the default action you configured for PC software control group check failure. When you select Global Security Mode in Security Level configuration, the default action of the PC software control group check failure is invalid.
· Second-Check Interval—If the first check fails, the system does not report the check result. After the second-check interval expires, the system performs another check, and reports the check result if the check still fails. The value range of this parameter is 0 to 60 seconds. The value of 0 causes the system to immediately report the check failure result. Only PC software control groups of the process type support this parameter.
· Local Data—Indicates whether the PC software control group is created by the EAD server. When the value is No, the PC software control group is deployed by an upper-level node. For more information, see "Managing hierarchical EAD networks."
· Service Group—Service group to which the PC software control group belongs.
· Logical Combination of Group Items—Options are:
¡ AND—The system takes the specific measure only when all of the items in the group meet the requirements of the security policy. For example:
- PC software control group A contains Norton, Kingsoft, and Rising. If the security policy requires the software in group A be installed on an endpoint, the endpoint passes the security check only when it has all the software programs installed.
- PC software control group B contains QQ and MSN. If the security policy prohibits software in group B from being installed on an endpoint, the endpoint fails the security check when it has both QQ and MSN installed. The endpoint can pass the security check only when it has either or neither of the two software programs installed.
¡ OR—The system takes the specific measure when any of the items in the group meet the requirements of the security policy. For example:
- PC software control group A contains Norton, Kingsoft, and Rising. If the security policy requires the software in PC software control group A be installed on an endpoint, the endpoint passes the security check when it has any of the three software programs installed.
- PC software control group B contains QQ and MSN. The security policy prohibits software programs in PC software control group B from being installed on an endpoint. If the endpoint has either of the two software programs installed, it fails the security check. The endpoint can pass the security check only when it has neither of the two software programs installed.
· Modify—To modify the PC software control group, click the Modify icon ![]() .
.
· Delete—To delete the PC software control group, click the Delete icon ![]() .
.
· MD5 Tool—To download the MD5 tool, click the MD5 Tool link.
· Common Software Definition—Click the Common Software Definition link to go to the Common Software Definition page.
Viewing the PC software control group list
1. Click the User tab.
2. From the navigation tree, select User Security Policy > PC Software Control Group.
The PC software control group list displays all PC software control groups.
Querying PC software control groups
1. Click the User tab.
2. From the navigation tree, select User Security Policy > PC Software Control Group.
3. In the Query PC Software Control Group area, enter your query criteria:
¡ Group Name—Enter the name of the PC software control group.
¡ Software/Process/Service/File Name—Enter the software name, process name, service name, or file name of the PC software control group.
4. Click Query.
5. To reset both the query values and the search results, and to restore the full PC software control group list, click Reset and re-enter your query criteria.
Deleting a PC software control group
If a PC software control group is assigned to a security policy, it cannot be deleted. To delete the PC software control group, first remove it from the security policy. For more information, see "Modifying a security policy."
To delete a PC software control group:
1. Click the User tab.
2. From the navigation tree, select User Security Policy > PC Software Control Group.
The PC software control group list displays all PC software control groups.
3. For the PC software
control group you want to delete, click the Delete icon ![]() .
.
A confirmation dialog box opens.
4. Click OK.
Managing software-type PC software control groups
Software-type PC software control group details
The software-type PC software control group details page has a basic information area and a software list area.
Basic information contents
· Group Name—Name of the PC software control group.
· Type—Type of the PC software control group, which is Software.
· Description—Description of the PC software control group.
· Default Action for Check Failure—Default action of the PC software control group when the check fails, which can be:
¡ Monitor (default)—The user is not informed of security problems after going online, and can access the network. Security check results are recorded in security logs.
¡ Inform—The user is informed of security problems after going online. The system prompts the user to solve problem, and the user can access the network. Security check results are recorded in security logs.
¡ Isolate—The user is informed of security problems after going online. The system prompts the user to solve problems, and the user can access resources in the isolation area according to the configured ACL. Security check results are recorded in security logs.
¡ Kick out—The user is informed of security problems after going online, fails the authentication, and is forced to log off. Security check results are recorded in security logs.
¡ A new PC software control group uses the default action you configured for PC software control group check failure. You can modify the action for PC software control group check failure in the security policy. When you select Global Security Mode in Security Level configuration, the default action for PC software control group failure is invalid.
· Service Group—Service group to which the PC software control group belongs.
Software list information
· Software Name—Name of the software. The software name must be the same as that in Windows > Control Panel > Add or Delete Programs.
· Alias—Alias of the software. When an access user fails the access control check, the iNode client uses the alias as the name of the software on the Security Check Result page.
· Version Number—Version number of the software. The software version must be the same as that in Windows > Control Panel > Add or Delete Programs.
· Description—Description of the software.
Viewing a software-type PC software control group
1. Click the User tab.
2. From the navigation tree, select User Security Policy > PC Software Control Group.
The PC software control group list displays all PC software control groups.
3. Click the group name of the PC software control group you want to view.
The View PC Software Control Group page opens.
4. Click Back to return to the PC software control group list.
Adding a software-type PC software control group
1. Click the User tab.
2. From the navigation tree, select User Security Policy > PC Software Control Group.
The PC software control group list displays all PC software control groups.
3. Click Add.
The Add PC Software Control Group page opens.
4. Configure basic information for the PC software control group.
5. To add a software product to the Software List:
a. Click Add.
The Add Software dialog box opens.
b. Enter the Software Name, Alias, Version Number, and Description.
c. Click OK.
The software is added to the Software List.
6. To add multiple software products to the Software List in batches:
a. Click Batch Add.
The Batch Add Software dialog box opens.
b. Enter your query criteria:
- Software Name—Enter the software name.
- Version Number—Enter the software version number.
- Description—Enter the software description.
To reset both the query values and the search results, and to restore the full Common Software List, click Reset and re-enter your query criteria.
c. Click Query.
The query results are displayed in the Common Software List.
d. In the Common Software List, select the box next to Software Name for the software you want to add.
e. Click OK.
The software is added to the Software List.
7. Click OK.
The added software-type PC software control group is also available on the security policy configuration page. For more information, see "Managing security policies."
Modifying a software-type PC software control group
1. Click the User tab.
2. From the navigation tree, select User Security Policy > PC Software Control Group.
The PC software control group list displays all PC software control groups.
3. For the software-type PC software control group you want to modify, click the Modify icon ![]() .
.
The Modify PC Software Control Group page opens.
4. Modify the basic information for the software-type PC software control group. You cannot modify Group Name, Type, or Service Group.
5. To add a software product to the Software List:
a. Click Add.
The Add Software dialog box opens.
b. Software Name—Enter the name of the software. The software name must be the same as that in Control Panel > Programs and Features in the Windows operating system.
c. Alias—Enter the software alias. When an access user fails the access control check, the iNode client uses the alias of the software as the name of the software on the Security Check Result page.
d. Version Number—Enter the software version. The software version must be the same as that in Control Panel > Programs and Features in the Windows operating system.
e. Description—Enter a description of the software.
f. Click OK.
The software is added to the Software List.
6. To add multiple software products to the Software List in batches:
a. Click Batch Add.
The Batch Add Software dialog box opens.
b. Enter your query criteria.
To reset both the query values and the search results, and to restore the full Common Software List, click Reset and re-enter your query criteria.
c. Click Query.
The query results are displayed in the Common Software List.
d. Select the box next to Software Name in the Common Software List for the software you want to add.
e. Click OK.
The software is added to the Software List.
7. To modify the software in the Software List:
a. For the software you want to modify, click the Modify icon ![]() .
.
The Modify Software dialog box opens.
- Policy Name—Modify the software name.
- Alias—Modify the software alias. When an access user fails the access control check, the iNode client uses the alias of the software as the name on the Security Check Result page.
- Version Number—Modify the software version.
- Description—Enter a new description for the software.
b. Click OK.
The modified software is added to the Software List.
8. To delete the software in the Software List:
a. For the software you want to delete, click the Delete icon ![]() .
.
b. In the dialog box that opens, click OK.
9. Click OK.
Deleting a software-type PC software control group
For more information about deleting a software-type PC software control group, see "Deleting a PC software control group."
Managing process-type PC software control groups
Process-type PC software control group details
The process-type PC software control group details page has a basic information area and a process list area.
Basic information contents
· Group Name—Name of the PC software control group.
· Type—Type of the PC software control group, Process.
· Description—Description of the PC software control group.
· Default Action for Check Failure—Default action for the PC software control group when the check fails, which can be:
¡ Monitor—After going online, the user is not informed of security problems and can access the network. Security check results are recorded in security logs.
¡ Inform— After going online, the user is informed of security problems. The system prompts the user to solve problems and the user can access the network. Security check results are recorded in security logs.
¡ Isolate— After going online, the user is of security problems. The system prompts the user to solve problems and the user can access resources in the isolation area according to the configured ACL. Security check results are recorded in security logs.
¡ Kick out— After going online, the user is of security problems, fails the authentication, and is forced to log off. Security check results are recorded in security logs.
A new PC software control group uses the default action you configured for PC software control group check failure. When you select Global Security Mode in Security Level configuration, the default action of the PC software control group failure is invalid. You can specify whether Global Security Mode is used and the default action for PC software control group failure for each PC software control group.
· Service Group—Service group to which the PC software control group belongs.
Process list information
· Process Name—Name of the process.
¡ For the Windows operating system, the process name must be the same as that in Windows Task Manager > Processes.
¡ For the Linux operating system, the process name must be the same as that after the ps -ef command is executed.
¡ For
the Mac OS operating system, the process name must be the same as that after
the
ps -awwx -o command is executed.
· Alias—Alias of the process. When an access user fails the access control check, the iNode client uses the alias as the name of the process on the Security Check Result page.
· Operating System—Operating system of a process: Windows, Linux, or Mac OS.
· Check Type—Select a process check method: Simple, Complex, and MD5.
On a Windows operating system, you can configure all of them.
On a Linux or Mac OS operating system, you can configure only Simple.
¡ Simple—Used where the process name is the same as the source file name of a program.
¡ Complex—Used where the process name is different from the source file name of a program. A process is generated for each program and typically, the process name is the same as the source file name of the program. In some cases (for example, if the program name was changed manually), the process name is different from the source file name.
¡ MD5—Used where a process name has no corresponding source file name, or one process name corresponds to multiple programs. The iNode client determines whether the software corresponding to the MD5 digest is running on the user endpoint according to the process name and MD5 digest sent by the EAD server.
MD5 check rules are as follows:
- Running Required process—In Windows Task Manager, check the name of the process and check the MD5 digest of the process. If both are matched, the security check is passed. If they are not matched, the security check fails.
- Running Forbidden process—In Windows Task Manager, check the name of the process. In the PC software control group, check the MD5 digest of the process. If either is matched, the security check fails. If neither is matched, the security check is passed.
· MD5 Digest—MD5 digest for the process. This column contains data only when the check mode for a process is MD5.
· Description—Description of the process.
Viewing a process-type PC software control group
1. Click the User tab.
2. From the navigation tree, select User Security Policy > PC Software Control Group.
The PC software control group list displays all PC software control groups.
3. Click the group name of the PC software control group you want to view.
The View PC Software Control Group page opens.
4. Click Back to return to the PC software control group list.
Adding a process-type PC software control group
1. Click the User tab.
2. From the navigation tree, select User Security Policy > PC Software Control Group.
The PC software control group list displays all PC software control groups.
3. Click Add.
The Add PC Software Control Group page opens.
4. Configure basic information for the PC software control group.
5. Add a process to the Process List:
a. Click Add.
The Add Process dialog box opens.
b. In the Process Name field, enter the process name.
c. In the Alias field, enter the software alias.
d. From the Operating System list, select an operating system: Windows, Linux, or Mac OS.
e. From the Check Type list, select a check type: Simple, Complex, or MD5.
When you select the Windows operating system and the MD5 check type, in the MD5 Digest field enter the MD5 digest of the process. You can use the MD5 tool to calculate the MD5 digest of a process.
f. In the Description field, enter a description of the process.
g. Click OK.
The process is added to the Software List.
6. Click OK.
The added process-type PC software control group is also available on the security policy configuration page. For more information, see "Managing security policies."
Modifying a process-type PC software control group
1. Click the User tab.
2. From the navigation tree, select User Security Policy > PC Software Control Group.
The PC software control group list displays all PC software control groups.
3. For the process-type PC software control groups you want to modify, click the Modify icon ![]() .
.
The Modify Software Control Group page opens.
4. Modify the basic information for the process-type PC software control group. You cannot modify Group Name, Type, or Service Group.
5. To add a process to the Process List:
a. Click Add.
The Add Process dialog box opens.
b. In the Process Name field, enter the process name.
c. In the Alias field, enter the software alias.
d. From the Operating System list, select an operating system: Windows, Linux, or Mac OS.
e. From the Check Type list, select a check type: Simple, Complex, or MD5.
When you select the Windows operating system and the MD5 check type, in the MD5 Digest field enter the MD5 digest of the process. You can use the MD5 tool to calculate the MD5 digest of a process.
f. In the Description field, enter a description of the process.
g. Click OK.
The process is added to the Process List.
6. In the Process List, to modify the process:
a. For the process you want to modify, click the Modify icon ![]() .
.
The Modify Process dialog box opens.
b. In the Process Name field, modify the process name.
c. In the Alias field, enter the process alias.
When an access user fails the access control check, the iNode client uses the alias as the name of the process on the Security Check Result page.
d. From the Operating System list, select an operating system: Windows, Linux, or Mac OS.
e. From the Check Type list, select a check type: Simple, Complex, or MD5.
When you select the Windows operating system and the MD5 check type, in the MD5 Digest field, enter the MD5 digest of the process. You can use the MD5 tool to calculate the MD5 digest of a process.
f. In the Description field, modify the description of the process.
g. Click OK.
The modified process is added to the Process List.
7. To delete the process in the Process List:
a. For the process you want to delete, click the Delete icon ![]() .
.
b. Click OK.
8. Click OK.
Deleting a process-type PC software control group
For more information about deleting a software-type PC software control group, see "Deleting a PC software control group."
Downloading and using the MD5 tool
The PC software control group function provides the MD5 tool which you can use to:
· Calculate the MD5 digest of an .exe file.
· Check the PC software control group configuration.
Only Windows operating systems support MD5 check. In a Windows operating system, each process associates with an .exe file. You can identify the .exe files on a user endpoint by MD5 check.
To download and use the MD5 tool:
1. Click the User tab.
2. From the navigation tree, select User Security Policy > PC Software Control Group.
3. At the upper right corner of the PC software control group list area, click the MD5 Tool link.
4. Download the MD5 tool file:
a. Decompress the file FileMD5Digest.zip.
b. Double-click FileMD5Digest.exe to run the MD5 tool.
c. Click Select Executable File and select an .exe file.
d. Click Calculate MD5 Digest.
e. Click Copy to copy the MD5 digest to the clipboard.
f. Click Close.
Managing service-type PC software control groups
Service-type PC software control group details
The service-type PC software control group details page has a basic information area and a service list area.
Basic information contents
· Group Name—Name of the PC software control group.
· Type—Type of the PC software control group, which is Service.
· Description—Description of the PC software control group.
· Default Action for Check Failure—Default action for the PC software control group check failure:
¡ Monitor (default)—After going online, the user is not informed of security problems and can access the network. Security check results are recorded in the security logs.
¡ Inform—After going online, the user is informed of security problems, the system prompts the user for modification, and the user can access the network. Security check results are recorded in the security logs.
¡ Isolate—After going online, the user is informed of security problems, the system prompts the user to solve the problems, and the user can access the resources in the isolation area according to configured ACL. Security check results are recorded in the security logs.
¡ Kick out—After going online, the user is informed of security problems, fails the authentication, and is forced to log off. Security check results are recorded in the security logs.
A new PC software control group uses the default action you configured for PC software control group check failure. When you select Global Security Mode in Security Level configuration, the default action of the PC software control group failure is invalid.
· Service Group—Service group to which the PC software control group belongs.
Service list information
· Service Name—Name of the service.
¡ For the Windows operating system, the service name must be the same as that in Control Panel > All Control Panel Items > Administrative Tools > Services > Properties.
¡ For the Linux operating system, the service name must be the same as that after the service --status-all command is executed.
¡ For the Mac OS operating system, the service name must be the same as that after the service --list command is executed.
· Alias—Alias of the service. When an access user fails the access control check, the iNode client uses the alias as the name of the service on the Security Check Result page.
· Operating System—Operating system type of a process: Windows, Linux, or Mac OS.
· Process Name—Processes on the Linux and Mac OS operating systems. Each service has a corresponding process. The PC software control group checks the services running on the Linux and Mac OS operating systems by process.
· Description—Description of the service.
Viewing a service-type PC software control group
1. Click the User tab.
2. From the navigation tree, select User Security Policy > PC Software Control Group.
The PC software control group list displays all PC software control groups.
3. Click the group name of the PC software control group you want to view.
The View PC Software Control Group page opens.
4. Click Back to return to the PC software control group list.
Adding a service-type PC software control group
1. Click the User tab.
2. From the navigation tree, select User Security Policy > PC Software Control Group.
The PC software control group list displays all PC software control groups.
3. Click Add.
The Add PC Software Control Group page opens.
4. Configure the basic information for the PC software control groups.
5. Add a service to the Service List:
a. Click Add.
The Add Service dialog box opens.
b. Enter the service information.
c. Click OK.
The service is added to the Service List.
6. Click OK.
The added service is also available on the security policy configuration page. For more information, see "Managing security policies."
Modifying a service-type PC software control group
1. Click the User tab.
2. From the navigation tree, select User Security Policy > PC Software Control Group.
The PC software control group list displays all PC software control groups.
3. For the service-type PC software control group you want to modify, click the Modify icon ![]() .
.
The Modify PC Software Control Group page opens.
4. Modify the basic information for the service-type PC software control group. You cannot modify Group Name, Type, or Service Group.
5. Add a service to the Service List:
a. Click Add.
The Add Service dialog box opens.
b. Enter the service information.
c. Click OK.
The service is added to the Service List.
6. Modify the service in the Service List:
a. For the service you want to modify, click the Modify icon ![]() .
.
The Modify Service dialog box opens.
b. Modify the information.
c. Click OK.
The modified service is added to the Service List.
7. Delete the service in the Service List:
a. For the service you want to delete, click the Delete icon ![]() .
.
b. Click OK.
8. Click OK.
Deleting a software-type PC software control group
For more information about deleting a software-type PC software control group, see "Deleting a PC software control group."
Managing file-type PC software control groups
File-type PC software control group details
The file-type PC software control group details page has a basic information area and a file list area.
Basic information contents
· Group Name—Name of the PC software control group.
· Type—Type of the PC software control group, which is File.
· Description—Description of the PC software control group.
· Default Action for Check Failure—Default action for the PC software control group when the check fails:
¡ Monitor (default)—After going online, the user is not informed of security problems and can access the network. Security check results are recorded in security logs.
¡ Inform—After going online, the user is informed of security problems, the system prompts the user to solve problems, and the user can access the network. Security check results are recorded in security logs.
¡ Isolate—After going online, the user is informed of security problems. The system prompts the user to solve problems, and the user can access resources in the isolation area according to the configured ACL. Security check results are recorded in security logs.
¡ Kick out—After going online, the user is is informed of security problems, fails the authentication, and is forced to log off. Security check results are recorded in security logs.
A new PC software control group uses the default action you configured for PC software control group check failure. When you select Global Security Mode in Security Level configuration, the default action of the PC software control group failure is invalid.
· Service Group—Service group to which the PC software control group belongs.
File list information
· File Path and Name—Path and name of the file.
· Alias—Alias of the file. When an access user fails the access control check, the iNode client uses the alias as the path and name of the file on the Security Check Result page.
· Operating System—Operating system of a file: Windows, Linux, or Mac OS.
· Check Type—Match mode for the file content check:
¡ None—No keyword check is performed for the file content.
¡ Keyword Include—File is matched when the file content contains the specified keyword.
¡ Keyword Exclude—File is matched when the file content does not contain the specified keyword.
· Keyword Type—Keyword type for the file content check: String or Binary. When None is selected for Check Type, this field is not displayed.
¡ String—Used for a text file content check.
¡ Binary—Used for a file content check for other types of files.
· Description—Description of the file.
Viewing a file-type PC software control group
1. Click the User tab.
2. From the navigation tree, select User Security Policy > PC Software Control Group.
The PC software control group list displays all PC software control groups.
3. Click the group name of the PC software control group you want to view.
The View PC Software Control Group page opens.
4. Click Back to return to the PC software control group list.
Adding a file-type PC software control group
1. Click the User tab.
2. From the navigation tree, select User Security Policy > PC Software Control Group.
The PC software control group list displays all PC software control groups.
3. Click Add.
The Add PC Software Control Group page opens.
4. Configure basic information for the PC software control group.
5. Add a file to the File List:
a. Click Add.
The Add File dialog box opens.
b. In the File Path and Name field, enter the file path and name.
c. In the Alias field, enter the file alias.
When an access user fails the access control check, the iNode client uses the alias as the path and name of the file on the Security Check Result page.
d. From the Operating System list, select an operating system: Windows, Linux, or Mac OS.
e. For the file content check, select a keyword match mode: None, Keyword Include, or Keyword Exclude.
f. When the keyword match method is Keyword Include or Keyword Exclude, select the keyword type:
- String—Used for a text file content check.
- Binary—Used for a file content check of other types of files.
g. In the Keyword field, enter the keyword.
For a text file, the keyword is in the text file itself. For other types of files, the keyword consists of hexadecimal digits. You can use the file editor to view the file.
h. In the Description field, enter a description of the file.
i. Click OK.
The file is added to the File List.
6. Click OK.
The added file-type PC software control group is also available on the security policy configuration page. For more information, see "Managing security policies."
Modifying a file-type PC software control group
1. Click the User tab.
2. From the navigation tree, select User Security Policy > PC Software Control Group.
The PC software control group list displays all PC software control groups.
3. For the file-type PC
software control group you want to modify, click the Modify
icon ![]() .
.
The Modify PC Software Control Group page opens.
4. Modify the basic information for the file-type PC software control group. You cannot modify Group Name, Type, or Service Group.
5. To add a file to the File List:
a. Click Add. =
The Add File dialog box opens.
Iin the File Path and Name field, enter the file path and name.
b. In the Alias field, enter the file alias.
When an access user fails the access control check, the iNode client uses the alias as the path and name of the file on the Security Check Result page.
c. From the Operating System list, select an operating system: Windows, Linux, or Mac OS.
d. For the file content check, select a keyword match mode: None, Keyword Include, or Keyword Exclude.
e. When the keyword match method is Keyword Include or Keyword Exclude, select the keyword type:
- String—Used for a text file content check.
- Binary—Used for a file content check for other types of files.
f. In the Keyword field, enter the keyword.
For a text file, the keyword is in the text file itself. For other types of files, the keyword consists of hexadecimal digits. You can use the file editor to view the file.
g. In the Description field, enter a description of the file.
h. Click OK.
The file is added to the File List.
6. To modify the file in the File List:
a. For the file you want to modify, click the Modify icon ![]() .
.
The Modify File dialog box opens.
Iin the File Path and Name field, modify the file path and name.
b. In the Alias field, modify the file alias.
When an access user fails the access control check, the iNode client uses the alias of the file as the path and name of the file on the Security Check Result page.
c. From the Operating System list, select an operating system: Windows, Linux, or Mac OS.
d. For the file content check, select a keyword match mode: None, Keyword Include, or Keyword Exclude.
e. When the keyword match method is Keyword Include or Keyword Exclude, select the keyword type:
- String—Used for a text file content check.
- Binary—Used for a file content check of other types of files.
f. In the Keyword field, enter the keyword.
For a text file, the keyword is in the text file itself. For other types of files, the keyword consists of hexadecimal digits. You can use the file editor to view the file.
g. In the Description field, modify the description of the file.
h. Click OK.
The file is added to the File List.
7. To delete the file in the File List:
a. For the file you want to delete, click the Delete icon ![]() .
.
b. Click OK.
8. Click OK.
Deleting a software-type PC software control group
For more information about deleting a software-type PC software control group, see "Deleting a PC software control group."
Managing common software
The PC software control group function allows you to manage common software. In the common software list, you can:
· query, add, or delete a software product.
· add software information in batches.
DAM automatically collects information about software installed on registered assets.
Common software list contents
The common software list has the following parameters:
· Software Name—Name of the software.
· Alias—Alias of the software. When an access user fails the access control check, the iNode client uses the alias as the name of the software on the Security Check Result page.
· Version Number—The software version.
· Description—Description of the software.
Viewing the common software list
1. Click the User tab.
2. From the navigation tree, select User Security Policy > PC Software Control Group.
3. At the upper right corner of the PC software control group list area, click the Common Software Definition link.
In the main pane of the Common Software Definition page, the common software list opens. For more information, see "Common software list contents."
4. Click Back to return to the common software list.
Querying the common software
1. Click the User tab.
2. From the navigation tree, select User Security Policy > PC Software Control Group.
3. At the upper right corner of the PC software control group list area, click the Common Software Definition link.
4. In the Query Condition area, enter your search criteria.
5. Click Query. The page displays all common software products that meet the query criteria.
6. To reset both the query values and the search results and to restore the full common software list, click Reset and re-enter your query criteria.
Adding a common software product
1. Click the User tab.
2. From the navigation tree, select User Security Policy > PC Software Control Group.
3. At the upper right corner of the PC software control group list area, click the Common Software Definition link.
The common software list is displayed in the main pane of the Common Software Definition page.
4. Click Add.
The Add Common Software Definition page opens.
5. Configure the common software information.
6. Click OK.
In the common software list, the software opens.
7. Click Back to return to the common software list.
Importing common software in batches
DAM allows you to collects software information from users through the iNode client. You can use the PC software control group function to import software information to the common software list for configuring a PC software control policy.
To import common software in batches:
1. Click the User tab.
2. From the navigation tree, select User Security Policy > PC Software Control Group.
3. At the upper right corner of the PC software control group list area, click the Common Software Definition link.
The common software list is displayed in the main pane of the Common Software Definition page.
4. Click Import from Asset.
The Import Common Software page opens.
5. In the Query Condition area, enter your query criteria:
¡ Software Name—Enter the software asset name.
¡ Software Version—Enter the software asset version.
¡ Asset Number—Enter the software asset number.
6. Click Query.
In the common software list, the query result page opens and has the following parameters:
¡ Software Name—Name of the software asset.
¡ Software Version—Version of the software asset.
¡ Assets—Installation time of the software asset.
7. In the common software list, select the box next to Software Name for the software asset you want to import.
8. Click OK.
The software is added to the common software list.
9. Click Back to return to the common software list.
Deleting a common software product
1. Click the User tab.
2. From the navigation tree, select User Security Policy > PC Software Control Group.
3. At the upper right corner of the PC software control group list area, click the Common Software Definition link.
The common software list is displayed in the main pane of the Common Software Definition page.
4. In the common software list, select the box next to Software Name for the common software you want to delete.
A confirmation dialog box opens.
5. Click OK.
Managing patch software
Access users that use the Linux or Mac OS operating system must use patch software to update patches on the operating system. In a security policy, you can enable patch software control. When an access user is authenticated, the iNode client checks the patch software on the user endpoint according to the configuration in the security policy. You can configure the patch software as needed. You can specify the patch software to be checked and then enable patch software check in the security policy.
Patch software list contents
The Linux Operating System and Mac OS Operating System areas list the patch software supported by the corresponding operating system.
The patch software list has the following parameters:
· Patch Software—Name of the patch software.
· Check—Indicates whether the corresponding patch software will be checked.
· Priority—Provides the Move Up
icon ![]() and Move Down icon
and Move Down icon ![]() for prioritizing items in the list.
for prioritizing items in the list.
Configuring patch software management
1. Click the User tab.
2. From the navigation tree, select User Security Policy > Patch Control > Patch Software.
The patch software list page opens.
3. To check the patch software, select Check for the associated patch software. To cancel checking the patch software, clear Check.
Managing Windows patches
Windows patch check through the Windows server is an automatic check, download, and installation process. You only need to enable Windows patch control check in the security policy.
The following information describes Windows patch check configurations on the EAD server such as querying, adding, modifying, and deleting Windows patches, and managing Windows versions.
Users must download and install patches. For access users using Windows for authentication, you can enable Windows patch control in a security policy. Access users can install Windows patches by using the Microsoft server check function or by manually checking patches.
· Microsoft server check function—The iNode client collaborates with WSUS or SMS to check for missing patches and the patch level, and installs patches automatically.
· Manual check—The iNode client cooperates with the EAD server to check missing patches.
You can configure Windows patches to be checked and the patch level. For more information, see "Adding a security policy."
Windows patch list contents
· Patch Name—Name of the Windows patch.
· Message—Message for the associated Windows patch. When the iNode client detects that the user endpoint lacks a patch, it displays this message.
· Applicable Windows Version—Windows version for the associated Windows patch.
· Patch Level—Patch priority level for the associated Windows patch: Critical, Important, Moderate, or Low.
· Modify—To modify the Windows patch, click the Modify
icon ![]() .
.
· Delete—To delete the Windows patch, click the Delete
icon ![]() .
.
Windows patch information details
The Windows patch information details page has the following parameters:
· Patch Name—Enter the patch name (for example, KB2508429, KB2509553).
· Message—Enter the prompt message. When the iNode client detects that the user endpoint lacks the patch, it displays this message.
· Patch Level—Select a patch priority level: Critical, Important, Moderate, or Low.
Applicable Windows version list
The applicable Windows version list shows the following information for the Windows versions to which the patch applies:
· Operating System—Operating system type: Windows.
· Version—Windows version.
· Language—Language used by the Windows operating system.
· Patch List—Patch list for the associated Windows version. Items in the list of patches are separated by commas.
Viewing the Windows patch list
1. Click the User tab.
2. From the navigation tree, select User Security Policy > Patch Control > Windows Patches.
The Windows Patches page opens.
3. To reset the query values and search results, and to restore the full patch list, click Reset.
Querying Windows patches
1. Click the User tab.
2. From the navigation tree, select User Security Policy > Patch Control > Windows Patches.
The Windows Patches page opens.
3. Enter one or more of the following query criteria:
¡ Patch Name—Enter the patch name.
¡ Version—Enter the operating system version.
¡ Language—Enter the language: ALL, Native Language, or English.
4. Click Query.
5. To reset query values and search results, and to restore the full patch list, click Reset.
Adding a Windows patch
1. Click the User tab.
2. From the navigation tree, select User Security Policy > Patch Control > Windows Patches.
The Windows Patches page opens.
3. Click Add.
The Add Windows Patch Control page opens.
4. Configure the basic information.
¡ Patch Name—Enter the patch name (for example, KB2508429, KB2509553).
¡ Message—Enter the prompt message. When the iNode client detects that the user endpoint lacks the patch, it displays this message.
¡ Patch Level—Select a patch priority level: Critical, Important, Moderate, or Low.
5. In the Applicable Windows Version area, select an operating system version.
6. Click OK.
Modifying a Windows patch
1. Click the User tab.
2. From the navigation tree, select User Security Policy > Patch Control > Windows Patches.
The Windows Patches page opens.
3. For the patch you want to modify, click the Modify icon ![]() .
.
4. Modify the basic information for the patch. You cannot modify Patch Control Name or Service Group.
In the Applicable Windows Version area, select an operating system version.
To remove the Windows version, clear Operating System.
5. Click OK.
Deleting a Windows patch
1. Click the User tab.
2. From the navigation tree, select User Security Policy > Patch Control > Windows Patches.
The Windows Patches page opens.
3. In the patch list for the target patch, click the Delete icon ![]() .
.
A confirmation dialog box opens.
4. Click OK.
Managing Windows versions
You can configure the applicable Windows versions when you add or modify Windows patches.
Windows version list contents
· Operating System—Operating system type.
· Version—Operating system version.
· Language—Language for the associated Windows version.
· Patch List—Patch list for the associated Windows version.
· Delete— To delete the Windows version, click the Delete icon ![]() .
.
Viewing a Windows version
1. Click the User tab.
2. From the navigation tree, select User Security Policy > Patch Control > Windows Patches.
The Windows Patches page opens.
3. At the upper right corner of the patch list, click the Windows Version link.
The Windows Versions page opens and displays all Windows versions.
4. Click Refresh to refresh the Windows version list.
Adding a Windows version
1. Click the User tab.
2. From the navigation tree, select User Security Policy > Patch Control > Windows Patches.
The patch list displays all Windows patches.
3. At the upper right corner of the patch list, click the Windows Version link.
The Windows Versions page opens and displays all Windows versions.
4. Click Add.
5. The Add Windows Version page opens.
To change the Windows version, you must first remove the old configured version, and then enter the correct version. You cannot modify the old configured version without removing it.
6. Configure the basic information for the Windows version:
¡ Version—Enter the Windows version. The spelling must exactly match that provided by Microsoft, such as XP or Windows 7 Professional Service Pack 1.
¡ Language—Select one of the following options:
- All—All languages, including English and non-English versions.
- Native Language—All non-English versions.
- English—English version.
7. Click OK.
Deleting a Windows version
Only Windows version items without patch configurations can be deleted. To delete items with patches, first delete the patches.
To delete a Windows version:
1. Click the User tab.
2. From the navigation tree, select User Security Policy > Patch Control > Windows Patches.
The patch list displays all Windows patches.
3. At the upper right corner of the patch list, click the Windows Version link.
The Windows Versions page opens and displays all Windows versions.
4. For the target Windows version, click the Delete icon ![]() .
.
A confirmation dialog box opens.
5. Click OK.
Managing registry control policies
In a security policy, you can enable registry control and specify the registry controls to be checked. To check the security of an access user, the iNode client checks the user endpoint according to the registry control policy configured in the security policy. In the registry control policy, you can specify the registries and their respective key names or values.
Registry control management allows you to query, view, add, modify, and delete a registry control policy. You can configure a registry control policy as needed.
Registry control list contents
· Registry Control Name—Name of the registry control. Click the name to view detailed information.
· Description—Description for the associated registry control.
· Registry Entry Location—Registry entry location for the associated registry control.
¡ Monitor (default)—After going online, the user is not informed about security problems. The user can access the network. Security check results are recorded in security logs.
¡ Inform—After going online, the user is informed of security problems. The system prompts the user to solve problems. The user can access the network. Security check results are recorded in security logs.
¡ Isolate—After going online, the user is informed of security problems. The system prompts the user to solve problems. The user can access resources in the isolation area according to the configured ACL. Security check results are recorded in security logs.
¡ Kick Out—After going online, the user is informed of security problems, fails the authentication, and is forced to log off. Security check results are recorded in security logs.
In Security Level configuration, when you select Global Security Mode the default action of the registry control check failure is invalid. You can specify whether Global Security Mode is used and you can specify the default action for the registry control check failure for each registry control policy.
· Service Group—Service group to which the registry control belongs.
· Modify—To modify the registry control, click the Modify icon ![]() .
.
· Delete— To delete the registry control, click the Delete
icon ![]() .
.
Registry control list details
The registry control list details page has a basic information area and a registry entry area.
Basic information area
· Registry Control Name—Name of the registry control.
· Registry Entry Location—Registry entry location for the registry control.
· Description—Description for the associated registry control.
· Failure Notification (Check Failure Message)—Message for the registry control check failure.
· Default Action for Check Failure—Default action for the registry control when the check fails, which can be:
¡ Monitor (default)—After going online, the user is not informed of security problems. The user can access the network. Security check results are recorded in security logs.
¡ Inform—After going online, the user is informed of security problems. The system prompts the user to solve problems. The user can access the network. Security check results are recorded in security logs.
¡ Isolate—After going online, the user is informed of security problems. The system prompts the user to solve problems. The user can access resources in the isolation area according to the configured ACL. Security check results are recorded in security logs.
¡ Kick out—After going online, the user is informed of security problems, fails the authentication, and is forced to log off. Security check results are recorded in security logs.
A new registry control uses the default action you configured for registry control check failure. In Security Level configuration, when you select Global Security Mode the default action of the registry control failure is invalid. You can specify whether Global Security Mode is used and you can specify the default action for registry control failure for each registry control.
· Service Group—Service group to which the registry control belongs.
Registry entry area
· Key Name—The name of the registry key. When the registry key name is (Default), you must select Default Key. The key type of a default key must be REG_SZ.
· Alias—Alias of the registry key. When an access user fails the registry control check, the iNode client uses the alias as the name of the registry key on the Security Check Result page.
· Check Type—Select a match mode: Value Matched, Value Not Matched, Key Existent, or Key Not Existent.
· Compatible Operating Systems—Select an operating system: Win2000, WinXP, Win2003, WinVista, or Win7. Only the selected operating system checks the registry key.
· Key Value Type—Select a key value type: REG_SZ or REG_DWORD.
· Key Value—Enter the key value of the registry key.
· Failure Notification—Enter the failure notification for the registry control. When the registry entry check for an access user fails, this failure notification is displayed on the Security Check Result page.
Viewing the registry control list
1. Select User Security Policy > Registry Control.
The registry control list displays all registry controls.
2. To sort the Registry Control List, click the column heading Registry Control Name, Registry Entry Location, Service Group, or Default Action for Check Failure.
Viewing a registry control
1. Click the User tab.
2. From the navigation tree, select User Security Policy > Registry Control.
The registry control list displays all registry controls.
3. Click the name of a registry control to view its information.
Querying the registry control
1. Click the User tab.
2. From the navigation tree, select User Security Policy > Registry Control.
The registry control list displays all registry controls.
3. Enter one or both of the following query criteria:
¡ Registry Control Name—Enter the name of the registry control.
¡ Registry Entry Location—Enter the location of the registry control.
4. Click Query.
The registry control list displays registry controls that match the query criteria.
5. To reset the query values and search results, and to restore the full registry control list, click Reset.
Adding a registry control
1. Click the User tab.
2. From the navigation tree, select User Security Policy > Registry Control.
The registry control list displays all registry controls.
3. Click Add.
The Add Registry Control page opens.
4. Configure the basic information.
5. Add a registry entry to the registry control list:
a. Click Add.
The Add Registry Entry dialog box opens.
b. Specify the Registry Entry information.
c. Click OK.
The new registry entry is added to the registry control list.
6. Click OK.
The added registry entry is also available on the security policy configuration page. For more information, see "Managing security policies."
Modifying a registry control
To modify a registry control:
1. Click the User tab.
2. From the navigation tree, select User Security Policy > Registry Control.
The registry control list displays all registry controls.
3. For the target registry control, click the Modify icon ![]() .
.
4. Modify the basic information. You cannot modify Registry Control Name or Service Group.
5. To add a registry entry to the registry control list:
a. Click Add.
The Add Registry Entry dialog box opens.
b. Specify the Registry Entry information.
c. Click OK.
The registry entry is added to the registry control list.
6. To modify a registry entry:
a. For the target registry entry, click the Modify icon ![]() .
.
The Modify Registry Entry dialog box opens.
b. Modify the Registry Entry information as needed.
c. Click OK.
The modified registry entry is added to the registry control list.
7. To delete a registry entry:
a. For the target registry entry, click the Delete icon ![]() .
.
A confirmation dialog box opens.
b. Click OK.
8. Click OK.
Deleting a registry control
If a registry entry is assigned to a security policy, it cannot be deleted. To delete the registry entry, first remove it from the security policy. For more information, see "Modifying a security policy."
To delete a registry entry:
1. Click the User tab.
2. From the navigation tree, select User Security Policy > Registry Control.
The registry control list displays all registry controls.
3. For the target registry entry, click the Delete icon ![]() .
.
A confirmation dialog box opens.
4. Click OK.
Managing share control
You can enable share control check for a security policy and specify a share control policy. When an access user is authenticated, the iNode client checks the user endpoint according to the share control policy configured in the security policy.
Share control policy management allows you to view, add, modify, and delete a share control policy. You can configure a share control policy as needed.
Share control list contents
· Share Control Name—Name of the share control. Click the name to view detailed information.
· Share—Indicates whether the share control allows folder sharing.
· Default Share—Indicates whether the share control allows default sharing.
· Windows XP Simple Share—Indicates whether the share control allows Windows XP simple sharing.
· Service Group—Service group to which the share control belongs.
· Modify—To modify the target share control, click the Modify
icon ![]() .
.
· Delete—To delete the target share control, click the Delete
icon ![]() .
.
|
|
NOTE: To sort the share control list, click the column heading Share Control Name, Share, Default Share, Windows XP Simple Share, or Service Group. |
Share control details
The share control details page has the following parameters:
· Share Control Name—Name of the share control. Click the name to view detailed information.
· Service Group—Service group to which the share control belongs.
· Default Action for Check Failure—Default action of the share control when the check fails:
¡ Monitor (default)—After going online, the user is not informed of security problems. The user can access the network. Security check results are recorded in security logs.
¡ Inform—After going online, the user is informed of security problems. The system prompts the user to solve problems. The user can access the network. Security check results are recorded in security logs.
¡ Isolate—After going online, the user is informed of security problems. The system prompts the user to solve problems. The user can access resources in the isolation area according to the configured ACL. Security check results are recorded in security logs.
¡ Kick out— After going online, the user is informed of security problems, fails the authentication, and is forced to log off. Security check results are recorded in security logs.
A new share control uses the default action you configured for share control check failure. In Security Level configuration, when you select Global Security Mode the default action of the share control failure is invalid.
· Description—Description for the associated registry control.
· Allow Share—Allows an access user to use the share function.
· Forbid Default Share—Prohibit an access user from using default sharing. This option is available only when the access user is allowed to use the share function.
· Forbid Windows XP Simple Share—Prohibit an access user from using Windows XP simple share. The option is available only when the access user is allowed to use the share function.
· Exclude Groups or Users from Sharing—Folder sharing rights are not assigned to Windows users and groups. Enter the user name and group name to which the share right cannot be assigned. Domain user names are in the format domain name\user name. User names are separated by commas and are case-sensitive.
Viewing the share control list
1. Click the User tab.
2. From the navigation tree, select User Security Policy > Share Control.
The share control list displays all share controls.
3. Click Refresh to refresh the share control list.
Viewing share control details
1. Click the User tab.
2. From the navigation tree, select User Security Policy > Share Control.
The share control list displays all share controls.
3. Click the name of the share control you want to view.
4. Click Back to return to the share control list.
Adding a share control
1. Click the User tab.
2. From the navigation tree, select User Security Policy > Share Control.
The share control list displays all share controls.
3. Click Add.
The Add Share Control page opens.
4. Configure the basic information.
5. Click OK.
The added share control is also available on the security policy configuration page. For more information, see "Managing security policies."
Modifying a share control
1. Click the User tab.
2. From the navigation tree, select User Security Policy > Share Control.
The share control list displays all share controls.
3. For the target share control, click the Modify icon ![]() .
.
4. Modify the share control. You cannot modify Registry Control Name or Service Group.
5. Click OK.
Deleting a share control
If a share control is assigned to a security policy, it cannot be deleted. To delete the share control, first remove it from the security policy. For more information, see "Modifying a security policy."
To delete a share control:
1. Click the User tab.
2. From the navigation tree, select User Security Policy > Share Control.
The share control list displays all share controls.
3. For the target share control, click the Delete icon ![]() .
.
A confirmation dialog box opens.
4. Click OK.
Managing traffic control
For a security policy, you can specify a traffic control policy. When an access user passes authentication, the iNode client periodically checks traffic on the user endpoint according to the traffic control policy configured in the security policy.
In the traffic control policy, you can configure the sampling interval, IP traffic monitoring, broadcast monitoring, packet number monitoring, and TCP/UDP connection monitoring.
Traffic control policy management allows you to view, add, modify, and delete a traffic control policy. You can configure a traffic control policy as needed.
Traffic control list contents
· Name—Name of the traffic control. Click the name to view detailed information.
· Description—Description for the associated traffic control.
· Service Group—Service group to which the traffic control belongs.
· Modify—To modify the target traffic control, click the Modify icon ![]() .
.
· Delete—To delete the target traffic control, click the Delete icon ![]() .
.
Traffic control details
The traffic control details page has the following areas:
· Basic information
· IP Traffic Monitoring
· Broadcast Packet Monitoring
· Packet Monitoring
· TCP/UDP Connection Monitoring
Basic information area
· Name—Name of the traffic control.
· Sampling Interval—Traffic sampling interval on the iNode client.
· Description—Description for the associated traffic control.
· Service Group—Service group to which the traffic control belongs.
IP Traffic Monitoring area
· Monitor IP Traffic—Indicates whether IP traffic monitoring is enabled for the traffic control.
· Minor Threshold—Minor threshold for IP traffic abnormality.
· Severe Threshold—Severe threshold for IP traffic abnormality.
Broadcast Packet Monitoring area
· Monitor Broadcast Packets—Indicates whether broadcast packet monitoring is enabled for the traffic control.
· Minor Threshold—Minor threshold for abnormal broadcast packets.
· Severe Threshold—Severe threshold for abnormal broadcast packets.
Packet Monitoring area
· Monitor Packets—Indicates whether packet monitoring is enabled for the traffic control.
· Minor Threshold—Minor threshold for abnormal packets.
· Severe Threshold—Severe threshold for abnormal packets.
TCP/UDP Connection Monitoring area
· Monitor TCP/UDP Connections—Indicates whether TCP/UDP connection monitoring is enabled for the traffic control.
· Minor Threshold—Minor threshold for abnormal TCP/UDP connections.
· Severe Threshold—Severe threshold for abnormal TCP/UDP connections.
Viewing the traffic control list
1. Click the User tab.
2. From the navigation tree, select User Security Policy > Traffic Control.
The traffic control list displays all traffic controls.
3. Click Refresh to refresh the traffic control list.
4. To sort the traffic control list, click the column heading Name, Share, or Service Group.
Viewing traffic control details
1. Click the User tab.
2. From the navigation tree, select User Security Policy > Traffic Control.
The traffic control list displays all traffic controls.
3. Click the name of the traffic control to view its information.
4. Click Back to return to the traffic control list.
Adding a traffic control
1. Click the User tab.
2. From the navigation tree, select User Security Policy > Traffic Control.
The traffic control list displays all traffic controls.
3. Click Add.
4. Configure the basic information.
5. For each type of monitoring that must be enabled, enter a Minor Threshold and a Severe Threshold:
¡ Monitor IP Traffic
¡ Monitor Broadcast Packets
¡ Monitor Packets
¡ Monitor TCP/UDP Connections
6. Click OK.
The traffic control is also available on the security policy configuration page. For more information, see "Managing security policies."
Modifying a traffic control
1. Click the User tab.
2. From the navigation tree, select User Security Policy > Traffic Control.
The traffic control list displays all traffic controls.
3. For the target
traffic control, click the Modify icon ![]() .
.
4. Modify the basic information. You cannot modify the name or service group.
5. Modify the parameters for each monitoring category of as needed (Monitor IP Traffic, Monitor Broadcast Packets, Monitor Packets, and Monitor TCP/UDP Connections):
¡ To disable a monitoring category, Select it.
¡ To enable a monitoring category, Unselect it.
¡ Modify each minor threshold or major threshold as needed.
6. Click OK.
Deleting a traffic control
When a traffic control is assigned to a security policy, it cannot be deleted. To delete the traffic control, first remove it from the security policy. For more information, see "Modifying a security policy."
To delete a traffic control:
1. Select User Security Policy > Traffic Control.
The traffic control list displays all traffic controls.
2. For the target
traffic control, click the Delete icon ![]() .
.
A confirmation dialog box opens.
3. Click OK.
Managing password control
You can enable password control for a security policy. When an access user is authenticated, the iNode client checks the password according to the built-in password check rules and password dictionary, and determines the security of the password.
Password check rules are built into the iNode client. You only need to specify the password dictionary. The default password dictionary includes common weak passwords such as names and company IDs. To enhance your system security, you can define new passwords as needed.
Modifying the password dictionary
The uploaded password dictionary file is stored in the installation path of the user self-service center. To modify the password dictionary and monitor the operating system password, first you must Install the user self-service center.
To modify the password dictionary:
1. Click the User tab.
2. From the navigation tree, select User Security Policy > Password Control.
3. In the Modify Password Dictionary area, perform the following steps:
a. Next to the Download URL field, click the download link to download the current password dictionary.
b. Use a text editor to add user-defined weak passwords to the password dictionary file.
The file name must be PasswordDic.txt. Each line in the file contains one password. The file size cannot exceed 2 MB.
c. Select Upload Password Dictionary.
The Password Dictionary File field is displayed.
d. Next to Password Dictionary File, click Browse to locate and select the previously edited password dictionary file, and then click OK.
e. From the Default Action for Check Failure list, select the default action for password check failure. A new password control uses the default action you configured for password control check failure.
- Monitor (default)—After going online, the user is not informed of security problems. The user can access the network. Security check results are recorded in security logs.
- Inform—After going online, the user is informed of security problems. The system prompts the user to solve problems. The user can access the network. Security check results are recorded in security logs.
- Isolate—After going online, the user is informed of security problems. The system prompts the user to solve problems. The user can access resources in the isolation area according to the configured ACL. Security check results are recorded in security logs.
- Kick Out—After going online, the user is informed of security problems. The authentication fails and the user is logged off. Security check results are recorded in security logs.
- Blacklist and Kick Out—After going online, the user is informed of security problems. The authentication fails, the user is added to the blacklist, and is logged off. Security check results are recorded in security logs.
4. Click OK.
Modifying the local password policy
The local password policy is used to control the length and complexity of passwords, password expiration, and password history on PCs. It is the same as the password policy in Windows local security settings.
To modify the local password policy:
1. Click the User tab.
2. From the navigation tree, select User Security Policy > Password Control.
The Password Control page opens.
3. In the Modify Local Password Policy area, perform the following steps:
a. Select Enable Local Password Policy.
b. Select Password must meet complexity requirements to enforce the following restrictions for new passwords configured on the PCs:
- A password cannot contain the user's account name or more than two consecutive characters in the user's full name.
- A password must contain at least six characters in length.
- A password must contain at least three of the following character types: uppercase letters, lowercase letters, digits, and special characters.
c. Configure the following parameters:
- Minimum Password Length—Specifies the least number of characters that a password must contain. The value range is 0 to 14. The value of 0 indicates that no password is required.
- Maximum Password Age (days)—Specifies the maximum time period that a password can be used before being changed. The value range is 0 to 999 days. The value of 0 indicates that passwords never expire.
- Minimum Password Age (days)—Specifies the minimum time period that a password must be used before being changed. The value range is 0 to 998 days. The value of 0 enables immediate password changes. If the maximum password age is not 0, the minimum password age must be less than the maximum password age. If the maximum password age is 0, the value range of the minimum password age is 0 to 998.
- Enforce Password History—Specifies the number of unique passwords that a user account must have used before reusing an old password. The value range is 0 to 24. For this parameter to take effect, the minimum password age cannot be 0.
4. Click OK.
|
|
NOTE: The local password policy does not take effect on domain users. |
Performing security check by using security policies
Configuring real-time monitoring
With the real-time monitoring function, the iNode client interacts with the EAD server to perform a periodic security check for online users. To ensure network security, the iNode client immediately processes any violation or abnormality detected on the user endpoint.
The following check items support real-time monitoring. In the security policy, operators must select the check items eto have them monitored in real time. The check items include:
· Anti-virus software
· Anti-spyware software
· Firewall software
· Anti-phishing software
· Hard disk encryption software
· PC software control groups
· Registries
· Share directories
The following check items do not support real-time monitoring:
· Windows patches
· Asset registration status
· Windows system restore
· Traffic monitoring
· Operating system password
With the exception of Windows patches, these items are checked at a system-defined interval that cannot be modified. To ensure the efficiency of EAD security checking, operators can define the interval at which Windows patches are checked in the service parameter configuration.
Enabling real-time monitoring
1. Click the User tab.
2. From the navigation tree, select User Security Policy > Security Policy.
The security policy list displays all security policies.
3. For the security
policy to enable real-time monitoring, click the Modify icon ![]() .
.
The Modify Security Policy page opens.
4. In the Basic Information area, configure the following parameters:
¡ Monitor in Real Time—To enable real-time monitoring of user endpoints in the security policy, select this option.
¡ Process After—Specify the amount of time, in minutes, that the iNode client waits before it isolates or kicks out an access user for whom a violation is detected in real-time monitoring. The iNode client prompts the user to make the necessary remediation and initiate a new security check to avoid being isolated or kicked out. This option is available only when the Monitor in Real Time option is selected.
5. Click OK.
Modifying the real-time monitoring parameters
In the service parameter configuration, operators can modify the Real-time Monitor Interval parameter to ensure both the efficiency of real-time monitoring and the performance of the user endpoint and EAD server.
EAD can forcibly check items that do not support real-time monitoring for users who stay online for a long time. To do this, in the service parameter configuration modify the Reauthentication Interval parameter.
To modify the real-time monitoring parameters:
1. Click the User tab.
2. From the navigation tree, select User Security Policy > Service Parameters > System Settings.
The System Parameters Config page opens.
3. Modify the following real-time monitoring parameters:
¡ Real-Time Monitor Interval—Enter the interval, in seconds, at which real-time security checks are performed. The default setting is 60 seconds.
¡ Reauthentication Interval—Enter the interval, in hours, at which an online user is forced to be reauthenticated. The default setting is 24 hours.
4. Click OK.
Configuring the default security policy for roaming users
For roaming users:
· On the visited network, the EAD server (not the local EAD server), checks for security items.
· You can configure only one security policy as the default security policy.
In the Security Policy List’s Policy Name field, the default security policy has the tag: [Default policy for roaming users].
To set the default security policy for roaming users:
1. Click the User tab.
2. From the navigation tree, select User Security Policy > Security Policy.
The security policy list displays all security policies.
3. For the target security policy you want to set as the default policy for
roaming users, click the Modify icon ![]() .
.
The Modify Security Policy page opens.
4. In the Basic Information area, select Set as Default Policy for Roaming Users.
5. Click OK.
Assigning security policies
When an endpoint user accesses the network, UAM determines the access scenario of the user and sends the matching security policy to the iNode client on the user's endpoint. If the user matches no other access scenario, the default security policy is used. The iNode client performs security checks on the user endpoint according to the received security policy.
Assigning the default security policy to a service
You can assign a security policy to a service as the default security policy. When a user matches no other access scenarios defined for the access policies of the service, EAD deploys the default security policy to the user.
To assign the default security policy to a service:
1. Click the User tab.
2. From the navigation tree, select User Access Policy > Access Service.
The access service list displays all access services.
3. For the access
service to which you want to assign a default security policy, click the Modify icon ![]() .
.
The Modify Access Service page opens.
4. In the Basic Information area from the Default Security Policy list, select the security policy you want to assign to the service. Or to disable security checks on users matching no access scenarios in the service, select Do not use.
5. Click OK.
Assigning a security policy to an access policy
You can assign a security policy to individual access policies in a service. When a user matches the access scenario defined for an access policy, EAD deploys the matching security policy to the user.
To assign a security policy to an access policy in a service:
1. Click the User tab.
2. From the navigation tree, select User Access Policy > Access Service.
The service list displays all services.
3. For the target
service, click the Modify icon ![]() .
.
The Modify Service Configuration page opens.
4. In the Access Scenario List area for the access scenario
to which you want to assign a security policy, click the Modify icon ![]() .
.
The Modify Access Scenario page opens.
5. From the Security Policy list, select a security policy or select Do Not Use to disable security checks on users matching the access scenario of the policy.
6. Click OK.
The Modify Access Scenario page closes.
7. Click OK.
Configuring Internet access control
Overview
The Internet access control feature is used when enterprise network users or PCs access the Internet through a wired or wireless network not provided by the enterprise. This feature is supported only on Windows PCs.
Depending on the user authentication or authorization status, users' Internet access can be classified into the following types:
· Authorized Internet access—Users are authorized to access the Internet through a network other than the enterprise network. Internet access audit policies are used to monitor and audit the users' Internet access behaviors.
· Unauthorized Internet access—Users gain unauthorized access to the Internet through a network other than the enterprise network. Client ACLs can be configured to prevent unauthorized Internet access.
· Authenticated Internet access—Users access the Internet by using multiple NICs at the same time after they pass the identity authentication on the enterprise network.
· Unauthenticated Internet access—Users access the Internet without passing the identity authentication on the enterprise network. Unauthenticated Internet access typically occurs outside the enterprise network.
EAD's Internet access control feature provides the following functions:
· Implement ACL-based access control to prevent unauthorized or unauthenticated access to the Internet.
· Monitor authenticated Internet access of users.
· Monitor unauthenticated Internet access of users.
To implement Internet access control, EAD must work with iNode clients that support the Lock Internet Access Ability feature. When access users are assigned Internet access control services, they can no longer access the network by using iNode clients that do not support the Lock Internet Access Ability feature.
Internet access control methods
Internet access control is based on policies that use either or both of the following control methods:
· State-Based Internet Access Control—When a user comes online, EAD deploys an online ACL and an offline ACL to the iNode client on the user's PC:
¡ The online ACL applies to authenticated Internet access and controls all NICs on the PC except the NIC that is connected to the enterprise network.
¡ The offline ACL applies to unauthenticated Internet access and controls all NICs on the PC.
· Ping-Based Internet Access Control—EAD deploys the offline ACLs named Offline Host ACL for Ping Success and Offline Host ACL for Ping Failure for ping-based Internet access control. Operators can configure up to two destination IP addresses to be pinged from the iNode client. Based on the ping results, the iNode client selects the offline ACL to apply to the PC's NICs When:
¡ One of the destination IP addresses can be pinged. The Offline Host ACL for Ping Success applies. The PC is considered to be within the enterprise network.
¡ Neither of the destination IP addresses can be pinged. The Offline Host ACL for Ping Failure applies. The PC is considered to be outside the enterprise network.
Client ACLs
Client ACLs are configured in EAD and used by both the state-based and ping-based Internet access control methods. When a user comes online, the client ACLs are deployed together with the Internet access policy to the iNode client. The iNode client then applies the correct ACLs to the NICs on the user's PC according to the Internet access control methods configured in the policy.
When the installation package of the iNode client was customized in iNode Management Center, a default client ACL must have been configured for the lock Internet access function. It takes effect when the iNode client is installed on the PC. When EAD deploys an offline ACL, the default ACL is overridden.
For more information about configuring client ACLs, see "Managing client ACLs."
Audit of unauthenticated Internet access
EAD provides the Ping Monitor Server for Offline Audit feature to monitor the Internet access behaviors of PCs that did not pass identity authentication by the enterprise network.
When none of the client connections are active, the iNode client periodically pings the monitor servers specified in the Internet access policy that is received from EAD. If a monitor server can be pinged, the iNode client considers that the PC is accessing the Internet and generates an offline audit log. When the PC comes online, the iNode client sends the Internet access audit log stored on the local PC to EAD.
Audit of authenticated Internet access
Use Internet access audit policies to monitor the Internet access behaviors of users who pass identity authentication by the enterprise network. An Internet access audit policy is a set of ACL rules for generating Internet access audit logs. When a user's Internet access behavior matches a rule for audit, the iNode client generates an Internet access audit log. The generated logs are sent to EAD at regular intervals for audit.
Internet access audit logs
EAD classifies Internet access audit logs into the following types:
· Online audit logs—When users are online, records Internet access behaviors of users through networks other than the enterprise network. The users are displayed in the online user list of UAM.
· Offline audit logs—When users are offline, records Internet access behaviors for PCs.
EAD enables you to search for Internet access audit logs through basic or advanced queries.
Internet access logging parameters
In system parameter settings, specify the lifetime of an Internet access audit log and the maximum number of Internet access audit logs to be kept in EAD. When an Internet access audit log expires or the number of Internet access audit logs exceed the limit, EAD automatically removes the oldest logs to accommodate new logs. This also helps improve log query efficiency and prevents accumulated Internet access logs from degrading system performance.
Managing Internet access policies
An Internet access policy includes the following configurations:
· Internet access control methods
· Client ACLs to be deployed to the iNode client
· Audit settings for unauthenticated Internet access (Ping Monitor Server for Offline Audit)
· Audit settings for authenticated Internet access (Internet Access Audit)
Viewing the Internet access policy list
1. Click the User tab.
2. From the navigation tree, select User Security Policy > Endpoint Access Control > Internet Access Policy.
The Internet Access Policy page opens.
Internet access policy list contents
¡ Internet Access Policy Name—Name of the Internet access policy. Click the name to view detailed information.
¡ Service Group—Service group to which the Internet access policy belongs.
¡ Description—Description of the Internet access policy.
¡ Modify—To modify the Internet access
policy, click the Modify icon ![]() .
.
¡ Delete—To delete the Internet access
policy, click the Delete icon ![]() .
.
3. Click Refresh to refresh the Internet access policy list.
Viewing Internet access policy details
1. Click the User tab.
2. From the navigation tree, select User Security Policy > Endpoint Access Control > Internet Access Policy.
The Internet Access Policy page opens.
3. Click the name of an Internet access policy to view detailed information.
The page showing detailed information about the Internet access policy opens.
Internet access policy details
Basic Information
¡ Internet Access Policy Name—Name of the Internet access policy.
¡ Service Group—Service group to which the Internet access policy belongs.
¡ Description—Description of the Internet access policy.
Internet access policy Information
¡ State-Based Internet Access Control—Select this option to enable state-based Internet access control. The following parameters are displayed only when this option is selected:
- All but Authenticated NIC—Select the ACL to apply to all NICs except the NIC connected to the enterprise network. An empty field indicates that no ACL is configured.
- Unauthenticated Hosts—Select the ACL to apply to all NICs on the PC when none of the connections in the iNode client are active. If no ACL is specified, the most recent ACL deployed to the iNode client is used. If no ACL has been deployed, the default ACL is used to control Internet access.
¡ Ping-Based Internet Access Control—Select this option to enable ping-based Internet access control. The following parameters are displayed only when this option is selected:
- Destination IP Address 1/Destination IP Address 2—Configure one or both of the IP addresses to be pinged by the iNode client.
- Offline Host ACL for Ping Success—Select the ACL to apply when a destination IP address is successfully pinged.
- Offline Host ACL for Ping Failure—Select the ACL to apply when neither of the destination IP addresses can be pinged.
¡ Ping Monitor Server for Offline Audit—Select this option to enable ping-based Internet access audit for unauthenticated Internet access. The following parameters are displayed only when this option is selected:
- Monitor Server IP—Specify a list of IP addresses to be pinged by the iNode client.
- Maximum Records—Specify the maximum number of ping success records that can be stored by the iNode client.
- Ping Interval (minutes)—specify the interval, in minutes, at which the iNode client pings the specified IP addresses.
¡ Enable Internet Access Audit—Select this option to enable audit for authenticated Internet access. The following parameters are displayed only when this option is selected:
- Audit Policy—Name of the Internet access audit policy used by the Internet access policy.
- Report Interval (minutes)—Specify the interval, in minutes, at which the iNode client sends Internet access audit logs to EAD.
4. Click Back to return to the Internet Access Policy page.
Adding an Internet access policy
1. Click the User tab.
2. From the navigation tree, select User Security Policy > Endpoint Access Control > Internet Access Policy.
The Internet Access Policy page opens.
3. Click Add.
The Add Internet Access Policy page opens.
4. Configure the basic information for the Internet access policy:
¡ Internet Access Policy Name—Enter the Internet access policy name.
¡ Service Group—Select the service group to which the Internet access policy belongs.
¡ Description—Enter the description of the Internet access policy. A detailed description can help facilitate maintenance.
¡ State-Based Internet Access Control—Select this option to enable state-based Internet access control. When this option is selected, the following parameters are displayed:
- All but Authenticated NIC—Select the ACL to apply to all NICs except the NIC connected to the enterprise network. An empty field indicates that no ACL is configured.
- Unauthenticated Hosts—Select the ACL to apply to all NICs on the PC when none of the connections in the iNode client are active. If no ACL is specified, the most recent ACL deployed to the iNode client is used. If no ACL has been deployed, the default ACL is used to control Internet access.
¡ Ping-Based Internet Access Control—Select this option to enable ping-based Internet access control. The following parameters are displayed only when this option is selected:
- Destination IP Address 1/Destination IP Address 2—Configure one or both of the IP addresses to be pinged by the iNode client.
- Offline Host ACL for Ping Success—ACL to apply when a destination IP address is successfully pinged.
- Offline Host ACL for Ping Failure—ACL to apply when neither of the destination IP addresses can be pinged.
¡ Ping Monitor Server for Offline Audit—Select this option to enable ping-based Internet access audit for unauthenticated Internet access. The following parameters are displayed only when this option is selected:
- Monitor Server IP—Specify a list of IP addresses to be pinged by the iNode client, one per line.
- Maximum Records—Specify the maximum number of ping success records that can be stored by the iNode client. When the limit is exceeded, the iNode client overwrites old records with new records.
- Ping Interval (minutes)—Specify the interval, in minutes, at which the iNode client pings the specified IP addresses.
¡ Enable Internet Access Audit—Select this option to enable audit for authenticated Internet access. The following parameters are displayed only when this option is selected:
- Audit Policy—Name of the audit policy to be used by the Internet access policy. For information about configuring audit policies, see "Managing Internet access audit policies."
- Report Interval (minutes)—Specify the interval, in minutes, at which the iNode client sends Internet access audit logs to EAD. The value range is 10 to 60 and the default is 30. The iNode client reports the Internet access audit logs to EAD at the specified interval and when the user logs off.
5. Click OK.
Internet access policies use client ACLs. For more information, see "Managing client ACLs."
Modifying an Internet access policy
1. Click the User tab.
2. From the navigation tree, select User Security Policy > Endpoint Access Control > Internet Access Policy.
The Internet Access Policy page opens.
3. For the Internet
access policy you want to
modify, click the Modify icon ![]() .
.
The page for modifying the Internet access policy opens.
4. Modify the Internet access policy parameters.
You can modify all parameters except Service Group.
5. Click OK.
Deleting an Internet access policy
When an Internet access policy is assigned to an access service, it cannot be deleted. To delete the policy, first remove it from the access service. For more information, see "Applying Internet access policies."
To delete an Internet access policy:
1. Click the User tab.
2. From the navigation tree, select User Security Policy > Endpoint Access Control > Internet Access Policy.
The Internet Access Policy page opens.
3. For the Internet
access policy you want to delete, click the Delete
icon ![]() .
.
A confirmation dialog box opens.
4. Click OK.
Managing Internet access audit policies
An Internet access audit policy specifies the rules for generating Internet access audit logs, which apply only to authenticated users. EAD enables you to configure and deploy Internet access audit policies to iNode clients. Each iNode client checks the users' Internet access packets according to the specified audit policy and periodically reports the matching audit logs.
EAD enables you to view, add, modify, and delete an Internet access audit policy.
Viewing the Internet access audit policy list
1. Click the User tab.
2. From the navigation tree, select User Security Policy > Endpoint Access Control > Internet Access Audit.
The Internet access audit policy list displays all Internet access audit policies.
Internet access audit policy list contents
¡ Policy Name—Internet access audit policy name. Click the name to view detailed information.
¡ Service Group—Service group to which the Internet access audit policy belongs.
¡ Description—Description of the Internet access audit policy.
¡ Modify—To modify the Internet access
audit policy, click the Modify icon ![]() .
.
¡ Delete—To delete the Internet access
audit policy, click the Delete icon ![]() .
.
3. Click Refresh to refresh the Internet access audit policy list.
Viewing Internet access audit policy details
1. Click the User tab.
2. From the navigation tree, select User Security Policy > Endpoint Access Control > Internet Access Audit.
The Internet access audit policy list displays all Internet access audit policies.
3. Click the name of an Internet access audit policy to view detailed information.
The page showing detailed information about the Internet access audit policy opens.
Internet access audit policy details
Basic Information
¡ Name—Name of the Internet access audit policy.
¡ Default Action—Action to take for packets that do not match any ACL rule, Audit or Not Audit.
¡ Description—Description of the Internet access audit policy.
¡ Service Group—Service group to which the Internet access audit policy belongs.
Audit ACL Rule List
¡ Enable Audit—Specify whether the iNode client generates Internet access audit logs to EAD when the ACL rule is matched.
¡ Protocol—Transport layer protocol identified by its name or number.
¡ Destination IP/Mask—Destination network IP address and mask length. The value of 0.0.0.0 matches all IP addresses.
¡ Destination Port—Specify the destination port number.
4. Click Back to return to the Internet access audit policy list.
Adding an Internet access audit policy
1. Click the User tab.
2. From the navigation tree, select User Security Policy > Endpoint Access Control > Internet Access Audit.
The Internet access audit policy list displays all Internet access audit policies.
3. Click Add.
The Add Internet Access Audit page opens.
4. Configure the following basic information:
¡ Name—Enter the name of the Internet access audit policy.
¡ Default Action—Configure whether Internet access audit logs are generated by the iNode client for packets that do not match any ACL rule. Options are Audit and Not Audit.
¡ Description—Enter a description of the Internet access audit policy.
¡ Service Group—Select the service group to which the Internet access audit policy belongs.
5. Add an audit ACL rule to the Internet access audit policy:
a. In the Audit ACL Rule List area, click Add.
The Add Audit ACL Rule page opens.
b. Configure the following parameters for the audit ACL rule:
- Enable Audit—Configure whether Internet access audit logs are generated by the iNode client for packets that match the ACL rule. Options are Audit and Not Audit.
- Protocol—Select the name or number of the transport layer protocol.
- Destination IP/Mask—Specifies the destination network IP address and mask length. The value of 0.0.0.0 matches all IP addresses.
- Destination Port—Specifies the destination port number.
c. Click OK.
6. To add more audit ACL rules, repeat step 5.
7. Adjust the priority of the ACL rules:
¡ To increase the priority
of the audit
ACL rule, click the Move up
icon ![]() .
.
¡ To reduce the priority of the audit ACL rule, click
the Move down icon ![]() .
.
The audit ACL rules displayed in the Audit ACL Rule List are in descending order of priority. The rule with a higher priority is matched against first. After a match is found for a packet, the remaining rules are ignored.
8. Click OK.
Modifying an Internet access audit policy
1. Click the User tab.
2. From the navigation tree, select User Security Policy > Endpoint Access Control > Internet Access Audit.
The Internet access audit policy list displays all Internet access audit policies.
3. For the Internet
access audit policy you want to modify, click the Modify
icon ![]() .
.
The page for modifying the Internet access audit policy opens.
4. Modify the basic information for the Internet access audit policy.
You can modify all the parameters except Policy Name and Service Group.
5. Modify the audit ACL rules of the Internet access audit policy:
a. To modify settings of an audit ACL rule, click the Modify icon ![]() .
.
b. To delete an audit ACL rule, click the Delete icon ![]() .
.
c. To increase the
priority of an audit ACL rule,
click the Move up icon ![]() .
.
d. To reduce the priority of an audit ACL rule, click
the Move down icon ![]() .
.
6. Click OK.
Deleting an Internet access audit policy
If an Internet access audit policy is assigned to an Internet access policy, it cannot be deleted. To delete the audit policy, first remove it from the Internet access policy. For more information, see "Adding an Internet access policy."
To delete an Internet access audit policy:
1. Click the User tab.
2. From the navigation tree, select User Security Policy > Endpoint Access Control > Internet Access Audit.
The Internet access audit policy list displays all Internet access audit policies.
3. For the Internet
access audit policy you want to delete, cick the Delete
icon ![]() .
.
A confirmation dialog box opens.
4. Click OK.
Managing Internet access audit logs
The online audit logs and offline audit logs are managed separately for Internet access behaviors.
Viewing the online audit log list
1. Click the User tab.
2. From the navigation tree, select User Access Log > Internet Access Audit Log.
The Online Audit List displays all online audit logs.
Online Audit List contents
¡ Account Name—Account name used by the online user to access the Internet.
¡ User Name—Name of the IMC Platform user associated with the access user account.
¡ Start Time (Server)—Logging start time recorded by the EAD server.
¡ End Time (Server)—Logging end time recorded by the EAD server when the EAD server received the Internet access audit log.
¡ Destination IP—Destination IP address the online user accessed.
¡ Source IP—Source IP address used by the online user to access the Internet.
¡ Destination Port—Destination port accessed by the online user.
¡ Protocol Number—Transport layer protocol number. Common transport layer protocol numbers are 1 (ICMP), 6 (TCP), and 17 (UDP).
¡ NIC Name—Name of the NIC used by the online user to access the Internet.
¡ MAC Address—MAC address used by the online user to access the Internet.
¡ Packet Number—Total number of packets sent by the online user that match the ACL rule for auditing.
¡ Details—To view detailed information about an online audit log, click the Details icon ![]() .
.
Querying online audit logs
Basic query
1. Click the User tab.
From the navigation tree, select Access User View > Log Management > Internet Access Audit Log. The Online Audit List displays all online audit logs.
2. Specify one or more of the following query criteria:
¡ Account Name—Enter a partial or complete account name used by the online user to access the Internet.
¡ User Name—Enter a partial or complete name of the IMC Platform user with which the access user account is associated.
¡ Start Time (Server) From/To—Specify the range of the logging start time
recorded by the EAD server in the format of YYYY-MM-DD hh:mm. You can manually
enter the time range or click the Calendar icon ![]() to select the time range. The default is 00:00 to 23:59.
to select the time range. The default is 00:00 to 23:59.
¡ Destination IP From/To—Specify the destination IP address range the online user accessed.
Empty fields are ignored.
3. Click Query. The Online Audit List displays all online audit logs that match the query criteria. Click Reset to clear the query criteria and display all online audit logs.
Advanced query
1. Click the User tab.
2. From the navigation tree, select Access User View > Log Management > Internet Access Audit Log.
The Online Audit List displays all online audit logs.
3. At the upper right of the query area, click Advanced Query.
4. Specify one or more of the following query criteria:
¡ Account Name—Enter a partial or complete account name used by the online user to access the Internet.
¡ User Name—Enter a partial or complete name of the IMC Platform user with which the access user account is associated.
¡ User Group—Click the User Group icon ![]() . On the Select User Group page that opens,
select the user group to which the online user belongs and click OK.
. On the Select User Group page that opens,
select the user group to which the online user belongs and click OK.
¡ Service Name—Enter the name of the service used by the online user.
¡ Start Time (Server) From/To—Specify the logging
time range recorded by the EAD server in the format of YYYY-MM-DD hh:mm. You can manually enter the time
range, or click the Calendar icon ![]() to select the time range. The default range is 00:00 to 23:59.
to select the time range. The default range is 00:00 to 23:59.
¡ Start Time (Client) From/To—Specify the logging time range recorded by the iNode client, in the format of YYYY-MM-DD hh:mm. You
can manually enter the time range or click the Calendar icon ![]() to select the
time range.
to select the
time range.
¡ Destination IP From/To—Specify the destination IP address range the online user accessed.
¡ Destination Port From/To—Specify the destination port range the online user accessed.
¡ Source IP From/To—Specify the source IP address range of the online user.
¡ Packet Number From/To—Specify a range for the total number of packets sent by the online user that matches ACL rules for auditing.
¡ Protocol Number—Select the number of the transport layer protocol used by the online user to access the Internet.
¡ NIC Name—Enter a partial or complete name of the NIC used by the online user to access the Internet.
¡ MAC Address—Enter a partial or complete MAC address used by the online user to access the Internet. Valid MAC address formats are XX-XX-XX-XX-XX-XX, XXXX-XXXX-XXXX, and XX:XX:XX:XX:XX:XX.
Empty fields are ignored.
5. Click Query. The Online Audit List displays all online audit logs that match the query criteria. Click Reset to clear all the query criteria and display all online audit logs.
Viewing online audit log details
1. Click the User tab.
2. From the navigation tree, select Access User View > Log Management > Internet Access Audit Log.
The Online Audit List displays all online audit logs.
3. To view detailed information for an online audit log, click the Details icon ![]() .
.
The page displays detailed information about the online audit log with the following parameters:
¡ Account Name—Account name used by the online user to access the Internet.
¡ User Name—Name of the IMC Platform user with which the access user account is associated.
¡ Service Name—Name of the service used by the online user.
¡ User Group—User group to which the online user belongs.
¡ Start Time (Server)—Logging start time recorded by the EAD server.
¡ End Time (Server)—Logging end time recorded by the EAD server, which is the time when the EAD server received the log.
¡ Start Time (Client)—Logging start time recorded by the iNode client.
¡ End Time (Client)—Logging end time recorded by the iNode client.
¡ Destination IP—Destination IP address the online user accessed.
¡ Source IP—Source IP address used by the online user.
¡ Destination Port—Destination port accessed by the online user.
¡ Protocol Number—Number of the transport layer protocol used by the online user. Common transport layer protocol numbers include 1 (ICMP), 6 (TCP), and 17 (UDP).
¡ NIC Name—Name of the NIC used by the online user to access the Internet.
¡ MAC Address—MAC address used by the online user to access the Internet.
¡ Packet Number—Total number of packets sent by the user that match the ACL rule whose Enable Audit is set to Audit.
4. Click Back to return to the online audit log List.
Viewing the offline audit log list
1. Click the User tab.
2. From the navigation tree, select User Access Log > Internet Access Audit Log.
3. Click the Offline Audit tab.
The Offline Audit List displays all offline audit logs.
Offline Audit List contents
¡ Account Name—Account name of the user to pass identity authentication by the enterprise network.
¡ User Name—Name of the IMC Platform user associated with the access user account.
¡ MAC Address—MAC address used by the PC to access the Internet.
¡ Monitor Time—Time when the iNode client generated the ping success record.
¡ Reachable IP—IP address that can be pinged by the iNode client.
Querying offline audit logs
1. Click the User tab.
2. From the navigation tree, select Access User View > Log Management > Internet Access Audit Log.
3. Click the Offline Audit tab.
The Offline Audit List displays all offline audit logs.
4. Specify one or more of the following query criteria:
¡ Account Name—Enter a partial or complete account name of the user to pass identity authentication by the enterprise network.
¡ User Name—Enter a partial or complete name of the IMC Platform user with which the access user account is associated.
¡ Start Time From/To—Specify the time range when the user's Internet access started in the format of YYYY-MM-DD hh:mm. You can manually enter the time
range or click the Calendar icon ![]() to select the time range. The default is 00:00 to 23:59.
to select the time range. The default is 00:00 to 23:59.
¡ User Group—Click the User Group icon ![]() . In the Select User Group dialog box, select
the user group to which the offline user belongs and click OK.
. In the Select User Group dialog box, select
the user group to which the offline user belongs and click OK.
¡ MAC Address—Enter a partial or complete MAC address used to access the Internet. Valid MAC address formats are XX-XX-XX-XX-XX-XX, XXXX-XXXX-XXXX, and XX:XX:XX:XX:XX:XX.
¡ Reachable IP—Specify the monitor server IP address that can be pinged by the iNode client.
Empty fields are ignored.
5. Click Query. The Offline Audit List displays all offline audit logs that match the query criteria. Click Reset to clear the query criteria and display all offline audit logs.
Configuring Internet access logging parameters
In system parameter settings, specify the lifetime of an Internet access audit log and the maximum number of Internet access audit logs that are kept by the system. These settings help improve log query efficiency and prevent accumulated Internet access logs from degrading system performance.
To configure Internet access logging parameters:
1. Click the User tab.
2. From the navigation tree, select User Security Policy > Service Parameters> System Settings.
The System Settings page opens.
3. Configure the Internet access log keeping parameters:
¡ Internet Access Audit Log Keeping Time (Days)—Specify the maximum number of days an Internet access audit log will be stored. Every morning, the system automatically deletes logs whose lifetime exceeds the specified keeping time. The default is 30 days.
¡ Max Internet Access Audit Logs (10000)—Specify the maximum number of Internet access audit logs (in increments of ten thousand) that will be stored. When the specified number is reached, the system automatically deletes the oldest logs. The default is ten million.
4. Click OK.
Applying Internet access policies
To apply an Internet access policy, perform one of the following tasks:
· Configure the policy as the default Internet access policy for a service.
· Assign the policy to an access scenario in a service.
When a user comes online, EAD deploys the correct Internet access policy among other service settings to the iNode client of the user:
· If the user does not match any of the access scenarios in the service, the default Internet access policy in the service takes effect.
· If the user matches an access scenario in the service, the access policy defined in the matching access scenario takes effect.
Configuring the default Internet access policy for an access service
1. Click the User tab.
2. From the navigation tree, select User Security Policy > Access Service.
The Access Service page opens.
3. For the target access service, click the Modify icon ![]() .
.
The page for modifying the access service opens.
4. In the Basic Information area, select the Internet access policy you want to assign to the access service from the Default Internet Access Policy list. Or to apply no default Internet access policy, select Do not use.
5. Click OK.
Assigning an Internet access policy to an access scenario
1. Click the User tab.
2. From the navigation tree, select User Security Policy > Access Service.
The Access Service page opens.
3. For a target service, click the Modify icon ![]() .
.
The page for modifying the service opens.
4. In the Access Scenario
List, click the Modify icon ![]() for the access scenario to which you want to assign an Internet access policy.
for the access scenario to which you want to assign an Internet access policy.
The Modify Access Scenario page opens.
5. From the Internet Access Policy list, select the Internet access policy. Or to assign no Internet access policy to the scenario, select Do not use.
6. Click OK.
Configuring the security check for smart devices
EAD implements the security check on smart devices by working with a third-party MDM solution of the C/S structure.
· The MDM client runs on smart devices to register with the MDM server.
· The MDM server provides:
¡ Management functions such as application pushing and security control.
¡ A Web-based API interface through which EAD cooperates with the MDM server to implement the security check on smart devices.
EAD supports MDM vendors MobileIron and Citrix. For more information about deploying and using MDM solutions, see the documentation provided by the vendors.
Similar to the PC security check, EAD implements the security check on smart devices based on security policies.
Security policy contents
A security policy for smart devices consists of a security level, an isolation mode, and an MDM collaboration policy as the security check item. The MDM collaboration policy contains check options that vary by MDM vendor. For more information about configuring MDM vendor settings, see "Managing MDM vendors."
Security level
A security level defines what actions to take when security vulnerabilities are detected. EAD provides several system-defined security levels and associated default actions to be performed when vulnerability is discovered as shown in Table 21.
EAD generates security logs of violations for all security levels. The VIP mode and Monitor mode perform the same default action on smart devices, but they perform different default actions on PCs. The same rules apply to the Guest mode and the Kick out mode. For more information about configuring security levels for PCs, see "Configuring the security check for PCs." For more information about configuring security levels for smart devices, see "Managing security levels."
Table 21 System-defined security levels
|
Security level |
Default action in response to the security vulnerability on smart devices |
|
VIP mode |
Informs the user of the security vulnerability and remediation methods. |
|
Guest mode |
Logs off the user. |
|
Isolate mode |
Isolates the user. |
|
Monitor mode |
Informs the user of the security vulnerability and remediation methods. |
|
Kick Out mode |
Logs off the user. |
|
Blacklist and Kick Out mode |
Adds the user to the blacklist, logs off the user, and informs the noncompliant users of the security vulnerability and remediation methods. |
Isolation mode
EAD provides the following isolation modes as shown in Table 22.
|
Isolation mode |
Method |
|
Deploy ACLs to the access device |
· Non-HP ProCurve devices—EAD deploys the ACL number or name to the access device. The ACLs must already exist on the access device. For more information about configuring ACLs, see the configuration guide for the access device. · HP ProCurve devices—This mode cannot be used for isolating smart devices. |
|
Deploy ACLs to the iNode client |
This mode cannot be used for isolating smart devices. |
|
Deploy VLANs to the access device |
EAD deploys the VLAN ID to the access device. The VLANs must already exist on the access device. For more information about configuring VLANs, see the configuration guide for the access device. |
Security check item
EAD provides only the MDM collaboration policy as the security check item for smart devices. The check options in the policy vary by vendor as shown in Table 23.
Table 23 MDM vendors and security check options
|
MDM Vendor |
Security check options |
|
MobileIron |
· Require endpoint registered—The smart device must have been registered with the MobileIron server. · Require endpoint compliant—The smart device must comply with the rules configured on the MobileIron server. · Enable GPS service—The GPS service must be enabled on the smart device. · Enable auto lock—Auto lock must be enabled on the smart device. · Disable Bluetooth—Bluetooth must be disabled on the smart device. · Require camera disabled—Cameras must be disabled on the smart device. · Prohibit jailbreaking or rooting—The smart device must not be jailbroken or rooted. · Require password locking enabled—Password locking must be enabled on the smart device. · Require storage encryption enabled—Storage encryption must be enabled on the smart device. |
|
Citrix |
· Require endpoint registered—The smart device must have been registered with the Citrix server. · Require endpoint compliant—The smart device must comply with the rules configured on the Citrix server. · Prohibit jailbreaking or rooting—The smart device must not be jailbroken or rooted. · Require storage encryption enabled—Storage encryption must be enabled on the smart device. |
Managing MDM vendors
For EAD to cooperate with an MDM server, first configure the MDM vendor type and MDM server settings on EAD.
Configuring MDM vendor settings
1. Click the User tab.
2. From the navigation tree, select User Security Policy > Service Parameters > MDM Vendor Config.
The MDM Vendor Configuration page opens.
3. Configure the following parameters:
a. MDM Vendor Type— From the list, select an MDM vendor type: Disabled, MobileIron, or Citrix.
b. Server Address—Enter the IP address of the MDM server.
c. Port Number—Enter the API port number of the MDM server.
d. Username—Enter the username for accessing the MDM server.
e. Password—Enter the password for accessing the MDM server.
f. Confirm Password—Confirm the password.
4. To test the connectivity between the EAD server and the MDM server, click Test Connectivity.
5. Click OK.
Make sure the MDM vendor settings are the same as the MDM server settings. If you want to change to a different vendor, you must delete all existing MDM collaboration policies before you can modify the MDM vendor settings.
Manually validating MDM vendor settings
EAD automatically validates the MDM vendor settings when the configuration is complete. If automatic validation fails, you must manually validate the settings.
To validate MDM vendor settings:
1. Click the User tab.
2. From the navigation tree, select User Security Policy > Service Parameters > Validate.
Managing security policies
Security policy management allows you to view, add, modify, and delete security policies.
Security policy list contents
The security policy list has the following parameters:
· Policy Name—Name of the security policy. Click the policy name to view detailed information.
· Security Level—Security level used by the security policy. Click the security level name to view detailed information.
· Isolation Mode—Isolation mode of the security policy:
¡ Not Deploy—No isolation mode is specified.
¡ Deploy ACLs to Access Device—Isolates smart devices by ACLs. The ACLs must be supported on non-HP ProCurve devices.
¡ Deploy ACLs to iNode Client—Isolates smart devices by using iNode client ACLs. This parameter is not supported in the security policy for smart devices.
¡ Deploy VLANs to Access Device—Isolates smart devices by VLANs.
· Security ACL or VLAN—The ACL or VLAN applied to smart devices that pass the security check.
· Isolation ACL or VLAN—The ACL or VLAN applied to smart devices that fail the security check.
· Service Group—Service group for the security policy.
· Modify—To modify settings of the target security policy, click the Modify icon ![]() .
.
· Delete—To delete
the target security policy, click the Delete icon ![]() .
.
Security policy details
The security policy details page has the following areas:
· Common Configuration—Basic information about the security policy and the isolation mode configuration.
· PC—Security check items for PCs.
· Smart Device—Security check items for smart devices.
UAM identifies the check items for smart devices from PC check items in the same security policy based on the endpoint type and access scenario. EAD performs the security check after it is informed of the check items by UAM.
The following information introduces security check items for smart devices. For more information about configuring security check items for PCs, see "Configuring the security check for PCs."
Basic Information area
The basic information area has the following parameters:
· Policy Name—Unique name of the security policy.
· Service Group—Service group for the security policy.
· Security Level—Security level used by the security policy. Click the security level name to view detailed information.
· Description—Description of the security policy.
The following parameters are not supported in the security policy for smart devices:
· Monitor in Real Time
· Process After
· Set as Default Policy for Roaming Users
· Check Passed Message
Isolation Mode area
The isolation mode area has the following parameters:
· Configure Isolation Mode—Indicates whether an isolation mode is configured. If this option is:
¡ Not selected, the security policy does not have an isolation mode.
¡ Selected, the security policy uses the Deploy ACLs to Access Device or Deploy VLANs to Access Device isolation mode.
The security check for smart devices does not support deploying ACLs to the iNode client.
The following parameters are displayed only when the Configure Isolation Mode option is selected:
· Deploy ACLs to Access Device—Isolates smart devices by using ACLs. The access device must be a non-HP ProCurve device.
¡ For Non-HP ProCurve-Security ACL—Number or name of the ACL for smart devices that pass the security check.
¡ For Non-HP ProCurve-Isolation ACL—Number or name of the ACL for smart devices that fail the security check.
¡ Deploy VLANs to Access Device—Isolates smart devices by using VLANs.
¡ Security VLAN—ID of the VLAN for smart devices that pass the security check.
¡ Isolation VLAN—ID of the VLAN for smart devices that fail the security check.
MDM Collaboration Policy area
The MDM collaboration area has the following parameters:
· Check MDM Collaboration Policy Configuration—Indicates whether the security policy needs MDM collaboration. For smart devices, this option is selected in the security policy.
· MDM Collaboration Policy—Name of the MDM collaboration policy.
· Check Failure Prompt—Notification message for security check failure. EAD pushes this message to smart devices that fail the security check.
Viewing the security policy list
1. Click the User tab.
2. From the navigation tree, select User Security Policy > Security Policy.
The security policy list is displayed. For more information, see "Security policy list contents."
3. Click Refresh to view the most recent security policy list.
Viewing security policy details
1. Click the User tab.
2. From the navigation tree, select User Security Policy > Security Policy.
The security policy list is displayed.
3. Click the name of a security policy.
The View Security Policy page opens. For more information, see "Security policy details."
4. Click Back.
Adding a security policy
1. Click the User tab.
2. From the navigation tree, select User Security Policy > Security Policy.
The security policy list is displayed.
3. Click Add.
The Add Security Policy page opens.
4. Configure basic information for the security policy.
The policy name must be unique in EAD.
5. In the Smart Device area, configure the MDM collaboration policy parameters.
6. Click OK.
Modifying a security policy
1. Click the User tab.
2. From the navigation tree, select User Security Policy > Security Policy.
The security policy list is displayed.
3. For a target security policy, click the Modify icon ![]() .
.
The Modify Security Policy page opens.
4. Modify basic information for the security policy. The Policy Name and Service Group fields cannot be modified.
5. Modify the MDM collaboration policy parameters.
6. Click OK.
Deleting a security policy
A security policy cannot be deleted when it is assigned to an access service. To delete the policy, first remove it from the access service. For more information, see HPE IMC User Access Manager Administrator Guide.
To delete a security policy:
1. Click the User tab.
2. From the navigation tree, select User Security Policy > Security Policy.
The security policy list is displayed.
3. For a target security policy, click the Delete icon ![]() .
.
A confirmation dialog box opens.
Managing security levels
Security level management allows you to view, add, modify, and delete security levels. The following information introduces security level settings for smart devices. For more information about security level settings for PCs, see "Configuring the security check for PCs."
Security level contents
A security level consists of the following areas:
· Basic Information—Basic information about the security level.
· PC—Actions to take on a PC for each check item.
· Smart Device—Actions to take on a smart device for each check item.
The Smart Device area displays an MDM collaboration policy and the check options. Each check option has a security mode and a device action. EAD works with the access device and the MDM server to execute the actions on noncompliant smart devices.
When violations on a smart device are mapped to different security modes, the security mode with the highest severity applies. Table 24 shows the security modes for smart devices in descending order of severity.
Table 24 Security modes for smart devices
|
Security mode |
Description |
|
Kick out |
EAD directs the access device to log off the smart device and generates security logs. |
|
Isolate |
EAD directs the access device to isolate the smart device and generates security logs. |
|
None |
EAD generates security logs. |
The MDM server performs the following device actions on noncompliant smart devices through the MDM client as shown in Table 25.
|
Device action |
Description |
|
Lock |
EAD directs the MDM server to lock the smart device and generates security logs. |
|
Wipe corporation data |
EAD directs the MDM server to wipe the corporation data on the smart device and generates security logs. |
|
Wipe data |
EAD directs the MDM server to restore the factory settings on the smart device and generates security logs. |
Security level list contents
The security level list has the following parameters:
· Security Level Name—Name of the security level. Click the security level name to view detailed information.
· Description—Description of the security level.
· Service Group—Service group for the security level.
· Modify—To modify
settings for the target security level, click the Modify icon ![]() .
.
· Delete— To delete
the target security level,
click the Delete icon ![]() .
.
Security level details
The security level details page has a Basic Information area, a Smart Device area, and a PC area. The following information introduces parameters in the Basic Information and Smart Device areas. For more information about security level parameters for PCs, see "Configuring the security check for PCs."
Basic Information area
This area has the following parameters:
· Security Level Name—Name of the security level.
· Action After—This parameter applies only to PCs.
· Description—Description of the security level.
· Service Group—Service group for the security level.
Smart Device area
When an MDM vendor is configured, this area has the following parameters:
· MDM Check Not Supported—Actions to take on smart devices that do not support a configured check option (except the Require Endpoint Registered option). This parameter is not displayed when it is not configured for a security level.
· Endpoint Not Registered—Action to take on a smart device that does not register with the MDM server.
· Endpoint Incompliant—Actions to take on a smart device that does not comply with the rules configured on the MDM server.
· Device Rooted or Jailbroken—Actions to take on a jailbroken or rooted smart device.
· Storage Encryption Disabled—Actions to take on a smart device on which storage encryption is disabled.
When MobileIron is the vendor type, this area also has the following parameters:
· GPS Service Not Enabled—Actions to take on a smart device on which the GPS service is disabled.
· Auto Lock Not Enabled—Actions to take on a smart device on which the auto lock function is disabled.
· Bluetooth Service Not Disabled—Actions to take on a smart device on which Bluetooth is enabled.
· Camera Enabled—Actions to take on a smart device on which the camera is enabled.
· Password Locking Disabled—Actions to take on a smart device on which password locking is disabled.
Viewing the security level list
1. Click the User tab.
2. From the navigation tree, select User Security Policy > Security Level.
The security level list is displayed. For more information about the security level list, see "Security level list contents."
3. Click Refresh to view the most recent security level list.
Viewing security level details
1. Click the User tab.
2. From the navigation tree, select User Security Policy > Security Level.
The security level list is displayed.
3. Click the name of a security level.
The View Security Level page opens. For more information about security level details, see "Security level contents."
4. Click Back.
Adding a security level
1. Click the User tab.
2. From the navigation tree, select User Security Policy > Security Level.
The security level list is displayed.
3. Click Add.
The Add Security Level page opens.
4. Configure the basic information for the security level.
The security level name must be unique in EAD. The Action After parameter does not take effect on smart devices.
5. In the Smart Device area, configure the actions to take on a smart device for each check option..
¡ Citrix supports the following options:
- Device Rooted or Jailbroken
- Endpoint Incompliant
- Endpoint Not Registered
- MDM Check Not Supported
- Storage Encryption Disabled
¡ MobileIron supports the following options:
- Auto Lock Not Enabled
- Bluetooth Service Not Disabled
- Camera Enabled
- Device Rooted or Jailbroken
- Endpoint Incompliant
- Endpoint Not Registered
- GPS Service Not Enabled
- MDM Check Not Supported
- Password Locking Disabled
- Storage Encryption Disabled
6. Click OK.
Modifying a security level
1. Click the User tab.
2. From the navigation tree, select User Security Policy > Security Level.
The security level list is displayed.
3. For a target security level, click the Modify icon ![]() .
.
The Modify Security Level page opens.
4. Modify basic information for the security level. The Security Level Name and Service Group fields cannot be modified.
5. In the Smart Device area, modify the actions to take on a smart device for each check option.
¡ Citrix supports the following options:
- Device Rooted or Jailbroken
- Endpoint Incompliant
- Endpoint Not Registered
- MDM Check Not Supported
- Storage Encryption Disabled
¡ MobileIron supports the following options:
- Auto Lock Not Enabled
- Bluetooth Service Not Disabled
- Camera Enabled
- Device Rooted or Jailbroken
- Endpoint Incompliant
- Endpoint Not Registered
- GPS Service Not Enabled
- MDM Check Not Supported
- Password Locking Disabled
- Storage Encryption Disabled
6. Click OK.
Deleting a security level
When a security level is assigned to a security policy, it cannot be deleted. To delete the security level, first remove it from the security policy. For more information, see "Modifying a security policy."
1. Click the User tab.
2. From the navigation tree, select User Security Policy > Security Level.
The security level list is displayed.
3. For a target security level, click the Delete icon ![]() .
.
A confirmation dialog box opens.
4. Click OK.
Managing MDM collaboration policies
An MDM collaboration policy contains items to be checked for smart devices. The check results are provided by the MDM server and are used together with security level settings to determine the security status of a smart device.
MDM collaboration policy management:
· Allows you to view, add, modify, and delete MDM collaboration policies.
· Supports only iOS and Android smart devices.
The execution result of the device action varies by third-party MDM vendor.
MDM collaboration policy list contents
The MDM collaboration policy list has the following parameters:
· Policy Name—Name of the MDM collaboration policy. Click the policy name to view detailed information.
· Description—Description of the MDM collaboration policy.
· Service Group—Service group for the MDM collaboration policy.
· Modify—To modify settings for the target MDM collaboration policy, click the Modify icon ![]() .
.
· Delete— To delete the target MDM collaboration policy, click the Delete icon ![]() .
.
MDM collaboration policy details
The MDM collaboration policy details page has the following parameters:
· Policy Name—Name of the MDM collaboration policy.
· Service Group—Service group for the MDM collaboration policy.
· Check options for Citrix:
¡ Require Endpoint Registered—The policy requires smart devices to be registered with the Citrix server. The following check options can be performed only on registered smart devices.
¡ Require Endpoint Compliant—The policy requires smart devices to comply with the rules configured on the Citrix server.
¡ Prohibit Jailbreaking or Rooting—The policy requires smart devices not to be jailbroken or rooted.
¡ Require Storage Encryption Enabled—The policy requires storage encryption to be enabled on smart devices.
· Check options for MobileIron:
¡ Require Endpoint Registered—The policy requires smart devices to be registered with the MobileIron server. The following check options can be performed only on registered smart devices.
¡ Require Endpoint Compliant—The policy requires smart devices to comply with the rules configured on the MobileIron server.
¡ Enable GPS Service—The policy requires the GPS service to be enabled on smart devices.
¡ Enable Auto Lock—The policy requires the auto lock function to be enabled on smart devices.
¡ Disable Bluetooth—The policy requires Bluetooth to be disabled on smart devices.
¡ Require Camera Disabled—The policy requires cameras to be disabled on smart devices.
¡ Prohibit Jailbreaking or Rooting—The policy requires smart devices not to be jailbroken or rooted.
¡ Require Password Locking Enabled—The policy requires password locking to be enabled on smart devices.
¡ Require Storage Encryption Enabled—The policy requires storage encryption to be enabled on smart devices.
· Description—Description of the MDM collaboration policy.
Viewing the MDM collaboration policy list
1. Click the User tab.
2. From the navigation tree, select User Security Policy > MDM Collaboration Policy.
The MDM collaboration policy list is displayed. For more information about the MDM collaboration policy list, see "MDM collaboration policy list contents."
3. Click Refresh to view the most recent MDM collaboration policy list.
Viewing MDM collaboration policy details
1. Click the User tab.
2. From the navigation tree, select User Security Policy > MDM Collaboration Policy.
The MDM collaboration policy list is displayed.
3. Click the name of an MDM collaboration policy.
The View MDM Collaboration Policy page opens. For more information about MDM collaboration policy details, see "MDM collaboration policy details."
4. Click Back.
Adding an MDM collaboration policy
1. Click the User tab.
2. From the navigation tree, select User Security Policy > MDM Collaboration Policy.
The MDM collaboration policy list is displayed.
3. Click Add.
The Add MDM Collaboration Policy page opens.
4. Configure the Policy Name, Service Group, and Description parameters. The policy name must be unique in EAD.
5. Configure the check options.
¡ Citrix supports the following options:
- Prohibit Jailbreaking or Rooting
- Require Endpoint Compliant
- Require Endpoint Registered
- Require Storage Encryption Enabled
¡ MobileIron supports the following options:
- Disable Bluetooth
- Enable Auto Lock
- Enable GPS Service
- Prohibit Jailbreaking or Rooting
- Require Camera Disabled
- Require Endpoint Compliant
- Require Endpoint Registered
- Require Password Locking Enabled
- Require Storage Encryption Enabled
6. Click OK.
Modifying an MDM collaboration policy
1. Click the User tab.
2. From the navigation tree, select User Security Policy > MDM Collaboration Policy.
The MDM collaboration policy list is displayed.
3. For a target MDM collaboration policy, click
the Modify icon ![]() .
.
The Modify MDM Collaboration Policy page opens.
4. Modify the description of the MDM collaboration policy. Policy Name and Service Group cannot be modified.
5. Configure the check options.
¡ Citrix supports the following options:
- Prohibit Jailbreaking or Rooting
- Require Endpoint Compliant
- Require Endpoint Registered
- Require Storage Encryption Enabled
¡ MobileIron supports the following options:
- Disable Bluetooth
- Enable Auto Lock
- Enable GPS Service
- Prohibit Jailbreaking or Rooting
- Require Camera Disabled
- Require Endpoint Compliant
- Require Endpoint Registered
- Require Password Locking Enabled
- Require Storage Encryption Enabled
6. Click OK.
Deleting an MDM collaboration policy
If a MDM collaboration policy is assigned to a security policy, it cannot be deleted. To delete the MDM collaboration policy, first remove it from the security policy. For more information, see "Modifying a security policy."
To delete a MDM collaboration policy:
1. Click the User tab.
2. From the navigation tree, select User Security Policy > MDM Collaboration Policy.
The MDM collaboration policy list is displayed.
3. For a target MDM collaboration policy, click
the Delete icon ![]() .
.
A confirmation dialog box opens.
4. Click OK.
Managing hierarchical EAD networks
Hierarchical management applies to large-scale organizations and their branches for central management on user access and endpoint security.
In the hierarchical management module, a network management station deployed with IMC PLAT, IMC UAM, and IMC EAD is a node. A hierarchical EAD network typically sets the headquarters as the root node and its branches as subordinate nodes. The subordinate nodes form parent-child relationships with other nodes in the hierarchy.
Hierarchical management requires the operator to first establish trust relationships among the parent node and child nodes. With hierarchical management, the parent node can deploy services, security policies, and EAD service parameters to its child nodes, and child nodes report security data to their parent node.
|
|
NOTE: Hierarchical management applies only to the EAD networks of PCs. |
Configuring the policy management mode
EAD supports the following policy management modes:
· Centralized policy management—Uses a central EAD server located at the headquarters to deploy security policies and services to every branch EAD server. The branch EAD servers use the deployed security policies to control security check for access users and to report security data to the central EAD server. Operators can view the security statistics report for the entire organization from the central EAD server.
· Non-centralized policy management—Allows branches to define their access services and security policies and to report data to the central EAD server. Operators can view the security statistics report for every branch from the central EAD server.
To configure the policy management mode:
1. Click the User tab.
2. From the navigation tree, select User Security Policy > Service Parameters > System Settings.
3. For Centralized Policy Management, select Yes or No.
4. Click OK.
|
|
NOTE: The policy management mode configuration takes effect only on the current node and its child nodes. To modify the policy management mode for the current node, first delete all its child nodes. |
Managing nodes in a hierarchical EAD network
Hierarchical node management applies to enterprises or organizations and their branches. By allowing deployment of EAD servers at both the headquarters and the individual branches, hierarchical node management helps to improve efficiency and flexibility of EAD security checking for all branches.
With hierarchical node management, each set of EAD components requires its own license based on the number of users to be managed.
An EAD server can act as a parent node, child node, or both. Each EAD server can have multiple child nodes but only one parent node.
Child node list contents
The child node list has the following parameters:
· Policy Update Time—Time when the policy of the current node was last updated. This parameter is available only when Centralized Policy Management is set to Enable.
· Node Name—Name of the child node. Click the name to view detailed information.
· Status—State of the child node:
¡ Normal—Indicates that communication between the child node and the current node is normal.
¡ Abnormal—Indicates that either the last report was empty, the last report time was more than 40 minutes ago, or the last deployment failed.
· IP Address—IP address of the child node.
· Port—Listening port of the child node.
· Protocol Type—Protocol type used to access the child node. Only HTTP is supported.
· Last Report Time—Time when the child node last reported security data to the current node.
· Last Deploy—Time when the current node last performed a deployment to its child nodes.
· Operation Result—Operation result of the last deployment.
· Operation—Provides the following management options:
¡ Configure—Configure the services to be deployed to the child node. This option is available only when Centralized Policy Management is set to Enable.
¡ Deploy—Deploy the selected services to the child node. This option is available only when Centralized Policy Management is set to Enable.
¡ Deployment History—View the deployment history of the child node. This option is available only when Centralized Policy Management is set to Enable.
¡ Modify—Modify the settings of the child node.
¡ Delete—Delete the child node.
Child node information
The child node information details page has the following areas:
· Basic Information
· Real-time statistics on the number of users on the child node
· Real-time statistics on the number of user-services failing the security check on the child node
Basic Information area
· Node Name—Name of the child node.
· Status—State of the child node: Normal or Abnormal.
· Reason for Abnormality—Reason why the child node is abnormal. When a child node is in the normal state, this field is empty.
· IP Address—IP address of the child node.
· Port—Listening port of the child node.
· Protocol Type—Protocol type used by the current node to access the child node. Only HTTP is supported.
· AUTH for Accessing Child Node—Indicates whether identity authentication is required for accessing the child node. Identity authentication is required in centralized policy management.
· Login Name—User name used by the current node to access the child node. This field is available only when AUTH for Accessing Child Node is set to Enable.
· Last Report Time—Time when the child node last reported data to the current node.
· Last Success Deploy—Time when the current node last performed a successful deployment on the child node.
· Last Deploy—Time when the current node last performed a deployment operation.
· Operation Result—Result of the last deployment performed by the current mode operation.
· Reason—Reason why the last deployment failed. If the last deployment was successful, this field is empty.
Real-time statistics on the number of users on the child node area
· UAM total permitted—Last reported maximum number of access users permitted by the license on the child node.
· UAM used—Last reported number of existing access users on the child node.
· EAD total permitted—Last reported maximum number of EAD users permitted by the license on the child node.
· EAD used—Last reported number of existing EAD users on the child node.
· Number of online users—Last reported number of online users on the child node.
· Number of secure online users—Last reported number of online users who passed the security check on the child node.
· Number of insecure online users—Last reported number of online users who failed the security check on the child node. Insecure users include those who are monitored, informed, isolated, and are to be kicked out.
· Number of unknown online users—Last reported number of unknown online users on the child node. Unknown users include those who are not required to pass the security check and those who are currently going through the security check.
· Number of blacklist users—Last reported number of blacklisted access users on the child node.
· Number of guests—Last reported number of guests on the child node.
Real-time statistics on the number of user-services failing the security check on the child nodes area
· Anti-virus software check failures—Number of access users who failed the anti-virus software check.
· Anti-phishing software check failures—Number of access users who failed the anti-phishing software check.
· Firewall software check failures—Number of access users who failed the firewall software check.
· Anti-spyware software check failures—Number of access users who failed the anti-spyware software check.
· Hard disk encryption software check failures—Number of access users who failed the hard disk encryption software check.
· Windows patch check failures—Number of access users who failed the Windows patch check.
· Patch software check failures—Number of access users who failed the patch software check.
· Application check failures—Number of access users who failed the application check.
· Number of users failing smart device software control group check—Number of access users who failed the smart device software control group check.
· Number of users failing smart device configuration check—Number of access users who failed the smart device configuration check.
· Registry check failures—Number of access users who failed the registry check.
· Share directory check failures—Number of access users who failed the share directory check.
· Traffic monitoring check failures—Number of access users who failed the traffic monitoring check.
· Operating system password check failures—Number of access users who failed the operating system password check.
· Asset registration check failures—Number of access users who failed the asset registration check.
Parent node information
The parent node information page has the following parameters:
· IP Address—IP address of the parent node.
· Port—Listening port of the parent node.
· Protocol Type—Protocol type used by the current node to access the parent node.
· Confirmed or Not—Indicates whether the parent node has been confirmed.
Viewing the child node list
1. Click the User tab.
2. From the navigation tree, select User Security Policy > Hierarchical Node.
The child node list displays all child nodes of the current node.
3. To sort the child node list, click the column heading Node Name, Status, IP Address, Port, Protocol Type, Last Report Time, Last Deploy, or Operation Result.
4. Click Refresh to refresh the child node list.
Modifying the name of the current node
1. Click the User tab.
2. From the navigation tree, select User Security Policy > Hierarchical Node.
The child node list displays all child nodes of the current node.
3. Click Modify Self.
The Modify Self page opens.
4. In the Node Name field, enter the name of the current node.
5. Click OK.
Viewing child node details
1. Click the User tab.
2. From the navigation tree, select User Security Policy > Hierarchical Node.
The child node list displays all child nodes of the current node.
3. Click the name of a child node to view detailed information.
The Child Node Information page opens.
4. Click Back to return to the child node list of the current node.
Adding a child node
You cannot configure a node's own parent node (or any other node above the current node) as a child node of the current node.
To add a child node to the current node:
1. Click the User tab.
2. From the navigation tree, select User Security Policy > Hierarchical Node.
The child node list displays all child nodes of the current node.
3. Click Add.
The Add Child Node page opens.
4. Configure the following parameters for the child node:
¡ Node Name—Enter the name of the child node.
¡ IP Address—Enter the IP address of the child node that is deployed with the EAD component.
¡ Port—Enter the listening port of the child node.
¡ Protocol Type—Select the protocol type used to access the child node. Only HTTP is supported.
¡ AUTH for Accessing Child Node—Select this option to enable identity authentication for accessing the child node. Identity authentication is required in centralized policy management.
¡ Login Name—Enter the user name used to access the child node. The user name must be that of an administrator of the child node. This parameter is available only when AUTH for Accessing Child Node is set to Enable.
¡ Login Password—Enter the login password of the administrator. This parameter is available only when AUTH for Accessing Child Node is set to Enable.
The new child node is added to the child node list of the current node.
The current node cannot deploy services to this child node until an operator logs in to the child node to confirm the current node as its parent node. For more information, see "Confirming the parent node."
Modifying a child node
To modify a child node of the current node:
1. Click the User tab.
2. From the navigation tree, select User Security Policy > Hierarchical Node.
The child node list displays all child nodes of the current node.
3. For the child node
you want to modify, click the Modify icon ![]() .
.
The Modify Child Node page opens.
4. Modify the parameters for the child node.
For more information, see "Adding a child node."
5. Click OK.
Deleting a child node
To remove the parent-child relationship between the current node and its child node, perform the following operations:
1. On the current node, delete the child node.
2. On the child node, remove the current node as the parent node.
After the parent-child relationship is removed, the current node no longer collects statistics from the child node for the multi-node statistics report.
To delete a child node:
1. Click the User tab.
2. From the navigation tree, select User Security Policy > Hierarchical Node.
The child node list displays all child nodes of the current node.
3. For the child node you
want to delete, click the Delete icon ![]() .
.
A confirmation dialog box opens.
4. Click OK.
Confirming the parent node
A node cannot receive deployment contents from the parent node until the parent node is confirmed.
To confirm the parent node for the current node:
1. Click the User tab.
2. From the navigation tree, select User Security Policy > Hierarchical Node.
The child node list displays all child nodes of the current node.
3. Click Confirm Parent Node.
The Confirm Parent Node page opens.
4. View the parent node information.
5. Click OK.
Deleting the parent node
To remove the parent-child relationship between the current node and its parent node, perform the following operations:
1. On the parent node, delete the current node as its child node.
2. On the current node, remove the parent node.
After the parent-child relationship is removed, the current node no longer reports data to the parent node.
To delete the parent node for the current node:
1. Click the User tab.
2. From the navigation tree, select User Security Policy > Hierarchical Node.
The child node list displays all child nodes of the current node.
3. Click Delete Parent.
The Delete Parent page opens.
Deploying services, security policies, and service parameters
Hierarchical management offers automatic and manual deployment of services, security policies used by the services, and EAD service parameters from a node to its child nodes. The node deploys the EAD service parameters Data Reporting Time and Data Lifetime to its child nodes because they cannot be configured on individual child nodes. A child node uses the deployed services and security policies for identity authentication and security check.
With automatic deployment, a node checks the Policy Update Time for child nodes daily at the scheduled deployment time. If the Policy Update Time is later than the last successful deployment time, the node performs deployment.
The policy update time is refreshed, as well as any changes to the service parameters, security policies, and security check items.
Deployment contents
The contents of both automatic and manual deployment depend on the centralized policy management status. When centralized policy management is:
· Enabled, automatic and manual deployment both deliver services, security policies, and service parameters to the child nodes.
· Disabled, automatic and manual deployment both deliver only service parameters to the child nodes.
Specifying the services to be deployed to a child node
1. Click the User tab.
2. From the navigation tree, select User Security Policy > Hierarchical Node.
The child node list displays all child nodes immediately below the current node.
3. For the child node to which you want services to be deployed, click the Configure icon ![]() .
.
The Specify Services to Be Deployed page opens.
The service list displays the following information about all available services:
¡ Service—Name of the service.
¡ Service Suffix—Suffix of the service.
¡ Security Policy—Default security policy used by the service.
4. Select one or more services you want to deploy to the child node.
5. Click OK.
Scheduling automatic deployment tasks
1. Click the User tab.
2. From the navigation tree, select User Security Policy > Hierarchical Node.
The child node list displays all child nodes of the current node.
3. Click Auto Deployment.
The Configure Automatic Deployment dialog box opens.
4. In the Deploy Everyday At field, enter the daily deployment time. The value must be an integer in the range 0 to 23 in 24-hour notation.
5. Click OK.
Manually deploying configurations to a child node
1. Click the User tab.
2. From the navigation tree, select User Security Policy > Hierarchical Node.
The child node list displays all child nodes of the current node.
3. For a child node, click the Deploy icon ![]() to start the deployment.
to start the deployment.
4. Click OK.
The current node immediately deploys configurations to the child node and after the deployment is complete, displays the deployment result.
Managing the deployment and receipt history
In a hierarchical EAD network, each node performs the following operations to maintain the deployment and receipt history:
· Creates a deployment record each time the node deploys services, security policies, or service parameters to a child node.
· Creates a receipt record each time the node receives services, security policies, or service parameters from its parent node.
EAD enables you to view and query the deployment and receipt histories of the current node.
Deployment history list contents
The deployment history list has the following parameters:
· Deployment Time—Time when the deployment was performed.
· Deployment Type—How the deployment was performed: Manual or Auto.
· Result—Result of the deployment: Succeeded or Failed.
· Reason—Reason why the deployment failed.
· Services—Names of the deployed services, separated by commas.
· File Name—Pathname of the file that stores the deployment contents.
Receipt history list contents
The receipt history list has the following parameters:
· Receipt Time—Time when the current node received the deployment content from its parent node.
· Result—Result of the receipt: Succeeded or Failed.
· Reason—Reason why the receipt failed.
· Services—Names of the received services, separated by commas.
Viewing the deployment history list
1. Click the User tab.
2. From the navigation tree, select User Security Policy > Hierarchical Node.
The child node list displays all child nodes of the current node.
3. For a child node, click the Deployment History icon ![]() .
.
The Deployment History List displays the deployment history from the current node to the child node.
4. Click Back to return to the child node list of the current node.
Viewing the receipt history list
1. Click the User tab.
2. From the navigation tree, select User Security Policy > Policy Receipt History.
The Receipt History List displays the receipt history of the current node from its parent node.
Querying the deployment history to a child node
1. Click the User tab.
2. From the navigation tree, select User Security Policy > Hierarchical Node.
The child node list displays all child nodes of the current node.
3. For a child node, click the Deployment History icon ![]() .
.
The Deployment History List displays the deployment history from the current node to the child node.
4. Specify one or more of the following query criteria:
¡ Deployment Time from/to—Specify a
deployment time range. You can click the Calendar icon ![]() to select the
time or enter a date in YYYY-MM-DD format.
to select the
time or enter a date in YYYY-MM-DD format.
¡ Deployment Type—Select the deployment type: Manual or Auto.
¡ Result—Select the result of the deployment: Succeeded or Failed.
Empty fields are ignored.
5. Click Query.
The Deployment History List displays the history records that match the query criteria.
6. To clear the query criteria and display all deployment history records, click Reset.
Querying the receipt history of the current node
1. Click the User tab.
2. From the navigation tree, select User Security Policy > Policy Receipt History.
The Receipt History List displays all receipt history records of the current node from its parent node.
3. Specify one or more of the following query criteria:
¡ Receipt Time from/to—Specify a
receipt time range. To select the time, you can click the Calendar
icon ![]() or
enter a date in YYYY-MM-DD format.
or
enter a date in YYYY-MM-DD format.
¡ Result—Select the receipt result: Succeeded or Failed.
Empty fields are ignored.
4. Click Query.
The Receipt History List displays the receipt history records that match the query criteria.
5. To clear the query criteria and display all receipt history records of the current node, click Reset.
Managing the EAD node topology
The EAD node topology provides a topology view of the current node and its child nodes in the hierarchical EAD network. With the EAD node topology, operators can conveniently view the running status and security statistics of the child nodes, and customize the background picture for a child node.
Accessing the EAD node topology
1. Click the User tab.
2. From the navigation tree, select User Security Policy > EAD Node Topology.
The EAD node topology is displayed.
Toolbar options
· 1:1 ![]() —Display the topology in its original size.
—Display the topology in its original size.
· Zoom In![]() —Zoom in on the topology.
—Zoom in on the topology.
· Zoom Out ![]() —Zoom out on the
topology.
—Zoom out on the
topology.
· Fit Content ![]() —Fit the contents of the topology to the page.
—Fit the contents of the topology to the page.
· Magnifier ![]() —Magnify the contents of the topology.
—Magnify the contents of the topology.
· Over View ![]() —Display or hide the bird's-eye view page of the topology.
—Display or hide the bird's-eye view page of the topology.
· Hand Tool ![]() /Pointer Tool
/Pointer Tool ![]() —
—
¡ To
move the topology on the page, click the
Hand Tool icon ![]() .
.
¡ To
select a node in the topology and view detailed information, click the Pointer Tool icon ![]() .
.
· Add Background ![]() —Add or change the
background picture of the topology.
—Add or change the
background picture of the topology.
· Remove Background ![]() —Remove the
background picture of the topology. When the topology has no background picture, this icon is unavailable.
—Remove the
background picture of the topology. When the topology has no background picture, this icon is unavailable.
· Save ![]() —Save the
modifications made to the topology.
—Save the
modifications made to the topology.
· Save as Image ![]() —Save the topology
as an image in PNG format.
—Save the topology
as an image in PNG format.
· Add Node ![]() —Add a node to the topology. Available options include the current node and all of its child
nodes.
—Add a node to the topology. Available options include the current node and all of its child
nodes.
· Icon Management ![]() —Modify the type
and description of the node icon.
—Modify the type
and description of the node icon.
· Legend![]() —View
the legends. Table 26
provides a detailed description of the legends.
—View
the legends. Table 26
provides a detailed description of the legends.
· Refresh ![]() —Refresh
the topology.
—Refresh
the topology.
|
Type |
Legends |
Description |
|
Node Status |
|
Abnormal nodes are displayed as red icons. Normal nodes are displayed as green icons. |
|
Node Icon |
|
Operators can assign different graphic icons to nodes for identification purposes. |
Right-click menu of the EAD node topology
· Hide Node Name/Show Node Name—Hide or show the node names in the topology.
· Adjust Background > Manual Adjust—Manually adjust the size of the background picture.
· Adjust Background > Resume Original Size—Restore the background picture of the topology to its original size.
· Exit Background—Exit the background picture editing mode.
Right-click menu of a node
· Remove from Diagram—Remove the node from the topology.
· View Node—View details of the node. This option is available only for child nodes of the current node. For more information, see "Viewing child node details."
Left-click information of a node
· Node Name—Name of the node.
· Node Type—Type of the node icon.
· Status—State of the node: Normal or Abnormal.
· IP Address—IP address of the node.
· Total Access Users—Number of access users on the node.
· Online Users—Number of online users on the node.
Adding a node to the EAD node topology
By default, the EAD node topology is empty. To enable management and monitoring of the nodes from the topology, you must manually add nodes (the current node or its child nodes) to the topology.
To add a node to the EAD node topology:
1. Click the User tab.
2. From the navigation tree, select User Security Policy > EAD Node Topology.
The EAD node topology is displayed.
3. Click the Add Node icon![]() .
.
The Node List displays all nodes that can be added to the topology, including the current and all of its child nodes.
4. Select the node you want to add to the topology:
a. Jn the Node Name field, enter a partial or complete name of the node.
b. Click Query.
The Node List displays all nodes that match the query criteria.
c. Select the target node.
5. From the Node Type list, select a node type that you want to add.
6. Click OK.
The selected node is displayed on the EAD node topology.
7. To add more nodes to the topology, repeat steps 3 through 6.
Uploading a background picture
1. Click the User tab.
2. From the navigation tree, select User Security Policy > EAD Node Topology.
The EAD node topology is displayed.
3. Click the Add Background icon![]() .
.
The Topology Background-picture Setting page opens.
4. Select the option User Upload Picture.
5. Click Browse to select the picture you want to upload as the background picture.
When you select the background picture, follow these guidelines:
¡ Use a GIF, JPG, JPEG, or PNG picture. Pictures in other formats may not be displayed correctly.
¡ The picture file cannot exceed 10 MB and the dimension cannot exceed 1000×1000 pixels.
¡ The picture file name can contain only alphanumeric characters, spaces, underscores (_), and hyphens (-).
6. Click Preview to preview the effect.
7. Click Set.
The selected picture is uploaded to the EAD server as the background picture of the topology.
8. Click Close.
Using an existing picture as the background picture
1. Click the User tab.
2. From the navigation tree, select User Security Policy > EAD Node Topology.
The EAD node topology is displayed.
3. In the toolbar, click the Add Background icon![]() .
.
The Topology Background-picture Setting page opens.
4. Select the option Select Picture From Server.
5. Click Select Picture to select a picture.
The system automatically magnifies the selected picture as the preview.
6. To set the picture as the background picture for the topology, click Set.
7. Click Close.
Modifying a node icon
EAD predefines five node icons. You can modify the type and description of a node icon. However, you cannot add new node icons or delete the predefined node icons.
To modify a node icon:
1. Click the User tab.
2. From the navigation tree, select User Security Policy > EAD Node Topology.
The EAD node topology is displayed.
3. In the toolbar, click the Icon Management
icon![]() .
.
The Icon List displays all the predefined node icons.
Icon List contents
¡ Node Icon—Predefined node icons:
- ![]() (The default node
icon.)
(The default node
icon.)
¡ Node Icon Type—Type of the node icon.
¡ Description—Description of the node icon.
4. For the node icon you want to modify, click the
Modify icon ![]() .
.
5. Modify the type and description of the node icon.
6. Click OK.
Managing desktop assets
DAM uses the iNode client to collect hardware and software information for each asset. It then implements asset management, statistics collection, desktop control, asset audit, software deployment, and report generation.
DAM manages registered assets only. Operators must first register desktop assets to be managed with DAM. Assets use assigned asset numbers for registration. EAD supports the following modes of numbering desktop assets:
· Manual numbering—Operators must manually number desktop assets and specify asset information, such as owners, asset types, and physical locations in DAM.
· Automatic numbering—DAM automatically numbers desktop assets. Operators must enable auto-numbering in the DAM service parameters.
DAM supports the following desktop asset management functions:
· Managing asset groups—Allows operators to manage asset groups. Operators can create asset groups and subgroups, and then apply desk control schemes or deploy software to asset groups and subgroups.
· Managing assets—Provides asset management functions, such as regrouping assets and batch importing assets.
· Exporting asset information—Allows operators to export asset information and manage export history records.
· Collecting asset statistics—Allows operators to collect asset statistics by asset type, CPU, hard disk, operating system, or software installation.
· Managing export tasks—Allows operators to schedule a task to export USB file transfer logs.
Managing asset groups
Operators can manually create asset groups and subgroups in DAM, or allow DAM to automatically create asset groups and subgroups based on existing user groups on the IMC platform. When assets are automatically created based on user groups, every asset is automatically added to the group to which its owner belongs. Assets that do not have an owner are added to Ungrouped, which is a special asset group automatically created by DAM.
DAM supports an asset group hierarchy of a maximum of five levels.
Asset group list contents
· Expand All/Collapse All—To expand the asset group, click the Expand
All icon ![]() . To collapse the asset group, click the Collapse
All icon
. To collapse the asset group, click the Collapse
All icon ![]() . The Expand All and Collapse All icons
are unavailable for asset groups with no subgroups.
. The Expand All and Collapse All icons
are unavailable for asset groups with no subgroups.
· Group Name—Displays the name of the asset group. Click the name to view detailed information about the asset group. This field also shows the group level:
¡ For a top-level asset group, this field displays only the group name.
¡ For
a middle-level asset group that has subgroups and a parent group, this field
displays the group name and a Group icon ![]() next to the name.
next to the name.
¡ For bottom-level asset groups that have
only a parent group, this field displays the group name and a Group icon ![]() next to the name.
next to the name.
· Control Scheme—Displays the name of the desktop control scheme assigned to the asset group. Click the name to view details of the scheme, which contains a set of control policies. For more information, see "Configuring desktop control schemes."
· Asset List—To view assets in the asset group, click the Asset
List icon ![]() .
.
· Add Sub-Group—To add a subgroup to the asset group, click the Add Sub-Group icon ![]() . This link is not available for members of
the asset group Ungrouped, which is a system-defined
asset group that cannot have a subgroup.
. This link is not available for members of
the asset group Ungrouped, which is a system-defined
asset group that cannot have a subgroup.
· Modify—To modify the asset group, click the Modify
icon ![]() .
.
· Delete—To delete the asset group, click the Delete
icon ![]() .
.
Asset group details
The asset group details page has the following areas:
· Asset Group Details
· Immediate Parent Group List
· Authorized Operator
Asset Group Details area
The asset group details area has the following parameters:
· Group Name—Name of the asset group.
· Control Scheme—Name of the desktop control scheme assigned to the asset group. Click the name to view details of the scheme, which is a set of control policies. You can select an existing desktop control scheme for a group or subgroup, or select Disable Control Scheme when you do not want to apply any control scheme to the asset group. When you skip this step, the subgroup inherits control schemes from its parent group. For more information, see "Configuring desktop control schemes."
· Parent Group Name—Name of the parent group. When you add a subgroup, this field is automatically populated with the name of the parent group. When the asset group has no parent group, this field is not available.
· Group Description—Description of the asset group. You can modify this parameter only when the Use Asset Groups option is selected.
Immediate Parent Group List area
This area is available only for asset groups that have parent groups.
· Group Name—Name of the parent group.
· Control Scheme—Name of the desktop control scheme assigned to the parent group. When no control scheme is configured, a subgroup inherits the control scheme from its parent group.
· Group Description—Description of the parent group.
Authorized Operator area
When the asset is created based on existing user groups on the IMC platform, this area is not available.
· Username—Name of the operator authorized to manage the asset group.
· Full Name—Full name of the operator.
· Privilege—Privilege level assigned to the operator, which can be:
¡ Admin
¡ Maintainer
¡ Viewer
· Description—Description of the operator.
Viewing the asset group list
To view the asset group list:
1. Click the User tab.
2. From the navigation tree, select Desktop Asset Manager > Asset Group.
The asset group list displays all asset groups.
3. Click Refresh to refresh the asset group list.
When you configure DAM to automatically create and delete asset groups along with existing user groups on the IMC platform, the asset group list does not contain the Add Sub-Group and Delete fields.
Viewing asset group details
1. Click the User tab.
2. From the navigation tree, select Desktop Asset Manager > Asset Group.
The asset group list displays all asset groups.
3. Click the name of an asset group to view detailed information.
The Asset Group Details page opens.
4. Click Back to return to the asset group list.
Adding asset groups
Operators can manually create asset groups and subgroups in DAM, or allow DAM to automatically create asset groups and subgroups based on existing user groups on the IMC platform. DAM supports an asset group hierarchy of a maximum of five levels. After an asset group/subgroup is added, DAM creates an asset group/subgroup branch under the All Assets node on the left navigation tree.
Manually adding an asset group
When the Use Asset Groups option is selected on the asset group list page, you can manually add asset groups.
To manually add an asset group:
1. Click the User tab.
2. From the navigation tree, select Desktop Asset Manager > Asset Group.
The asset group list displays all asset groups.
3. Click Add Group.
The Add Asset Group page opens.
4. Configure the basic information for the asset group.
5. In the Authorized Operators area, select operators to manage the asset group.
6. Select an operator to manage the asset group.
Operators with the Admin privilege are selected automatically.
7. Click OK.
Automatically adding asset groups based on user groups
DAM can automatically create asset groups and subgroups based on existing user groups on the IMC platform. This function is available only when DAM contains no manually added asset groups except the system-defined asset group, Ungrouped.
To enable DAM to automatically create asset groups based on user groups:
1. Click the User tab.
2. From the navigation tree, select Desktop Asset Manager > Asset Group.
The asset group list displays all asset groups.
3. Click Use User Groups.
The Asset Group page is refreshed to display the asset groups added based on user groups.
When the Use User Groups option is selected, DAM automatically creates asset groups based on existing user groups on the IMC platform, adjusts the asset groups along with the user groups, and prohibits operators from manually adding asset groups.
When all asset groups are automatically created, you can select the Use Asset Groups option to manually add more asset groups. However, you must reselect operators for each asset group, except operators with the Admin privilege who are automatically selected.
Adding a subgroup for an asset group
DAM allows operators to manually add subgroups for asset groups. However, when the Use User Groups option is selected, DAM automatically maintains the same group structure as that of the user groups, and prohibits operators from manually adding asset groups or subgroups.
To manually add a subgroup for an asset group:
1. Click the User tab.
2. From the navigation tree, select Desktop Asset Manager > Asset Group.
The asset group list displays all asset groups.
3. Click the Add Sub-Group icon ![]() for the asset group to which you want to add a subgroup.
for the asset group to which you want to add a subgroup.
The Add Asset Group page opens. When you configure DAM to automatically organize assets based on existing user groups on the IMC platform, the asset group list does not contain the Add Sub-Group field.
4. Configure the basic information and the asset group details for the subgroup.
5. Confirm the control scheme for the current group in the Immediate Parent Group List area.
When no control scheme is configured, the asset group inherits control schemes from its parent group.
6. Select operators to manage the asset group in the Authorized Operators area.
7. Select an operator to manage the asset group.
Operators with the Admin privilege are selected automatically.
8. Click OK.
Modifying an asset group
1. Click the User tab.
2. From the navigation tree, select Desktop Asset Manager > Asset Group.
The asset group list displays all asset groups.
3. Click the Modify
icon ![]() for the asset group you want to modify.
for the asset group you want to modify.
4. Modify the basic information and the asset group details for the asset group.
¡ Group Name—Enter the group name. You cannot modify this parameter when the Use Asset Groups option is selected.
¡ Control Scheme—Select an existing desktop control scheme for the asset group, or select Disable Control Scheme if you do not want to apply any control scheme to the asset group. When no control scheme is configured, the asset group inherits the control scheme from its parent group. For more information, see "Configuring desktop control schemes."
¡ Group Description—Enter a description of the group. You can modify this parameter only when the Use Asset Groups option is selected.
5. Select operators to manage the asset group in the Authorized Operators area.
This area is not available when the Use User Groups option is selected.
6. Select an operator to manage the asset group.
Operators with the Admin privilege are selected automatically.
7. Click OK.
Deleting an asset group
DAM allows operators to delete an asset group. However, when the Use User Groups option is selected, DAM automatically maintains the same group structure as that of the user groups, and prohibits operators from manually deleting asset groups or subgroups.
Before deleting an asset group, you must first remove all of its assets and subgroups.
To delete an asset group:
1. Click the User tab.
2. From the navigation tree, select Desktop Asset Manager > Asset Group.
The asset group list displays all asset groups.
3. Click the Delete icon ![]() for the asset group you want to delete.
for the asset group you want to delete.
A confirmation dialog box opens.
4. Click OK.
Granting an operator privileges to manage asset groups
You can grant operators privileges to manage specific asset groups. When assets are grouped based on user groups, operators are automatically granted privileges to manage their respective asset groups, and those granted asset group privileges change along with the user group settings.
When you switch from the Use User Groups option to the Use Asset Groups option, DAM keeps all asset groups that were created based on user groups. You must grant privileges to operators again to manage their asset groups, unless they have the Admin privilege, in which case they are automatically granted privileges.
To grant an operator privileges to manage specific asset groups:
1. Click the User tab.
2. From the navigation tree, select Desktop Asset Manager > Asset Group.
The asset group list displays all asset groups.
3. Click Operator Privileges.
The Operator List displays all operators and their respective privileges.
4. Click the Modify
icon ![]() for an operator to
modify their privileges.
for an operator to
modify their privileges.
The Modify Privileges page opens.
5. Select the asset groups that you want the operator to manage.
6. Click OK.
Managing assets
DAM uses the iNode client to collect information about registered assets for desktop monitoring, asset audit, and software deployment. DAM manages only the registered assets. Operators can configure EAD security policies so that EAD checks the asset status of access users, and monitors, informs, isolates, or blocks access users who use unregistered assets.
Operators can query, view, add, modify or delete assets; move assets between groups; batch export assets; and view the asset export history.
Asset registration process
To use all DAM functions, first register assets with DAM. Otherwise, some functions are unavailable.
Asset registration has the following procedures:
· Numbering assets—DAM assigns each asset a unique asset number for registration. The asset numbering mode can be manual or automatic.
¡ Automatic numbering mode—Operators enable automatic numbering and specify a prefix. When a user passes identity authentication using the asset for the first time, DAM automatically numbers the asset in the format of <Prefix>XXXXXXXXXX.
· Registering assets—DAM records asset information such as the owner, model, and vendor, and manages the assets. If assets are manually numbered, the registration is complete after the user confirms asset information. If assets are automatically numbered, DAM provides the following registration modes:
¡ Automatic registration—When a user passes identity authentication using the asset for the first time, the iNode client registers the asset with DAM. Operators can manually configure basic settings for the registered asset.
¡ Manual registration—When a user passes identity authentication using the asset for the first time, the iNode client prompts the user to enter and submit asset settings for registration.
· Verifying assets—Operators verify asset information submitted by access users. Only approved assets can be registered with DAM. This feature is available only when both automatic numbering and manual registration are enabled.
Asset list contents
· Status—Status of the asset:
¡ Online—Asset is managed and online.
¡ Offline—Asset is managed and offline.
¡ Unmanaged—Asset is not managed by DAM.
· Asset Number—Asset number of the asset. Click the asset number to view the asset details.
· Asset Name—Name of the asset.
· Model—Model of the asset.
· ACK Status—Indicates whether an operator has acknowledged the asset information. This field is displayed only when Auto Number is set to Enable.
· Owner—Owner of the asset. Click the owner to view owner details.
· Inserted at—Time when the asset was manually added to DAM or automatically numbered by DAM.
· Modify—Click the Modify icon ![]() to
modify asset information.
to
modify asset information.
Asset details
The asset details page has the following areas:
System Information area
· Asset Number—Asset number of the asset.
· Asset Name—Name of the asset.
· Status—Status of the asset:
¡ Online—Asset is managed and online.
¡ Offline—Asset is managed and offline.
¡ Unmanaged—Asset is not managed by DAM.
· Asset Group—Asset group to which the asset belongs.
· Group Control Scheme—Desktop control scheme assigned to the asset group. Click the control scheme name to view detailed information. An empty field indicates that no desktop control scheme is assigned to the asset group.
· Asset Control Scheme—Desktop control scheme assigned to the asset. This scheme applies to the asset regardless of whether a desktop control scheme is assigned to the asset group. An empty field indicates that no desktop control scheme is assigned to the asset, and in this case, the asset must use the desktop control scheme assigned to the asset group where it resides.
· Owner—Owner of the asset. Click the owner name to view owner details.
· User—User who last used the asset or is currently using the asset for network access. Click the user name to view detailed user information. An empty field indicates that no user has passed identity authentication with the asset.
· Login Name—Windows account name used to log in to the asset, which can be a local account or a domain account.
· Operating System—Operating system running on the asset.
· Asset Type—Asset type, which can be:
¡ PC
¡ Laptop
¡ Server
¡ Workstation
¡ Others
· Vendor—Vendor of the asset.
· Model—Model of the asset.
· Client Language—Language used by the iNode client on the asset.
· Client Version—Version of the iNode client installed on the asset.
· Inserted at—Time when the asset was manually added to DAM or automatically numbered by DAM.
· Managed at—Time when the asset completed registration after being added to DAM.
· Updated at—Time when the asset software or hardware was last updated after registration.
· Login at/Logout at—Time when the asset last went online or offline after registration. The online assets are displayed as Login at, and the offline assets are displayed as Logout at.
· Location—Location information of the asset.
· Access Device—Access device of the asset.
· Interface—Access interface of the asset.
· ACK Status—Indicates whether an operator has acknowledged the asset information. In manual numbering mode, the ACK Status is Yes for all assets. In automatic numbering mode, the ACK Status is Yes for acknowledged assets, and No for unacknowledged assets.
· Remarks—Comments on the asset.
Operating System Information area
· Operating System—Name of the operating system running on the asset.
· Version—Version of the operating system running on the asset.
· Service Pack—Service pack version of the operating system running on the asset.
· Installed at—Time when the operating system was installed on the asset.
· Operating System Language—Language of the operating system running on the asset.
· Operating System Serial Number—Serial number of the operating system running on the asset.
Hardware Information area
To view detailed hardware information, click the Details link in the area title area. For more information, see "Viewing hardware details."
· BIOS Information
¡ Caption—Caption of the BIOS.
¡ Vendor—Vendor of the BIOS.
¡ Release Date—Release date of the BIOS.
¡ Version—Version of the BIOS.
· Mainboard Information
¡ Vendor—Vendor of the main board.
¡ Model—Model of the main board.
· Memory Information
¡ Total Memory—Total memory size of the asset.
¡ Free Memory—Free memory size of the asset.
· CPU Information—Information for different CPUs is separated by a comma.
¡ CPU No.—Local serial number of the CPU assigned by Windows.
¡ CPU Model SN—Serial number of the CPU model.
¡ CPU Name—Name of the CPU.
¡ CPU Classification—Classification of the CPU: Family, Model, or Stepping.
¡ Current Frequency—Current working frequency of the CPU, in MHz.
¡ Max Frequency—Maximum working frequency of the CPU, in MHz.
¡ Clock Frequency—Clock frequency of the CPU, in MHz.
· NIC Information—Information for different NICs is separated by a comma.
¡ Caption—Caption of the NIC.
¡ Device Instance Path—Device instance path of the NIC.
¡ MAC Address—MAC address of the NIC.
· Hard Disk Information—Information for different hard disks is separated by a comma.
¡ Hard Disk Number—Hard disk number of the asset.
¡ Interface Type—Interface type of the hard disk.
¡ Hard Disk Serial Number—Serial number of the hard disk.
¡ Device Instance Path—Device instance path of the hard disk.
¡ Model—Model of the hard disk.
¡ Total Partitions—Total number of logical partitions on the hard disk.
¡ Hard Disk Size—Hard disk capacity, in GB.
· DVD/CD-ROM
¡ Caption—Caption of the DVD/CD-ROM.
¡ Type—Type of the DVD/CD-ROM.
¡ Device Instance Path—Device instance path of the DVD/CD-ROM.
Shortest Startup Time Ranking area
This area is displayed only when Rank Assets by Startup Time is enabled in DAM service settings. For more information about configuring the parameter, see "Configuring service parameters."
The Shortest Startup Time Ranking area contains the following contents:
· Ranking Number—Ranking result of the startup time for the asset. A small value indicates a short startup time.
· Ranking in Percentage—Ranking result of the startup time for the asset in percentage. For example, a value of 10% indicates the asset is one of the top 10% ranked assets with the shortest startup time.
· Startup Time (Seconds)—Amount of time for asset startup, in seconds.
· Reported Time (in Client)—Time when the iNode client reported the asset startup time.
· Reported Time (in Server)—Time when DAM received the reported asset startup time.
Screen Saver Information area
· Screen Saver—Indicates whether the screen saver is enabled for the asset.
· Display Logon Screen on Resume—Indicates whether password protection is enabled for the screen saver.
· Idle Timeout—Maximum idle time, in seconds, before the asset enters the screen-saver state.
Network Connection List area
· Enable DHCP—Indicates whether the network connection can obtain an IP address from a DHCP server.
· IP Address—IP address of the network connection.
· MAC Address—MAC address of the network connection.
· Gateway IP Address—Gateway IP address of the network connection.
· Subnet Address—Subnet address of the network connection.
· DHCP Server Address—IP address of the DHCP server that assigns IP addresses to the network connection.
· DNS Server Address—IP address of the DNS server that is used by the network connection. If the network connection obtains the IP address from a DHCP server, this address is typically also assigned by that DHCP server.
Partition List area
· Hard Disk Number—Number of the hard disk on the partition. The combination of a partition number and a hard disk number uniquely identifies a partition on an asset.
· Partition Number—Number of the partition.
· Partition Type—Type of the partition.
· Boot Partition—Indicates whether the partition is the boot partition.
· Size—Size of the partition, in GB.
Logical Disk List area
· Name—Name of the logical disk.
· Description—Volume label of the logical disk and DVD/CD-ROM. When the logical disk has no volume label, this field displays Local Disk.
· File System—File system of the logical disk.
· SN—Serial number assigned to the logical disk by the operating system.
· Total Size—Total size of the logical disk, in GB. The total size of a logical disk is the sum of free space plus used space.
Software List area
· Software Name—Name of the software.
· Software Version—The software version.
· Installed on—Date on which the software was installed on the asset.
Patch List area
· Software Name—Name of the software for which the patch is installed. A single software product might have multiple patches installed.
· Software Version—The software version for which the patch is installed.
· Patch Name—Name of the patch.
· Installed on—Date on which the patch was installed.
· Patch Type—Type of the patch.
· Description—Description of the patch.
Process List area
· Process Name—Name of the process.
· Created at—Time when the process was executed on the asset.
Service List area
· Service Name—Name of the service.
· Service Display Name—Description of the service.
· Startup Type—Startup type for the service:
¡ Auto
¡ Manual
¡ Disabled
· Service Status—Status of the service:
¡ Running
¡ Stopped
¡ Paused
¡ Starting
¡ Stopping
¡ Waiting
¡ Pausing
¡ Unknown
Share List area
· Share Number—Share number assigned by the DAM server.
· Share Name—Name of the shared directory.
· Local Path—Path of the shared directory.
· Share Type—Type of the shared directory:
¡ Common Share—A share type securing the shared file by specifying the permitted users or user groups and setting the permission level. When using this share type, the user should delete Everyone from the Group or user names list to prevent unauthorized users from accessing the shared file.
¡ Default Share—The default share type provided by Windows. This share type is vulnerable to attacks.
¡ Others—IPC$ share used in Windows.
· Object Domain—Domain name of the user or user group of the share. This parameter is available only when the share type is Common Share. An empty field indicates that the share user or user group does not belong to any domain.
· Object Name—Name of the user or user group of the share. This parameter is available only when the share type is Common Share.
· Object Type—Type of the user or user group of the share. An empty field indicates that the share user or user group does not belong to any object type.
¡ System Group—Object permitted or denied access to the share is a system-defined operating system user group.
¡ Custom Group—Object permitted or denied access to the share is a user-defined operating system user group.
¡ User—Object permitted or denied access to the share is a user.
· Right of Object—Permission that the user or user group has to the share. This field is available only when the share type is Common Share. The permission can be Read Only, Read Write, or All.
· Control Type—Control type of the object: Permit or Deny. This parameter is available only when the share type is Common Share.
Port List area
This area displays all processes associated with active ports on the asset, including processes that use a local port as a listening port, and processes that use a local port to connect to a remote host.
· Process Name—Name of the process that listens for a local port or has connected to a remote host using a local port.
· Process ID—ID of the process, which is assigned by the operating system of the asset.
· Local IP—IP address of the asset.
· Local port—Listening port of the asset used by the process.
· Remote IP—IP address of the host to which the asset has connected.
· Remote Port—Port used by the remote host to connect to the asset.
· Status—Connection status of the process.
· Protocol—Protocol type used by the process: TCP or UDP.
· Process Path—Local path of the process on the asset.
Viewing the asset list
1. Click the User tab.
2. From the navigation tree, select Desktop Asset Manager > All Assets.
The asset list displays all assets in DAM.
To view the asset list of a specific asset group, in the navigation tree select the asset group name under Desktop Asset Manager > All Assets.
Viewing asset details
DAM uses the iNode client to collect and report information about assets registered to the EAD server. Asset information is displayed on the Asset Details page. The Action menu on this page allows operators to perform various operations for assets.
Accessing the Asset Details page
Method 1
1. Click the User tab.
2. From the navigation tree, select Desktop Asset Manager > All Assets.
The asset list displays all assets in DAM.
3. To view detailed information for an asset, click its asset number.
The Asset Details page opens.
Method 2
1. Click the User tab.
2. In the navigation tree under the All Assets branch, click an asset group name.
The asset list displays only the assets that belong to the asset group.
3. To view detailed information for an asset, click its asset number.
The Asset Details page opens.
Viewing hardware details
To display the Hardware Details page, in the Hardware Information area click the Details link.
Performing actions
The Action menu at the upper right on the Asset Details page enables you to apply management and configuration options to the selected asset. Use the menu options to refresh the current Asset Details page, scan and modify the selected asset, or delete the asset from DAM.
You can also view the software deployment history, USB monitor and printer monitor information, and change history of asset software and hardware.
Regroup
Use the Regroup option to move a selected asset from its current group to another group.
1. From the Action menu, select Regroup.
The Regroup Assets page opens.
2. Next to the Group Name field, click the Select Asset Group icon ![]() .
.
The Select Asset Group page opens.
3. Select a group and click OK.
The Group Name field is populated with the selected asset group.
4. Click OK.
For more information, see "Regrouping an asset."
Modify
Use the Modify option to modify the owner, group control scheme, asset control scheme, location, asset type, vendor, model, and remarks for the selected asset.
1. From the Action menu, select Modify.
The Modify Asset page opens.
2. Modify the following parameters for the asset:
¡ Owner—Next to the Owner field, click Select. The Select User dialog box opens. Select a new owner for the asset and click OK.
¡ Group Control Scheme—You cannot modify the control scheme assigned to the asset group where the asset resides.
¡ Asset Control Scheme—Select a control scheme for the asset.
¡ Location—Enter the location of the asset.
¡ Asset Type—Select an asset type.
¡ Vendor—Enter the asset vendor.
¡ Model—Enter the asset model.
¡ Remarks—Enter remarks for the asset.
3. Click OK.
The top of the Asset Details page is updated to reflect the modifications.
Delete
To delete an asset from DAM, use the Delete option. This option is not available for online assets.
1. From the Action menu, select Delete.
2. In the dialog box that opens, click OK.
Scan Changes
To collect the asset changes to DAM, use the Scan Changes option.
1. From the Action menu, select Scan Changes.
The top of the Asset Details page is updated to display the scan process.
2. To view any updates to asset details, from the Action menu Select Refresh .
Scan All Information
To collect the most recent asset information to DAM, use the Scan All Info option.
1. From the Action menu, select Scan All Info.
The top of the Asset Details page is updated to display the scan process.
2. To view the most recent asset details from the Action menu, select Refresh.
SW Deployment
Use the SW Deployment option to view the software deployment history for an asset.
1. From the Action menu, select SW Deployment.
The Software Deploy Task List displays all software deploy tasks that include the asset in their deployment targets.
Software deploy task list contents
¡ Task Name—Name of the software deploy task.
¡ Execution time—Time when the software deploy task was executed.
¡ Software Name—Name of the software deployed in the task.
¡ Status—Status of the software deploy task:
- Not Executed
- Deployment Succeeded
- Deployment Failed
- Download Succeeded
- Download Failed
2. To return to the Asset Details page, click Back.
USB File Transfer
Use the USB File Transfer option to view USB monitoring information for the asset.
1. From the Action menu, select USB File Transfer.
The USB File Transfer Log List displays USB monitoring information.
USB file transfer log list contents
¡ Asset Number—Number of the asset on which a USB storage device is used.
¡ Asset Name—Name of the asset on which a USB storage device is used.
¡ Owner—Owner of the asset on which a USB storage device is used.
¡ Logic Drive—Drive letter of the USB storage device displayed on the asset.
¡ USB Plugged (Server)—Time recorded by the DAM server when the USB storage device was connected to the asset.
¡ USB Unplugged (Server)—Time recorded by the DAM server when the USB storage device was disconnected from the asset.
¡ Details—To
view detailed USB storage device usage information,
click the Details icon ![]() .
.
2. To return to the Asset Details page, click Back.
Printer Use
Use the Printer Use option to view printer usage information for an asset.
1. From the Action menu, select Printer Use.
The Printer Usage Log List displays printer usage information.
Printer Usage Log List contents
¡ Asset Number—Number of the asset that submitted a printer task.
¡ Asset Name—Name of the asset that submitted a printer task.
¡ Owner—Owner of the asset that submitted a printer task.
¡ Printer Name—Name of the printer used by the asset.
¡ File Name—Name of the printed file.
¡ Printed Pages—Number of printed pages.
¡ Report Time—Time recorded by the DAM server when the asset used the printer.
¡ Share Printer—Indicates whether the printer is a shared printer.
2. To return to the Asset Details page, click Back.
Check Asset Files
To search files on the asset for auditing, use the Check Asset Files option.
1. From the Action menu, select Check Asset Files.
The Add Check Task page opens.
2. Configure the following parameters:
¡ Check Files in—Enter the absolute path of the file you want to audit, ending with a backward slash (\).
¡ File Name Includes—Enter a partial or complete file name.
- The file name can contain the wildcard characters asterisk (*) and question mark (?). An asterisk can match zero or more characters.
- A question mark matches any character except the dot (.).
When placed in front of the dot, it matches zero characters or one character.
When placed after the dot, it matches one character.
- The file name cannot contain four or more consecutive question marks or any of the following characters: angle brackets (< >), quotation mark ("), forward slash (/), backward slash (\), and vertical bar (|).
- Do not use file names that contain only wildcard characters and dot, such as ?*.*?.
¡ Description—Enter a description of the audit.
3. Click Start.
The asset file check list displays all asset file check tasks that have been executed.
¡ To
export the audit result for the asset file check task, click the Export icon ![]() .
.
¡ To
view detailed audit information for the asset file check task, click the Details icon ![]() .
.
For more information, see "Terminal file audit."
Change History
Use the Change History option to view the change history of software and hardware on the asset.
1. From the Action menu, select Change History.
The Asset Change History displays the change history of the asset.
Asset change history list content
¡ Change Type—Type of the change.
¡ Change Item—Name of the changed item. Click the content of this field to display the Asset Software Change Details page or Asset Hardware Change Details page.
¡ Changed on—Time when the change occurred.
2. To return to the Asset Details page, click Back.
Refresh
To reload the current Asset Details page and capture any updates to the asset details, use the Refresh option.
Querying assets
DAM allows operators to query assets through a basic query or an advanced query:
· A basic query has several key criteria for a quick search.
· An advanced query has query criteria for a precise match.
Performing a basic query
1. Click the User tab.
2. From the navigation tree, select Desktop Asset Manager > All Assets.
The asset list displays all assets in DAM.
3. At the upper right corner of the page, click Basic Query.
When Advanced Query is displayed at the upper right corner of the page, you are already in basic query mode. Skip this step.
4. Specify one or more of the following query criteria:
¡ Asset Number—Enter a partial or complete asset number..
¡ Asset Name—Enter a partial or complete name of the asset.
¡ Owner—Enter a partial or complete owner name of the asset.
¡ Group Name—In the Select Asset Group page, click the Select
Asset Group icon ![]() , select a group, and click OK.
, select a group, and click OK.
The Group Name field is automatically populated with the selected asset group.
5. Click Query.
The asset list displays all assets that match the query criteria.
6. To clear the query criteria, click Reset.
The asset list displays all assets.
Performing an advanced query
1. Click the User tab.
2. From the navigation tree, select Desktop Asset Manager > All Assets.
The asset list displays all assets.
3. At the upper right corner of the page, click Advanced Query.
When Basic Query is displayed at the upper right corner of the page, you are already in advanced query mode. Skip this step.
4. Specify one or more of the following query criteria:
¡ Asset Number—Enter a partial or complete asset number.
¡ Asset Name—Enter a partial or complete name of the asset.
¡ Status—Select the asset status:
- Online—Asset is managed and online.
- Offline—Asset is managed and offline.
- Unmanaged—Asset is not managed by DAM.
¡ Group Name—Click the Select Asset Group icon ![]() .
.
The Select Asset Group page opens.
Select a group and click OK.
The Group Name field is automatically populated with the selected asset group.
¡ Owner—Enter a partial or complete owner name of the asset.
¡ User—Enter a partial or complete user name. All assets that the user has recently used or is currently using are queried.
¡ Inserted at from/to—Specify the time range
when the asset was manually added to DAM or automatically numbered by DAM. You
can click the Select Date and Time icon ![]() to select the
time, or enter a date in YYYY-MM-DD format.
to select the
time, or enter a date in YYYY-MM-DD format.
¡ Last Logoff from/to—Specify the time range when the asset last went offline. You can
click the Select Date and Time icon ![]() to select the
time, or enter a date in YYYY-MM-DD format.
to select the
time, or enter a date in YYYY-MM-DD format.
¡ Asset Type—Select an asset type to be queried. Options are PC, Laptop, Server, Workstation, and Others.
¡ Vendor—Enter a partial or complete vendor of the asset.
¡ Model—Enter a partial or complete model of the asset.
¡ ACK Status—Select the acknowledgment status of the asset. Use this criterion in automatic numbering mode. In manual numbering mode, the ACK Status is Yes for all assets.
¡ Remarks—Enter a partial or complete description of the asset.
5. Specify operating system criteria for query. Select By Operating System, and then specify one or more of the following query criteria:
¡ Operating System—Enter a partial or complete operating system version. For example, Windows Vista or Windows 7.
¡ Operating System Language—Select a partial or complete operating system language: Chinese (PRC) or English.
¡ Operating System Patch—Enter the operating system patch, for example, Service Pack 1, Service Pack 2, or R2.
¡ Multiple Operating Systems—Select this option to allow multiple operating systems to be installed on the asset to be queried.
¡ Operating System Serial Number—Enter the serial number of the operating system.
6. Specify main-board criteria for query. Select By Mainboard, and then enter the following query criterion:
¡ Model—Enter a partial or complete model for the main board.
7. Specify software criteria for query. Select By Software, and then specify one or more of the following query criteria:
¡ Software Name—Enter a partial or complete software name.
¡ Software Version—Enter a partial or complete software version.
¡ Installation Status—Specify whether the software is installed on the asset: Installed or Uninstalled.
8. Specify patch criteria for query. Select By Patch, and then specify one or both of the following query criteria:
¡ Patch Name—Enter a partial or complete patch name. For example, KB911565.
¡ Installation Status—Specify whether the patch is installed on the asset: Installed or Not installed.
9. Specify screen-saver criteria for query. Select By Screen Saver, and then specify one or both of the following query criteria:
¡ Screen Saver—Specify whether the screen saver is enabled: Yes or No.
¡ Display Logon Screen on Resume—Specify whether the password is specified for the screen saver: Yes or No.
10. Specify memory criteria for query. Select By Memory, and then specify the following query criterion:
¡ Total Memory from/to—Specify a range of the total memory for the asset, in MB.
11. Specify CPU criteria for query. Select By Processor, and then specify one or both of the following query criteria:
¡ Number of Processors from/to—Specify the range of the total number of CPUs for the asset.
¡ Processing Frequency from/to—Specify a range of CPU frequency for the asset.
12. Specify NIC criteria for query. Select By NIC, and then specify one or both of the following query criteria:
¡ Number of NICs from/to—Specify a range of the total number of NICs installed on the asset.
¡ MAC Address—Enter a partial or complete MAC address of a NIC installed on the asset.
13. Specify hard disk drive criteria for query. Select the By Hard Disk Drive box, and then specify one or both of the following query criteria:
¡ Number of Hard Disk Drives from/to—Specify a range of the total number of hard disk drives installed on the asset.
¡ Total Disk Capacity from/to—Specify a range of total disk capacity, in GB.
14. Specify IP address criteria for query. Select By IP Address, and then specify the following query criterion:
¡ IP Address from/to—Specify a range of IP addresses. All assets with IP addresses last reported by the iNode client in the range are queried.
15. Specify IPv6 address criteria for query. Select By IPv6 Address, and then specify the following query criterion:
¡ IPv6 Address from/to—Specify a range of IPv6 addresses. All assets with IPv6 addresses last reported by the iNode client in the range are queried.
16. Specify process criteria for query. DAM queries assets by the process information last reported by the iNode client. Select By Process, and then specify one or both of the following query criteria:
¡ Process Name—Enter a partial or complete name of the process.
¡ Process Status—Select the status of the process: Running or Stopped.
17. Specify service criteria for query. DAM queries assets by the service information last reported by the iNode client. Select By Service, and then specify one or more of the following query criteria:
¡ Service Name—Enter a partial or complete service name. A service has both a service name and a service display name. Operators can view the service name in the Service Control Manager of the operating system.
¡ Service Display Name—Enter a partial or complete service display name. A service has both a service name and a service display name. Operators can view the service display name in the Service Control Manager of the operating system.
¡ Installation Status—Select the installation status of the service: Installed or Uninstalled.
¡ Service Status—Select the running status of the service: Running or Other. The following states are categorized as Other:
- Stopped
- Paused
- Starting
- Stopping
- Waiting
- Pausing
- Unknown
The asset list displays all assets that match the query criteria.
19. To clear the query criteria, click Reset.
The asset list displays all assets.
To query assets in a specific asset group, in the navigation tree click the asset group name located under Desktop Asset Manager > All Assets, and then specify the query criteria.
Managing asset models
Use model management to add, modify, and delete asset models. If auto numbering is enabled and auto registration is disabled in system settings, DAM deploys a model list to endpoint users who have requested asset registration. The endpoint users can select a model from the list to register an asset.
Querying asset models
1. Click the User tab.
2. From the navigation tree, select Desktop Asset Manager > All Assets.
The All Assets page opens.
3. Click the Manage Models link.
The Model Management page opens.
4. In the Query Models area, perform the following steps:
a. In the Name field, enter a partial or complete asset model name.
b. Click Query.
The asset model list displays all models that match the specified asset model name. To clear the query criterion and display all asset models, click Reset.
Adding an asset model
To select asset models for assets, add asset models before adding assets:
1. Access the Model Management page.
2. Click Add.
The Add Model page opens.
3. Configure the following parameters:
¡ Name—Enter the name of the asset model.
¡ Vendor—Enter of the vendor of the asset model.
¡ Description—Enter of the description of the asset model.
4. Click OK.
Modifying an asset model
1. Access the Model Management page.
2. In the asset model list, click the Modify icon ![]() for an asset model.
for an asset model.
The Modify Model page opens.
3. Configure asset model parameters.
4. Click OK.
Deleting an asset model
1. Access the Model Management page.
2. In the asset model list, click the Delete icon ![]() for an
asset model.
for an
asset model.
A confirmation dialog box opens.
3. Click OK.
Adding an asset
In manual numbering mode, operators must manually add asset information such as asset numbers (required), owners, asset groups, and desktop control schemes in DAM. When an access user logs in, the iNode client prompts the user to enter the asset number to complete the registration process.
In automatic numbering mode, assets are displayed automatically in DAM. When an access user logs in, DAM automatically numbers the asset, and prompts the user to enter the asset model, position, vendor, type, and description to complete the registration process.
To manually add an asset:
1. Click the User tab.
2. From the navigation tree, select Desktop Asset Manager > All Assets.
The asset list displays all assets in DAM.
3. Click Add.
The Add Asset page opens.
4. Enter the asset number in the Asset Number field.
5. Select an owner for the asset.
a. Next to the Owner field, click Select.
The Select User page opens.
b. Filter users with a basic or advanced query.
The Select User feature is displayed above the User List. The Advanced Query link is a toggle switch between Basic Query and Advanced Query. When the link displays Advanced Query, you are in basic query mode, and vice versa.
c. Specify one or more of the following query criteria:
- User Name—Enter a partial or complete user name.
- Identity Number—Enter a partial or complete user identity number.
- Contact Address—Enter the contact address for the user. This field is available for advanced queries only.
- Telephone—Enter a partial or complete telephone number for the user. This field is available for advanced queries only.
- Email—Enter a partial or complete email address for the user. This field is available for advanced queries only.
- User Group—Click
the Select User Group icon ![]() . On the Select User
Group page that opens, select a group and click OK.
. On the Select User
Group page that opens, select a group and click OK.
Empty fields are ignored.
d. Click Query.
The User List displays all users matching the query criteria.
e. Select a user from the list.
f. Click OK.
6. Configure the following parameters:
¡ Group Name—Click the Select Asset Group icon ![]() . The Select Asset Group page opens.
Select a group and click OK. When the Use User Groups option is selected, the system
automatically populates this field with the user group to which the asset owner
belongs.
. The Select Asset Group page opens.
Select a group and click OK. When the Use User Groups option is selected, the system
automatically populates this field with the user group to which the asset owner
belongs.
¡ Group Control Scheme—The system automatically populates the field with the same desktop control scheme that is assigned to the asset group.
¡ Asset Control Scheme—Select a desktop control scheme for the asset, or if you do not want to apply any control scheme to the asset, select Disable Control Scheme. The desktop control scheme configuration can be on a group basis or an asset basis. The group basis configuration applies to all assets in the same group, but can be overridden by the asset basis configuration.
¡ Location—Enter the location of the asset.
¡ Asset Type—Select an asset type from the list:
- PC
- Laptop
- Server
- Workstation
- Others
¡ Vendor—Select the vendor for the asset.
¡ Model—Select the model for the asset.
¡ Remarks—Enter remarks for the asset.
7. Click OK.
Batch importing assets
Operators can batch import assets from a file that contains asset information. Asset information can be separated by a space, tab, comma (,), colon (:), pound sign (#), or dollar sign ($). The file can use only one type of separator.
To batch import assets:
1. Click the User tab.
2. From the navigation tree, select Desktop Asset Manager > All Assets.
The asset list displays all assets in DAM.
3. Click Batch Import.
The Batch Import Assets page opens.
4. Configure the following parameters:
¡ Import File—Next to the Import File field, click Browse. The Choose File page opens. Browse to the target file that contains the asset information. The file must be a text file with columns separated by delimiters. The system automatically populates the field with the file path and name.
¡ Column Separator—Select the column separator to use as the delimiter in the file. Options are space, tab, comma (,), colon (:), pound sign (#), and dollar sign ($).
5. Click Next.
The Basic Information page opens.
6. Configure basic information for the import task:
¡ Asset Number—Select the column in the file that contains the asset number.
¡ Asset Group—Click the Select Asset Group icon ![]() . The Select Asset Group page opens.
Select a group and click OK. The group name is
automatically populated in the Asset Group field.
. The Select Asset Group page opens.
Select a group and click OK. The group name is
automatically populated in the Asset Group field.
¡ Owner—Select the column in the file that contains the asset owner, or select Not Import from File.
¡ Owner ID Number—Select the column in the file that contains the owner ID, or select Not Import from File. This field is not available when the Owner field is set to Not Import from File. The Owner ID Number uniquely identifies a user as the asset owner in case of duplicated user names.
¡ Asset Name—Select the column in the file that contains the asset name, or select Not Import from File. To configure the same asset name for all assets, select Not Import from File and enter the settings manually.
¡ Location—Select the column in the file that contains the asset location, or select Not Import from File to set the same location for all imported assets manually.
¡ Asset Type—Select the column in the file that contains the asset type, or select Not Import from File and then select an asset type for all imported assets. Options are:
- PC
- Laptop
- Workstation
- Server
- Others (which includes any other asset type)
¡ Vendor—Select the column in the file that contains the asset vendor, or select Not Import from File to set the same vendor for all imported assets manually.
¡ Model—Select the column in the file that contains the asset model, or select Not Import from File to set the same asset model for all imported assets manually.
¡ Remarks—Select the column in the file that contains remarks for the asset, or select Not Import from File to enter remarks manually.
7. To view the first 10 assets imported according to your settings, click Preview.
8. To import all assets in the file to DAM, click OK.
The Import Asset Result page opens.
9. Click Download to download the result.
10. Click Back to return to the asset list.
Modifying an asset
1. Click the User tab.
2. From the navigation tree, select Desktop Asset Manager > All Assets.
The asset list displays all assets in DAM.
3. For the target asset
you want to modify, click the Modify
icon ![]() .
.
The Modify Asset page opens.
4. Select an owner for the asset.
a. Next to the Owner field, click Select.
The Select User page opens.
b. Filter users using a basic or advanced query.
The Select User feature opens above the User List. The Advanced Query link is a toggle switch between Basic Query and Advanced Query. When the link displays Advanced Query, you are in basic query mode, and vice versa.
c. Specify one or more of the following query criteria:
- User Name—Enter a partial or complete user name.
- Identity Number—Enter a partial or complete user identity number.
- Contact Address—Enter a partial or complete contact address for the user. This field is available for advanced queries only.
- Telephone—Enter the telephone number for the user. This field is available for advanced queries only.
- Email—Enter a partial or complete email address of the user. This field is available for advanced queries only.
- User Group—Click
the Select User Group icon ![]() . On the Select User
Group page, that opens, select a group and click OK.
. On the Select User
Group page, that opens, select a group and click OK.
- Open Account—Select this option to create a self-service account for the user. A self-service account on the IMC platform allows a user to access the SOM console.
- Account Name—Enter a partial or complete user account name.
Empty fields are ignored.
d. Click Query.
The User List displays all users matching the query criteria.
e. Select a user from the list.
f. Click OK.
5. Configure the following parameters:
¡ Group Name—Click the Select Asset Group icon ![]() . The Select Asset Group page opens.
Select a group and click OK. When the Use User Groups option is selected, the system
automatically populates this field with the user group to which the asset owner
belongs.
. The Select Asset Group page opens.
Select a group and click OK. When the Use User Groups option is selected, the system
automatically populates this field with the user group to which the asset owner
belongs.
¡ Group Control Scheme—The system automatically populates the field with the same desktop control scheme that is assigned to the asset group.
¡ Asset Control Scheme—Select a desktop control scheme for the asset, or if you do not want to apply any control scheme to the asset, select Disable Control Scheme. The desktop control scheme configuration can be on a group basis or an asset basis. The group basis configuration applies to all assets in the same group, but can be overridden by the asset basis configuration.
¡ Location—Enter the location of the asset.
¡ Asset Type—Select an asset type from the list:
- PC
- Laptop
- Server
- Workstation
- Others
¡ Vendor—Enter the vendor information of the asset.
¡ Model—Enter the asset model.
¡ Remarks—Enter remarks for the asset.
6. Click OK.
Deleting an asset
After deleting an asset, the asset number and all other asset information is removed permanently from the DAM database. To resubmit this asset to DAM management, you must re-register the asset.
To delete an asset:
1. Click the User tab.
2. From the navigation tree, select Desktop Asset Manager > All Assets.
The asset list displays all assets in DAM.
3. Next to the Status field, select the box for the asset you want to delete.
4. Click Delete.
Regrouping an asset
Operators can manually move assets between asset groups. However, if the Use User Groups option is selected, DAM automatically:
· assigns each asset to the user group to which its owner belongs.
· prohibits operators from manually moving assets between asset groups.
To regroup an asset:
1. Click the User tab.
2. From the navigation tree, select Desktop Asset Manager > All Assets.
The asset list displays all assets in DAM.
3. Next to the Status field, select the box for the asset you want to regroup.
4. Click Regroup.
The Regroup Assets page opens.
5. In the Target Group
area, click the Select Asset Group icon ![]() .
.
The Select Asset Group page opens.
6. Select an asset group and click OK.
The Select Asset Group page closes.
7. On the Regroup Assets page, click OK.
Verifying an asset
When asset verification is enabled, asset information must be approved by an operator before they are registered with DAM. If asset information is rejected, asset registration fails. This feature is available only when both automatic numbering and manual registration are enabled in DAM service settings. For more information, see "Configuring service parameters."
Viewing the asset verification list
1. Click the User tab.
2. From the navigation tree, select Desktop Asset Manager > Verify Asset.
The asset verification list displays all asset records to be verified.
¡ Status—Verification state of the asset: Pending or Disapproved.
¡ Asset Number—Number of the asset automatically assigned by DAM.
¡ Asset Name—Host name of the asset submitted by the user.
¡ Model—Model of the asset submitted by the user.
¡ Owner—Owner of the asset submitted by the user.
¡ Inserted at—Time when DAM received the asset information.
¡ Last Verification Time—Time when the asset was disapproved.
3. To view the most recent asset verification list, click Refresh.
Viewing asset details
1. Click the User tab.
2. From the navigation tree, select Desktop Asset Manager > Verify Asset.
3. Click the asset number of an asset to view detailed information.
The page displays the following contents:
¡ Asset Number—Number of the asset automatically assigned by DAM.
¡ Asset Name—Host name of the asset. This parameter is specified when the user submits the asset information for registration.
¡ Status—Verification state of the asset: Pending or Disapproved.
¡ Owner—Owner of the asset. This parameter is specified when the user submits the asset information for registration.
¡ Asset Type—Type of the asset. This parameter is specified when the user submits the asset information for registration.
¡ Vendor—Vendor of the asset. This parameter is specified when the user submits the asset information for registration.
¡ Model—Model of the asset. This parameter is specified when the user submits the asset information for registration.
¡ Client Language—Language of the iNode client.
¡ Client Version—Version number of the iNode client.
¡ Location—Position of the asset. This parameter is specified when the user submits the asset information for registration.
¡ Inserted at—Time when DAM received the asset information.
¡ Last Verification Time—Time when the asset was disapproved.
¡ Remarks—Descriptive information of the asset. This parameter is specified when the user submits the asset information for registration.
Verifying an asset
1. Click the User tab.
2. From the navigation tree, select Desktop Asset Manager > Verify Asset.
3. Click the asset number of the asset you want to verify.
The page displays asset details.
4. Verify asset information.
5. Click Back to return to the asset verification list page.
6. Click Approve or Disapprove.
Approved assets are registered with DAM.
Disapproved assets will not be registered. Users must resubmit asset information for registration.
Deleting asset records
Use this function to delete asset records that no longer need to be verified.
1. Click the User tab.
2. From the navigation tree, select Desktop Asset Manager > Verify Asset.
3. Select one or more asset records.
4. Click Delete.
Exporting asset information
The asset export function allows operators to use the query function to produce a list of assets to be exported, and then export those assets to an export file. Operators can either export basic information or all information for the asset.
The basic information includes the contents of the System Information area on the Asset Details page. This information can be exported to a text file. All information is exported to a zip file that contains multiple HTML files, including the asset list page and Asset Details page.
· The asset list page provides export information, export criteria, and hyperlinks to the assets.
· The Asset Details page contains detailed information about the assets.
For more information, see "Asset details."
Asset export function asset list
· Asset Number—Asset number of the asset.
· Asset Name—Name of the asset.
· Owner—Owner of the asset.
· Asset Group—Group to which the asset belongs.
· Inserted at—Time when the asset was manually added to DAM or automatically numbered by DAM.
· Group Name—Click the Select
Asset Group icon ![]() . The Select Asset Group page opens. Select a group and click OK. The selected asset group is automatically populated
in the Group Name field.
. The Select Asset Group page opens. Select a group and click OK. The selected asset group is automatically populated
in the Group Name field.
Exporting asset information
1. Click the User tab.
2. From the navigation tree, select Desktop Asset Manager > All Assets.
The asset list displays all assets in DAM.
3. Filter the assets using a basic or advanced query in the Query Asset area.
For more information, see "Querying assets."
4. Click Export.
The Export Contents page opens. All listed assets that match the query criteria are exported.
5. Configure the following parameters:
¡ Export Contents—Select the content to be exported: Basic Information, Detail Information or Hardware Information.
When you select Basic Information, you can export asset information only to a text file, and you must select a column separator. Options are space, tab, comma (,), colon (:), pound sign (#), and dollar sign ($).
When you select Detail Information, the File Type and File Column Separator fields are not displayed.
When you select Hardware Information, you can export asset information to an .xls file. By default, the file includes asset number, asset name, and owner information. You can select other hardware information to be exported including BIOS, memory, and CPU information.
¡ File Type—When Export Contents is set to Basic Information, this field is displayed and displays TXT, which cannot be modified.
¡ File Column Separator—Select the column separator to use as the delimiter in the file. Options are space, tab, comma (,), colon (:), pound sign (#), and dollar sign ($). This field is not displayed when Export Contents is set to All Information.
6. Click OK.
The Asset Export Results page opens.
7. Click Download to download the result.
8. Click Back to return to the asset list.
|
|
NOTE: To ensure fast and stable user authentication: If there are several user authentication processes running, do not perform any batch operations. |
Asset export history list contents
· Export File Name—Name of the export file.
· Export File Path—Path of the export file.
· Operator—Operator who exported the asset information.
· Exported at—Time when the asset information was exported.
· Download File—Click the Download link to download the export file.
· Delete—To delete the asset export file, click the Delete
icon ![]() .
.
Viewing the asset export history
1. Click the User tab.
2. From the navigation tree, select Desktop Asset Manager > All Assets.
The asset list displays all assets in the DAM database.
3. At the upper right of the Assets List, click Export History.
The Asset Export History List displays the export history of asset information.
4. Click Back to return to the asset list.
Downloading the asset export history record
1. Click the User tab.
2. From the navigation tree, select Desktop Asset Manager > All Assets.
The All Assets page opens.
3. In the asset list area, click Export History.
The Asset Export History List displays all asset export history records.
4. For the export history record you want to download, click the Download link.
5. Open or save the export history record.
Deleting the asset export history record
1. Click the User tab.
2. From the navigation tree, select Desktop Asset Manager > All Assets.
The All Assets page opens.
3. In the asset list area, click Export History.
The Asset Export History List displays all asset export history records.
4. For the export history record you want to
delete, click the Delete icon ![]() .
.
A confirmation dialog box opens.
5. Click OK.
Collecting asset statistics
DAM allows operators to collect statistics for registered assets by asset type, CPU frequency, hard disk size and type, operating system version and language, and software installed.
The data collection target can be all assets or a specific asset group and its subgroups. Operators can collect statistics only for groups and subgroups for which they have privileges.
Collecting statistics by asset type
Operators can collect statistics for all assets or a specific asset group by asset type:
· PC
· Laptop
· Server
· Workstation
· Others
Viewing asset type statistics reports
1. Click the User tab.
2. From the navigation tree, select Desktop Asset Manager > Asset Statistics.
The Asset Statistics page opens.
3. In the Asset Statistics area, click the Type icon ![]() .
.
The Statistics of Types page opens. By default, the report displays statistics for all asset groups to which the operator has privileges.
4. Next to the Group Name
field, click the Select Asset Group icon ![]() .
.
The Select Asset Group page opens.
5. Select a group and click OK.
The Group Name field is populated with the selected asset group.
6. Select a report type (Pie Chart or List).
7. Click Query.
The query results are displayed under the Asset Query area.
8. Click Reset to restore the default.
The report displays statistics for all asset groups to which the operator has privileges.
Asset type statistics reports
Asset type statistics report—Pie chart
This report displays, in a pie chart, the number of assets of each asset type and their proportion as shown in Figure 7.
Figure 7 Asset type statistics report—Pie chart
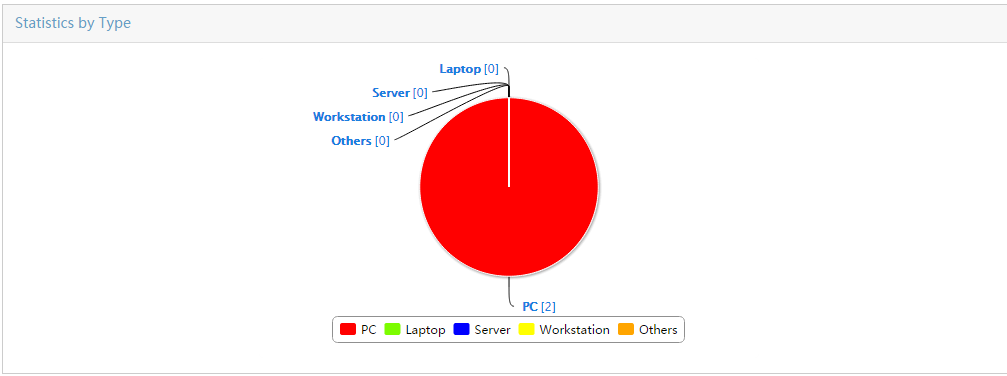
Asset type statistics report—List
This report lists the number of assets of each asset type and their proportion as shown in Figure 8.
Figure 8 Asset type statistics report—List
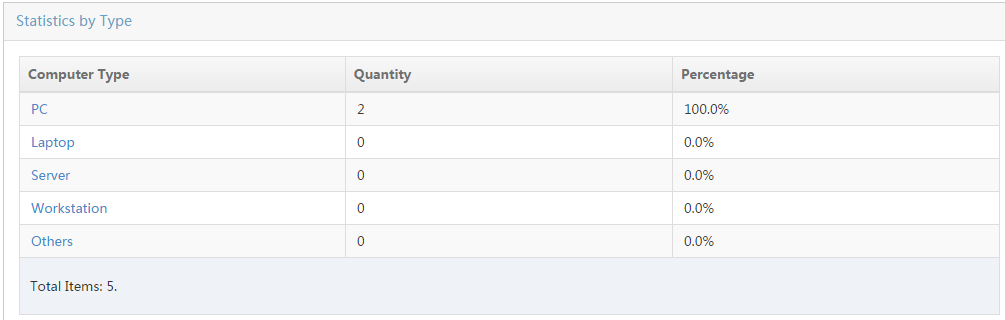
Collecting statistics by CPU
Operators can collect statistics for all assets or a specific asset group by CPU frequency.
Viewing CPU frequency statistics reports
1. Click the User tab.
2. From the navigation tree, select Desktop Asset Manager > Asset Statistics.
The Asset Statistics page opens.
3. In the Asset Statistics area, click the CPU icon ![]() .
.
The Statistics of CPU page opens. By default, the report displays statistics for all asset groups to which the operator has privileges.
4. Next to the Group Name
field, click the Select Asset Group icon ![]() .
.
The Select Asset Group page opens.
5. Select a group and click OK.
6. Select a report type (Pie Chart or List).
7. Click Query.
The query results are displayed under the Asset Query area.
8. To restore the default, click Reset.
The report displays statistics for all asset groups to which the operator has privileges.
CPU frequency statistics reports
CPU frequency statistics report—Pie chart
This report displays, in a pie chart, the number of CPUs in each frequency range and their proportion as shown in Figure 9.
Figure 9 CPU frequency statistics report—Pie chart
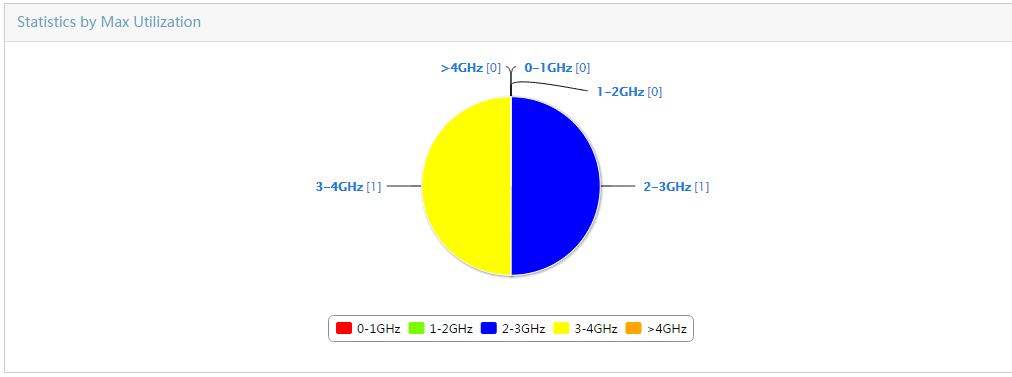
CPU frequency statistics report—List
This report lists the number of CPUs in each frequency range and their proportion as shown in Figure 10.
Figure 10 CPU frequency statistics report—List
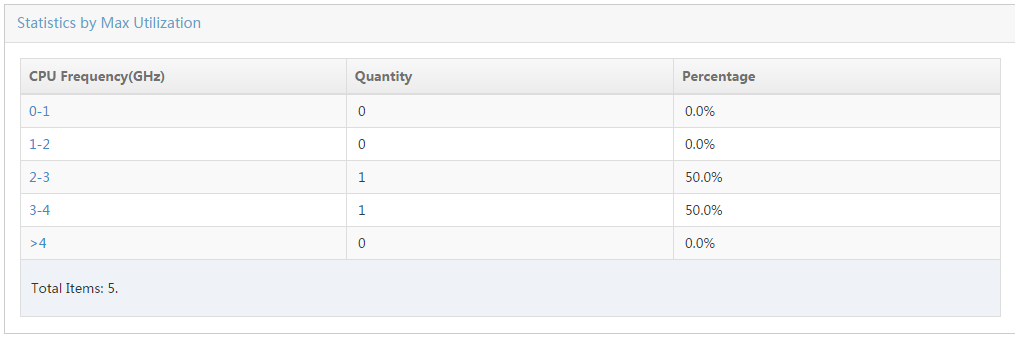
Collecting statistics by hard disk
Operators can collect statistics for all assets or a specific asset group by hard disk capacity and type.
Viewing hard disk capacity and type statistics reports
1. Click the User tab.
2. From the navigation tree, select Desktop Asset Manager > Asset Statistics.
The Asset Statistics page opens.
3. In the Asset Statistics area, click the Hard Disk ![]() icon.
icon.
The Hard Disk Statistics page opens. The report displays statistics for assets in all asset groups to which the operator has privileges.
4. Next to the Group Name
field, click the Select Asset Group icon ![]() .
.
The Select Asset Group page opens.
5. Select a group and click OK.
The Group Name field is populated with the selected asset group.
6. Select a report type (Pie Chart or List).
7. Click Query to submit your filter criteria.
The results of your filter or search query are displayed under the Asset Query area.
8. Click Reset to restore the default.
The report displays statistics for all asset groups to which the operator has privileges.
Hard disk capacity and type statistics reports
Hard disk capacity statistics report—Pie chart
This report displays, in a pie chart, the number of hard disks in each capacity range and their proportion, as shown in Figure 11.
Figure 11 Statistics report by hard disk size—Pie chart
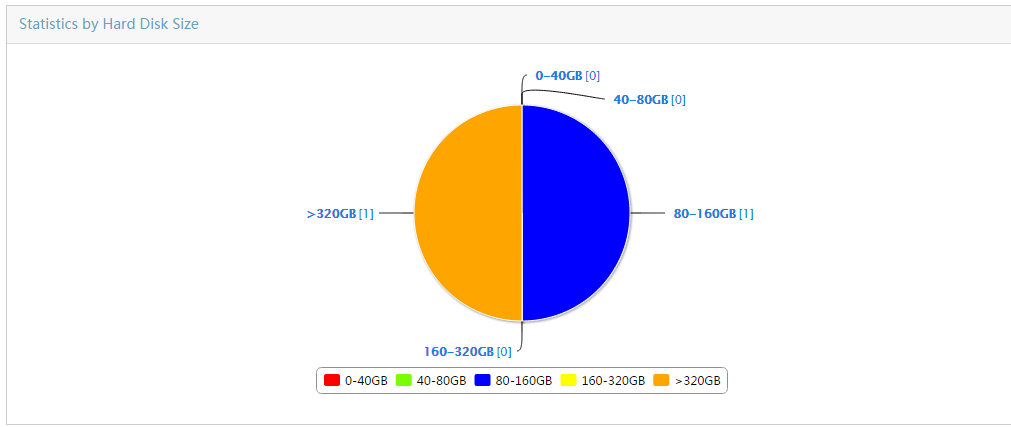
Hard disk capacity statistics report—List
This report lists the number of hard disks in each capacity range and their proportion as shown in Figure 12.
Figure 12 Statistics report by hard disk capacity—List
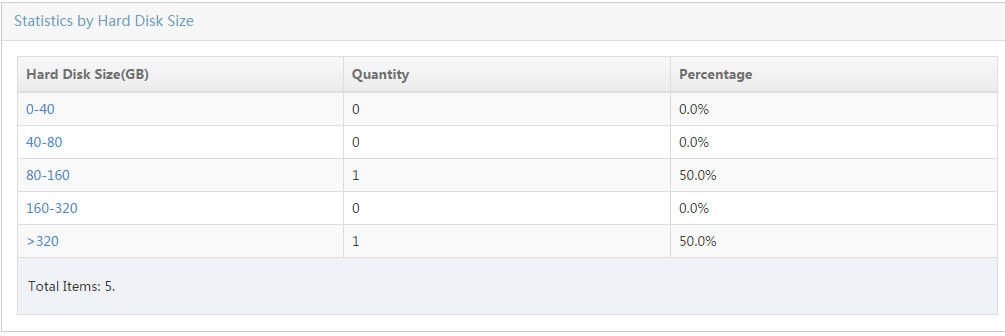
Hard disk type statistics report—Pie chart
This report displays, in a pie chart, the number of hard disks of each type and their proportion as shown in Figure 13.
Figure 13 Statistics report by hard disk type—Pie chart
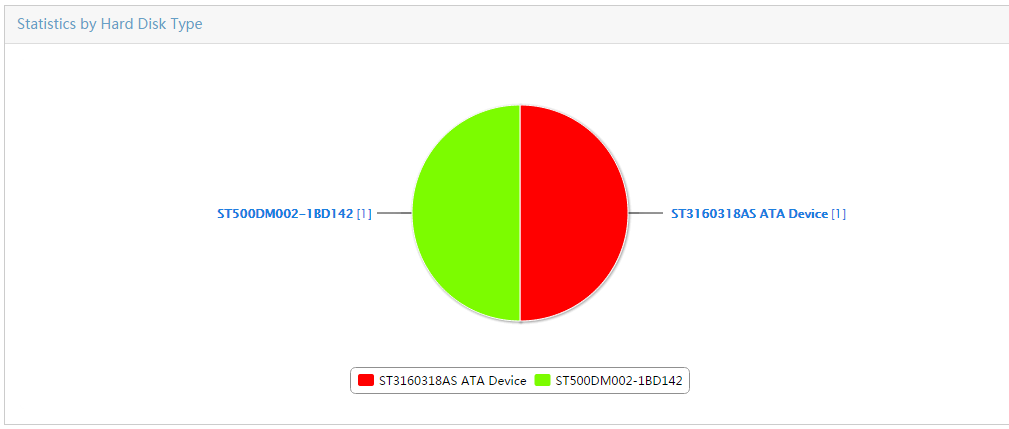
Hard disk type statistics report—List
This report lists the number of hard disks of each type and their proportion, as shown in Figure 14.
Figure 14 Statistics report by hard disk type—List
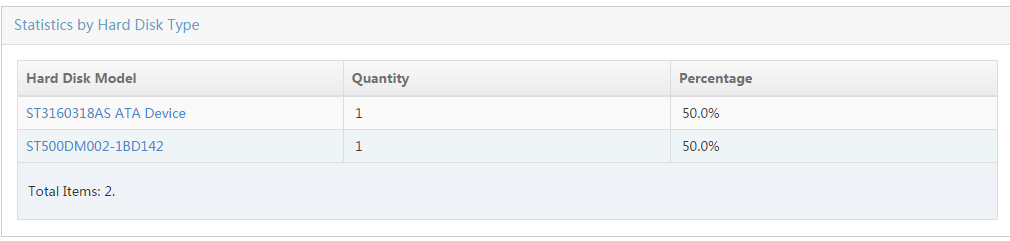
Collecting statistics by operating system
Operators can collect statistics for all assets or a specific asset group by operating system version and language.
Viewing operating system version and language statistics reports
1. Click the User tab.
2. From the navigation tree, select Desktop Asset Manager > Asset Statistics.
The Asset Statistics page opens.
3. Click the OS icon
![]() in the Asset
Statistics area.
in the Asset
Statistics area.
The Statistics of OS page opens. The report displays statistics for assets in all asset groups to which the operator has privileges.
4. Next to the Group Name
field, click the Select Asset Group icon ![]() .
.
The Select Asset Group page opens.
5. Select a group and click OK.
The Group Name field is populated with the selected asset group.
6. Select a report type (Pie Chart or List).
7. Click Query to submit your filter criteria.
The results of your filter or search query are displayed under the Asset Query area.
8. Click Reset to restore the default.
The report displays statistics for all asset groups to which the operator has privileges.
Operating system version and language statistics reports
Operating system version statistics report—Pie chart
This report displays, in a pie chart, the number of operating systems of each version and their proportion as shown in Figure 15.
Figure 15 Statistics report by operating system version—Pie chart
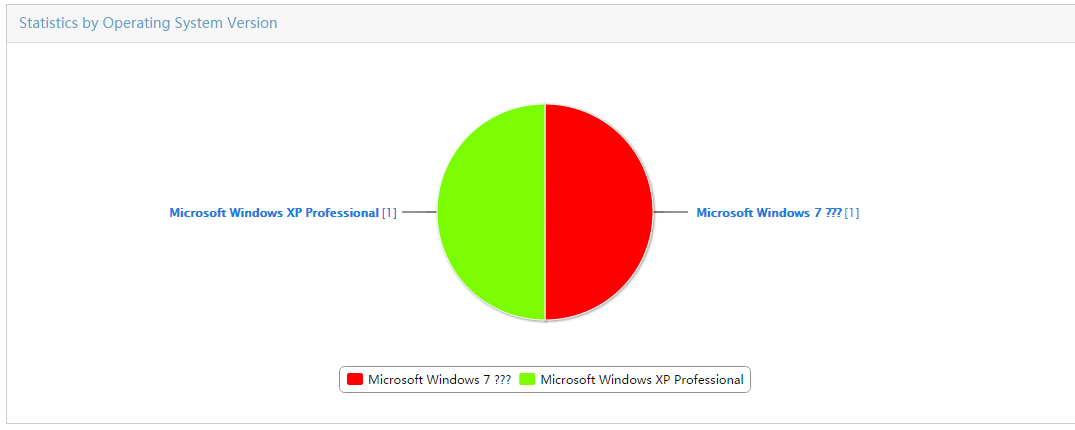
Operating system version statistics report—List
This report lists the number of operating systems of each version and their proportion as shown in Figure 16.
Figure 16 Statistics report by operating system version—List
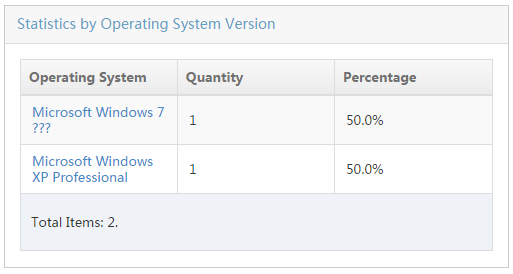
Operating system language statistics report—Pie chart
This report displays, in a pie chart, the number of operating systems using each language and their proportion as shown in Figure 17.
Figure 17 Statistics report by operating system language—Pie chart
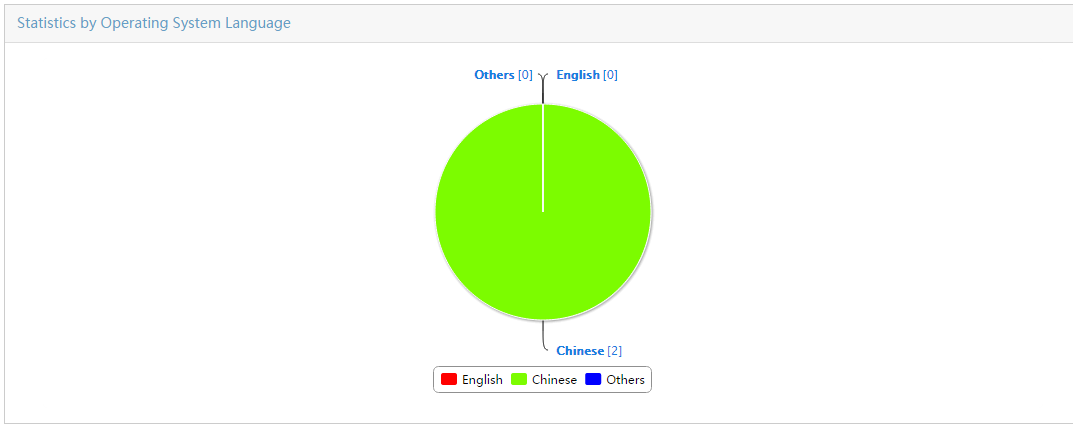
Operating system language statistics report—List
This report lists the number of operating systems using each language and their proportion as shown in Figure 18.
Figure 18 Statistics report by operating system language—List
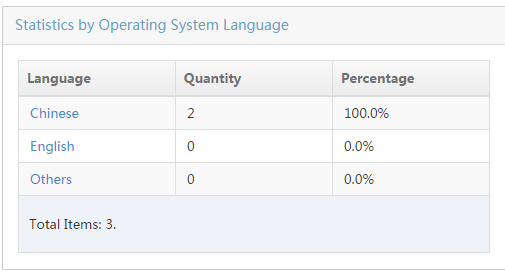
Collecting statistics by software installed
Operators can use the Asset Statistics function to collect statistics for all assets or a specific asset group by software installed.
Viewing software installation statistics reports
1. Click the User tab.
2. From the navigation tree, select Desktop Asset Manager > Asset Statistics.
The Asset Statistics page opens.
3. In the Asset Statistics area, click the Software ![]() icon.
icon.
The Statistics of Software page opens. By default, the report displays statistics for all asset groups to which the operator has privileges.
4. Next to the Group Name
field, click the Select Asset Group icon ![]() .
.
The Select Asset Group page opens.
5. Select a group and click OK.
The Group Name field is populated with the selected asset group.
6. From the Report Type field, select List.
7. Click Query to submit your filter criteria.
The results of your filter or search query are displayed under the Asset Query area.
8. Click Reset to restore the default.
The report displays statistics for all asset groups to which the operator has privileges.
Software installation statistics report
This report lists statistics for software installed on all assets or assets in selected asset groups as shown in Figure 19.
Figure 19 Software installation statistics report
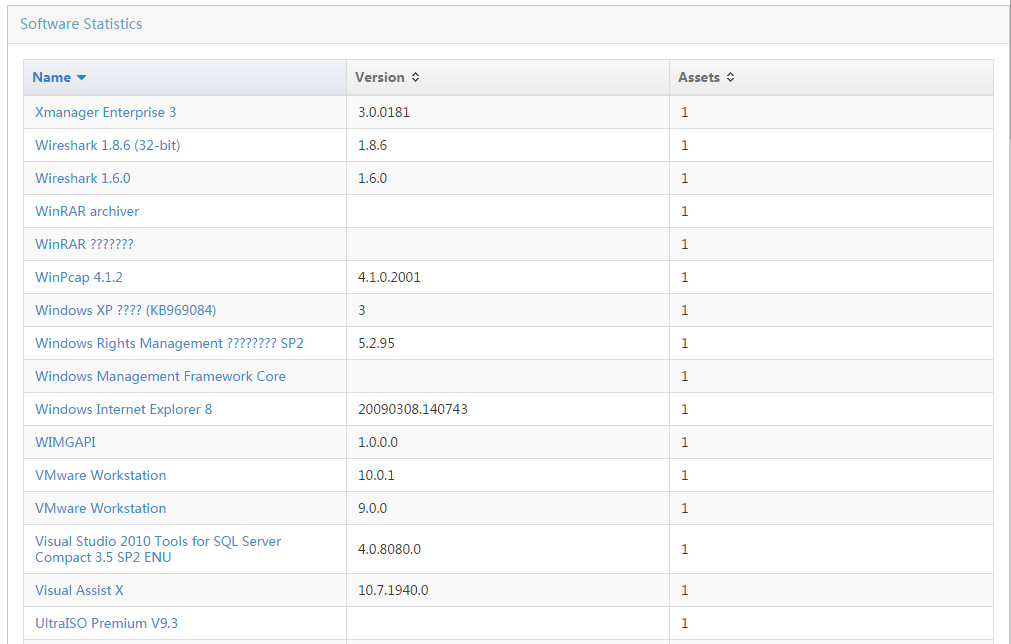
Managing export tasks
Operators can schedule a task to export and save all USB file transfer logs to a directory or FTP server as a CSV file or TXT file.
Viewing the export task management list
To view the export task management list:
1. Click the User tab.
2. From the navigation tree, select Desktop Asset Manager > Export Task.
The Export Task List displays the USB monitor task.
Export Task List contents
¡ Task Name—Name of the export task: USB Monitor.
¡ Export file path (iMC installation directory)—Export file path of the USB file transfer logs in the IMC installation directory.
¡ Status—Indicates whether the export task is enabled. By default, this field displays Disabled.
¡ Config—Click the Config icon ![]() to configure the export task.
to configure the export task.
Configuring the export task
1. Click the User tab.
2. From the navigation tree, select Desktop Asset Manager > Export Task.
The Export Task List displays all export tasks.
3. For the target USB monitor task you want to
configure, click the Configure icon ![]() .
.
The USB Monitor page opens.
4. Select Enable Automatic Export to enable automatic export of USB file transfer logs.
If you skip this step, the scheduled export task is not executed.
Configure the following parameters for the export task:
¡ Export Interval—Select the interval at which the task is executed: Daily or Monthly.
¡ File Type—Select the format of the export file: TXT or CSV. When you select TXT format, you must select a separator for the file. Options are space, tab, comma (,), colon (:), pound sign (#), and dollar sign ($).
¡ Task Description—Enter a brief description of the task.
¡ Prefix of Export File—Enter a prefix for the name of the export file. The export file name is composed of the prefix and the system time when the file was exported. For example, when you set the prefix to Backup, the export file name may be Backup20120316033010, where 20120316033010 indicates the time when the file was exported, to the second.
¡ Separator—Specify the delimiter to use between data fields in the exported file. Options are space, tab, comma (,), colon (:), pound sign (#), and dollar sign ($). This field is displayed only when the File Type is set to TXT.
5. When you want to export USB file transfer logs to an FTP server, select Export to FTP Server field.
To export USB file transfer logs to the work directory of a specific FTP user, configure the following parameters:
¡ FTP Server IP—Enter the IP address of the FTP server.
¡ FTP Username—Enter the user name used to log in to the FTP server.
¡ FTP Password—Enter the password used to log in to the FTP server.
¡ Confirm FTP Password—Enter the same FTP password again.
To export USB file transfer logs to the FTP server anonymously, select Anonymous User and enter the FTP server address in the FTP Server IP field.
6. Click OK.
Configuring desktop control schemes and policies
A desktop control scheme contains a set of policies distributed by the DAM server to each iNode client for controlling desktop assets. The policies are classified as follows:
· Peripheral policies—Disables peripheral devices, and monitors the use of USB storage devices and printers. The iNode client immediately reports an event to the DAM server for auditing when a peripheral device is enabled, a USB storage device is used, or a print task is submitted. Operators can view, add, modify, and delete peripheral policies. For more information, see "Configuring peripheral policies."
· Energy-saving policies—Implements scheduled shutdown of assets. According to the energy-saving policy, 10 minutes before the scheduled shutdown time the iNode client displays a message requesting a computer shutdown. If the user does not respond, the iNode client forcibly shuts down the computer. Operators can view, add, modify, and delete energy-saving policies. For more information, see "Configuring energy-saving policies."
· Monitoring alarm policies—Enables the DAM server to encapsulate monitoring information in syslogs and send them to the specified syslog server. The monitoring information is reported by the iNode client and includes software and hardware changes of assets, unauthorized copying, and printing of sensitive files. Operators can view, add, modify, and delete monitoring alarm policies. For more information, see "Configuring monitoring alarm policies."
Configuring desktop control schemes
Desktop control scheme list contents
· Name—Name of the desktop control scheme. Click the name to view detailed information.
· Peripheral Policy—Name of the peripheral policy assigned to the desktop control scheme.
· Energy-Saving Policy—Name of the energy-saving policy assigned to the desktop control scheme.
· Monitoring Alarm Policy—Name of the monitoring alarm policy assigned to the desktop control scheme.
· Description—Description of the desktop control scheme.
· Service Group—Service group to which the desktop control scheme belongs.
· Modify—To modify the desktop control scheme settings, click the Modify icon ![]() .
.
· Delete—To delete the desktop control scheme, click the Delete icon ![]() .
.
Desktop control scheme details
The desktop control scheme details page has a basic information area and a policy list area.
Basic Information area
· Name—Name of the desktop control scheme.
· Service Group—Service group to which the desktop control scheme belongs.
· Description—Description of the desktop control scheme.
Policy List area
· Policy Name—Name of the policy assigned to the desktop control scheme. Click the name to view detailed information.
· Policy Type—Policy type:
¡ Peripheral Policy
¡ Energy-Saving Policy
¡ Monitoring Alarm Policy
· Description—A description of the policy.
· Service Group—Service group to which the policy belongs.
Viewing the desktop control scheme list
1. Click the User tab.
2. From the navigation tree, select Desktop Asset Manager > Control Scheme.
The control scheme list displays all desktop control schemes.
3. Click Refresh to refresh the control scheme list.
4. To sort the control scheme list, click the column heading Name or Service Group.
Viewing desktop control scheme details
1. Click the User tab.
2. From the navigation tree, select Desktop Asset Manager > Control Scheme.
The control scheme list displays all desktop control schemes.
3. Click the name of a desktop control scheme to view detailed information.
The Control Scheme Details page opens.
4. Click Back to return to the control scheme list.
Adding a desktop control scheme
Each desktop control scheme can contain one peripheral policy, one energy-saving policy, and one monitoring alarm policy. You must create the policies before you add them to a desktop control scheme. For more information about the configuration procedure, see "Adding a peripheral policy," "Adding an energy-saving policy," and "Adding a monitoring alarm policy."
To add a desktop control scheme:
1. Click the User tab.
2. From the navigation tree, select Desktop Asset Manager > Control Scheme.
The control scheme list displays all desktop control schemes.
3. Click Add.
The Add Control Scheme page opens.
4. Configure basic information for the desktop control scheme.
5. In the Policy List area, assign policies to the desktop control scheme.
Select the policy you want to assign to the desktop control scheme. You can select one peripheral policy, one energy-saving policy, and one monitoring alarm policy.
6. Click OK.
After adding the desktop control scheme, you can assign it to a single asset or a group of assets. The group basis configuration applies to all assets in the same group, but can be overridden by the asset basis configuration. For more information, see "Modifying an asset group" and "Modifying an asset."
Modifying a desktop control scheme
1. Click the User tab.
2. From the navigation tree, select Desktop Asset Manager > Control Scheme.
The control scheme list displays all desktop control schemes.
3. For the desktop control scheme you want to modify, click the Modify
icon ![]() .
.
4. Modify the description for the desktop control scheme. You cannot modify other basic information.
5. In the Policy List area, reassign policies to the desktop control scheme.
Select the policy you want to assign to the desktop control scheme. To cancel a policy, clear its box.
6. Click OK.
Deleting a desktop control scheme
To delete a desktop control scheme:
1. Click the User tab.
2. From the navigation tree, select Desktop Asset Manager > Control Scheme.
The control scheme list displays all desktop control schemes.
3. For the desktop control scheme you want to delete,
click the Delete icon ![]() .
.
A confirmation dialog box opens.
4. Click OK.
Configuring peripheral policies
A peripheral policy is used to disable peripheral devices and monitor the use of USB storage devices and printers. The iNode client immediately reports an event to the DAM server for auditing when a peripheral device is enabled, a USB storage device is used, or a print task is submitted. Operators can view, add, modify, and delete peripheral policies.
Peripheral policy list contents
· Policy Name—Name of the peripheral policy. Click the name to view detailed information.
· Description—Description of the peripheral policy.
· Illegal—Types of peripheral devices prohibited by the peripheral policy.
· Report—Indicates whether the iNode client reports to the DAM server that a prohibited peripheral device is enabled on the asset. If so, this field displays Report. If not, this field is empty.
· Service Group—Service group to which the peripheral policy belongs.
· Modify—Click the Modify icon ![]() to
modify the policy settings.
to
modify the policy settings.
· Delete—Click the Delete icon ![]() to delete the
peripheral policy.
to delete the
peripheral policy.
Peripheral policy details
The peripheral policy details page has a basic information area, an unauthorized devices area, and a client message area.
Basic Information area
· Policy Name—Name of the peripheral policy.
· Service Group—Service group to which the peripheral policy belongs.
· Description—Description of the peripheral policy.
· Report Use of Unauthorized Devices—Indicates whether the iNode client reports to the DAM server that a peripheral device selected in the Disable Devices area is enabled on the asset. Operators can audit the peripheral use violations on the DAM server. For more information, see "Unauthorized peripheral use record audit."
· Monitor USB File Transfer—Indicates whether USB storage device monitoring is enabled. When enabled, the iNode client reports the connection, disconnection, and write events of USB storage devices to the DAM server for auditing. For more information, see "USB file transfer log audit."
· Monitor Printer Usage—Indicates whether printer monitoring is enabled. When enabled, the iNode client monitors the printers in use, and reports the following information to the DAM server for auditing:
¡ Printer name
¡ Printer type (shared or not shared)
¡ Printed file names, number of printed file pages
¡ And printed file size
For more information, see "Printer use log audit."
Unauthorized Devices area
Select types of peripheral devices for the DAM server to disable:
· USB Storage—USB storage devices
· USB Nonstorage—USB nonstorage devices
· USB Storage Device Whitelist—A list of USB storage devices that are not disabled
· DVD/CD-ROM—DVD/CD-ROM drives
· Floppy—Floppy disk drives
· PCMCIA—PCMCIA interfaces
· COM—COM interfaces
· LPT—LPTs
· Infrared—Infrared devices
· Bluetooth—Bluetooth peripheral devices
· 1394—1394 interfaces
· Modem—Modems
Client Message area
· Device Unauthorized Message—Indicates whether:
· The iNode client displays a message when peripheral devices are disabled.
· $Device$ represents the name of a disabled device.
Viewing the peripheral policy list
1. Click the User tab.
2. From the navigation tree, select Desktop Asset Manager > Desktop Control Policy > Peripheral.
The peripheral policy list displays all peripheral policies.
3. To refresh the peripheral policy list, click Refresh.
4. To sort the peripheral policy list, click the column heading Policy Name or Service Group.
Viewing peripheral policy details
1. Select Desktop Asset Manager > Desktop Control Policy > Peripheral.
The peripheral policy list displays all peripheral policies.
2. Click the name of the peripheral policy you want to view.
The Peripheral Policy Details page opens.
3. Click Back to return to the peripheral policy list.
Adding a peripheral policy
1. Click the User tab.
2. From the navigation tree, select Desktop Asset Manager > Desktop Control Policy > Peripheral.
The peripheral policy list displays all peripheral policies.
3. Click Add.
The Add Peripheral Policy page opens.
4. Configure basic information for the peripheral policy.
¡ Policy Name—Enter a unique name for the peripheral policy.
¡ Service Group—Select the service group to which the peripheral policy belongs.
¡ Description—Enter a description for the peripheral policy.
¡ Report Use of Unauthorized Devices—Select the box next to the Report Use of Unauthorized Devices field to generate reports of peripheral use violations for auditing.
¡ Monitor USB File Transfer—Select the box next to the Monitor USB File Transfer field to monitor use of USB storage devices for auditing.
¡ Monitor Printer Usage—Select the box next to the Monitor Printer Usage field to monitor use of printers for auditing.
|
|
NOTE: When you select the Monitor USB File Transfer option, the USB Storage option in the Unauthorized Devices area turns gray. You cannot disable the USB storage devices for the asset. |
5. In the Unauthorized Devices area, select the peripheral device types to disable for the asset:
¡ USB Storage
¡ USB Nonstorage
¡ DVD/CD-ROM
¡ Floppy
¡ PCMCIA
¡ COM
¡ LPT
¡ Infrared
¡ Bluetooth
¡ 1394
¡ Modem
6. If USB storage devices are disabled, you can enter the device ID of allowed devices in the USB Storage Device Whitelist field. Only one device ID is allowed per line. A device ID has a vendor ID (VID) and a product ID (PID), separated by a slash (/), which uniquely identifies a USB storage device.
7. Click OK.
The new peripheral policy is added to the peripheral policy list and in the Policy List on the Add Control Scheme page.
Modifying a peripheral policy
1. Click the User tab.
2. From the navigation tree, select Desktop Asset Manager > Desktop Control Policy > Peripheral.
The peripheral policy list displays all peripheral policies.
3. For the peripheral policy you want to modify, click the Modify icon ![]() .
.
4. Modify the basic information for the peripheral policy. You cannot modify Policy Name or Service Group.
¡ Description—Enter a new description for the peripheral policy.
¡ Report Use of Unauthorized Devices—Select the box next to the Report Use of Unauthorized Devices field to report peripheral use violations for auditing, or clear the box to disable the function.
¡ Monitor USB File Transfer—Select the box next to the Monitor USB File Transfer field to monitor use of USB storage devices for auditing, or clear the box to disable the function.
¡ Monitor Printer Usage—Select the box next to the Monitor Printer Usage field to monitor use of printers for auditing, or clear the box to disable the function.
5. In the Unauthorized Devices area, reselect the following peripheral device types to disable for the asset:
¡ USB Storage
¡ USB Nonstorage
¡ DVD/CD-ROM
¡ Floppy
¡ PCMCIA
¡ COM
¡ LPT
¡ Infrared
¡ Bluetooth
¡ 1394
¡ Modem
¡ Unknown USB Devices
If USB storage devices are disabled, you can enter device IDs in the USB Storage Device Whitelist field. Only one device ID is allowed per line. A device ID uniquely identifies a USB storage device and contains a vendor ID (VID) and a product ID (PID) that are separated by a slash (/).
If unknown USB storage devices are disabled, you can enter device IDs in the Unknown USB Storage Device Whitelist field. Only one device ID is allowed per line. A device ID uniquely identifies a USB storage device and contains a vendor ID (VID) and a product ID (PID) that are separated by a slash (/). This option can be used to disable the USB storage function provided by mobile phones.
6. Click OK.
Deleting a peripheral policy
A peripheral policy cannot be deleted when it is assigned to a desktop control scheme. To delete the policy, first remove it from the scheme. For more information, see "Modifying a desktop control scheme."
To delete a peripheral policy:
1. Click the User tab.
2. From the navigation tree, select Desktop Asset Manager > Desktop Control Policy > Peripheral.
The peripheral policy list displays all peripheral policies.
3. For the peripheral policy you want to delete, click the Delete icon ![]() .
.
A confirmation dialog box opens.
4. Click OK.
Configuring energy-saving policies
Use an energy-saving policy to implement a scheduled shutdown of assets. Ten minutes before the scheduled shutdown time, the iNode client displays a message requesting that the user shut down the computer. If the user does not respond, the iNode client then forcibly shuts down the computer at the designated time. Operators can view, add, modify, and delete energy-saving policies.
Energy-saving policy list contents
· Policy Name—Name of the energy-saving policy.
· Auto Shutdown at—Automatic shutdown time configured for the asset.
· Description—Description of the energy-saving policy.
· Service Group—Service group to which the energy-saving policy belongs.
· Modify—Click the Modify icon ![]() to
modify the policy settings.
to
modify the policy settings.
· Delete—Click the Delete icon ![]() to delete the
energy-saving policy.
to delete the
energy-saving policy.
Viewing the energy-saving policy list
1. Click the User tab.
2. From the navigation tree, select Desktop Asset Manager > Desktop Control Policy > Energy Saving.
The energy-saving policy list displays all energy-saving policies.
3. To refresh the energy-saving policy list, click Refresh.
4. To sort the energy-saving policy list, click the column heading Policy Name or Service Group.
Adding an energy-saving policy
1. Click the User tab.
2. From the navigation tree, select Desktop Asset Manager > Desktop Control Policy > Energy Saving.
The energy-saving policy list displays all energy-saving policies.
3. Click Add.
The Add Energy-Saving Policy page opens.
4. Configure the following parameters for the energy-saving policy:
¡ Policy Name—Enter a unique name for the energy-saving policy.
¡ Service Group—Select the service group to which the energy-saving policy belongs.
¡ Auto Shutdown at—Enter the automatic shutdown time in the format hh:mm, where hh represents the two-digit hour in 24-hour format, and mm represents the two-digit minute.
¡ Description—Enter a description for the energy-saving policy
5. Click OK.
The new energy-saving policy is added to the energy-saving policy list and in the Policy List on the Add Control Scheme page.
Modifying an energy-saving policy
1. Click the User tab.
2. From the navigation tree, select Desktop Asset Manager > Desktop Control Policy > Energy-Saving.
The energy-saving policy list displays all energy-saving policies.
3. For the energy-saving
policy you want to modify, click the Modify icon ![]() .
.
The Modify Energy-Saving Policy page opens.
4. Modify the following parameters for the energy-saving policy. You cannot modify the policy name or service group.
¡ Auto Shutdown at—Enter a new automatic shutdown time in the format hh:mm, where hh represents the two-digit hour in 24-hour format, and mm represents the two-digit minute.
¡ Description—Enter a new description for the energy-saving policy.
5. Click OK.
Deleting an energy-saving policy
An energy-saving policy cannot be deleted when it is assigned to a desktop control scheme. To delete the policy, first remove it from the scheme. For more information, see "Modifying a desktop control scheme."
To delete an energy-saving policy:
1. Click the User tab.
2. From the navigation tree, select Desktop Asset Manager > Desktop Control Policy > Energy Saving.
The energy-saving policy list displays all energy-saving policies.
3. For the energy-saving
policy you want to delete, click the Delete icon ![]() .
.
A confirmation dialog box opens.
4. Click OK.
Configuring monitoring alarm policies
Monitoring alarm policies enable the DAM server to encapsulate monitoring information in syslogs and send them to the specified syslog server. The monitoring information is reported by the iNode client, and includes software and hardware changes of assets, unauthorized copying, and printing of sensitive files. Operators can view, add, modify, and delete monitoring alarm policies.
Before you configure monitoring alarm policies, select Enable for Send Syslogs on the Service Parameters page. Otherwise, the DAM server cannot send syslogs to the specified syslog server. For more information about the configuration procedure, see "DAM service parameters."
The IMC platform can serve as the syslog server to receive syslogs from the DAM server. For more information about syslog management, see HPE Intelligent Management Center v7.0 Enterprise and Standard Administrator Guide.
Monitoring alarm policy list contents
· Policy Name—Name of the monitoring alarm policy. Click the name to view detailed information.
· Description—Description of the monitoring alarm policy.
· Service Group—Service group to which the monitoring alarm policy belongs.
· Modify—To modify the policy settings, click the Modify
icon ![]() .
.
· Delete—To delete the monitoring alarm policy, click the Delete icon ![]() .
.
Monitoring alarm policy details
The Monitoring alarm policy details page has the following areas:
· Basic Information
· USB Monitoring
· Printer Monitoring
· Hardware Changes Monitoring
· Software Changes Monitoring
Basic Information area
· Policy Name—Name of the monitoring alarm policy.
· Service Group—Service group to which the monitoring alarm policy belongs.
· Description—Description of the monitoring alarm policy.
USB Monitoring area
Keywords to Trigger Alarms—List of keywords for triggering alarms. When the DAM server receives information about files written from the asset to a USB storage device, it checks the file names for keywords. When a keyword is found, the DAM server encapsulates the information in syslogs and sends them to the specified syslog server. On the syslog server, operators can view the following information: asset number, asset name, owner, time when the USB storage device was connected to the asset, and name, size, and write time of each file written to the USB storage device
Printer Monitoring area
Keywords to Trigger Alarms—List of keywords for triggering alarms. When the DAM server receives information about files printed by the asset, it checks the file names for keywords. When a keyword is found, the DAM server encapsulates the information in syslogs and sends them to the specified syslog server. On the syslog server, operators can view the following information: asset number, asset name, owner, printer name, and the name, number of pages, size, and print time of each printed file.
Hardware Changes Monitoring area
This area lists the hardware items to be monitored. When the content of a selected item changes, the DAM server encapsulates the changes in syslogs and sends them to the specified syslog server.
· CPU—CPU number and name.
· Memory—Total memory of the asset.
· Mainboard—Vendor and product model of the main board.
· DVD/CD-ROM—Device instance path of the DVD/CD-ROM drive.
· NIC—Device instance path.
· Hard Disk—Hard-disk interface type and device instance path.
· BIOS—BIOS caption, vendor, release date, and version.
Software Changes Monitoring area
This area lists the software items to be monitored. When the content of a selected item changes, the DAM server encapsulates the changes in syslogs and sends them to the specified syslog server.
· Logical Disk—Logical disk name, description, file system, serial number, and total size. The logical disks are scanned and checked only when the asset starts up.
· Network Connections—NIC serial number, IP address, DHCP status, gateway IP address, asset MAC address, and subnet mask.
· Operating System—Operating system name, version, service pack, installation date, and language.
· Screen Saver—Screen-saver status (enabled or disabled), display of logon screen on resume (enabled or disabled), and idle time.
· System Information—Login name of the asset.
· Computer Name—Computer name of the asset.
· Partition—Hard disk number, partition number, partition type, boot partition (yes or no), and partition capacity.
· Software—Software name and version.
· Reinstall OS or Other Update—Operating system reinstallation and recovery.
Viewing the monitoring alarm policy list
1. Click the User tab.
2. From the navigation tree, select Desktop Asset Manager > Desktop Control Policy > Monitoring Alarm.
The monitoring alarm policy list displays all monitoring alarm policies.
3. Click Refresh to refresh the monitoring alarm policy list.
4. To sort the monitoring alarm policy list, click the column heading Policy Name or Service Group.
Viewing monitoring alarm policy details
1. Click the User tab.
2. From the navigation tree, select Desktop Asset Manager > Desktop Control Policy > Monitoring Alarm.
The monitoring alarm policy list displays all monitoring alarm policies.
3. Click the name of the monitoring alarm policy you want to view.
The Monitoring Alarm Policy Details page opens.
4. Click Back to return to the monitoring alarm policy list.
Adding a monitoring alarm policy
1. Click the User tab.
2. From the navigation tree, select Desktop Asset Manager > Desktop Control Policy > Monitoring Alarm.
The monitoring alarm policy list displays all monitoring alarm policies.
3. Click Add.
The Add Monitoring Alarm Policy page opens.
4. Configure basic information for the monitoring alarm policy:
¡ Policy Name—Enter a unique name for the monitoring alarm policy.
¡ Service Group—Select the service group to which the monitoring alarm policy belongs.
¡ Description—Enter a description for the monitoring alarm policy to facilitate maintenance.
5. Enter keywords in the Keywords to Trigger Alarms field of the USB Monitoring area.
You can enter up to 100 keywords per line, with each keyword containing up to 32 characters. When the DAM server receives information about files written from the asset to a USB storage device, it checks the file names against these keywords. When a keyword is found, the DAM server encapsulates the information in syslogs and sends them to the specified syslog server. On the syslog server, you can view the following information:
¡ Asset number
¡ Asset name
¡ Owner
¡ Time when the USB storage device was connected to the asset
You can also view the name, size, and write time of each file written to the USB storage device.
6. Enter the keywords in the Keywords to Trigger Alarms field of the Printer Monitoring area.
You can enter up to 100 keywords per line, with each keyword containing up to 32 characters. When the DAM server receives information about files printed by the asset, it checks the file names against these keywords. When a keyword is found, the DAM server encapsulates the information within syslogs and sends them to the specified syslog server. On the syslog server, you can view the following information:
¡ Asset number
¡ Asset name
¡ Owner
¡ Printer name
You can also view the name, number of pages, size, and print time of each printed file.
7. Select hardware items to monitor in the Hardware Changes Monitoring area.
Click the boxes next to target items to monitor them. When the content of a selected item changes, the DAM server encapsulates the changes within syslogs and sends them to the specified syslog server.
¡ CPU—CPU number and CPU name.
¡ Memory—Total memory of the asset.
¡ Mainboard—Vendor and product model of the main board.
¡ DVD/CD-ROM—Device instance path of the DVD/CD-ROM drive.
¡ NIC—Device instance path.
¡ Hard Disk—Hard-disk interface type and device instance path.
¡ BIOS—BIOS caption, vendor, release date, and version.
8. Select the software items to monitor in the Software Changes Monitoring area.
Click the boxes next to target items to monitor them. When the content of a selected item changes, the DAM server encapsulates the changes within syslogs and sends them to the specified syslog server.
¡ Logical Disk—Logical disk name, description, file system, serial number, and total size. The logical disks are only scanned and checked when the asset starts up.
¡ Network Connections—NIC serial number, IP address, DHCP status, gateway IP address, asset MAC address, and subnet mask.
¡ Operating System—Operating system name, version, service pack, installation date, and language.
¡ Screen Saver—Screen saver status (enabled or disabled), display of logon screen on resume (enabled or disabled), and idle time.
¡ System Information—Login name of the asset.
¡ Computer Name—Computer name of the asset.
¡ Partition—Hard disk number, partition number, partition type, boot partition (yes or no), and partition capacity.
¡ Software—Software name and version.
¡ Reinstall OS or Other Update—Operating system reinstallation and recovery.
9. Click OK.
The new monitoring alarm policy is added to the monitoring alarm policy list and the Policy List on the Add Control Scheme page.
Modifying a monitoring alarm policy
1. Click the User tab.
2. From the navigation tree, select Desktop Asset Manager > Desktop Control Policy > Monitoring Alarm.
The monitoring alarm policy list displays all monitoring alarm policies.
3. For the monitoring alarm policy you want to modify, click the Modify
icon ![]() .
.
The Modify Monitoring Alarm Policy page opens.
4. Modify the description for the monitoring alarm policy. You cannot modify other basic information.
5. Modify keywords in the Keywords to Trigger Alarms field of the USB Monitoring area.
You can enter up to 100 keywords per line with each keyword containing up to 32 characters. When the DAM server receives information about files written from the asset to a USB storage device, it checks the file names against these keywords. When a keyword is found, the DAM server encapsulates the information within syslogs and sends them to the specified syslog server.
On the syslog server, you can view the following information: asset number, asset name, owner, and time when the USB storage device was connected to the asset. You can also view the name, size, and write time of each file written to the USB storage device.
6. Modify keywords in the Keywords to Trigger Alarms field in the Printer Monitoring area.
You can enter up to 100 keywords per line, with each keyword containing up to 32 characters. When the DAM server receives information about files printed by the asset, it checks the file names against these keywords. When a keyword is found, the DAM server encapsulates the information in syslogs and sends them to the specified syslog server. On the syslog server, you can view the following information: asset number, asset name, owner, and printer name. You can also view the name, number of pages, size, and print time of each printed file.
7. Reselect the hardware items to monitor in the Hardware Changes Monitoring area.
Select the boxes next to items to monitor. To cancel monitoring an item, clear its box. When the content of a selected item changes, the DAM server encapsulates the changes in syslogs and sends them to the specified syslog server.
8. Reselect the software items to monitor in the Software Changes Monitoring area.
Select the boxes next to items to monitor. To cancel monitoring an item, clear its box. When the content of a selected item changes, the DAM server encapsulates the changes in syslogs and sends them to the specified syslog server.
9. Click OK.
Deleting a monitoring alarm policy
When a monitoring alarm policy is assigned to a desktop control scheme, it cannot be deleted. To delete the policy, first remove it from the scheme. For more information, see "Modifying a desktop control scheme."
To delete a monitoring alarm policy:
1. Click the User tab.
2. From the navigation tree, select Desktop Asset Manager > Desktop Control Policy > Monitoring Alarm.
The monitoring alarm policy list displays all monitoring alarm policies.
3. For the monitoring
alarm policy you want to delete, click the Delete icon ![]() .
.
A confirmation dialog box opens.
4. Click OK.
Auditing desktop assets
DAM supports the following asset audit functions:
· Post audits—Post-audit data shows asset usage based on the asset history records stored in DAM, including:
¡ Asset hardware changes
¡ Asset software changes
¡ Use of USB storage devices
¡ Use of printers
¡ Use of unauthorized peripherals
· Real-time audits—Real-time audit data shows asset information in real time. DAM provides the terminal file audit function to show in real time whether a terminal asset contains specified files.
Asset hardware change record audit
DAM works with the iNode client to support the asset hardware change record audit function. The iNode client automatically collects changes to asset hardware shown in Table 27 and reports them to the DAM server. Operators can view the change time and change content by auditing these changes.
Operators can configure the hardware items to monitor in a monitoring alarm policy, assign the policy to a desktop control scheme, and assign the desktop control scheme to the target asset or asset group. The DAM server collects hardware changes from the monitored asset or each asset in the monitored asset group and then sends them in syslogs to the specified syslog server. Both DAM and the syslog server are aware of the asset hardware changes.
By default, asset hardware change records can be kept for 1,825 days (about five years). Operators can modify the record lifetime through the Asset Change Record Lifetime parameter. For more information about modifying the record lifetime, see "DAM service parameters."
Table 27 Asset hardware changes
|
Item |
Changes |
|
CPU |
· CPU number · CPU name |
|
Mainboard |
· Vendor · Product model |
|
BIOS |
· Caption · Vendor · Release date · Version |
|
Memory |
Total memory |
|
Hard Disk |
· Interface type · Device instance path |
|
NIC |
Device instance path |
|
DVD/CD-ROM |
Device instance path |
Asset hardware change information list contents
· Asset Number—Asset number of the asset. Click the asset number to view detailed information about the asset.
· Asset Name—Name of the asset.
· Change Type—Change type of the asset hardware. Options are:
¡ Common Update
¡ Reinstall OS
¡ Other Update
· Change Contents—Content of the changed hardware. Options are:
¡ CPU
¡ Memory
¡ Mainboard
¡ DVD/CD-ROM
¡ NIC
¡ Hard Disk
¡ BIOS
· Owner—Owner of the asset. Click the owner to view detailed information.
· Changed on—System time of the server when the asset hardware was changed.
· Details— To view detailed information about the asset hardware change,
click the Details icon ![]() .
.
Asset hardware change record details
The asset hardware change record details page has the following parameters:
· CPU Change Information—Displayed only when the CPU number or the CPU name has changed. Operators can view CPU changes by comparing the new list with the old list.
· BIOS Change Information—Displayed only when the BIOS caption, vendor, release date, or version has changed. Operators can view BIOS changes by comparing the new list with the old list.
· Mainboard Change Information—Displayed only when the vendor or product model of the main board has changed. Operators can view main board changes by comparing the new list with the old list.
· Memory Change Information—Displayed only when the total memory of the asset has changed. Operators can view memory changes by comparing the new list with the old list.
· Hard Disk Change Information—Displayed only when the hard-disk interface type or device instance path has changed. Operators can view asset hard-disk changes by comparing the old list with the new list.
· NIC Change Information—Displayed only when the device instance path of the NIC has changed. Operators can view NIC changes by comparing the new list with the old list. The device instance path changes when the NIC or the position of the NIC PCI is changed.
· DVD/CD-ROM Change Information—Displayed only when the device instance path of the DVD/CD-ROM drive has changed. Operators can view asset DVD/CD-ROM drive changes by comparing the old list with new list.
Viewing the asset hardware change information list
1. Click the User tab.
2. From the navigation tree, select Desktop Asset Manager > Asset Hardware Change.
The asset hardware change information list displays all asset hardware change records.
3. To sort the asset hardware change information list, click one of the following column headings:
¡ Asset Number
¡ Asset Name
¡ Change Type
¡ Owner
¡ Changed on
Viewing asset hardware change record details
1. Click the User tab.
2. From the navigation tree, select Desktop Asset Manager > Asset Hardware Change.
The asset hardware change information list displays all asset hardware change records.
3. Click the Details icon ![]() for the asset
hardware change information you want to view.
for the asset
hardware change information you want to view.
The Asset Hardware Change Details page opens.
4. Click Back to return to the asset hardware change information list.
Querying asset hardware change records
DAM allows operators to filter detailed asset hardware change records by using basic query mode or advanced query mode.
Basic query
1. Click the User tab.
2. From the navigation tree, select Desktop Asset Manager > Asset Hardware Change.
The asset hardware change information list displays all asset hardware change records.
3. At the upper right corner of the page, click Basic Query.
When Advanced Query is displayed at the upper right corner, you are already in basic query mode. Skip this step.
4. Specify one or more of the following query criteria:
¡ Asset Number—Enter a partial or complete asset number of the asset.
¡ Asset Name—Enter a partial or complete name of the asset.
¡ Changed from/to—Specify the time
range when the asset hardware was changed. You can enter the time range, or
click the Select Date and Time icon ![]() to bring up the
time control page and select the time range. The time range must be in the
format YYYY-MM-DD hh:mm:ss.
to bring up the
time control page and select the time range. The time range must be in the
format YYYY-MM-DD hh:mm:ss.
5. Click Query.
The asset hardware change information list displays all asset hardware change records matching the query criteria.
6. To clear the query criteria, click Reset.
The asset hardware change information list displays all hardware change records.
Advanced query
1. Click the User tab.
2. From the navigation tree, select Desktop Asset Manager > Asset Hardware Change.
The asset hardware change information list displays all asset hardware change records.
3. At the upper right corner of the page, click Advanced Query.
When Basic Query is displayed at the upper right corner, you are already in advanced query mode. Skip this step.
4. Specify one or more of the following query criteria:
¡ Asset Number—Enter a partial or complete asset number of the asset.
¡ Asset Name—Enter a partial or complete name of the asset.
¡ Owner—Enter a partial or complete owner of the asset.
¡ Group Name—To select the asset group
where the asset is located, click the Select Asset Group icon ![]() .
.
¡ Change Type—Select the change type from the following list:
- Common Update—Ordinary hardware changes on the asset, such as adding a memory bar to the computer, are categorized into this type. The iNode client collects and reports to DAM the asset hardware change information.
- Reinstall OS—All hardware information about the asset that the user re-registers through the iNode client. The user re-registers the asset only after its operating system is reinstalled. The iNode client re-collects and reports to DAM all asset information.
- Other Update—Hardware changes that are not categorized into Common Update or Reinstall OS (such as registering the asset on multiple DAMs) are categorized into Other Update.
¡ Change Contents—Select the content of changed hardware from the list. Options are:
- BIOS
- CPU
- DVD/CD-ROM
- Hard Disk
- Mainboard
- Memory
- NIC
¡ Changed from/to—Specify the time
range when the asset hardware was changed. You can enter the time range or
click the Select Date and Time icon ![]() to bring up the
time control page and select the time range. The time range must be in the
format YYYY-MM-DD hh:mm:ss.
to bring up the
time control page and select the time range. The time range must be in the
format YYYY-MM-DD hh:mm:ss.
5. Click Query.
The asset hardware change information list displays all asset hardware change records matching the query criteria.
6. To clear the query criteria, click Reset.
The asset hardware change information list displays all hardware change records.
Asset software change record audit
With the cooperation of the iNode client, DAM supports the asset software change record audit function. The iNode client automatically collects the asset software changes shown in Table 28 and reports them to the DAM server. Operators can view the change time and change content by auditing these changes.
Operators can configure the software items to be monitored in a monitoring alarm policy, assign the policy to a desktop control scheme, and assign the desktop control scheme to the target asset or asset group. The DAM server collects software changes from the monitored asset or each asset in the monitored asset group, and then sends them in syslogs to the specified syslog server. DAM and the syslog server are both notified of asset software changes.
By default, asset software change records can be kept for 1,825 days (approximately five years). Operators can modify the record lifetime through the Asset Change Record Lifetime parameter. For more information about modifying the record lifetime, see "DAM service parameters."
Table 28 Asset software change records
|
Item |
Changes |
|
Login Name |
Computer login name |
|
Computer Name |
Computer name |
|
Logical Disk |
· Name · Description · File system · Serial number · Total size |
|
Operating System |
· Name · Version · Service pack · Installation date · Language |
|
Screen Saver |
· Screen-saver status (enabled or disabled) · Display of logon screen on resume (enabled or disabled) · Idle time |
|
Partition |
· Hard disk number · Partition number · Partition type · Boot partition (yes or no) · Partition capacity |
|
Network Connections |
· NIC serial number · IP address · DHCP status · Gateway IP address · NIC MAC address · Subnet mask |
|
Software |
· Software name · Software version |
Asset software change information list contents
· Asset Number—Number of the asset. Click the asset number to view detailed information about the asset.
· Asset Name—Name of the asset.
· Change Type—Change type of the asset software. Options are:
¡ Common Update
¡ Reinstall OS
¡ Other Update
· Change Contents—Content of the changed software. Options are:
¡ Computer Name
¡ Logical Disk
¡ Login Name
¡ Network Connections
¡ Operating System
¡ Partition
¡ Screen Saver
¡ Software
· Owner—Owner of the asset. Click the owner to view detailed information.
· Changed on—System time of the server when the asset software was changed.
· Details—To view detailed information about the asset software change, click
the Details icon ![]() .
.
Asset software change record details
The asset software change record details page has the following parameters:
· Login Name Change Information—Displayed only when the computer login name has changed. Operators can view computer login name change by comparing the new list with the old list.
· Computer Name Change Information—Displayed only when the computer name has changed. Operators can view computer name change by comparing the new list with the old list.
· Logical Disk Change Information—Displayed only when the logical disk name, description, file system, serial number, or total size has changed. Operators can view logical disk change by comparing the new list with the old list.
· Network Connection Change Information—Displayed only when the NIC serial number, IP address, DHCP status, gateway IP address, MAC address, or subnet mask has changed.
Make sure that the DAM service parameter Report Network Connection Changes is configured as Yes. Operators can view network configuration changes by comparing the new list with the old list.
· Operating System Change Information—Displayed only when the operating system name, version, service pack, installation time, or language has changed. Operators can view asset OS changes by comparing the new list with the old list.
· Screen Saver Change Information—Displayed only when the status of the screen saver (enable or disable), display of logon screen on resume (enabled or disabled), or the idle time length has changed. Operators can view screen saver changes on the asset by comparing the new list with the old list.
· Partition Change Information—Displayed only when the hard disk number, partition number, partition type, boot partition (yes or no), or partition capacity of the asset has changed. Operators can view partition changes by comparing the new list with the old list.
· Software Change Information—Displayed only when the name or software version installed on the asset has changed. Operators can view installed software changes on the asset by comparing the new list with the old list.
Viewing the asset software change record list
1. Click the User tab.
2. From the navigation tree, select Desktop Asset Manager > Asset Software Change.
The Asset Software Change Information list displays all asset software change records.
3. To sort the list, click one of the following column headings:
¡ Asset Number
¡ Asset Name
¡ Change Type
¡ Owner
¡ Changed on
Viewing the asset software change record details
1. Click the User tab.
2. From the navigation tree, select Desktop Asset Manager > Asset Software Change.
The asset software change information list displays all asset software change records.
3. For the asset software change information you want to view, click the Details icon ![]() .
.
The Asset Software Change Details page opens.
4. Click Back to return to the asset software change information list.
Querying the asset software change records
DAM allows operators to filter detailed asset software change records by using basic query mode or advanced query mode.
Basic query
1. Click the User tab.
2. From the navigation tree, select Desktop Asset Manager > Asset Software Change.
The asset software change information list displays all asset software change records.
3. At the upper right corner of the page, click Basic Query.
If Advanced Query is displayed at the upper right corner, you are already in basic query mode. Skip this step.
4. Specify one or more of the following query criteria:
¡ Asset Number—Enter a partial or complete asset number of the asset.
¡ Asset Name—Enter a partial or complete name of the asset.
¡ Changed from/to—Specify the time
range when the asset software was changed. You can enter the time range or
click the Calendar icon ![]() to bring up the
time control page and select the time range. The time range must be in the
format YYYY-MM-DD hh:mm:ss.
to bring up the
time control page and select the time range. The time range must be in the
format YYYY-MM-DD hh:mm:ss.
5. Click Query.
The asset software change information list displays all asset software change records matching the query criteria.
6. To clear the query criteria, click Reset.
The asset software change information list displays all software change records.
Advanced query
1. Click the User tab.
2. From the navigation tree, select Desktop Asset Manager > Asset Software Change.
The asset software change information list displays all asset software change records.
3. At the upper right corner of the page, click Advanced Query.
If Basic Query is displayed at the upper right corner, you are already in advanced query mode. Skip this step.
4. Enter or select one or more of the following query criteria:
¡ Asset Number—Enter a partial or complete asset number of the asset.
¡ Asset Name—Enter a partial or complete name of the asset.
¡ Owner—Enter a partial or complete owner of the asset.
¡ Software Name—Enter a partial or complete name of software.
¡ Change type—Select the change type from the following list:
- Common Update—Ordinary software changes on the asset, such as installing or uninstalling software, are categorized into this type. The iNode client collects and reports to DAM the asset software change information.
- Reinstall OS—All software information about the asset that the user re-registers through the iNode client. The user re-registers the asset only after its operating system is reinstalled. The iNode client re-collects and reports to DAM all the asset information.
- Other Update—Software changes that are not categorized into Common Update or Reinstall OS are categorized into Other Update, such as registering the asset on multiple DAMs.
¡ Group Name—To select an asset group
where the asset is located, click the Select Asset Group icon ![]() .
.
¡ Changed from/to—Specify the time
range when the asset software was changed. You can enter the time range or
click the Calendar icon ![]() to bring up the
time control page and select the time range. The time range must be in the
format YYYY-MM-DD hh:mm:ss.
to bring up the
time control page and select the time range. The time range must be in the
format YYYY-MM-DD hh:mm:ss.
5. Click Query.
The asset software change information list displays all asset software change records matching the query criteria.
6. To clear the query criteria, click Reset.
The asset software change information list displays all software change records.
USB file transfer log audit
DAM supports the USB file transfer log audit function. To use this function, operators must configure the USB storage device monitoring function in a peripheral policy, assign the policy to a desktop control scheme, and assign the desktop control scheme to the target asset or asset group.
The USB file transfer log audit function enables operators to view the time when a USB storage device was connected or disconnected, the logical drive letter of the USB storage device, and the contents written to the USB storage device. By default, monitoring records can be kept for 90 days before deletion. Operators can modify the record lifetime through the Life of Log parameter. For more information, see "DAM service parameters."
USB file transfer log list contents
· Asset Number—Asset number of the asset. Click the asset number to view detailed information about the asset.
· Asset Name—Name of the asset.
· Owner—Owner of the asset. Click the owner to view detailed information.
· Logic Drive—Logical drive letter of the USB storage device.
· USB Plugged (Server)—System time of the DAM server when the USB storage device was connected to the asset.
· USB Unplugged (Server)—System time of the DAM server when the USB storage device was disconnected from the asset.
· Details—To view detailed information about the USB monitoring record, click
the Details icon ![]() .
.
USB file transfer log details
The USB file transfer log details page has an Information of USB Copied Files area and a List of USB Copied Files area.
Information of USB copied files area
· Owner—Owner of the asset. Click the owner to view detailed information.
· Asset Name—Name of the asset.
· Asset Number—Asset number of the asset. Click the asset number to view detailed information about the asset.
· Logic Drive—Logical drive letter of the USB storage device.
· USB Plugged (Client)—System time of the client when the USB storage device was connected to the asset.
· USB Unplugged (Client)—System time of the client when the USB storage device was disconnected from the asset.
· USB Plugged (Server)—System time of the DAM server when the USB storage device was connected to the asset.
· USB Unplugged (Server)—System time of the DAM server when the USB storage device was disconnected from the asset.
· Number of Copied Files—Number of files copied to the USB storage device.
· Size of Copied Files (Byte)—Total size of files copied to the USB storage device, in bytes.
List of USB copied files area
· File Name—Name of the file copied to the USB storage device.
· Operation Type—Operation type of the file copied to the USB storage device, which can only be Write.
· File Size (Byte)—Total size of the file copied to the USB storage device, in bytes.
· Operation Time (Client)—System time of the client when the file was copied to the USB storage device.
· Operation Time (Server)—System time of the server when the file was copied to the USB storage device.
Viewing the USB file transfer log list
1. Click the User tab.
2. From the navigation tree, select Desktop Asset Manager > Desktop Control Audit > USB File Transfer.
The USB file transfer log list displays the USB file transfer logs of all assets.
3. To sort the list, click one of the following column headings:
¡ Asset Number
¡ Asset Name
¡ Owner
¡ USB Plugged (Server)
¡ USB Unplugged (Server)
Viewing the USB file transfer log details
1. Click the User tab.
2. From the navigation tree, select Desktop Asset Manager > Desktop Control Audit > USB File Transfer.
The USB file transfer log list displays the USB file transfer logs of all assets.
3. For the USB monitor log you
want to view, click the Details icon ![]() .
.
The USB File Transfer Details page opens.
4. Click Back to return to the USB file transfer log list.
5. Click Refresh to refresh the List of USB Copied Files.
6. To sort the list, click one of the following column headings:
¡ File Name
¡ Operation type
¡ File Size (Byte)
¡ Operation Time (Client)
¡ Operation Time (Server)
Querying the USB file transfer logs
DAM allows operators to filter USB file transfer logs using either basic or advanced query mode. The USB file transfer logs include the time when a USB storage device is connected or disconnected, and information about any files copied to the USB storage device.
Basic query
1. Click the User tab.
2. From the navigation tree, select Desktop Asset Manager > Desktop Control Audit > USB File Transfer.
The USB file transfer log list displays USB file transfer logs for all assets.
3. At the upper right corner of the page, click Basic Query.
If Advanced Query is displayed at the upper right corner of the page, you are already in basic query mode. Skip this step.
4. Specify one or more of the following query criteria:
¡ Asset Number—Enter a partial or complete asset number of the asset.
¡ Asset Name—Enter a partial or complete name of the asset.
¡ USB Plugged from/to—Specify the time
range when the USB storage device was connected to the asset. You can enter the
time range or click the Calendar icon ![]() to bring up the
time control page and select the time range. The time range must be in the
format YYYY-MM-DD hh:mm:ss.
to bring up the
time control page and select the time range. The time range must be in the
format YYYY-MM-DD hh:mm:ss.
5. Click Query.
The USB file transfer log list displays all USB file transfer logs matching the query criteria.
6. To clear the query criteria, click Reset.
The USB file transfer log list displays the USB file transfer logs of all assets.
Advanced query
1. Click the User tab.
2. From the navigation tree, select Desktop Asset Manager > Desktop Control Audit > USB File Transfer.
The USB file transfer log list displays USB file transfer logs for all assets.
3. At the upper right corner of the page, click Advanced Query.
If Basic Query is displayed at the upper right corner of the page, you are already in advanced query mode. Skip this step.
4. Specify one or more of the following query criteria:
¡ Asset Number—Enter a partial or complete asset number of the asset.
¡ Asset Name—Enter a partial or complete name of the asset.
¡ Owner—Enter a partial or complete name of the asset owner.
¡ File Name—Enter the name of the file copied to the USB storage device.
¡ USB Plugged from/to—Specify the time
range when the USB storage device was connected to the asset. You can enter the
time range or click the Calendar icon ![]() to bring up the
time control page and select the time range. The time range must be in the
format YYYY-MM-DD hh:mm:ss.
to bring up the
time control page and select the time range. The time range must be in the
format YYYY-MM-DD hh:mm:ss.
¡ Minimum File Size—Enter the minimum size, in bytes, of a file copied to the USB storage device. The USB file transfer logs filter out any files smaller than this minimum value.
5. Click Query.
The USB file transfer log list displays all USB file transfer logs matching the query criteria.
6. To clear the query criteria, click Reset.
The USB file transfer log list displays the USB file transfer logs of all assets.
Exporting USB file transfer logs
DAM supports exporting USB file transfer logs. By default, USB file transfer logs are kept for 90 days. When the record lifetime expires, DAM automatically deletes the records. To prevent records being deleted after this period, operators can modify the Life of Log parameter.
Operators can also save USB file transfer logs by exporting them manually or automatically. This information shows how to manually export the USB file transfer logs. For more information, see "Managing export tasks."
USB file transfer log export history list contents
· Export File Name—Name of the file that stores the export results. The file-name extension must be .zip.
· Export File Path—Path of the export file. The export file is located in the installation path of IMC. In distributed deployment, the export file is located in the IMC installation path on the master server.
· Operator—Name of the operator who exported the USB file transfer logs.
· Exported at—Time when the USB file transfer logs were exported.
· Download File—To save the export results, click Download.
· Delete—To delete the export history of the USB file transfer logs, click the
Delete icon ![]() .
.
Exporting USB file transfer records
1. Click the User tab.
2. From the navigation tree, select Desktop Asset Manager > Desktop Control Audit > USB File Transfer.
The USB file transfer log list displays the USB file transfer logs of all assets.
3. Click Export.
The Exporting File Format page opens.
4. Select the export file attributes:
¡ File Type—Select the file format in which to export USB file transfer logs. Options are TXT and CSV.
¡ File Column Separator—If the export file is in TXT format, select the separator for the text file. Options are space, tab, comma (,), colon (:), pound sign (#), and dollar sign ($).
5. Click OK.
The Result of exporting USB File transfer page opens.
6. Click Download to save the export results.
7. Click Back to return to the USB file transfer log list.
Viewing the USB file transfer log export history
DAM supports viewing the export history of the USB file transfer logs. Each time the USB file transfer logs are exported manually, DAM automatically generates an export history record. Operators can download the export results or delete the export history.
To view the export history of USB file transfer logs:
1. Click the User tab.
2. From the navigation tree, select Desktop Asset Manager > Desktop Control Audit > USB File Transfer.
The USB file transfer log list displays USB file transfer logs of all assets.
3. Next to the USB file transfer log list, click Export History.
The Export History page opens.
4. Click Back to return to the USB file transfer log list.
Printer use log audit
DAM supports the printer use log audit function. To use this function, operators must configure the printer use log audit function in a peripheral policy, assign the policy to a desktop control scheme, and assign the desktop control scheme to the target asset or asset group.
The printer use log audit function enables operators to view the name and number of printed pages for each printed file. By default, printer use logs are kept for 90 days before deletion. Operators can modify the log lifetime through the Life of Log parameter. For more information about modifying the log lifetime, see "DAM service parameters."
Printer use log list contents
· Asset Number—Asset number of the asset. To view detailed information about the asset, click the asset number.
· Asset Name—Name of the asset.
· Owner—Owner of the asset. Click the owner to view detailed information.
· Printer Name—Name of the printer.
· File Name—Name of the printed file.
· Printed Pages—Number of pages in the printed file.
· Report Time—Time when the DAM server received the file printing message from the asset.
· Share Printer—Indicates whether the file was printed on a shared printer.
· Details—To view detailed information about the printer use log, click the Details
icon ![]() .
.
Printer use log details
The printer use log details page has the following parameters:
· Asset Number—Asset number of the asset. To view detailed information about the asset, click the asset number.
· Asset Name—Name of the asset.
· Owner—Owner of the asset. Clickthe owner to view detailed information.
· Printer Name—Name of the printer.
· Share Printer—Indicates whether the file was printed on a shared printer.
· File Name—Name of the printed file.
· Name of the Computer Initiating Printing—Computer name of the asset where the shared printer is located. This option is displayed only when a shared printer is used for printing.
· Asset Number of the Computer Initiating Printing—Asset number of the asset where the shared printer is located. This option is displayed only when the file is printed by a shared printer.
· Owner of the Computer Initiating Printing—Owner of the asset where the shared printer is located. This option is displayed only when the file is printed by a shared printer.
· Print Time—System time of the client when the printer was used.
· Report Time—System time of the DAM server when the printer was used.
· File Total Pages—Total pages of the printed file.
· Printed Pages—Number of pages that were printed.
· File Total Size—Total size of the printed file, in bytes.
· Printed Size—Size of the printed data, in bytes.
· Driver Info.—Driver information of the printer.
· Port—Computer port that the printer is connected to.
Viewing the printer use log list
1. Click the User tab.
2. From the navigation tree, select Desktop Asset Manager > Desktop Control Audit > Printer Use.
The printer use log list displays printer use logs of all assets.
3. To sort the list, click one of the following column headings:
¡ Asset Number
¡ Asset Name
¡ Owner
¡ Printer Name
¡ File Name
¡ Printed Pages
¡ Report Time
¡ Share Printer
Viewing the printer use log details
To view the printer use log details:
1. Click the User tab.
2. From the navigation tree, select Desktop Asset Manager > Desktop Control Audit > Printer Use.
The printer use log list displays the printer use logs of all assets.
3. For the printer use
log you want to view, click the Details icon ![]() .
.
The Printer Monitor Details page opens.
4. Click Back to return to the printer use log list.
Querying the printer use logs
DAM allows operators to filter printer use logs using either basic or advanced query mode. The printer use logs include information about printer use by assets.
Basic query
1. Click the User tab.
2. From the navigation tree, select Desktop Asset Manager > Desktop Control Audit > Printer Use.
The printer use log list displays the printer use logs of all assets.
3. At the upper right corner of the page, click Basic Query.
If Advanced Query is displayed at the upper right corner of the page, you are already in basic query mode. Skip this step.
4. Specify one or both of the following query criteria:
¡ Asset Name—Enter a partial or complete name of the asset.
¡ Asset Number—Enter a partial or complete asset number of the asset.
5. Click Query.
The printer use log list displays all printer use logs matching the query criteria.
6. To clear the query criteria, click Reset.
The printer use log list displays the printer use logs of all assets.
Advanced query
1. Click the User tab.
2. From the navigation tree, select Desktop Asset Manager > Desktop Control Audit > Printer Use.
The printer use log list displays printer use logs of all assets.
3. At the upper right corner of the page, click Advanced Query.
If Basic Query is displayed at the upper right corner of the page, you are already in advanced query mode. Skip this step.
4. Specify one or more of the following query criteria:
¡ Asset Name—Enter a partial or complete name of the asset.
¡ Asset Number—Enter a partial or complete asset number of the asset.
¡ Owner—Enter a partial or complete name of the asset owner.
¡ File Name—Enter the name of the printed file, which must be exactly the same as that in the Windows printer task list.
¡ Name of the Computer Initiating Printing—Enter a partial or complete name of the computer where the shared printer is located. If the file was not printed on a shared printer, this field is empty.
¡ Asset Number of the Computer Initiating Printing—Enter a partial or complete asset number of the asset where the shared printer is located. If the file was not printed on a shared printer, this field is empty.
¡ Report Time from/to—Specify the time
range when the printer use log was reported. You can enter the time range or
click the Calendar icon ![]() to bring up the
time control page and select the time range. The time range must be in the
format YYYY-MM-DD hh:mm:ss.
to bring up the
time control page and select the time range. The time range must be in the
format YYYY-MM-DD hh:mm:ss.
¡ Printer Name—Enter a partial or complete name of the printer.
¡ Share Printer—Select whether the printer is a shared printer.
¡ Printed Pages from/to—Enter the range of pages of the printed file.
¡ Printed Size from/to—Enter the data size of the printed file.
¡ Port—Enter the port of the computer that the printer is connected to.
¡ Driver Info.—Enter the driver information of the printer.
5. Click Query.
The printer use log list displays all printer use logs matching the query criteria.
6. To clear the query criteria, click Reset.
The printer use log list displays the printer use logs of all assets.
Exporting the printer use logs
DAM supports exporting printer use logs. By default, the printer use logs are kept for 90 days. When the log lifetime expires, DAM automatically deletes the logs. Operators can modify the log lifetime through the Life of Log parameter. Operators can also save printer use logs by exporting them.
To export printer use logs:
1. Click the User tab.
2. From the navigation tree, select Desktop Asset Manager > Desktop Control Audit > Printer Use.
The printer use log list displays the printer use logs of all assets.
3. Click Export.
The Exporting File Format page opens.
4. Select the export file attributes:
¡ File Type—Select the format of the file you want to export printer use logs to. Options are TXT and CSV.
¡ File Column Separator—If the export file is in TXT format, select the separator for the text file. Options are space, tab, comma (,), colon (:), pound sign (#), and dollar sign ($).
5. Click OK.
The Result of exporting printer use page opens.
6. Click Download to save the export results.
7. Click Back to return to the printer use log list.
Viewing the export history of the printer use logs
DAM supports viewing the export history of printer use logs. Each time the printer use logs are exported, DAM automatically generates an export history record. Operators can download the export results or delete the export history.
To view the export history of printer use logs:
1. Click the User tab.
2. From the navigation tree, select Desktop Asset Manager > Desktop Control Audit > Printer Use.
The printer use log list displays the printer use logs of all assets.
3. Next to the printer use log list, click Export History.
The Export History page opens.
4. Click Back to return to the printer use log list.
Printer use logs export history list contents
· Export File Name—Name of the file that stores the export results. The file-name extension must be .zip.
· Export File Path—Path of the export file. The export file is located in the installation path of IMC. In distributed deployment, the export file is located in the IMC installation path on the master server.
· Operator—Name of the operator who exported the printer use logs.
· Content Exported—Content description of the exported file.
· Exported at—Time and date when the printer monitoring records were exported.
· Download File—To save the export results, click Download.
· Delete—To delete the export history of the printer use logs, click the Delete
icon ![]() .
.
Unauthorized peripheral use record audit
DAM supports the unauthorized peripheral use record audit function. To use this function, operators must configure the unauthorized peripheral items in a peripheral policy, assign the policy to a desktop control scheme, and assign the desktop control scheme to the target asset or asset group.
The unauthorized peripheral use record audit function enables operators to view the type of unauthorized peripherals, time, asset owner, and the unauthorized desktop control scheme. By default, the unauthorized peripheral use records are kept for 90 days. Operators can modify the record lifetime through the Life of Log parameter. For more information about modifying the record lifetime, see "DAM service parameters."
Unauthorized peripheral use list contents
· Asset Number—Asset number of the asset. Click the asset number. to view detailed information about the asset.
· Asset Name—Name of the asset.
· Owner—Owner of the asset. Click the owner to view detailed information.
· Device Type—Types of unauthorized peripheral types. Options are:
¡ DVD/CD-ROM
¡ FloppyDisk
¡ Modem
¡ COM/LPT
¡ 1394
¡ USB
¡ Infrared
¡ Bluetooth
¡ PCMCIA
· Operation Time (Server)—Time when the DAM server detected the unauthorized peripheral use.
· Description—Description of the unauthorized devices.
· Disable Result—Indicates whether the authorized devices are disabled.
· Details— To view detailed information about the unauthorized peripheral use
record, click the Details icon ![]() .
.
Unauthorized peripheral use log export history list contents
· Export File Name—Name of the export that stores the export results. The file-name extension must be .zip.
· Export File Path—Path of the export file. The export file is located in the installation path of IMC. In distributed deployment, the export file is located in the IMC installation path on the master server.
· Operator—Name of the operator who exported the unauthorized peripheral use logs.
· Content Exported—Content description of the exported file.
· Exported at—Time and date when the unauthorized peripheral use logs were exported.
· Download File—To save the export results, click Download.
· Delete—To delete the export history of the unauthorized peripheral use logs, click the Delete
icon ![]() .
.
Viewing the unauthorized peripheral use record list
1. Click the User tab.
2. From the navigation tree, select Desktop Asset Manager > Desktop Control Audit > Peripheral Use.
The unauthorized peripheral use list displays the unauthorized peripheral use records of all assets.
3. To sort the list, click one of the following column headings:
¡ Asset Number
¡ Asset Name
¡ Owner
¡ Device Type
¡ Operation Time (Server)
¡ Description
¡ Disable Result
Viewing the export history of unauthorized peripheral use records
DAM supports viewing the export history of unauthorized peripheral use records. Each time the unauthorized peripheral use records are manually exported, DAM automatically generates an export history record. Operators can download the export results and delete the export history.
To view the export history of unauthorized peripheral use records:
1. Click the User tab.
2. From the navigation tree, select Desktop Asset Manager > Desktop Control Audit > Peripheral Use.
The unauthorized peripheral use list displays unauthorized peripheral use records of all assets.
3. Next to the unauthorized peripheral use list, click the Export History.
The Export History page opens.
4. View the unauthorized peripheral use log export history list.
5. Click Back to return to the unauthorized peripheral use list.
Querying the unauthorized peripheral use records
DAM allows operators to filter unauthorized peripheral use records by using basic or advanced query mode. The unauthorized peripheral use records include the use of peripherals by assets.
Basic query
1. Click the User tab.
2. From the navigation tree, select Desktop Asset Manager > Desktop Control Audit > Peripheral Use.
The unauthorized peripheral use list displays the unauthorized peripheral use records of all assets.
3. At the upper right corner of the page, click Basic Query.
If Advanced Query is displayed at the upper right corner of the page, you are already in basic query mode. Skip this step.
4. Specify one or both of the following query criteria:
¡ Asset Number—Enter a partial or complete asset number of the asset.
¡ Owner—Enter a partial or complete name of the asset owner.
5. Click Query.
The unauthorized peripheral use list displays all unauthorized peripheral use records matching the query criteria.
6. To clear the query criteria, click Reset.
The unauthorized peripheral use list displays the unauthorized peripheral use records of all assets.
Advanced query
1. Click the User tab.
2. From the navigation tree, select Desktop Asset Manager > Desktop Control Audit > Peripheral Use.
The unauthorized peripheral use list displays the unauthorized peripheral use records of all assets.
3. At the upper right corner of the page, click Advanced Query.
If Basic Query is displayed at the upper right corner of the page, you are already in advanced query mode. Skip this step.
4. Specify one or more of the following query criteria:
¡ Asset Number—Enter a partial or complete asset number of the asset.
¡ Asset Name—Enter a partial or complete name of the asset.
¡ Owner—Enter a partial or complete name of the asset owner.
¡ Group Name—To select the asset group
where the asset is located, click the Select Asset Group icon ![]() .
.
¡ Operation Time (Server) from/to—Specify
the time range when the unauthorized peripheral use record was reported. You
can enter the time range or click the Calendar icon
![]() to
bring up the time control page and select the time range. The time range must
be in the format YYYY-MM-DD hh:mm:ss.
to
bring up the time control page and select the time range. The time range must
be in the format YYYY-MM-DD hh:mm:ss.
¡ Peripheral Policy—Select the peripheral policy that was violated.
¡ Device Type—Select the type of the peripheral device. Options are:
- DVD/CD-ROM
- FloppyDisk
- Modem
- COM/LPT
- 1394
- USB
- Infrared
- Bluetooth
- PCMCIA
¡ Device Instance Path—Enter a partial or complete device instance path of the peripheral device.
5. Click Query.
The unauthorized peripheral use list displays all unauthorized peripheral use records matching the query criteria.
6. To clear the query criteria, click Reset.
The unauthorized peripheral use list displays the unauthorized peripheral use records of all assets.
Exporting the unauthorized peripheral use records
DAM supports exporting unauthorized peripheral use records. By default, the unauthorized peripheral use records are kept for 90 days. When the record lifetime expires, DAM automatically deletes the records. Operators can:
· Modify the record lifetime through the Life of Log parameter.
· Save unauthorized peripheral use records by exporting them.
To export unauthorized peripheral use records:
1. Click the User tab.
2. From the navigation tree, select Desktop Asset Manager > Desktop Control Audit > Peripheral Use.
The unauthorized peripheral use list displays the unauthorized peripheral use records of all assets.
3. Click Export.
The Exporting File Format page opens.
4. Select the export file attributes:
¡ File Type—Select the format of the file you want to export unauthorized peripheral use records to. Options are TXT and CSV.
¡ File Column Separator—If the export file is in TXT format, select the separator for the text file. Options are space, tab, comma (,), colon (:), pound sign (#), and dollar sign ($).
5. Click OK.
The Result of exporting unauthorized peripheral use report page opens.
6. To save the export results, click Download.
7. Click Back to return to the unauthorized peripheral use list.
Terminal file audit
DAM supports the terminal file audit function to show whether a terminal asset contains specified files in real time. DAM creates and immediately executes an audit task for each terminal file audit operation, and allows operators to view or export the audit results.
Asset file check list contents
· Asset Number—Asset number of the asset. To view detailed information about the asset, click the asset number.
· Group Name—Group that the asset belongs to.
· Owner—Owner of the asset. To view detailed information, click the owner.
· File Name Includes—Check path of the audit task.
· Check Time—Time when the audit task was created.
· Status—Current status of the audit task.
· Export—To export the audit results of the terminal file audit task, click the
Export icon ![]() .
.
· Details—To view detailed information about terminal file audit task, click the
Details icon ![]() .
.
Asset file check list details
The asset file check list details page has a Basic Information area and a File List area.
Basic Information area
· Asset Number—Asset number of the asset.
· Asset Name—Name of the asset.
· Asset User—User of the asset.
· Report Time—Time when the audit results of the terminal file were submitted to the DAM server.
· Owner—Owner of the asset.
· Check Time—Time when the audit task was created.
· Status—Status of the audit task:
¡ Reported—The audit task is complete and the audit result has been submitted to the DAM server.
¡ Not Reported—The audit result has not been submitted to the DAM server.
· Check Files in—Absolute path of the check files in the audit task list. The file path includes the directory and all subdirectories, which must end with a backslash (\).
· File Name Includes—Name of the audited file. The file name can contain the wildcard characters asterisk (*) or question mark (?). An asterisk can match zero or more characters. If a question mark is placed:
¡ After the dot (.), it can match only one character.
¡ Before the dot (.), it can match all characters except the dot.
· Description—Description of the audit task.
File List area
· File Name—Name of the file.
· File Path—Absolute path of the file.
· File Size—Size of the file, in bytes.
Viewing the terminal file audit task list
1. Click the User tab.
2. From the navigation tree, select Desktop Asset Manager > Desktop Control Audit > Asset File Check.
The asset file check list displays the terminal file audit tasks of all assets.
3. To sort the list, click one of the following column headings:
¡ Asset Number
¡ Group Name
¡ Owner
¡ File Name Includes
¡ Check Time
¡ Status
Querying terminal file audit tasks
Operators can filter terminal file audit tasks through a query.
To query terminal file audit tasks:
1. Click the User tab.
2. From the navigation tree, select Desktop Asset Manager > Desktop Control Audit > Asset File Check.
The asset file check task list displays the terminal file audit tasks of all assets.
3. Specify or select one or more of the following query criteria:
¡ Asset Number—Enter a partial or complete asset number of the asset.
¡ Owner—Enter a partial or complete owner of the asset.
¡ Check Time from/to—Specify the time
range when the terminal file audit task was performed. You can enter a time
range, or click the Calendar icon ![]() to bring up the
time control page and select the time range. The time range must be in the
format YYYY-MM-DD hh:mm:ss.
to bring up the
time control page and select the time range. The time range must be in the
format YYYY-MM-DD hh:mm:ss.
4. Click Query.
The asset file check task list displays all terminal file audit tasks matching the query criteria.
5. To clear the query criteria, click Reset.
The asset file check task list displays the terminal file audit tasks of all assets.
Auditing the terminal files
1. Click the User tab.
2. From the navigation tree, select Desktop Asset Manager > Desktop Control Audit > Asset File Check.
The asset file check task list displays the terminal file audit tasks of all assets.
3. Click Audit.
The Audit page opens.
4. Select the asset whose terminal files you want to audit:
a. Click Select Asset.
The asset list dialog box opens.
b. Filter assets through a basic or advanced query.
The Query Asset feature is displayed above the asset list. The Advanced Query link is a toggle between Basic Query and Advanced Query. When the link is Advanced Query, then you are in basic query mode, and vice versa.
Specify one or more of the following query criteria:
- Asset Number—Enter a partial or complete asset number of the asset.
- Asset Name—Enter a partial or complete name of the asset.
- Owner—Enter a partial or complete name of the asset owner.
- Group Name—Click
the Select Asset Group
icon ![]() to
select an asset group. In the Select Asset Group page that opens, select a group and click OK.
to
select an asset group. In the Select Asset Group page that opens, select a group and click OK.
- Operating System—Enter a partial or complete name of the operating system. This field is available only for advanced queries.
- Operating System Language—Select the operating system language: Chinese (PRC) or English. This field is available only for advanced queries.
- Operating System Patch—Enter the version of the service pack of the operating system, such as Service Pack 3. This field is available only for advanced queries.
c. Click Query.
d. Select the asset you want to add in the asset list.
e. Click OK.
The selected asset is added to the Asset Number field.
5. Enter the following parameters for the audit task:
¡ Check Files in—Enter the absolute path of the files you want to check.
¡ File Name Includes—Enter a partial or complete file name. The file name can contain the wildcard characters asterisk (*) or question mark (?). An asterisk can match zero or more characters. If a question mark is placed:
- After the dot (.), it can match only one character.
- Before the dot (.), it can match all characters except the dot.
¡ Description—Enter the description of the audit.
6. Click Start.
Viewing the terminal file audit results
1. Click the User tab.
2. From the navigation tree, select Desktop Asset Manager > Desktop Control Audit > Asset File Check.
The asset file check task list displays the terminal file audit tasks of all assets.
3. To view detailed information for a terminal file audit, click the Details icon ![]() .
.
The asset file check task list page opens.
4. Click Back to return to the asset file check task list.
5. To save the audit results, click Export.
Exporting the terminal file audit results
1. Click the User tab.
2. From the navigation tree, select Desktop Asset Manager > Desktop Control Audit > Asset File Check.
The asset file check task list displays the terminal file audit tasks of all assets.
3. In the asset file
check task list, for the terminal
file audit result you want to export click the Export icon ![]() .
.
The Exporting File Format page opens.
4. From the File Format list, select a format for the export file. Options are TXT and CSV.
TXT indicates that the terminal file audit results
are exported to the text file of the *.txt type. CSV indicates
that the terminal file audit result is exported to the text file of the *.csv type.
5. For the terminal file audit results that are exported to the text file of *.txt type, select the separator. Options are space, tab, comma (,), colon (:), pound sign (#), and dollar sign ($).
6. Click OK.
After the operation is complete, the Export Result page opens.
7. Click Download to save the export results.
Configuring software deployment
The software deployment function allows operators to batch deploy the same software product to multiple assets.
Preparing to use the software deployment function
To use this function, complete the following tasks:
1. Set up a software deployment server, which can be a HTTP, FTP, or file share server. The server must be properly configured to allow assets to download software.
2. Add the server settings (such as the IP address, port, and username/password) to DAM.
3. Configure a software deploy task in DAM. The task settings include the software deployment server, name and version of the software to be deployed, download path, installation mode, and deployment target (individual assets or asset groups).
DAM sends the software deploy task to the iNode client for execution. Then as specified in the task, the iNode client downloads and installs software from the software deployment server.
Configuring software deployment server settings
DAM supports the following types of software deployment servers:
· HTTP
· FTP
· File share
Operators can add the server settings to DAM for management.
Software server settings list contents
· Server Name—Name of the software deployment server. Click the name to view detailed information.
· Deployment Method—Software deployment method:
¡ HTTP
¡ FTP
¡ Share File
· IP Address—IP address of the software deployment server.
· Modify—To modify the server settings, click the Modify
icon ![]() .
.
· Delete—To delete the server settings, click the Delete
icon ![]() .
.
Software deployment server settings details
The software deployment server settings details page has the following parameters:
· Server Name—Name of the software deployment server.
· Deployment Method—Software deployment method: HTTP, FTP, or Share File.
When the deployment method is HTTP, the page also has the following parameter:
¡ Port Number—Listening port of the HTTP server, 80 by default.
When the deployment method is FTP, the page also has the following parameters:
¡ Port Number—Listening port of the FTP server, 21 by default.
¡ Transmission Mode—FTP transfer mode to use when a firewall or NAT device exists between the FTP server and the iNode client. The value can be PORT or PASV.
- PORT—When the FTP server is protected by a firewall or NAT device, select the PORT mode.
- PASV—When the iNode client is protected by a firewall or NAT device, select the PASV mode.
¡ Anonymous User—Indicates whether to allow anonymous login to the FTP server.
¡ User Name—User name used to access the FTP server. This field is displayed only when Anonymous User is set to No.
When the deployment method is Share File, the page also has the following parameters:
¡ Anonymous User—Indicates whether to allow anonymous login to the file share server.
¡ User Name—The user name used to access the file share server, in the format prefix\user ID. If the software deployment server has
- Been assigned to a domain, use the domain name as the prefix.
- Not been assigned to a domain, use the computer name as the prefix.
This parameter is displayed only when Anonymous User is set to No.
· IP Address—IP address of the software deployment server.
Viewing the software deployment server settings list
1. Click the User tab.
2. From the navigation tree, select Desktop Asset Manager > Software Server Settings.
The software server setting list displays all software deployment server settings.
3. To refresh the software server setting list, click Refresh.
4. To sort the software server setting list, click the column heading Server Name, Deployment Method, or IP Address.
Viewing software deployment server settings details
1. Click the User tab.
2. From the navigation tree, select Desktop Asset Manager > Software Server Settings.
The software server setting list displays all software deployment server settings.
3. To view detailed settings, click the name of the software deployment server.
The Software Server Settings Details page opens.
4. Click Back to return to the software server setting list.
Adding software deployment server settings
1. Click the User tab.
2. From the navigation tree, select Desktop Asset Manager > Software Server Settings.
The software server setting list displays all software deployment server settings.
3. Click Add.
The Add Software Server Settings page opens.
4. Configure basic server information.
5. Configure parameters related to the deployment method.
Modifying software deployment server settings
1. Click the User tab.
2. From the navigation tree, select Desktop Asset Manager > Software Server Settings.
The software server settings list displays all software deployment server settings.
3. For the software
deployment server settings you want to modify, click the Modify
icon ![]() .
.
The Modify Software Server Settings page opens.
4. Modify basic server settings.
5. Modify parameters related to the deployment method.
6. Click OK.
Deleting software deployment server settings
If a server name is selected for a software deploy task, you cannot delete the settings of the software deployment server. To delete server settings, you must first delete all software deploy tasks that use the server. For more information about deleting software deploy tasks, see "Deleting software deploy tasks."
To delete software deployment server settings:
1. Click the User tab.
2. From the navigation tree, select Desktop Asset Manager > Software Server Settings.
The software server settings list displays all software deployment server settings.
3. For the software deployment server settings you want to delete,
click the Delete icon ![]() .
.
A confirmation dialog box opens.
4. Click OK.
Configuring software deploy tasks
Operators must first add software deployment server settings before they can create software deploy tasks. Software deploy task settings include the software deployment server, name and version of the software to be deployed, download path, installation mode, and deployment target (assets or asset groups). The task is sent to the iNode client for execution, which downloads and installs the software from the software deployment server as specified in the task.
Operators can query, add, modify, and delete software deploy tasks.
Software deploy task list contents
· Task Name—Name of the software deploy task. Click the name to view detailed information.
· Created at—Time when the task was created.
· Software Name—Name of the software to be deployed in the task.
· Server Name—Name of the software deployment server used in the task.
· Installation Type—The type of installation:
¡ Quiet Installation—Installs software automatically after it is downloaded without any user intervention. Before selecting this installation type, make sure that the software supports quiet installation. When quiet installation is complete, the iNode client can display a task message.
¡ Interactive Installation—Interacts with the user to obtain the necessary information such as the download path and serial number for installation. When software requiring an interactive installation is downloaded, the iNode client can display a task message.
¡ Portable Software—Requires no installation and allows the user to use the software immediately after it is downloaded and decompressed. When portable software is downloaded, the iNode client can display a task message.
· Modify— To modify the task settings, click the Modify
icon ![]() .
.
Software deploy task details
The software deploy task details page has a Basic Information area and a Software Deployment Targets area.
Basic Information area
· Task Name—Name of the software deploy task. This name must be unique in DAM.
· Software Server—Name of the software deployment server. Click the name to view detailed server settings.
· Task Message—Prompt message that the iNode client displays when a quiet software installation or a software download process is complete.
· Created at—Time when the software deploy task was created.
· Execution Time—Time when the software deploy task is to be executed.
· Download Delay—Time delay for the software deploy task, in minutes. To avoid massive downloading from the server at the same time, this parameter allows the iNode client to download software after a random interval between 0 and the specified Download Delay value.
· Software Name—Name of the software to be deployed in the software deploy task. The name of the software to be deployed must be the same as that in the Add or Remove Programs tool of the Windows Control Panel. This field is available only when the Installation Type is set to Quiet Installation or Interactive Installation.
· Software Version—Version of the software to be deployed in the software deploy task. The version must be the same as that in the Add or Remove Programs tool of the Windows Control Panel. This field is available only when the Installation Type is set to Quiet Installation or Interactive Installation.
· Execute Task—When the software deploy task is executed:
¡ Execute Immediately—Task starts immediately after the configuration is complete.
¡ Later—Task starts at a specified time after the configuration is complete.
· Test Method—Select Test Method to test whether the software download path is valid.
· Installation Type—The type of installation:
¡ Quiet Installation—Installs software automatically after it is downloaded without any user intervention. Before selecting this installation type, make sure that the software supports quiet installation. When quiet installation is complete, the iNode client can display a task message.
¡ Interactive Installation—Interacts with the user to obtain the necessary information such as the download path and serial number for installation. When software requiring an interactive installation is downloaded, the iNode client can display a task message.
¡ Portable Software—Requires no installation and allows the user to use the software immediately after it is downloaded and decompressed. When portable software is downloaded, the iNode client can display a task message.
· Software Name and Path—Download path and source file name of the software:
¡ For an HTTP server, the value is in the following format:
http://<IP address>:<Port>/<Path>/<Software name>
For example:
http://192.168.10.1:80/tools/MD5.exe
¡ For an FTP server, the value is in the following format:
http://<IP address>:<Port>/<Path>/<Software name>
For example:
ftp://192.168.10.1:21/tools/MD5.exe
¡ For a file-share server, the value is in the following format:
\\<IP address>\<Path>\<Software name>
For example:
\\192.168.10.1\tools\MD5.exe
· CLI Parameters—Enter the CLI script to perform a quiet software installation. This field is available only when the Installation Type is set to Quiet Installation.
· Setup File—How the setup file is handled after the software installation process is complete, which can be Deleted after Installation or Kept after Installation. This parameter is available only when the Installation Type is set to Quiet Installation or Interactive Installation.
¡ Deleted after Installation—After the software installation process is complete, the setup file is automatically deleted.
¡ Kept after Installation—After the software installation process is complete, the setup file is kept.
Software Deployment Targets area
The deployment targets include asset groups and individual assets. For a target asset group, the software is downloaded to and installed on all assets in the asset group.
Deploy group list contents
· All Asset Groups—Name of the asset group.
¡ To
expand all asset groups, click the Expand All icon ![]() .
.
¡ To
collapse all asset groups, click the Collapse All
icon ![]() .
.
¡ When
the group name carries an icon ![]() on the left, the
group has subgroups.
on the left, the
group has subgroups.
To view software deployment information of the subgroups, click the icon ![]() .
.
¡ To display the asset group details page, click the group name.
· Success Downloads—Number of assets in the asset group that have successfully downloaded the software.
· Total Deployed—Number of assets in the asset group that are required to download the software.
· Details—To view the deploy task status of all assets in the asset group,
click the Details icon ![]() .
.
Deploy asset list contents
· Asset Number—Asset number of the asset. To view detailed information, click the asset number.
· Asset Name—Name of the asset.
· Group Name—Name of the group the asset belongs to. To display the asset group details page, click the group name.
· Asset Owner—Owner of the asset.
· Task Status—Execution status of the task, which can be:
¡ Not Executed
¡ Deployment Succeeded
¡ Deployment Failed
¡ Download Succeeded
¡ Download Failed
To view the task execution result for the asset, click the content of this field.
When you click the content in the Task Status field for an asset in the Deploy Group List area, you can view the list of all assets in the group.
· Redeploy—To deploy the task again, click the Redeploy
![]() icon. This field is available only when the task status of the
asset is Download Failed.
icon. This field is available only when the task status of the
asset is Download Failed.
Task execution result details
The task execution result details page has the following parameters:
· Task Name—Name of the software deploy task.
· Task Status—Execution status of the task:
¡ Not Executed
¡ Deployment Succeeded
¡ Deployment Failed
¡ Download Succeeded
¡ Download Failed
· Asset Name—Name of the asset.
· Asset Number—Asset number of the asset.
· Asset Owner—Owner of the asset.
· Asset Group—Asset group to which the asset belongs.
· Execution Time—Time when the software deploy task started.
· Finish Time—Time when the software deploy task finished. This field is available only when the task status of the asset is Download Succeeded or Download Failed.
Viewing the software deploy task list
1. Click the User tab.
2. From the navigation tree, select Desktop Asset Manager > Software Deploy Task.
The software deploy task list displays all software deploy tasks.
To refresh the software deploy task list, click Refresh.
3. To sort the software deploy task list, click the column heading Task Name, Created at, Software Name, or Server Name.
Viewing software deploy task details
1. Click the User tab.
2. From the navigation tree, select Desktop Asset Manager > Software Deploy Task.
The software deploy task list displays all software deploy tasks.
3. Click the name for the software deploy task you want to view.
The software deploy task details page opens.
4. To view a list of all assets in a group, in
the Deploy Group List area for the asset group click
the Details icon ![]() .
.
5. Click Back to return to the software deploy task list.
Querying software deploy tasks
DAM allows operators to filter software deploy tasks using basic or advanced query mode
· Basic query criteria include several key parameters for quick search.
· Advanced query offers various query criteria for a precise match.
Basic query
1. Click the User tab.
2. From the navigation tree, select Desktop Asset Manager > Software Deploy Task.
The software deploy task list displays all software deploy tasks.
3. At the upper right corner of the page, click Basic Query.
If Advanced Query is displayed at the upper right corner of the page, you are already in basic query mode. Skip this step.
4. Specify one or more of the following query criteria:
¡ Task Name—Enter a partial or complete software deploy task name.
¡ Asset Number—Enter a partial or complete asset number, which uniquely identifies an asset in DAM. All tasks that include the asset as the deployment target are queried.
¡ Group Name—Click the Select Asset Group icon ![]() . The Select Asset Group page opens.
Select a group and click OK. The Group Name field is automatically populated with the
selected asset group.
. The Select Asset Group page opens.
Select a group and click OK. The Group Name field is automatically populated with the
selected asset group.
¡ Software Name—Enter a partial or complete name of the software deployed in the task.
Empty fields are ignored.
5. Click Query.
The software deploy task list displays all software deploy tasks that match the query criteria.
6. To clear the query criteria, click Reset.
The software deploy task list displays all software deploy tasks.
Advanced query
1. Click the User tab.
2. From the navigation tree, select Desktop Asset Manager > Software Deploy Task.
The software deploy task list displays all software deploy tasks.
3. At the upper right corner of the page, click Advanced Query.
If Basic Query is displayed at the upper right corner of the page, you are already in advanced query mode. Skip this step.
4. Enter or select one or more of the following query criteria:
¡ Task Name—Enter software deploy task name. Empty fields are ignored.
¡ Asset Number—Enter.asset number. Empty fields are ignored. All tasks that include the asset as the deployment target are queried.
¡ Created From/To—Specify the time
range when the software deploy task was created. You can click the Select Date and Time icon ![]() to select the date and time or manually enter the value in
YYYY-MM-DD format.
to select the date and time or manually enter the value in
YYYY-MM-DD format.
¡ Group Name—Click the Select Asset Group icon![]() . The Select Asset Group page opens.
Select a group and click OK. The Group Name field is automatically populated with the
selected asset group.
. The Select Asset Group page opens.
Select a group and click OK. The Group Name field is automatically populated with the
selected asset group.
¡ Server Name—Enter the name of the software deployment server.
¡ Software Name—Enter a partial or complete name of the software deployed in the task.
Empty fields are ignored.
5. Click Query.
The software deploy task list displays all software deploy tasks that match the query criteria.
6. To clear the query criteria, click Reset.
The software deploy task list displays all software deploy tasks.
Adding a software deploy task
1. Click the User tab.
2. From the navigation tree, select Desktop Asset Manager > Software Deploy Task.
The software deploy task list displays all software deploy tasks.
3. Click Add.
The Add Software Deploy Task page opens.
4. Configure basic task information. The task name must be unique in EAD.
5. Select target asset groups in the Deploy Group List area.
Click the Expand All icon
![]() to display all asset groups. A group name with an
Expand icon
to display all asset groups. A group name with an
Expand icon ![]() on the left
indicates that the group contains subgroups. To display
all subgroups of the group, click the Expand icon
on the left
indicates that the group contains subgroups. To display
all subgroups of the group, click the Expand icon ![]() .
.
6. In the Deploy Asset List area, select target assets:
a. Click Add Asset.
The asset list dialog box opens.
b. Filter assets with a basic or advanced query.
The Query Asset feature is displayed above the asset list. The Advanced Query link is a toggle switch between Basic Query and Advanced Query. When the link is Advanced Query, you are in the basic query mode, and vice versa.
Specify one or more of the following query criteria:
- Asset Number—Enter a partial or complete asset number. Each asset is assigned a unique asset number.
- Asset Name—Enter a partial or complete asset name.
- Owner—Enter a partial or complete owner of the asset.
- Group Name—Click
the Select Asset Group icon ![]() . The Select Asset Group page opens. Select a group and click OK. The
Group Name field is automatically populated with
the selected asset group.
. The Select Asset Group page opens. Select a group and click OK. The
Group Name field is automatically populated with
the selected asset group.
- Operating System—Enter a partial or complete name of the operating system. This field is available only for advanced queries.
- Operating System Language—Select the operating system language: Chinese (PRC) or English. This field is available only for advanced queries.
- Operating System Patch—Enter a partial or complete version of the operating system patch. This field is available only for advanced queries.
- Status—Select the status of the asset. Options are Online, Offline, and Unmanaged. This field is available only for advanced queries.
Empty fields are ignored.
c. Click Query.
d. Select the assets you want to add in the asset list.
e. Click OK.
All selected assets are added to the asset list.
7. Click OK.
Modifying a software deploy task
1. Click the User tab.
2. From the navigation tree, select Desktop Asset Manager > Software Deploy Task.
The software deploy task list displays all software deploy tasks.
3. For the software deploy
task you want to modify, click the Modify icon ![]() .
.
The Modify Software Deploy Task page opens.
4. Modify basic task information.
5. In the Deploy Group List area, modify the target asset groups.
6. In the asset list area, modify the target assets by using one or both of the following methods:
¡ To select assets for the task, click Add Asset.
¡ To remove undesired assets from the task, click the
Delete icon ![]() .
.
7. Click OK.
Deleting software deploy tasks
When a software deploy task has already been received by the iNode client, deleting the task does not affect execution of the task on the client host. The iNode client can continue to download and install the software specified in the task.
To delete one or more software deploy tasks:
1. Click the User tab.
2. From the navigation tree, select Desktop Asset Manager > Software Deploy Task.
The software deploy task list displays all software deploy tasks.
3. Select one or more software deploy tasks you want to delete.
4. Click Delete.
A confirmation dialog box opens.
5. Click OK.
EAD audit
EAD audit includes the following functions:
· Viewing access user security logs—Record access information of access users and detailed information of security events. Operators can query security logs to identify security risks in the network and take actions to enhance network security.
· Client driver audit—Allows operators to query driver errors to identify and repair faulty endpoints.
· Viewing security status of online and roaming users—Use the online and roaming user lists. The Online User List also displays client ACLs, device ACLs, traffic status, and online asset information.
· Online user security check—Perform a security check for online user endpoints at any time. Security check items include:
¡ System information
¡ Screen saver protection and password setting
¡ Drive list information
¡ Shared directory information
¡ Installed software
¡ Installed patches
¡ Enabled services
¡ Running processes
Performing a security check for an online user does not affect the security status of the user.
Many EAD functions require cooperation of the iNode client. When the iNode client encounters driver errors, the security functions cannot work. The iNode client can send these errors to the EAD server.
Security logs
EAD records security logs for the following security events:
· Assigning ACLs to users
· Security check
· Security recheck
· Real-time monitoring
By default, EAD records security logs only for access users who fail security check. For EAD to record security logs for access users who pass security check, enable the Generate logs after the security check is passed feature. For more information, see "Configuring service parameters."
Security log list contents
· Account Name—Name of the account. Clickthe name to view detailed information about the user account.
· Service Name—Service assigned to the access user. To view contents of the service configuration, click the name.
· Login Date/Time—Date and time when the access user logged in.
· User MAC Address—MAC address that the access user used for security check.
· User IP Address—IP address that the access user used for security check.
· Details—To view detailed information about the security log, click the Details icon ![]() .
.
Security log details
The security log details page has a Basic Information area and a Details area to present access information and security log contents for an access user.
Basic Information area
· Account Name—Name of the account. This field serves as a link for navigating to the Access Account Info page. For more information, see HPE IMC User Access Manager Administrator Guide.
· Service Name—Service assigned to the access user. This field serves as a link for navigating to the Service Configuration Details page. For more information, see HPE IMC User Access Manager Administrator Guide.
· Login Time—Time when the user logged in.
· User IP Address—IP address that the access user used for security check.
· User MAC Address—MAC address that the access user used for security check.
Details area
· Log Type—Possible security log types:
¡ Security Check—When an access user logs in, EAD performs security check. When such a security event occurs, EAD records the event as a Security Check log.
¡ Real-Time Monitoring—EAD performs real-time monitoring for online access users. When an access user fails a check during real-time monitoring, EAD records the security event as a Real-Time Monitoring log.
¡ Security Re-Check—When an access user has stayed online for a long time, EAD performs another security check. EAD records such a security event as a Security Re-Check log.
¡ Action—EAD records a security ACL or an isolation ACL assignment action as an Action log.
· Alarm Time—Time when EAD logs a security event or action.
· Security Policy Name—Security policy used for the access user security check.
· Security Status—Security status of the access user:
¡ Passed Security Check
¡ Monitored
¡ Informed
¡ Isolated
¡ Kicked out
· Details—Detailed reason(s) why the security check failed for the access user. For access users whose security status is Passed security check, this field is empty.
Viewing the security log list
1. Click the User tab.
2. From the navigation tree, select User Access Log > Security Log.
The security log list displays security logs generated for all access users on the current day.
3. To sort the list, click the column heading Account Name, Login Date/Time, User MAC Address, or User IP Address.
Viewing security log details
Security log details include the access information of a user and the specific security log information recorded for the user while online. The security log information includes:
· Security ACL or isolation ACL assigned to the access user
· Security check information
· Security recheck information
· Real-time monitoring check result
· Security check failure reason
To view security log details:
1. Click the User tab.
2. From the navigation tree, select User Access Log > Security Log.
The security log list displays the security logs generated for all access users on the current day.
3. To view security log
details, click the Details
icon ![]() .
.
The Security Log Details page opens.
4. Click Back to return to the security log list.
Querying security logs
EAD provides a basic and advanced query mode for you to search within security logs.
Basic query
1. Click the User tab.
2. From the navigation tree, select User Access Log > Security Log.
The security log list displays security logs generated for all access users on the current day.
3. At the upper right of the page, click Basic Query.
When Advanced Query is displayed at the upper right of the page, you are already in basic query mode. Skip this step.
4. Specify one or more of the following query criteria:
¡ Account Name—Enter a partial or complete account name.
¡ Service Name—Select a service from the service list.
¡ Time Range From/To—Select a security
log generation time range or click the Calendar
icon ![]() to
select the time range. The date and time settings must be in the format
YYYY-MM-DD hh:mm.
to
select the time range. The date and time settings must be in the format
YYYY-MM-DD hh:mm.
5. Click Query.
The Security Log List displays the security logs that match the query criteria.
6. To clear the query criteria, click Reset.
The Security Log List displays security logs generated for all access users on the current day.
Advanced query
1. Click the User tab.
2. From the navigation tree, select User Access Log > Security Log.
The security log list displays security logs generated for all access users on the current day.
3. At the upper right of the page, click Advanced Query.
When Basic Query is displayed at the upper right of the page, you are already in advanced query mode. Skip this step.
4. Specify one or more of the following query criteria:
¡ Account Name—Enter a partial or complete account name.
¡ User Name—Enter a user name. One user can have multiple accounts.
¡ User Group—To select a user group,
click the Select User Group icon ![]() . In the Select User Group page that opens,
select a group and click OK.
. In the Select User Group page that opens,
select a group and click OK.
¡ Service Name—Select a service from the service list.
¡ User IP Address From/To—Enter an IPv4 address range to match access users.
¡ Security Policy Name—From the security policy list, select a security policy.
¡ User MAC Address—Enter a MAC address string to match access users. This field supports these commonly used MAC address formats: XX-XX-XX-XX-XX-XX, XX:XX:XX:XX:XX:XX, and XXXX-XXXX-XXXX. For example, 02-50-F2-00-00-02, 02:50:F2:00:00:02, and 0250-F200-0002.
¡ Time Range From/To—Specify a security
log generation time range or click the Calendar
icon ![]() to
select the time range. The date and time settings must be in the format
YYYY-MM-DD hh:mm.
to
select the time range. The date and time settings must be in the format
YYYY-MM-DD hh:mm.
¡ Security Status—Select the security status of access users. Options are:
- Passed security check
- Monitored
- Informed
- Isolated
- Kicked out
When an access user's log details include multiple security statuses, the security log of the access user displays only when a security status matches the selected one.
¡ Security Check Item—From the security check item list, select a security check item. Options are:
- Anti-virus software
- Anti-spyware software
- Firewall software
- Anti-phishing software
- Hard disk encrypt software
- Patches
- Patch Manager
- Applications – software
- Applications – processes
- Applications – services
- Applications – files
- Registry
- Traffic
- OS password
- Sharing
- Asset registration
5. Click Query.
The Security Log List displays the security logs that match the query criteria.
6. To clear the query criteria, click Reset.
The Security Log List displays security logs generated for all access users on the current day.
Client driver audit
iNode driver list contents
· Account Name—Account name of the access user who encountered a client driver error. To view detailed information about the user account, click the account name.
· Login Time—Date and time when the access user logged in.
· Description—Description of the client driver error.
Viewing client driver errors in the iNode Driver list
1. Click the User tab.
2. From the navigation tree, select User Access Log > iNode Driver Audit.
The iNode Driver List displays client driver errors generated by all access users during the current month.
Querying client driver errors
1. Click the User tab.
2. From the navigation tree, select User Access Log > iNode Driver Audit.
The iNode driver list displays client driver errors generated by all access users on the current day.
3. Specify one or more of the following query criteria:
¡ Account Name—Enter an account name string.
¡ User Group—To select a user group,
click the Select User Group icon ![]() . In the Select User Group page that opens,
select a group and click OK. The User Group field is automatically populated with the
selected user group.
. In the Select User Group page that opens,
select a group and click OK. The User Group field is automatically populated with the
selected user group.
¡ Start Time/End Time—Specify a query
time range or click the Calendar icon ![]() to
select the time range. The date and time settings must be in the format
YYYY-MM-DD hh:mm.
to
select the time range. The date and time settings must be in the format
YYYY-MM-DD hh:mm.
4. Click Query.
The iNode driver list displays the iNode driver error logs that match the query criteria.
5. To clear the query criteria, click Reset.
The iNode driver list displays client driver errors generated by all access users during the current month.
Security status audit for local and roaming online users
Operators can view the security status of online and roaming users on the online and roaming user lists. The Online User List also displays client ACLs, device ACLs, traffic status, and online asset information.
Local online user list contents
After the EAD service component is deployed, the Security Status column is automatically added to the local online user list. Operators can customize the local online user list to display the Traffic Status, Client ACL, and Device ACL columns.
· Security Status—Security status of an online user:
¡ No Security Authentication—The online user needs no security check.
¡ For Security Authentication—Security check is ongoing for the online user.
¡ Secure—The online user has passed all security check items and can access network resources.
¡ Monitored—The online user fails some security check items but can access network resources. EAD only records security logs for users in this security status.
¡ Informed—The online user fails some security check items, but can access network resources. EAD informs users of the failures for repair.
¡ Isolated—The online user fails some security check items and is required to repair the failures. Users in this security status are isolated and can access only the network resources permitted by the isolation ACL.
¡ Offline—The online user fails some security check items and is logged off immediately.
¡ For Isolation—The online user fails some security check items and is to be isolated. When the configured waiting time is reached, users in this security status are isolated.
¡ For Offline—The online user fails some security check items and is to be logged off. When the configured waiting time is reached, users in this security status are logged off.
· Client ACL—Client ACL assigned to an online user.
· Device ACL—Device ACL assigned to an online user.
· Operation—This field contains five links: Details
![]() , Security Check of Computer
, Security Check of Computer ![]() , Remote Connect
, Remote Connect ![]() , Add to Blacklist
, Add to Blacklist ![]() or Release from Blacklist
or Release from Blacklist ![]() , and Asset details
, and Asset details ![]() .
.
¡ To
perform a security check of the computer of an online user, click the Security Check of Computer icon ![]() . This icon is available only after the EAD service component is
deployed and the DAM component is undeployed. For more information, see "Performing a computer security check."
. This icon is available only after the EAD service component is
deployed and the DAM component is undeployed. For more information, see "Performing a computer security check."
¡ To
view detailed asset information about an online user, click the Asset details icon ![]() . This icon is
available only after the DAM service component is deployed. For more
information, see "Asset details."
. This icon is
available only after the DAM service component is deployed. For more
information, see "Asset details."
Roaming online user list contents
The roaming online user list contents are the same as the local online user list contents.
After the EAD service component is deployed, the roaming online user list displays the Security Status column.
Viewing the local online user list
After the EAD service component is deployed, operators can view the security status, traffic status, client ACL, and device ACL of an online user. Operators can also perform a security check for the user on the local online user list. After the DAM service component is deployed, operators can also view the asset information of a user on the local online user list.
To view the local online user list:
1. Click the User tab.
2. From the navigation tree, select Access User > Online Users.
The Online Users page has the following tabs: Local, Roaming and By Device. By default, the Local tab is displayed. Click the Local tab to view the local online user list.
3. Click Refresh to refresh the local online user list.
|
|
NOTE: UAM provides the ability to view online user details and remote desktop connections. You can also add or remove online users on a blacklist. For more information, see HPE IMC User Access Manager Administrator Guide. |
Viewing the roaming online user list
After the EAD service component is deployed, operators can view the security status of roaming users on the roaming online user list.
To view the roaming online user list:
1. Click the User tab.
2. From the navigation tree, select Access User > Online Users.
The Online Users page has the following tabs: Local, Roaming and By Device. To view the roaming online user list, click the Roaming tab.
3. Click Refresh to refresh the roaming online user list.
Customizing the local online user list
After the EAD service component is deployed, the Security Status column is automatically added to the online user list. Operators can use the Customize GUI function to add Traffic Status, Client ACL, and Device ACL columns to the local online user list.
To customize the local online user list:
1. Click the User tab.
2. From the navigation tree, select Access User > Online Users.
The Online Users page has the following tabs: Local, Roaming and By Device. The Local tab is displayed by default. To view the local online user list, click the Local tab.
3. Click Customize GUI.
The Customize GUI page opens.
The Option List includes all columns
that can be displayed in the Online User List.
The Output List includes columns that are already displayed in the Online User List.
The position of an item in the Output List determines the position of the column in the Online User List. The topmost item on the Output List becomes the right-most column of the Online User List, and so forth.
You can select one or more list items at a time. To select multiple items, press and hold down the Ctrl key while selecting items.
¡ To
add all items in the Option List to the Output List, click ![]() .
.
¡ To
add selected items in the Option List to the Output List, click ![]() .
.
¡ To
remove selected items from the Output List, click ![]() .
.
¡ To
remove all items from the Output List, click ![]() .
.
¡ To
move selected items on the Output List to the top
of the Output List, click ![]() .
.
¡ To
move selected items higher in the Output List,
click ![]() .
.
¡ To
move selected items lower in the Output List, click
![]() .
.
¡ To
move selected items to the bottom of the Output List,
click ![]() .
.
4. In the Option List, select Traffic Status, Client ACL, and Device ACL and click ![]() to add them to the Output List.
to add them to the Output List.
5. Click OK.
The local online user list now displays the Traffic Status, Client ACL, and Device ACL columns.
Performing a computer security check
By using the computer security check function, operators can perform a security check for online user endpoints at any time without affecting the security status of the user.
Computer security check result details
The computer security check result details page has the following areas:
· Basic Information
· Screen Saver Settings
· Hard Disk Partition Table
· Share List
· Installed Software
· Installed Patches
· Running Services
· Running Processes
Basic Information area
· Account Name—Account name of the access user.
· Checked at—Time when the security check was completed.
· Computer Name—Computer name of the online user endpoint.
· User Name—Online user name.
· OS—Name of the operating system used by the online user endpoint.
Screen Saver Settings area
· Screen Saver—Indicates whether the online user endpoint has enabled the screen saver.
· Display Logon Screen on Resume—Indicates whether password protection is enabled for the screen saver.
· Screen Saver Startup Timeout—Screen idle timeout (in seconds) before starting the screen saver.
· Password Length—Length of the screen saver password, effective only for Windows 98.
Hard Disk Partition Table area
· Hard Disk Number—Physical disk number of a partition.
· Partition Number—Number of the partition.
· Type—Number of the partition type.
· Type Name—Name of the partition type.
· Startup Partition—Indicates whether the partition is the startup partition.
· Size—Size of the partition in MB.
Share List area
· No.—Number of a shared directory. This number is assigned by EAD.
· Share Name—Name of the shared directory.
· Local Path—Path of the shared directory.
· Share Type—Type of the shared directory:
¡ Common Share—A relatively secure share type. The user can share files with specified users or user groups and set the permission level. The user must delete the Everyone group from the Group or user names list to prevent unauthorized users from accessing the shared files.
¡ Default Share—An insecure share type. The Windows default share is likely to be used by attackers to attack the user endpoint.
¡ Others—This type includes only one share named IPC$, which is used by Windows.
· Type—Permission type for the specified user or user group to the shared directory. Options are Allow and Deny. This parameter is available only when the share type is Common Share.
· Object—Name of the user or user group of the share. This parameter is available only when the share type is Common Share.
· Domain of Object—Domain name of the user or user group of the share. This parameter is available only when the share type is Common Share. When the user or user group has not joined a domain, this field is empty.
· Object Type—Type of the user or user group of the share. This parameter is available only when the share type is Common Share. Object type can be System Group, Custom Group, or User. When the user or user group does not have this parameter, this field is empty.
¡ System Group—The object permitted or denied access to the shared directory is a system-defined operating system group.
¡ Custom Group—The object permitted or denied access to the shared directory is a user-defined operating system group.
¡ User—The object permitted or denied access to the shared directory is a user.
· Right of Object—Permission that the user or user group has to the shared directory. This field contains data only when the share type is Common Share. The permission can be Read-Only, Read-Write, or All.
Installed Software area
· No.—Number of the software. This number is assigned by EAD.
· Name—Name of the software.
· Version—The software version.
· Installed on—Time when the software was installed.
Installed Patches area
· No.—Number of a patch. This number is assigned by EAD.
· Software Name—Name of the software for which the patch is installed.
· Software Version—The software version for which the patch is installed.
· Name—Name of the patch.
· Description—Description of the patch.
· Installed at—Time when the patch was installed.
· Type—Type of the patch.
Running Services area
· No.—Number of a service. This number is assigned by EAD.
· Name—Name of a service.
Running Processes area
· No.—Number of a process. This number is assigned by EAD.
· Name—Name of the process.
Performing a computer security check
1. Click the User tab.
2. From the navigation tree, select Access User > Online Users.
The Online Users page has the following tabs: Local, Roaming and By Device. The Local tab is displayed by default. To view the local online user list, click the Local tab.
3. For an online user for which you want to
perform a security check, click the Security Check of Computer icon ![]() .
.
The Computer Security Check page opens.
4. To select all check items, click Select All or select the specific boxes ![]() next to the check items that you want to
execute. Check items are:
next to the check items that you want to
execute. Check items are:
¡ Check System Information
¡ Check Screen Saver and Password
¡ Check Partition Table
¡ Check Shares
¡ Check Installed Software
¡ Check Installed Patches
¡ Check Running Services
¡ Check Running Processes
5. Click OK.
The Computer Security Check Result page opens.
6. Click Back to return to the Computer Security Check page.
EAD service reports
The EAD service report function is implemented through the report feature of the IMC platform. All reports on the Report tab are generated from system or user-defined templates.
IMC platform offers various reporting options. From the Report tab, you can quickly and easily access EAD service reports. Through the report feature of the IMC platform, you can view and export real-time reports and scheduled reports. The EAD component provides the system-defined service report templates shown in Table 29.
Table 29 EAD service report templates
|
Template name |
Dependent service component |
Real-time report |
Scheduled report |
|
All-Node Online Users 24-Hour Trend Graph V2 |
User Security Policy |
Available |
Unavailable |
|
Asset Information Report V2 |
DAM |
Available |
Unavailable |
|
Asset Report by Software V2 |
DAM |
Available |
Available |
|
Asset Type Report V2 |
DAM |
Available |
Available |
|
Asset Usage Report V2 |
DAM |
Available |
Available |
|
CPU Report V2 |
DAM |
Available |
Available |
|
Hard Disk Capacity Report V2 |
DAM |
Available |
Available |
|
Illegal Peripheral Use Report V2 |
DAM |
Available |
Available |
|
Insecurity Category Statistic Report V2 |
User Security Policy |
Available |
Available |
|
Multi-Node Certain Security Policy Statistics Report V2 |
User Security Policy |
Available |
Unavailable |
|
Multi-Node Online Users Comparison Chart V2 |
User Security Policy |
Available |
Unavailable |
|
Multi-Node Security Check Items Report V2 |
User Security Policy |
Available |
Unavailable |
|
Multi-Node Single-Security Check Item Failures Comparison Chart V2 |
User Security Policy |
Available |
Unavailable |
|
Multi-Node User Counts Comparison Chart V2 |
User Security Policy |
Available |
Unavailable |
|
Multi-Node User Data Statistics Report V2 |
User Security Policy |
Available |
Unavailable |
|
Online User Security Status Report V2 |
User Security Policy |
Available |
Available |
|
OS Language Report V2 |
DAM |
Available |
Available |
|
OS Version Report V2 |
DAM |
Available |
Available |
|
Safe Log Gather Statistic Report V2 |
User Security Policy |
Available |
Available |
|
Single-Node Online Users 24-Hour Trend Graph V2 |
User Security Policy |
Available |
Unavailable |
|
Single-Node Security Check Failure Report V2 |
User Security Policy |
Available |
Unavailable |
|
Software Installation Report V2 |
DAM |
Available |
Available |
|
Software Report by Asset V2 |
DAM |
Available |
Available |
With the real-time report feature, for quick and easy access to the report you can configure your Report main page to include any of the real-time reports that IMC offers,.
With the scheduled report feature, you can schedule the reports to run on a daily, weekly, monthly, quarterly, semi-annually, or annual basis.
You can define the start dates of data collection for scheduled reports and the end dates and times for the corresponding scheduled report tasks. Scheduled reports are stored on the IMC server for later viewing and downloading. Also, you can include email recipients who will receive a copy of all scheduled reports.
You can configure the reports to be generated in one of the following formats:
· Adobe Acrobat Portal Document Format (PDF)
· Comma-Separated Value (CSV)
· Microsoft Excel (XLS)
The Report main page is accessed through the Report tab. The Report page begins as a blank page that every IMC operator can customize to meet individual reporting needs. For more information about the IMC platform reports, see HPE Intelligent Management Center v7.0 Enterprise and Standard Administrator Guide.
Real-time reports
Real-time reports offer historical reporting capabilities on the User Security Policy and DAM service components. Table 30 lists the real-time reports that an operator can generate, based on the system-defined report templates provided by the EAD component. IMC also allows you to define new templates as needed.
Table 30 Real-time reports provided by EAD
|
Real-time reports |
Service component |
|
All-Node Online Users 24-Hour Trend Graph V2 |
User Security Policy |
|
Asset Information Report V2 |
DAM |
|
Asset Type Report V2 |
DAM |
|
Asset Usage Report V2 |
DAM |
|
CPU Report V2 |
DAM |
|
Hard Disk Capacity Report V2 |
DAM |
|
Illegal Peripheral Use Report V2 |
DAM |
|
Insecurity Category Statistic Report V2 |
User Security Policy |
|
Multi-Node User Data Statistics Report V2 |
User Security Policy |
|
Online User Security Status Report V2 |
User Security Policy |
|
OS Language Report V2 |
DAM |
|
OS Version Report V2 |
DAM |
|
Safe Log Gather Statistic Report V2 |
User Security Policy |
|
Single-Node Online Users 24-Hour Trend Graph V2 |
User Security Policy |
|
Single-Node Security Check Failure Report V2 |
User Security Policy |
|
Software Installation Report V2 |
DAM |
All-node online users 24-hour trend graph
This report collects statistics about the number of online users throughout a 24 hour period for the current node and all its child nodes. Online users are categorized as secure online users, insecure online users, and unknown online users.
To view the all-node online users 24-hour trend graph:
1. Click the Report tab.
2. In the My Real-Time Reports [Edit Mode] area, click the link All-Node Online Users 24-Hour Trend Graph. (Verify that this link displays [Edit Mode] to confirm that you are in view mode.)
The Set Parameter dialog box opens.
3. To select the date for querying the report statistics, click the Query Time field.
4. Click OK.
The all-node online users 24-hour trend graph is added to an Intelligent Analysis Report Viewer page.
All-Node Online Users 24-Hour Trend Graph parameters
¡ Statistics Time—Date when statistics were collected by the report.
¡ Report Time—Time when the report was generated.
All-Node Online Users 24-Hour Trend Graph fields
¡ Number of online users—Displays the total number of online users for all nodes at each hour of a 24 hour period including the secure online users, insecure online users, and unknown online users.
¡ Number of secure online users—Displays the total number of secure online users for all nodes at each hour of a 24 hour period.
¡ Number of insecure online users—Displays the total number of insecure online users for all nodes at each hour of a 24 hour period.
¡ Number of unknown online users—Displays the total number of unknown online users for all nodes at each hour of a 24 hour period.
Asset information report
This report collects statistics about newly added and existing assets, memory size, and hard-disk capacity of an asset group (excluding its subgroups) during each month during a specified time range. The report displays only statistics for asset groups to which the current operator has privileges, and does not include the asset statistics for the current month.
To view the asset information report:
1. Click the Report tab.
2. In the My Real-Time Reports [Edit Mode] area, click the Asset Information Report link. (Verify that this link displays [Edit Mode] to confirm that you are in view mode.)
The Set Parameter dialog box opens.
3. In the Start Month
area, select the start month for report statistics collection.
In the End
Month area, select the end month for report statistics collection.
The asset statistics of the current month are not included in the report.
4. Click OK.
The asset information report is added to an Intelligent Analysis Report Viewer page.
Asset Information Report parameters
¡ Start Month—Start month for report statistics collection.
¡ End Month—End month for report statistics collection.
¡ Report Time—Time when the report was generated.
Asset Information Report fields
This report displays the per-month asset statistics. Table 31 describes the fields in the report.
|
Statistical item |
Description |
|
|
Asset Group |
Name of the asset group. |
|
|
Asset |
New |
Number of newly added assets in the asset group in a specified time range. |
|
Total |
Total number of assets in the asset group in a specified time range. |
|
|
Memory |
New (GB) |
Size of newly added memory in the asset group in a specified time range. |
|
Total (GB) |
Total size of memory in the asset group in a specified time range. |
|
|
Hard disk |
New (GB) |
Capacity of newly added hard disks in the asset group in a specified time range. |
|
Total (GB) |
Total capacity of hard disks in the asset group in a specified time range. |
|
Asset Report by Software
This report allows you to query all assets on which a specified software product is installed. You can query assets only for asset groups to which you have operation privileges.
To view the asset report by software:
1. Click the Report tab.
2. In the My Real-Time Reports [Edit Mode] area, click the link Asset Type Report . (Verify that this link displays [Edit Mode] to confirm that you are in view mode.)
The Set Parameter dialog box opens.
3. In the Software Name field, enter a partial or complete software name.
4. In the Software Version field, enter a partial or complete version number of the software.
5. Click OK.
The asset report is added to an Intelligent Analysis Report Viewer page.
Asset Report by Software parameters
¡ Report Time—Time when the report was generated.
¡ Software Name—Name of the specified software.
¡ Software Version—Version of the specified software.
Asset Report by Software fields
¡ Asset Number—Number of the asset on which the specified software is installed.
¡ Asset Name—Name of the asset on which the specified software is installed.
¡ Group Name—Name of the asset group to which the asset installed with the specified software belongs.
¡ Owner—Owner of the asset on which the specified software is installed.
¡ Software Name—Name of the specified software.
¡ Software Version—Version of the specified software.
¡ Installed On—Installation time of the specified software.
Asset type report
This report collects statistics about the asset types and the number of assets of each type for all registered assets in the specified asset group, including its subgroups. The asset types are Laptop, PC, Server, Workstation, and Others. The report displays only statistics of asset groups to which the current operator has privileges.
To view the asset type report:
1. Click the Report tab.
2. In the My Real-Time Reports [Edit Mode] area, click the Asset Type Report link. (Verify that this link displays [Edit Mode] to confirm that you are in view mode.)
The Set Parameter dialog box opens.
3. In the Asset Group area, select the asset group whose statistics are to be collected.
The system collects statistics about the types of assets in the asset group and its subgroups.
4. Click OK.
The asset type report is added to an Intelligent Analysis Report Viewer page.
Asset Type Report parameters
¡ Report Time—Time when the report was generated.
¡ Group Name—Name of the asset group. The report collects statistics about the asset types and the number of assets of each type for all registered assets in an asset group, including its subgroups. All indicates all asset groups. The report collects statistics about only asset groups to which the current operator has privileges.
Asset Type Statistics pie chart
The asset type statistics pie chart displays the distribution of asset types. The asset type can be PC, Workstation, Laptop, Server, or Others. To see statistics about the type of assets, click a slice in the pie chart.
Figure 20 Asset type statistics
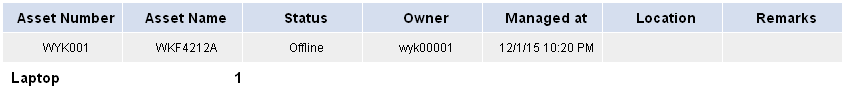
¡ Asset Number—Asset number of the asset.
¡ Asset Name—Name of the asset.
¡ Status—Status of the asset. Options are Online and Offline.
¡ Owner—Owner of the asset.
¡ Managed at—Time when the asset began to be managed.
¡ Location—Room where the asset resides.
¡ Remarks—Remarks on the asset.
Asset usage report
This report collects statistics about assets which have been offline for more than the specified number of days. This report displays only statistics for asset groups to which the current operator has privileges.
To view the asset usage report:
1. Click the Report tab.
2. In the My Real-Time Reports [Edit Mode] area, click the Asset Usage Report link. (Verify that this link displays [Edit Mode] to confirm that you are in view mode.)
The Set Parameter dialog box opens.
3. In the Min. Idle Time field, enter the minimum number of idle days.
The system collects statistics about assets that have been offline for more than the specified number of days.
4. Click OK.
The asset usage report is added to an Intelligent Analysis Report Viewer page.
Asset Usage Report parameters
¡ Report Time—Time when the report was generated.
¡ Min. Idle Time—Minimum number of idle days. Statistics about assets that have been offline for more than the specified number of days are displayed in the report.
Asset Usage Report fields
¡ Asset Number—Asset number of the idle asset.
¡ Asset Group—Asset group of the idle asset.
¡ Owner—Owner of the asset.
¡ Management Time—Time when the asset began to be managed.
¡ Last Off-line—Time when the asset last went offline.
¡ Idle Period—Days for which the asset has been idle.
CPU report
This report collects statistics about assets whose CPU frequencies meet the specified conditions in the specified asset group, including its subgroups. This report displays statistics about only the asset groups to which the current operator has privileges.
To view the CPU report:
1. Click the Report tab.
2. In the My Real-Time Reports [Edit Mode] area, click the CPU Report link. (Verify that this link displays [Edit Mode] to confirm that you are in view mode.)
The Set Parameter dialog box opens.
3. For the CPU frequency range setting:
In the Minimum Frequency (MHz) field, enter the minimum frequency value.
In the Maximum
Frequency (MHz) field, enter the maximum
frequency value.
The CPU frequencies shown in the report must meet the following criteria:
Minimum Frequency ≤ CPU Frequency < Maximum Frequency.
4. From the Asset Group list, select the asset group whose statistics are to be collected.
The system collects CPU statistics about assets in the asset group and its subgroups.
5. Click OK.
The CPU report is added to an Intelligent Analysis Report Viewer page.
CPU Report parameters
¡ Minimum Frequency—Minimum frequency (in MHz) of the CPU frequency range.
¡ Maximum Frequency—Maximum frequency (in MHz) of the CPU frequency range.
¡ Report Time—Time when the report was generated.
¡ Group Name—Name of the asset group. The report collects CPU statistics about registered assets in an asset group, including its subgroups. All indicates all asset groups. The report collects statistics about only the asset groups to which the current operator has privileges.
CPU Report fields
¡ Asset Number—Asset number of the asset.
¡ Asset Name—Name of the asset.
¡ Owner—Owner of the asset.
¡ CPU SN—Number of the CPU in the operating system.
¡ CPU Name—Product name of the CPU.
¡ Frequency—Frequency (in MHz) of the asset's CPU.
Hard Disk capacity report
This report collects statistics about the number of hard disks in the specified asset group, including its subgroups, and classifies the hard disks according to their capacity: <80 GB, [80 GB to 160 GB), [160 GB to 250 GB), [250 GB to 500 GB), [500 GB to 1024 GB), and >=1024 GB.
The report displays only the hard disk capacity statistics of asset groups to which the current operator has privileges.
To view the hard disk capacity report:
1. Click the Report tab.
2. In the My Real-Time Reports [Edit Mode] area, click the Hard Disk Capacity Report link. (Verify that this link displays [Edit Mode] to confirm that you are in view mode.)
The Set Parameter dialog box opens.
3. From the Asset Group area, select the asset group whose statistics are to be collected.
The system collects hard disk capacity statistics about assets in the asset group and its subgroups.
4. Click OK.
The hard disk capacity report is added to an Intelligent Analysis Report Viewer page.
Hard Disk Capacity Report parameters
¡ Report Time—Time when the report was generated.
¡ Group Name—Name of the asset group. The report collects hard-disk capacity statistics about registered assets in an asset group, including its subgroups. All indicates all asset groups. The report collects statistics about only the asset groups to which the current operator has privileges.
Hard Disk Capacity Statistics pie chart
The hard disk capacity statistics pie chart displays the distribution of hard-disk capacity. The hard-disk capacity is classified into the following levels: <80 GB, [80 GB to 160 GB), [160 GB to 250 GB), [250 GB to 500 GB), [500 GB to 1024 GB), and >=1024 GB. To view statistics about the type of hard disks, click a slice in the pie chart.
Hard disk type statistics
Figure 21 shows statistics for one type of hard disk.
Figure 21 Hard disk type statistics
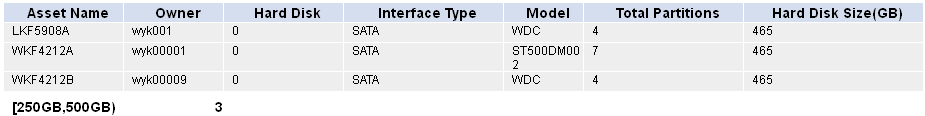
¡ Asset Name—Name of the asset where the hard disk resides.
¡ Owner—Owner of the asset where the hard disk resides.
¡ Hard Disk Number—Number of the hard disk in the operating system.
¡ Interface Type—Interface type of the hard disk.
¡ Model—Model of the hard disk.
¡ Total Partitions—Number of partitions on the hard disk.
¡ Hard Disk Size—Size of the hard disk (in GB).
Illegal peripheral use report
This report collects statistics about illegal peripheral usage types and the times of each type for the specified asset group, including its subgroups, during a specified time range. The peripheral types include:
· USB Storage
· USB Nonstorage
· DVD/CD-ROM
· Floppy
· PCMCIA
· COM/LPT
· Infrared
· Bluetooth
· 1394
· Modem
The report displays only the illegal peripheral usage types and the times of each type for asset groups to which the current operator has privileges.
To view the illegal peripheral use report:
1. Click the Report tab.
In the My Real-Time Reports [Edit Mode] area, click the Illegal Peripheral Use Report link. (Verify that this link displays [Edit Mode] to confirm that you are in view mode.)
The Set Parameter dialog box opens.
2. In the Start Time and End Time area, select a time range for the report.
Options are Last Five Minutes, Last Ten Minutes, Last Thirty Minutes, and Custom Range. When you select Custom Range, the Start Time and End Time fields are displayed.
a. Click the Start Time field and select the start time in a calendar.
This parameter sets the start date for the specific time range in a data collection period.
b. Click the End Time field and select the end time in a calendar.
This parameter sets the end date for the specific time range in a data collection period.
3. From the Asset Group list, select the asset group whose statistics are to be collected.
The system then collects statistics about illegal peripheral usage types and the times of each type for the asset group and its subgroups.
4. Click OK.
The illegal peripheral use report is added to an Intelligent Analysis Report Viewer page.
Illegal Peripheral Use Report parameters
¡ Start Time—Start time for the report statistics.
¡ End Time—End time for the report statistics.
¡ Report Time—Time when the report was generated.
¡ Group Name—Name of the asset group. This report collects statistics about illegal peripheral usage types and the times of each type for the specified asset group, including its subgroups, during a specified time range. All indicates all asset groups. The report collects statistics about only asset groups to which the current operator has privileges.
Illegal Peripheral Use Statistics pie chart
¡ USB Storage
¡ USB Nonstorage
¡ DVD/CD-ROM
¡ Floppy
¡ PCMCIA
¡ COM/LPT
¡ Infrared
¡ Bluetooth
¡ 1394
¡ Modem
To see statistics about the type of illegal peripheral usage, click a slice in the pie chart.
Illegal peripheral usage type statistics
¡ Total—Number of times of the illegal peripheral use occurred.
¡ Asset Number—Asset number of the asset.
¡ Owner—Owner of the asset.
¡ Operation Time—Time when the server recorded the illegal peripheral usage.
¡ Disable Result—Indicates whether the iNode client successfully disables the illegal peripheral.
¡ Device—Description of the peripheral illegally used.
Insecurity category statistic report
This report collects statistics about security check failures of each insecurity category type for the current EAD node during a specified time range.
To view the insecurity category statistic report:
1. Click the Report tab.
2. In the My Real-Time Reports [Edit Mode] area, click the Insecurity Category Statistic Report link. (Verify that this link displays [Edit Mode] to confirm that you are in view mode.)
The Set Parameter dialog box opens.
3. Click the Start Date field and select the start date in a calendar.
This parameter sets the start date for the specific time range in a data collection period.
4. Click the End Date field and select the end date in a calendar.
This parameter sets the end date for the specific time range in a data collection period.
5. Click OK.
The insecurity category statistic report is added to an Intelligent Analysis Report Viewer page.
Insecurity Category Statistic Report parameters
¡ Start Time—Start time for the report statistics.
¡ End Time—End time for the report statistics.
¡ Report Time—Time when the report was generated.
Insecurity Category Statistic pie chart
Insecurity Category statistics
Figure 22 shows statistics for an insecurity category.
Figure 22 Insecurity category statistics
![]()
¡ Account—Account name of the access user.
¡ Full Name—Full name of the access user.
¡ User Group—User group to which the access user belongs.
¡ Service Name—Name of the service which the access user applies for.
¡ Strategy Name—Name of the security policy that the access user uses.
¡ User IP Address—IP address of the access user.
¡ User MAC Address—MAC address of the access user.
¡ Date—Date when the security check failure occurs.
¡ Insecurity Description—Description of the security check failure.
Multi-node user data statistics report
This report collects and compares user data statistics of the current EAD node and all its child EAD nodes. User data statistics include the number of access users, blacklisted users, guests, online users, secure online users, insecure online users, and unknown online users.
To view the multi-node user data statistics report:
1. Click the Report tab.
2. In the My Real-Time Reports [Edit Mode] area, click the Multi-Node User Data Statistics Report link. (Verify that this link displays [Edit Mode] to confirm that you are in view mode.)
The multi-node user data statistics report is added to an Intelligent Analysis Report Viewer page.
Multi-Node User Data Statistics Report parameters
¡ Report Time—Time when the report was generated.
Multi-Node User Data Statistics Report fields
¡ Node Name—Name of the node. This column displays the name of the current node and its child node.
¡ Access Users—Number of access users on the node.
¡ Blacklisted Users—Number of blacklisted users on the node.
¡ Guests—Number of guests on the node.
¡ Online Users—Number of online users on the node.
¡ Secure Online Users—Number of secure online users on the node.
¡ Insecure Online Users—Number of insecure online users on the node.
¡ Unknown Online Users—Number of unknown online users on the node.
¡ Statistics Time—Time when statistics are collected.
Online user security status report
This report collects statistics about the security status of all users in a specified user group, including its subgroups. The report collects statistics about only user groups to which the current operator has privileges. The security status of an online user can be No Security Authentication Needed, Waiting for Security Authentication, Secure, Insecure, or Others.
To view the online user security status report:
1. Click the Report tab.
2. In the My Real-Time Reports [Edit Mode] area, click Online User Security Status Report link. (Verify that this link displays [Edit Mode] to confirm that you are in view mode.)
The Set Parameter dialog box opens.
3. From the User Group list, select the user group whose statistics are to be collected.
The system then collects user security status statistics about the users in the user group and its subgroups.
4. Click OK.
The online user security status report is added to an Intelligent Analysis Report Viewer page,.
Online User Security Status Report parameters
¡ User Group—Name of the user group. This report collects statistics about the security status of all users in a user group, including its subgroups. All indicates all user groups. The report collects statistics about only user groups to which the current operator has privileges.
¡ Report Time—Time when the report was generated.
Online User Security Status Category Statistics pie chart
This report displays the distribution of the security status of all users in a user group, including its subgroups. The security status of an online user can be No Security Authentication Needed, Waiting for Security Authentication, Secure, Insecure, or Others. Click a slice in the pie chart to see statistics about online users in the specified security status.
Online user security status statistics
Figure 23 shows statistics about online users with the specified security status.
Figure 23 Online user security status statistics
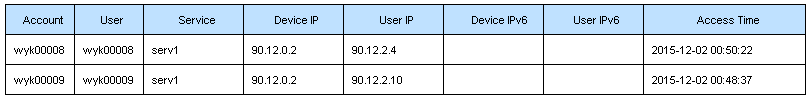
¡ Service—Name of the service that the user uses for login.
¡ Device IP—Access device IP address of the user.
¡ User IP—IP address of the online user.
¡ Access Time—Time when the user logs in.
OS language report
This report collects statistics about OS language types and the number of assets using each OS language type for all registered assets in the specified asset group, including its subgroups. The report collects statistics about only asset groups to which the current operator has privileges. The language types are Chinese (PRC), English, and Others.
To view the OS language report:
1. Click the Report tab.
2. In the My Real-Time Reports [Edit Mode] area, click the OS Language Report link. (Verify that this link displays [Edit Mode] to confirm that you are in view mode.)
The Set Parameter dialog box opens.
3. From the Asset Group list, select the asset group whose statistics are to be collected.
The system collects statistics about OS language types and the number of assets using each OS language type for all registered assets in the asset group, including its subgroups.
4. Click OK.
The OS language report is added to an Intelligent Analysis Report Viewer page.
OS Language Report parameters
¡ Report Time—Time when the report was generated.
¡ Group Name—Name of the asset group. This report collects statistics about OS language types and the number of assets using each OS language type for all registered assets in the specified asset group, including its subgroups. All indicates all asset groups. The report collects statistics about only the asset groups to which the current operator has privileges.
OS Language Statistics pie chart
This report displays the distribution of OS language types of all registered assets in the specified asset group, including its subgroups. The recognized language types are Chinese (PRC), English, and Others. To see asset statistics about the specified OS language type, click a slice in the pie chart.
Asset statistics
Figure 24 shows asset statistics for an OS language type.
Figure 24 Asset statistics for an OS language type
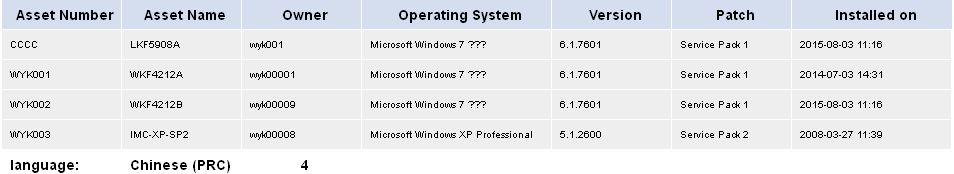
¡ Asset Number—Asset number of the asset.
¡ Asset Name—Name of the asset.
¡ Owner—Owner of the asset.
¡ Operating System—Operating system running on the asset.
¡ Version—Version of the operating system running on the asset.
¡ Patch—Service pack version of the operating system running on the asset.
¡ Installed on—Time when the operating system was installed on the asset.
OS version report
This report collects statistics about OS versions and the number of assets running each OS version for all registered assets, and displays the distribution of top five OS versions. The report collects statistics about only asset groups to which the current operator has privileges.
To view the OS version report:
1. Click the Report tab.
2. In the My Real-Time Reports [Edit Mode] area, click the OS Version Report link. (Verify that this link displays [Edit Mode] to confirm that you are in view mode.)
3. Click OK.
The OS version report is added to an Intelligent Analysis Report Viewer page.
OS Version Report parameters
¡ Report Time—Time when the report was generated.
¡ Description—A brief description of the report.
OS Version Statistics pie chart
Asset statistics
Figure 25 shows asset statistics for an OS version.
Figure 25 Asset statistics for an OS version
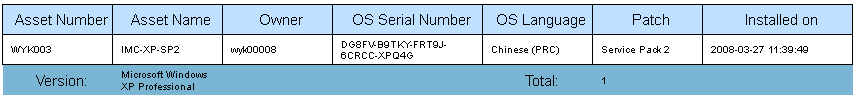
¡ Asset Number—Asset number of the asset.
¡ Asset Name—Name of the asset.
¡ Owner—Owner of the asset.
¡ OS Language—OS language type of the asset.
¡ Patch—Service pack version of the operating system running on the asset.
¡ Installed on—Time when the operating system was installed on the asset.
Safe log gather statistic report
This report collects statistics from security logs of the current EAD node and all of its child nodes, and displays the distribution of insecurity events.
To view the safe log gather statistic report:
1. Click the Report tab.
2. In the My Real-Time Reports [Edit Mode] area, click the Safe Log Gather Statistic Report link. (Verify that this link displays [Edit Mode] to confirm that you are in view mode.)
The Set Parameter dialog box opens.
3. Click the Start Date field to select the start date in a calendar.
This parameter sets the start date for the data collection period.
4. Click the End Date field to select the end date in a calendar.
This parameter sets the end date for the data collection period.
5. From the Grade Node list, select the node whose statistics are to be collected.
The system collects statistics from security logs of the current EAD node and all its child nodes, and displays the distribution of each type of insecurity events.
6. Click OK.
The safe log gather statistic report is added to an Intelligent Analysis Report Viewer page.
Safe Log Gather Statistic Report parameters
¡ Start Time—Start time for the report statistics.
¡ End Time—End time for the report statistics.
¡ Report Time—Time when the report was generated.
¡ Grade Node—Name of the node whose statistics are collected by the report. All indicates all nodes. The report collects statistics about only nodes to which the current operator has privileges.
Safe Log Gather Statistic pie chart
The pie chart displays the distribution of insecurity events on a node and all of its child nodes. The insecurity events are:
¡ Anti-virus software
¡ Anti-spyware software
¡ Firewall software
¡ Anti-phishing software
¡ Hard disk encryption software
¡ Windows patches
¡ Patch manager
¡ Applications - software
¡ Applications - processes
¡ Applications - services
¡ Applications - files
¡ Registry
¡ Traffic
¡ OS password
¡ Sharing
¡ Asset registration
To see statistics for the specified insecurity category, click a slice in the pie chart.
Insecurity Category statistics
Figure 26 shows statistics for an insecurity category.
Figure 26 Insecurity category statistics
¡ Node Name—Name of the current node or child node.
¡ Statistics Date—Date when the statistics were collected.
¡ Amount—Number of insecurity events.
Single-node online users 24-hour trend graph
This report displays the number of online users on a single EAD node at each hour of the specified day. Online users are categorized as secure online users, insecure online users, and unknown online users. The total number of online users is the sum of the number of online users of each type.
To view the single-node online users 24-hour trend graph:
1. Click the Report tab.
2. In the My Real-Time Reports [Edit Mode] area, click the link Single-Node Online Users 24-Hour Trend Graph. (Verify that this link displays [Edit Mode] to confirm that you are in view mode.)
The Set Parameter dialog box opens.
3. Click the Query Date field to select the date in a calendar.
4. From the Grade Node list, select the node whose statistics are to be collected.
The system collects the number of online users on the node at each of the 24 hours in the day.
5. Click OK.
The single-node online users 24-hour trend graph is added to an Intelligent Analysis Report Viewer page.
Single-Node Online Users 24-Hour Trend Graph parameters
¡ Statistics Time—Day for which statistics were collected by the report.
¡ Report Time—Time when the report was generated.
¡ Node Name—Name of the node whose statistics were collected.
Single-Node Online Users 24-Hour Trend Graph
¡ Number of online users—Number of online users of the specified node at each hour of the specified day. Online users include secure online users, insecure online users, and unknown online users.
¡ Number of secure online users—Number of secure online users at each hour of the specified day.
¡ Number of insecure online users—Number of insecure online users at each hour of the specified day.
¡ Number of unknown online users—Number of unknown online users at each hour of the specified day.
Single-node security check failure report
This report collects statistics about security check failures on a single EAD node (the current node or its child node). The report statistics can be collected on a per-day, per-week, or per-month basis.
To view the single-node security check failure report:
1. Click the Report tab.
2. In the My Real-Time Reports [Edit Mode] area, click the link Single-Node Security Check Failure Report. (Verify that this link displays [Edit Mode] to confirm that you are in view mode.)
The Set Parameter dialog box opens.
3. From the Grade Node list, select the node whose statistics are to be collected.
The system collects statistics about the security check failure reasons and the number of security check failures for access users on the node.
4. Click the Query Date field to select the date in a calendar.
5. From the Report Type list, select a report type.
The report types include Daily Report, Weekly Report, and Monthly Report. The report statistics can be collected on a per-day, per-week, or per-month basis in the specified time range.
6. Click OK.
The single-node security check failure report is added to an Intelligent Analysis Report Viewer page.
Single-Node Security Check Failure Report parameters
¡ Start Date—Start date for the report statistics.
¡ End Date—End date for the report statistics.
¡ Report Time—Time when the report was generated.
¡ Node Name—Name of the node whose statistics were collected.
¡ Description—A brief description of the report.
Single-Node Security Check Failure bar chart
¡ Anti-virus software check failures
¡ Anti-phishing software check failures
¡ Firewall software check failures
¡ Anti-spyware software check failures
¡ Hard disk encryption software check failures
¡ Windows patch check failures
¡ Patch management software check failures
¡ Application check failures
¡ Registry check failures
¡ Shared-directory check failures
¡ Traffic monitoring check failures
¡ Operating system password check failures
¡ Asset registration check failures
The security check failure statistics are collected by account, service, and security check item. For example, when an account encounters two security check failures on the same service and security check item, the report considers them as one failure. However, when an account encounters two security check failures on different services (even if they are for the same security check item), the report considers them as two failures.
Software installation report
This report collects statistics about software names and the number of assets with each type of software installed for all registered assets in the specified asset group, including its subgroups. The report collects statistics about only asset groups to which the current operator has privileges.
To view the software installation report:
1. Click the Report tab.
2. In the My Real-Time Reports [Edit Mode] area, click the Software Installation Report link. (Verify that this link displays [Edit Mode] to confirm that you are in view mode.)
The Set Parameter dialog box opens.
3. From the Asset Group list, select the asset group whose statistics are to be collected.
The system collects statistics about software names and the number of assets with each type of software installed for all registered assets in the asset group, including its subgroups.
4. Click OK.
The software installation report is added to an Intelligent Analysis Report Viewer page.
Software Installation Report parameters
¡ Report Time—Time when the report was generated.
¡ Group Name—Name of the asset group.
¡ This report collects statistics about software names and the number of assets with each type of software installed for all registered assets in the specified asset group, including its subgroups. All indicates all asset groups. The report collects statistics about only asset groups to which the current operator has privileges.
· Description—A brief description of the report.
Software Installation Report fields
¡ Software Name—Name of the software installed on the assets.
¡ Software Version—The software version. The software installation report separately collects statistics about software products with the same name but different versions.
¡ Assets—Number of assets with the software installed.
Software Report by Asset
This report allows you to query all software products that are installed on the specified asset in an asset group to which you have the operation privileges.
To view the software report by asset:
1. Click the Report tab.
2. In the My Real-Time Reports [Edit Mode] area, click the Software Report by Asset link. (Verify that this link displays [Edit Mode] to confirm that you are in view mode.)
3. The Set Parameter dialog box opens.
4. In the Asset Number field, enter the number of the asset.
5. Click OK.
The software report is added to an Intelligent Analysis Report Viewer page.
Software Report by Asset parameters
¡ Report Time—Time when the report was generated.
¡ Asset Number—Number of the asset.
¡ Asset Name—Name of the asset.
¡ Group Name—Asset group to which the asset belongs.
¡ Owner—Owner of the asset.
¡ Description—A brief description of the report.
Software Report by Asset fields
¡ Software Name—Name of the software that is installed on the asset.
¡ Software Version—Version number of the software that is installed on the asset.
¡ Installed On—Time when the software was installed on the asset.
Scheduled reports
You can schedule all real-time reports to run on a periodic basis. Define the start dates of data collection for generating scheduled reports, and the end dates and times for the corresponding scheduled report tasks. Then select the reporting period for the data in which you are interested. The report runs at 04:00 AM and includes data from the reporting period you specified until 00:00 on the day that the report was generated.
For scheduled reports, the following reporting periods are available:
· Daily—When you select the Daily schedule type, reports from the previous day are generated after every day. For example, when you set the report start date to 2011-08-10, the first daily report is generated at 04:00 AM on 08/11/2011, and data collected between 08/10/2011 and 08/11/2011 is displayed in the report.
· Weekly—When you select the Weekly schedule type, reports from the previous seven days are generated after every seven days. For example, when you set the report start date to 2011-08-10, the first weekly report is generated at 04:00 AM on 08/17/2011, and data collected between 08/10/2011 and 08/16/2011 is displayed in the report.
· Monthly—When you select the Monthly schedule type, reports from the previous month are generated after every month. For example, when you set the report start date to 2011-08-10, the first monthly report is generated at 04:00 AM on 09/10/2011, and data collected between 08/10/2011 and 09/10/2011 is displayed in the report.
· Quarterly—When you select the Quarterly schedule type, reports from the previous three months are generated after every three months. For example, when you set the report start date to 2011-08-10, the first quarterly report is generated at 04:00 AM on 11/10/2011, and data collected between 08/10/2011 and 11/10/2011 is displayed in the report.
· Half Yearly—When you select the Half Yearly schedule type, reports from the last half year are generated after every half year. For example, when you set the report start date to 2011-08-10, the first half yearly report is generated at 04:00 AM on 02/10/2012, and data collected between 08/10/2011 and 02/10/2012 is displayed in the report.
· Yearly—When you select the Yearly schedule type, reports from the last year are generated after every year. For example, when you set the report start date to 2011-08-10, the first yearly report is generated at 04:00 AM on 08/10/2012, and data collected between 08/10/2011 and 08/10/2012 is displayed in the report.
You can configure the report to be generated in any of the following formats:
· Adobe Acrobat Portal Document Format (PDF)
· Comma Separated Value (CSV)
· Microsoft Excel (XLS)
You can include email recipients for all scheduled reports.
When reports are scheduled, IMC generates the reports in the specified report format, emails them to specified recipients, and stores the reports for future access.
You can also access reports generated by IMC scheduling. IMC retains all scheduled reports indefinitely. Retention and deletion of all historical reports must be managed manually.
Table 32 provides a list of available reports and the service component responsible for them.
Table 32 Scheduled reports for the EAD component
|
Scheduled report |
Service component |
|
Asset Report by Software |
DAM |
|
Asset Type Report |
DAM |
|
Asset Usage Report |
DAM |
|
CPU Report |
DAM |
|
Hard Disk Capacity Report |
DAM |
|
Illegal Peripheral Use Report |
DAM |
|
Insecurity Category Statistic Report |
User Security Policy |
|
Online User Security Status Report |
User Security Policy |
|
OS Language Report |
DAM |
|
OS Version Report |
DAM |
|
Safe Log Gather Statistic Report |
User Security Policy |
|
Software Installation Report |
DAM |
|
Software Report by Asset |
DAM |
Asset Report by Software
This report allows you to query all assets on which a specified software product is installed. You can query assets only in asset groups to which you have the operation privileges.
Adding an asset report by software
1. Display the page for adding a scheduled report in one of the following ways:
¡ Click the Report tab and from the navigation tree, select Reports > Add Scheduled Report.
¡ Click the Report tab and from the navigation tree, select Scheduled Reports > All Scheduled Reports.
When the All Scheduled Reports page opens, click Add.
2. Select a template:
a. Next to the Template Name field, click Select.
b. In the Query Template area from the Type list, select EAD Service Report and click Query.
c. Select Asset Report by Software and click OK.
3. In the Scheduled Report Name field, enter the report name.
4. Select an operator group that can view the report. When you select an operator group, all operators that belong to the group can view the report.
To view the operators who belong to an operator group:
a. Next to the Access Right field, click the Operator Group Information icon ![]() .
.
The Operator Group Information page opens.
a. In the Group Name area, select one or more operator groups.
The operators that belong to the selected operator groups are displayed.
b. Click Close to return to the page for adding a report.
5. Specify the period for which report will be generated.
A scheduled report period is determined by both the schedule type and schedule time settings.
¡ Schedule Type—Select one of the following scheduling options:
- Daily
- Weekly
- Monthly
- Quarterly
- Half Yearly
- Yearly
¡ Report Start Date—Click the field to select the start date for the report in a calendar.
6. Set the time when a report becomes invalid and the EAD component no longer generates the report.
Click the End by box. Enter an end time in the format YYYY-MM-DD hh:mm. You can also click the field and select the end time in a calendar.
7. From the Report File Format list, select a report file format.
Options are PDF, CSV, MSExcel, and MSExcel (Data-only).
8. Send a report by email.
Click the Send by Email box and enter the email address of the receiver. Reports can be sent to one email address.
9. Set the software name and version.
The asset report by software allows you to query all assets on which a specified software product is installed. You can query assets only in asset groups to which you have operation privileges.
a. For the software
name, click the Set Parameter icon ![]() and enter the name
of the target software.
and enter the name
of the target software.
You can enter a complete or partial name.
b. Click OK to return to the page for adding a report.
The Set Parameter icon changes from ![]() to
to ![]() .
.
c. Click the Set Parameter
icon ![]() for the software version and enter the version number of the target software.
for the software version and enter the version number of the target software.
d. Click OK to return to the page for adding a report.
The Set Parameter icon changes from ![]() to
to ![]() .
.
10. Click OK.
Viewing a software report by asset
1. Click the Report tab.
2. From the navigation tree, select Scheduled Reports > All Scheduled Reports.
The All Scheduled Reports page opens.
3. Click the History Report icon ![]() for the asset information reports.
for the asset information reports.
The History Report page opens.
4. Click the View link to open a statistics report or save the statistics report.
Asset Report by Software parameters
¡ Report Time—Time when the report was generated.
¡ Software Name—Name of the specified software.
¡ Software Version—Version number of the specified software.
¡ Description—A brief description of the report.
Asset Report by Software fields
¡ Asset Number—Number of the asset on which the specified software is installed.
¡ Asset Name—Name of the asset on which the specified software is installed.
¡ Group Name—Name of the asset group to which the asset installed with the specified software belongs.
¡ Owner—Owner of the asset on which the specified software is installed.
¡ Software Name—Name of the specified software.
¡ Software Version—Version of the specified software.
¡ Installed On—Installation time of the specified software.
Asset type report
This report collects statistics about asset types and the number of assets of each type for all registered assets in the specified asset group, including its subgroups. The asset types are Laptop, PC, Server, Workstation, and Others. The report collects statistics about only asset groups to which the current operator has privileges.
Adding an asset type report
1. Display the page for adding a scheduled report in one of the following ways:
¡ Click the Report tab and select Reports > Add Scheduled Report from the navigation tree.
¡ Click the Report tab and select Scheduled Reports > All Scheduled Reports from the navigation tree.
When the All Scheduled Reports page opens, click Add.
2. Select a template:
a. Next to the Template Name field, click Select.
b. In the Query Template area from the Type list, select EAD Service Report and click Query.
c. Select Asset Type Report and click OK.
3. Enter the report name in the Scheduled Report Name field.
4. Select an operator group that can view the report. When you select an operator group, all operators that belong to the group can view the report.
To view the operators who belong to an operator group:
a. Next to the Access Right field, click the Operator Group
Information icon ![]() .
.
The Operator Group Information page opens.
a. In the Group Name area, select one or more operator groups.
The operators that belong to the selected operator groups are displayed.
b. Click Close to return to the page for adding a report.
5. Specify the period for which a report will be generated.
A scheduled report period is determined by both the schedule type and schedule time settings.
¡ Schedule Type—Select one of the following scheduling options:
- Daily
- Weekly
- Monthly
- Quarterly
- Half Yearly
- Yearly
¡ Report Start Date—Click the field to select the start date for the report in a calendar.
6. Set the time when a report becomes invalid and the EAD component no longer generates the report.
Click the End by box. Enter an end time in the format YYYY-MM-DD hh:mm. You can also click the field to select the end time in a calendar.
7. From the Report File Format list, select a report file format.
Options are PDF, CSV, MSExcel, and MSExcel (Data-only).
8. Send a report by email.
Click the Send by Email box and enter the email address of the receiver. Reports can be sent to one email address.
9. Set the asset group.
The asset type report collects statistics about asset types and the number of assets of each type for all registered assets in the specified asset group, including its subgroups. You can query assets only in asset groups to which you have operation privileges.
a. For the asset group, click the Set Parameter icon ![]() .
.
b. From the Parameter Value list, select an asset group.
The options are asset group names.
c. Click OK to return to the page for adding a report.
The Set Parameter icon changes from ![]() to
to ![]() .
.
10. Click OK.
Viewing asset type reports
1. Click the Report tab.
2. From the navigation tree, select Scheduled Reports > All Scheduled Reports.
The All Scheduled Reports page opens.
3. For the asset type reports, click the History Report icon ![]() .
.
The History Report page opens.
4. Click the View link to open a statistics report or save the statistics report.
Asset Type Report parameters
¡ Report Time—Time when the report was generated.
¡ Group Name—Name of the asset group. This report collects statistics about asset types and the number of assets of each type for all registered assets in the specified asset group, including its subgroups. All indicates all asset groups. The report collects statistics about only asset groups to which the current operator has privileges.
Asset Type Statistics pie chart
The asset type statistics pie chart displays the distribution of asset types. Asset types can be:
¡ PC
¡ Workstation
¡ Laptop
¡ Server
¡ Others
Asset usage report
This report collects statistics about assets which have been offline for more than the specified number of days. The report displays asset statistics of only asset groups to which the current operator has privileges.
Adding an asset usage report
1. Display the page for adding a scheduled report in one of the following ways:
¡ Click the Report tab and select Reports > Add Scheduled Report from the navigation tree.
¡ Click the Report tab and select Scheduled Reports > All Scheduled Reports from the navigation tree.
When the All Scheduled Reports page opens, click Add.
2. Select a template:
a. Next to the Template Name field, click Select.
b. In the Query Template area from the Type list, select EAD Service Report and click Query.
c. Select Asset Usage Report and click OK.
3. In the Scheduled Report Name field, enter the report name.
4. Select an operator group that can view the report. When you select an operator group, all operators that belong to the group can view the report.
To view the operators who belongs to an operator group:
a. Next to the Access Right field, click the Operator Group
Information icon ![]() .
.
The Operator Group Information page opens.
a. In the Group Name area, select one or more operator groups.
The operators that belong to the selected operator groups are displayed.
b. Click Close to return to the page for adding a report.
5. Specify the period for which a report will be generated.
A scheduled report period is determined by both the schedule type and schedule time settings.
¡ Schedule Type—Select one of the following scheduling options:
- Daily
- Weekly
- Monthly
- Quarterly
- Half Yearly
- Yearly
¡ Report Start Date—Click the field to select the start date in a calendar.
6. Set the time when a report becomes invalid and the EAD component no longer generates the report.
Click the End by box. Enter an end time in the format YYYY-MM-DD hh:mm. You can also click the field to select the end time in a calendar.
7. From the Report File Format list, select a report file format.
Options are PDF, CSV, MSExcel, and MSExcel (Data-only).
8. Send a report by email.
Click the Send by Email box and enter the email address of the receiver. Reports can be sent to one email address.
9. Set the asset idle period.
The asset usage report collects statistics about assets which have been offline for more than the specified number of days.
a. To set the idle period, click the Set Parameter
icon ![]() .
.
b. In the Parameter Value field, enter the minimum number of idle days.
c. Click OK to return to the page for adding a report.
The Set Parameter icon changes from ![]() to
to ![]() .
.
10. Click OK.
Viewing asset usage reports
1. Click the Report tab.
2. From the navigation tree, select Scheduled Reports > All Scheduled Reports.
The All Scheduled Reports page opens.
3. For the asset usage reports, click the History Report icon ![]() .
.
The History Report page opens.
4. Click the View link to open a statistics report or save the statistics report.
Asset Usage Report parameters
¡ Report Time—Time when the report was generated.
¡ Min. Idle Time—Minimum number of idle days. Assets which have been offline for more than the specified days are displayed in the report.
¡ Description—A brief description of the report.
Asset Usage Report fields
¡ Asset Number—Asset number of the idle asset.
¡ Asset Group—Name of the asset group to which the asset belongs.
¡ Owner—Owner of the asset.
¡ Management Time—Time when the asset began to be managed.
¡ Last Off-line—Last time when the asset went offline.
¡ Idle Period—Period for which the asset has been idle.
CPU report
This report collects statistics about assets whose CPU frequencies match certain criteria in the specified asset group, including its subgroups. The report displays CPU statistics of only asset groups to which the current operator has privileges.
Adding a CPU report
1. Display the page for adding a scheduled report in one of the following ways:
¡ Click the Report tab and select Reports > Add Scheduled Report from the navigation tree.
¡ Click the Report tab and select Scheduled Reports > All Scheduled Reports from the navigation tree.
When the All Scheduled Reports page opens, click Add.
2. Select a template:
a. Next to the Template Name field, click Select.
b. In the Query Template area from the Type list, select EAD Service Report, and click Query.
c. Select CPU Report and click OK.
Iin the Scheduled Report Name field, enter the report name.
3. Select an operator group that can view the report. When you select an operator group, all operators that belong to the group can view the report.
To view the operators who belong to an operator group:
a. Next to the Access Right field, click the Operator
Group Information icon ![]() .
.
The Operator Group Information page opens.
b. In the Group Name area, select one or more operator groups.
The operators that belong to the selected operator groups are displayed.
c. Click Close to return to the page for adding a report.
4. Specify the period for which a report will be generated.
A scheduled report period is determined by both the schedule type and schedule time settings.
¡ Schedule Type—Select one of the following scheduling options:
- Daily
- Weekly
- Monthly
- Quarterly
- Half Yearly
- Yearly
¡ Report Start Date—Click the field to select the start date or the report in a calendar.
5. Set the time when a report becomes invalid and the EAD component no longer generates the report.
Click the End by box. Enter an end time in the format YYYY-MM-DD hh:mm. You can also click the field to select the end time in a calendar.
6. From the Report File Format list, select a report file format.
Options are PDF, CSV, MSExcel, and MSExcel (Data-only).
7. Send a report by email.
Click the Send by Email box and enter the email address of the receiver. Reports can be sent to one email address.
8. Set the minimum CPU frequency (in MHz) and maximum CPU frequency (in MHz). The CPU report collects statistics about assets whose CPU frequencies are between the minimum frequency and the maximum frequency.
a. For the Minimum
Frequency, click the Set Parameter icon ![]() .
.
b. In the Parameter Value field, enter the minimum CPU frequency.
c. Click OK to return to the page for adding a report.
The Set Parameter icon changes from ![]() to
to ![]() .
.
d. For the Maximum
Frequency, click the Set Parameter icon ![]() .
.
e. In the Parameter Value field, enter the maximum CPU frequency.
f. Click OK to return to the page for adding a report.
The Set Parameter icon changes from ![]() to
to ![]() .
.
9. Set the asset group.
The CPU report collects statistics about the CPU frequencies of all registered assets in the specified asset group, including its subgroups.
a. For the asset group, click the Set Parameter icon ![]() .
.
b. From the Parameter Value list, select an asset group.
The options are asset group names.
c. Click OK to return to the page for adding a report.
The Set Parameter icon changes from ![]() to
to ![]() .
.
10. Click OK.
Viewing CPU reports
1. Click the Report tab.
2. From the navigation tree, select Scheduled Reports > All Scheduled Reports.
The All Scheduled Reports page opens.
3. For the CPU reports, click the History Report icon ![]() .
.
The History Report page opens.
4. Click the View link to open a statistics report or save the statistics report
CPU Report parameters
¡ Minimum Frequency—Minimum frequency (in MHz) of the CPU frequency range.
¡ Maximum Frequency—Maximum frequency (in MHz) of the CPU frequency range.
¡ Report Time—Time when the report was generated.
¡ Group Name—Name of the asset group. This report collects CPU frequency statistics for the specified asset group, including its subgroups. All indicates all asset groups. The report collects statistics about only asset groups to which the current operator has privileges.
¡ Description—A brief description of the report.
CPU Report fields
¡ Asset Number—Asset number of the asset.
¡ Asset Name—Name of the asset.
¡ Owner—Owner of the asset.
¡ CPU SN—Number of the CPU in the operating system.
¡ CPU Name—Product name of the CPU.
¡ Frequency—CPU frequency (in MHz) of the asset.
Hard disk capacity report
This report collects statistics about the number of hard disks of assets in the specified asset group, including its subgroups, and classifies the hard disks according to their capacity:
· <80 GB
· [80 GB to 160 GB)
· [160 GB to 250 GB)
· [250 GB to 500 GB)
· [500 GB to 1024 GB)
· >=1024 GB
The report displays the hard disk capacity statistics of only asset groups to which the current operator has privileges.
Adding a hard disk capacity report
1. Display the page for adding a scheduled report in one of the following ways:
¡ Click the Report tab and from the navigation tree, select Reports > Add Scheduled Report.
¡ Click the Report tab and from the navigation tree, select Scheduled Reports > All Scheduled Reports.
When the All Scheduled Reports page opens, click Add.
2. Select a template:
a. Next to the Template Name field, click Select.
b. In the Query Template area from the Type list, select EAD Service Report and click Query.
c. Select Hard Disk Capacity Report and click OK.
3. In the Scheduled Report Name field, enter the report name.
4. Select an operator group that can view the report. When you select an operator group, all operators that belong to the group can view the report.
To view the operators who belong to an operator group:
a. Next to the Access Right
field, click the Operator Group Information icon ![]() .
.
The Operator Group Information page opens.
b. In the Group Name area, select one or more operator groups.
The operators that belong to the selected operator groups are displayed.
c. Click Close to return to the page for adding a report.
5. Specify the period for which a report will be generated.
A scheduled report period is determined by both the schedule type and schedule time settings.
¡ Schedule Type—Select one of the following scheduling options:
- Daily
- Weekly
- Monthly
- Quarterly
- Half Yearly
- Yearly
¡ Report Start Date—click the field to select the start date for the report in a calendar.
6. Set the time when a report becomes invalid and the EAD component no longer generates the report.
Click the End by box. Enter an end time in the format YYYY-MM-DD hh:mm. You can also click the field to select the end time in a calendar.
7. From the Report File Format list, select a report file format.
Options are PDF, CSV, MSExcel, and MSExcel (Data-only).
8. Send a report by email.
Click the Send by Email box and enter the email address of the receiver. Reports can be sent to one email address.
9. Set the asset group.
The hard disk capacity report collects the hard disk capacity statistics of all registered assets in the specified asset group, including its subgroups.
a. For the asset group, click the Set Parameter icon ![]() .
.
b. From the Parameter Value list, select an asset group.
The options are asset group names.
c. Click OK to return to the page for adding a report.
The Set Parameter icon changes from ![]() to
to ![]() .
.
10. Click OK.
Viewing hard disk capacity reports
1. Click the Report tab.
2. From the navigation tree, select Scheduled Reports > All Scheduled Reports.
The All Scheduled Reports page opens.
3. For the hard disk capacity
reports, click the History Report icon ![]() .
.
The History Report page opens.
4. Click the View link to open a statistics report or save the statistics report.
Hard Disk Capacity Report parameters
¡ Report Time—Time when the report was generated.
¡ Group Name—Name of the asset group. This report collects the hard disk capacity statistics for the specified asset group, including its subgroups. All indicates all asset groups. The report collects statistics about only asset groups to which the current operator has privileges.
¡ Description—A brief description of the report.
Hard Disk Capacity Statistics pie chart
¡ <80 GB
¡ [80 GB to 160 GB)
¡ [160 GB to 250 GB)
¡ [250 GB to 500 GB)
¡ [500 GB to 1024 GB)
Illegal peripheral use report
This report collects statistics about illegal peripheral usage types and the times of each type for the specified asset group, including its subgroups, during a specified time range. The peripheral types are:
· USB Storage
· USB Nonstorage
· DVD/CD-ROM
· Floppy
· PCMCIA
· COM/LPT
· Infrared
· Bluetooth
· 1394
· Modem
The report displays illegal peripheral usage types and the times of each type for only asset groups to which the current operator has privileges.
Adding an illegal peripheral use report
1. Display the page for adding a scheduled report in one of the following ways:
¡ Click the Report tab and from the navigation tree, select Reports > Add Scheduled Report.
¡ Click the Report tab and from the navigation tree, select Scheduled Reports > All Scheduled Reports.
When the All Scheduled Reports page opens, click Add.
2. Select a template:
a. Next to the Template Name field, click Select.
b. In the Query Template area from the Type list, select EAD Service Report and click Query.
c. Select Illegal Peripheral Use Report and click OK.
3. Enter the report name in the Scheduled Report Name field.
4. Select an operator group that can view the report. When you select an operator group, all operators that belong to the group can view the report.
To see the operators who belong to an operator group:
a. Next to the Access Right
field, click the Operator Group Information icon ![]() .
.
The Operator Group Information page opens.
b. In the Group Name area, select one or more operator groups.
The operators that belong to the selected operator groups are displayed.
c. Click Close to return to the page for adding a report.
5. Specify the period for which a report will be generated.
A scheduled report period is determined by both the schedule type and schedule time settings.
¡ Schedule Type—Select one of the following scheduling options: Daily, Weekly, Monthly, Quarterly, Half Yearly, and Yearly.
¡ Report Start Date—Click the field to select the start date for the report in a calendar.
6. Set the time when a report becomes invalid and the EAD component no longer generates the report.
Click the End by box. Enter an end time in the format YYYY-MM-DD hh:mm. You can also click the field to select the end time in a calendar.
7. From the Report File Format list, select a report file format.
Options are PDF, CSV, MSExcel, and MSExcel (Data-only).
8. Send a report by email.
Click the Send by Email box and enter the email address of the receiver. Reports can be sent to one email address.
9. Set the begin time and end time.
The illegal peripheral use report collects statistics about the illegal peripheral usage types and the times of each type during a specified time range.
a. For the start time, click the Set Parameter icon ![]() .
.
b. From the Schedule Parameter list, select a begin time.
The options on the list depend on the schedule type configured in step 5.
- Daily—Options are Begin time, One hour after begin time through Twenty-three hours after begin time, and End time.
- Weekly—Options are Begin time, One day after begin time through Six days after begin time, and End time.
- Monthly—Options are Begin time, One day after begin time through Thirty days after begin time, and End time.
- Quarterly—Options are Begin time, One month after begin time, Two months after begin time, and End time.
- Half Yearly—Options are Begin time, One month after begin time through Five months after begin time, and End time.
- Yearly—Options are Begin time, One month after begin time through Eleven months after begin time, and End time.
c. Click OK to return to the page for adding a report.
The Set Parameter icon changes from ![]() to
to ![]() .
.
d. For the end time, click the Set Parameter icon ![]() .
.
e. From the Schedule Parameter list, select an end time. The options on the list depend on the schedule type configured in step 5.
f. Click OK to return to the page for adding a report.
The Set Parameter icon changes from ![]() to
to ![]() . The end time
must be later than the begin time.
. The end time
must be later than the begin time.
10. Set the asset group.
The illegal peripheral use report collects statistics about illegal peripheral usage types and the times of each type for assets in the specified asset group, including its subgroups.
a. For the asset group, click the Set Parameter icon ![]() .
.
b. From the Parameter Value list, select an asset group.
The options are asset group names.
c. Click OK to return to the page for adding a report.
The Set Parameter icon changes from ![]() to
to ![]() .
.
11. Click OK.
Viewing illegal peripheral use reports
1. Click the Report tab.
2. fFom the navigation tree, select Scheduled Reports > All Scheduled Reports.
The All Scheduled Reports page opens.
3. For the illegal peripheral use reports,
click the History Report icon ![]() .
.
The History Report page opens.
4. Click the View link to open a statistics report or save the statistics report.
Illegal Peripheral Use Report parameters
¡ Start Time—Start time for the report statistics.
¡ End Time—End time for the report statistics.
¡ Report Time—Time when the report was generated.
¡ Group Name—Name of the asset group. This report collects statistics about illegal peripheral usage types and the times of each type for the specified asset group, including its subgroups, during a specified time range. All indicates all asset groups. The report collects statistics about only asset groups for which the current operator has privileges.
¡ Description—A brief description of the report.
Illegal Peripheral Use Statistic pie chart
¡ USB Storage
¡ USB Nonstorage
¡ DVD/CD-ROM
¡ Floppy
¡ PCMCIA
¡ COM/LPT
¡ Infrared
¡ Bluetooth
¡ 1394
¡ Modem
Insecurity category statistic report
This report collects statistics about security check failures of each insecurity category for the current EAD node during a specified time range. An insecurity category refers to the type of reason for a security check to fail.
Adding an insecurity category statistic report
1. Display the page for adding a scheduled report in one of the following ways:
¡ Click the Report tab and from the navigation tree, select Reports > Add Scheduled Report.
¡ Click the Report tab and from the navigation tree, select Scheduled Reports > All Scheduled Reports.
When the All Scheduled Reports page opens, click Add.
2. Select a template:
a. Next to the Template Name field, click Select.
b. In the Query Template area from the Type list, select EAD Service Report and click Query.
c. Select Insecurity Category Statistic Report and click OK.
3. In the Scheduled Report Name field, enter the report name.
4. Select an operator group that can view the report. When you select an operator group, all operators that belong to the group can view the report.
To view the operators who belong to an operator group:
a. Next to the Access Right
field, click the Operator Group Information icon ![]() .
.
The Operator Group Information page opens.
b. In the Group Name area, select one or more operator groups.
The operators that belong to the operator groups are displayed.
c. Click Close to return to the page for adding a report.
5. Specify the period for which a report will be generated.
A scheduled report period is determined by both the schedule type and schedule time settings.
¡ Schedule Type—Select one of the following scheduling options:
- Daily
- Weekly
- Monthly
- Quarterly
- Half Yearly
- Yearly
¡ Report Start Date—Click the field to select the start date for the report in a calendar.
6. Set the time when a report becomes invalid and the EAD component does not generate the report.
Click the End by box. Enter an end time in the format YYYY-MM-DD hh:mm. You can also click the field to select the end time in a calendar.
7. From the Report File Format list, select a report file format.
Options are PDF, CSV, MSExcel, and MSExcel (Data-only).
8. Send a report by email.
Click the Send by Email box and enter the email address of the receiver. Reports can be sent to one email address.
9. Set the begin time and end time.
The insecurity category statistic report collects statistics about security check failures of each insecurity category during a specified time range. An insecurity category refers to the type of reason for security check failures.
a. For the start time, click the Set Parameter
icon ![]() .
.
b. From the Schedule Parameter list, select a begin time. The options on the list depend on the schedule type configured in step 5.
- Daily—Options are Begin time, One hour after begin time through Twenty-three hours after begin time, and End time.
- Weekly—Options are Begin time, One day after begin time through Six days after begin time, and End time.
- Monthly—Options are Begin time, One day after begin time through Thirty days after begin time, and End time.
- Quarterly—Options are Begin time, One month after begin time, Two months after begin time, and End time.
- Half Yearly—Options are Begin time, One month after begin time through Five months after begin time, and End time.
- Yearly—Options are Begin time, One month after begin time through Eleven months after begin time, and End time.
c. Click OK to return to the page for adding a report.
The Set Parameter icon changes from ![]() to
to ![]() .
.
d. Click the Set Parameter
icon ![]() for the end time.
for the end time.
e. From the Schedule Parameter list, select an end time. The options on the list depend on the schedule type configured in step 5.
f. Click OK to return to the page for adding a report.
The Set Parameter icon changes from ![]() to
to ![]() . The end time
must be later than the begin time.
. The end time
must be later than the begin time.
10. Click OK.
Viewing insecurity category statistic reports
1. From the navigation tree, select Scheduled Reports > All Scheduled Reports.
The All Scheduled Reports page opens.
2. For the insecurity category statistic
reports, click the History Report icon ![]() .
.
The History Report page opens.
3. Click the View link to open a statistics report or save the statistics report.
Insecurity Category Statistic Report parameters
¡ Start Time—Start time for the report statistics.
¡ End Time—End time for the report statistics.
¡ Report Time—Time when the report was generated.
¡ Description—A brief description of the report.
Insecurity Category Statistic pie chart
The insecurity category statistic pie chart displays the percentage of security check failures of each insecurity category compared to the total security check failures.
Online user security status report
This report collects statistics about the security status of all users in a user group, including its subgroups. The report collects statistics about only user groups to which the current operator has privileges. The security status of an online user can be:
· No Security Authentication Needed
· Waiting for Security Authentication
· Secure
· Insecure
· Others
Adding an online user security status report
1. Display the page for adding a scheduled report in one of the following ways:
¡ Click the Report tab and select Reports > Add Scheduled Report from the navigation tree.
¡ Click the Report tab and select Scheduled Reports > All Scheduled Reports from the navigation tree.
When the All Scheduled Reports page opens, click Add.
2. Select a template:
a. Next to the Template Name field, click Select.
b. In the Query Template area from the Type list, select EAD Service Report and click Query.
c. Select Online User Security Status Report and click OK.
3. In the Scheduled Report Name field, enter the report name.
4. Select an operator group that can view the report. When you select an operator group, all operators that belong to the group can view the report.
To view the operators who belong to an operator group:
a. Next to the Access Right field, click the Operator
Group Information icon ![]() .
.
The Operator Group Information page opens.
b. In the Group Name area, select one or more operator groups.
The operators that belong to the operator groups are displayed.
c. Click Close to return to the page for adding a report.
5. Specify the period for which a report will be generated.
A scheduled report period is determined by both the schedule type and schedule time settings.
¡ Schedule Type—Select one of the following scheduling options:
- Daily
- Weekly
- Monthly
- Quarterly
- Half Yearly
- Yearly
¡ Report Start Date—Click the field to select the start date of the report in a calendar.
6. Set the time when a report becomes invalid. The EAD component no longer generates any scheduled report.
Click the End by box. Enter an end time in the format YYYY-MM-DD hh:mm. You can also click the field to select the end time in a calendar.
7. From the Report File Format list, select a report file format.
Options are PDF, CSV, MSExcel, and MSExcel (Data-only).
8. Send a report by email.
Click the Send by Email box and enter the email address of the receiver. Reports can be sent to one email address.
9. Set the user group.
The online user security status report collects statistics about the security status of all users in a user group, including its subgroups.
a. For the user group, click the Set Parameter icon ![]() .
.
b. From the Parameter Value list, select a user group.
The options are user group names.
c. Click OK to return to the page for adding a report.
The Set Parameter icon changes from ![]() to
to ![]() .
.
10. Click OK.
Viewing online user security status reports
1. Click the Report tab.
2. From the navigation tree, select Scheduled Reports > All Scheduled Reports.
The All Scheduled Reports page opens.
3. For the online user security status reports,
click the History Report icon ![]() .
.
The History Report page opens.
4. Click the View link to open a statistics report or save the statistics report.
Online User Security Status Report parameters
¡ User Group—Name of the user group. This report collects statistics about the security status of all users in a user group, including its subgroups. All indicates all user groups. The report collects statistics about only user groups to which the current operator has privileges.
¡ Report Time—Time when the report was generated.
¡ Description—A brief description of the report.
Online User Security Status Category Statistics pie chart
¡ No Security Authentication Needed
¡ Waiting for Security Authentication
¡ Secure
¡ Insecure
OS language report
This report collects statistics about OS language types and the number of assets using each OS language type for all registered assets in the specified asset group, including its subgroups. The report collects statistics about only asset groups to which the current operator has privileges. The language types include Chinese (PRC), English, and Others.
Adding an OS language report
1. Display the page for adding a scheduled report in one of the following ways:
¡ Click the Report tab and from the navigation tree, select Reports > Add Scheduled Report.
¡ Click the Report tab and from the navigation tree, select Scheduled Reports > All Scheduled Reports.
When the All Scheduled Reports page opens, click Add.
2. Select a template:
a. Next to the Template Name field, click Select.
b. In the Query Template area from the Type list, select EAD Service Report and click Query.
c. Select OS Language Report and click OK.
3. In the Scheduled Report Name field, enter the report name.
4. Select an operator group that can view the report. When you select an operator group, all operators that belong to the group can view the report.
To view the operators who belong to an operator group:
a. Next to the Access Right field, click the Operator
Group Information icon ![]() .
.
The Operator Group Information page opens.
b. In the Group Name area, select one or more operator groups.
The operators that belong to the operator groups are displayed.
c. Click Close to return to the page for adding a report.
5. Specify the period for which a report will be generated.
A scheduled report period is determined by both the schedule type and schedule time settings.
¡ Schedule Type—Select one of the following scheduling options:
- Daily
- Weekly
- Monthly
- Quarterly
- Half Yearly
- Yearly
¡ Report Start Date—Click the field to select the start date for the report in a calendar.
6. Set the time when a report becomes invalid and the EAD component no longer generates the report.
Click the End by box. Enter an end time in the format YYYY-MM-DD hh:mm. You can also click the field to select the end time in a calendar.
7. From the Report File Format list, select a report file format.
Options are PDF, CSV, MSExcel, and MSExcel (Data-only).
8. Send a report by email.
Click the Send by Email box and enter the email address of the receiver. Reports can be sent to one email address.
9. Set the asset group.
The OS language report collects statistics about OS language types and the number of assets using each OS language type for all registered assets in the specified asset group, including its subgroups.
a. For the asset group, click the Set Parameter icon ![]() .
.
b. From the Parameter Value list, select an asset group.
The options are asset group names.
c. Click OK to return to the page for adding a report.
The Set Parameter icon changes from ![]() to
to ![]() .
.
10. Click OK.
Viewing OS language reports
1. Click the Report tab.
2. From the navigation tree, select Scheduled Reports > All Scheduled Reports.
The All Scheduled Reports page opens.
3. For the OS language reports, click the History Report icon ![]() .
.
The History Report page opens.
4. Click the View link to open a statistics report or save the statistics report.
OS Language Report parameters
¡ Report Time—Time when the report was generated.
¡ Description—A brief description of the report.
¡ Group Name—Name of the asset group.
This report collects statistics about OS language types and the number of assets using each OS language type for all registered assets in the specified asset group, including its subgroups. All indicates all asset groups. The report collects statistics about only asset groups to which the current operator has privileges.
OS Language Statistics pie chart
This report displays the distribution of OS language types of all registered assets in the specified asset group, including its subgroups. The recognizable language types include Chinese (PRC), English, and Others.
OS version report
This report collects statistics about OS versions and the number of assets running each OS version for all registered assets. It displays the distribution of the top five OS versions. The report collects statistics about only asset groups to which the current operator has privileges.
Adding an OS version report
1. Display the page for adding a scheduled report in one of the following ways:
¡ Click the Report tab and from the navigation tree, select Reports > Add Scheduled Report.
¡ Click the Report tab and from the navigation tree, select Scheduled Reports > All Scheduled Reports.
When the All Scheduled Reports page opens, click Add.
2. Select a template:
a. Next to the Template Name field, click Select.
b. In the Query Template area from the Type list, select EAD Service Report and click Query.
c. Select Online User Security Status Report and click OK.
3. In the Scheduled Report Name field, enter the report name.
4. Select an operator group that can view the report. When you select an operator group, all operators that belong to the group can view the report.
To view the operators who belong to an operator group:
a. Next to the Access Right field, click the Operator
Group Information icon ![]() .
.
The Operator Group Information page opens.
b. In the Group Name area, select one or more operator groups.
The operators that belong to the operator groups are displayed.
c. Click Close to return to the page for adding a report.
5. Specify the period for which a report will be generated.
A scheduled report period is determined by both the schedule type and schedule time settings.
¡ Schedule Type—Select one of the following scheduling options: Daily, Weekly, Monthly, Quarterly, Half Yearly, and Yearly.
¡ Report Start Date—Click the field to select the start date for the report in a calendar.
6. Set the time when a report becomes invalid and the EAD component no longer generates the report.
Click the End by box. Enter an end time in the format YYYY-MM-DD hh:mm. You can also click the field to select the end time in a calendar.
7. From the Report File Format list, select a report file format.
Options are PDF, CSV, MSExcel, and MSExcel (Data-only).
8. Send a report by email.
Click the Send by Email box and enter the email address of the receiver. Reports can be sent to one email address.
9. Click OK.
Viewing OS version reports
1. Click the Report tab.
2. From the navigation tree, select Scheduled Reports > All Scheduled Reports.
The All Scheduled Reports page opens.
3. For the OS version reports, click the History Report icon ![]() .
.
The History Report page opens.
4. To open a statistics report, click the View link or save the statistics report.
OS Version Report parameters
¡ Report Time—Time when the report was generated.
¡ Description—A brief description of the report.
OS Version Statistics pie chart
The pie chart displays the distribution of the top five OS versions for all registered assets.
Safe log gather statistic report
This report collects statistics about security logs of the current EAD node and all its child nodes, and displays the distribution of each type of insecurity event during a specified time range.
Adding a safe log gather statistic report
1. Display the page for adding a scheduled report in one of the following ways:
¡ Click the Report tab and from the navigation tree, select Reports > Add Scheduled Report.
¡ Click the Report tab and from the navigation tree, select Scheduled Reports > All Scheduled Reports.
When the All Scheduled Reports page opens, click Add.
2. Select a template:
a. Next to the Template Name field, click Select.
b. In the Query Template area from the Type list, select EAD Service Report and click Query.
c. Select Safe Log Gather Statistic Report and click OK.
3. In the Scheduled Report Name field, enter the report name.
4. Select an operator group that can view the report. When you select an operator group, all operators that belong to the group can view the report.
To view the operators who belong to an operator group:
a. Next to the Access Right field, click the Operator
Group Information icon ![]() .
.
The Operator Group Information page opens.
b. In the Group Name area, select one or more operator groups.
The operators that belong to the selected operator groups are displayed.
c. Click Close to return to the page for adding a report.
5. Specify the period for which a report will be generated.
A scheduled report period is determined by both the schedule type and schedule time settings.
¡ Schedule Type—Select one of the following scheduling options:
- Daily
- Weekly
- Monthly
- Quarterly
- Half Yearly
- Yearly
¡ Report Start Date—Click the field to select the start date for the report in a calendar.
6. Set the time when a report becomes invalid and the EAD component no longer generates the report.
Click the End by box. Enter an end time in the format YYYY-MM-DD hh:mm. You can also click the field to select the end time in a calendar.
7. From the Report File Format list, select a report file format.
Options are PDF, CSV, MSExcel, and MSExcel (Data-only).
8. Send a report by email.
Click the Send by Email box and enter the email address of the receiver. Reports can be sent to one email address.
9. Set the begin time and end time.
The safe log gather statistics report:
¡ collects statistics about security logs of the current EAD node and all its child nodes
¡ displays the distribution of each type of insecurity event during a specified time range.
a. For the begin time, click the Set Parameter icon ![]() .
.
b. Select a begin time from the Schedule Parameter list.
The options on the list depend on the schedule type configured in step 5.
- Daily— Options are Begin time, One hour after begin time through Twenty-three hours after begin time, and End time.
- Weekly— Options are Begin time, One day after begin time through Six days after begin time, and End time.
- Monthly— Options are Begin time, One day after begin time through Thirty days after begin time, and End time.
- Quarterly— Options are Begin time, One month after begin time, Two months after begin time, and End time.
- Half Yearly— Options are Begin time, One month after begin time through Five months after begin time, and End time.
- Yearly— Options are Begin time, One month after begin time through Eleven months after begin time, and End time.
c. Click OK to return to the page for adding a report.
The Set Parameter icon changes from ![]() to
to ![]() .
.
d. For the end time, click the Set Parameter icon ![]() .
.
e. From the Schedule Parameter list, select an end time. The options on the list depend on the schedule type configured in step 5.
f. Click OK to return to the page for adding a report.
The Set Parameter icon changes from ![]() to
to ![]() . The end time
must be later than the begin time.
. The end time
must be later than the begin time.
10. Set the grade node.
Safe log gather statistics report collects statistics about security logs of the node and all its child nodes.
a. For the grade node, click the Set Parameter icon ![]() .
.
b. From the Parameter Value list, select a grade node.
The options are EAD grade node names.
c. Click OK to return to the page for adding a report.
The Set Parameter icon changes from ![]() to
to ![]() .
.
11. Click OK.
Viewing safe log gather statistic reports
1. Click the Report tab.
2. From the navigation tree, select Scheduled Reports > All Scheduled Reports.
The All Scheduled Reports page opens.
3. For the safe log gather statistics reports, click
the History Report icon ![]() .
.
4. The History Report page opens.
5. To open a statistics report, click the View link or save the statistics report.
Safe Log Gather Statistic Report parameters
¡ Start Time—Start time for the report statistics.
¡ End Time—End time for the report statistics.
¡ Report Time—Time when the report was generated.
¡ Grade Node—Name of the asset group whose statistics are collected by the report. The report collects statistics about only nodes to which the current operator has privileges.
¡ Description—A brief description of the report.
Safe Log Gather Statistic pie chart
¡ Anti-virus software
¡ Anti-spyware software
¡ Firewall software
¡ Anti-phishing software
¡ Hard disk encryption software
¡ Windows patches
¡ Patch manager
¡ Applications - software
¡ Applications - processes
¡ Applications - services
¡ Applications - files
¡ Registry
¡ Traffic
¡ OS password
¡ Sharing
¡ Asset registration
Software installation report
This report collects statistics about the software names and the number of assets with each type of software installed for all registered assets in the specified asset group, including its subgroups. The report collects statistics about only asset groups to which the current operator has privileges.
Adding a software installation report
1. Display the page for adding a scheduled report in one of the following ways:
¡ Click the Report tab and from the navigation tree, select Reports > Add Scheduled Report.
¡ Click the Report tab and from the navigation tree, select Scheduled Reports > All Scheduled Reports.
When the All Scheduled Reports page opens, click Add.
2. Select a template:
a. Next to the Template Name field, click Select.
b. In the Query Template area from the Type list, select EAD Service Report and click Query.
c. Select Software Installation Report and click OK.
3. In the Scheduled Report Name field, enter the report name.
4. Select an operator group that can view the report. When you select an operator group, all operators that belong to the group can view the report.
To view the operators who belong to an operator group:
a. Next to the Access Right field, click the Operator
Group Information icon ![]() .
.
The Operator Group Information page opens.
b. In the Group Name area, select one or more operator groups.
The operators that belong to the operator groups are displayed.
c. Click Close to return to the page for adding a report.
5. Specify the period for which a report will be generated.
A scheduled report period is determined by both the schedule type and schedule time settings.
¡ Schedule Type—Select one of the following scheduling options:
- Daily
- Weekly
- Monthly
- Quarterly
- Half Yearly
- Yearly
¡ Report Start Date—Click the field to select the start date for the report in a calendar.
6. Set the time when a report becomes invalid and the EAD component no longer generates the report.
Click the End by box. Enter an end time in the format YYYY-MM-DD hh:mm. You can also click the field to select the time in a calendar.
7. From the Report File Format list, select a report file format.
Options are PDF, CSV, MSExcel, and MSExcel (Data-only).
8. Send a report by email.
Click the Send by Email box and enter the email address of the receiver. Reports can be sent to one email address.
9. Set the asset group.
The software installation report collects statistics about the software names and the number of assets with each type of software installed for all registered assets in the specified asset group, including its subgroups.
a. For the asset group, click the Set Parameter icon ![]() .
.
b. From the Parameter Value list, select an asset group.
The options are asset group names.
c. Click OK to return to the page for adding a report.
The Set Parameter icon changes from ![]() to
to ![]() .
.
10. Click OK.
Viewing software installation reports
1. Click the Report tab.
2. From the navigation tree, select Scheduled Reports > All Scheduled Reports.
The All Scheduled Reports page opens.
3. For the software installation reports, click
the History Report icon ![]() .
.
The History Report page opens.
4. To open a statistics report, click the View link or save the statistics report.
Software Installation Report parameters
¡ Report Time—Time when the report was generated.
¡ Group Name—Name of the asset group. This report collects statistics about the software names and the number of assets with each type of software installed for all registered assets in the specified asset group, including its subgroups. All indicates all asset groups. The report collects statistics about only asset groups to which the current operator has privileges.
¡ Description—A brief description of the report.
Software Installation Report fields
¡ Software Name—Name of the software installed on the assets.
¡ Software Version—The software version. The software installation report separately collects statistics about software products with the same name but different versions.
¡ Assets—Number of assets with the software installed.
Software Report by Asset
This report allows you to query all software products that are installed on the specified asset in an asset group to which you have the operation privileges.
Adding an asset software by report
1. Display the page for adding a scheduled report in one of the following ways:
¡ Click the Report tab and from the navigation tree, select Reports > Add Scheduled Report.
¡ Click the Report tab and from the navigation tree, select Scheduled Reports > All Scheduled Reports.
When the All Scheduled Reports page opens, click Add.
2. Select a template:
a. Next to the Template Name field, click Select.
b. In the Query Template area from the Type list, select EAD Service Report and click Query.
c. Select Software Report by Asset and click OK.
3. In the Scheduled Report Name field, enter the report name.
4. Select an operator group that can view the report. When you select an operator group, all operators that belong to the group can view the report.
To view the operators who belong to an operator group:
a. Next to the Access Right field, click the Operator
Group Information icon ![]() .
.
The Operator Group Information page opens.
b. In the Group Name area, select one or more operator groups.
The operators that belong to the operator groups are displayed.
c. Click Close to return to the page for adding a report.
5. Specify the period for which a report will be generated.
A scheduled report period is determined by both the schedule type and schedule time settings.
¡ Schedule Type—Select one of the following scheduling options:
- Daily
- Weekly
- Monthly
- Quarterly
- Half Yearly
- Yearly
¡ Report Start Date—Click the field to select the start date for the report in a calendar.
6. Set the time when a report becomes invalid and the EAD component no longer generates the report.
Click the End by box. Enter an end time in the format YYYY-MM-DD hh:mm. You can also click the field to select the time in a calendar.
7. From the Report File Format list, select a report file format.
Options are PDF, CSV, MSExcel, and MSExcel (Data-only).
8. Send a report by email.
Click the Send by Email box and enter the email address of the receiver. Reports can be sent to one email address.
9. Set the asset number.
The software report by asset allows you to query all software products that are installed on the specified asset in an asset group to which you have the operation privileges.
a. For the asset number,
click the Set
Parameter icon ![]() and enter the number
of the target asset.
and enter the number
of the target asset.
b. Click OK to return to the page for adding a report.
The Set Parameter icon changes from ![]() to
to ![]() .
.
10. Click OK.
Viewing software reports
1. Click the Report tab.
2. From the navigation tree, select Scheduled Reports > All Scheduled Reports.
The All Scheduled Reports page opens.
3. For the asset information reports, click the
History Report icon ![]() .
.
The History Report page opens.
4. To open a statistics report, click the View link or save the statistics report.
Software Report by Asset parameters
¡ Report Time—Time when the report was generated.
¡ Asset Number—Number of the target asset.
¡ Asset Name—Name of the target asset.
¡ Group Name—Asset group to which the target asset belongs.
¡ Owner—Owner of the target asset.
¡ Description—A brief description of the report.
Software Report by Asset fields
¡ Software Name—Name of the software that is installed on the asset.
¡ Software Version—Version of the software that is installed on the asset.
¡ Installed On—Time when the software was installed on the asset.
Configuring service parameters
You can configure the following service parameters:
· User Security Policy service parameters—Globally effective on the User Security Policy service.
· DAM service parameters—Globally effective on the DAM service.
The following information describes how to:
· configure and tune these service parameters.
· manually validate new service parameters.
For more information about configuring MDM vendors, see "Configuring the security check for smart devices."
User security policy service parameters
Unless otherwise stated, the EAD service refers to the User Security Policy service throughout the following information.
EAD service has the following parameters:
· Patch Check Interval—Enter a number of days to wait between checks for patches. When the Patch Check Interval is set to 0, EAD checks patches for the user in every security check. Otherwise, after an access user passes a patch check, EAD excludes patch check items from security checks for that user for the number of days indicated by the Patch Check Interval. The default setting is 7 days.
· Grace Days for Patch Noncompliance—Enter how many days the user can access the network when the PC passes all security check items except the patch check. The default value of 0 indicates that the user is immediately isolated when the patch check fails. This value is valid for manual check or the check through the Microsoft server.
· Reauthentication Interval—Enter the maximum online time for users, in hours. EAD forcibly reauthenticates users whose online time exceeds this interval. The default setting is 24 hours. Set this parameter so that EAD can regularly check security items that do not support real-time monitoring.
· Real-Time Monitor Interval—Enter the interval, in seconds, at which EAD performs security checks in real time for online users, except for users who are isolated. The default setting is 60 seconds. When you set this parameter, you should consider the performance of the EAD server and endpoint users. A shorter interval requires higher performance. For more information, see "Configuring real-time monitoring."
· EAD Service Group—Select this option to enable the EAD service group function. This parameter is available only when the UAM service group function is enabled. Options are:
¡ Enable—Enables the EAD service group function.
¡ Disable—Disables the EAD service group function.
¡ Center Control—Enables administrators to centrally manage the EAD service, and allows maintainers and viewers to view the EAD service only.
· Alarm Server IP—Enter the IP address of the server to which EAD sends SNMP alarms. SNMP alarms are generated when traffic on the user endpoint exceeds the traffic thresholds defined in the traffic control policy.
· Listening Port of Alarm Server—Enter the number of the port that the alarm server uses to listen to SNMP alarms from EAD. The default value is 162.
· Send Security Syslog—Specify whether to enable EAD to send syslogs. When you select Enable, EAD checks for new security logs every hour, encapsulates them in syslogs, and sends them to the specified syslog server. The IP address of the syslog server is configured in UAM service parameters. For more information, see HPE IMC User Access Manager Administrator Guide.
· Centralized Policy Management—Select this option to centrally manage security policies in hierarchical node management.
· Data Reporting Time—Enter the time when a node reports data to its parent node each day. The default setting is 10:00. In centralized policy management, a child node must obtain the value of this parameter from its parent node, and it cannot modify the value.
· Data Lifetime—Enter how long a node keeps data reported from a child node. The default setting is 90 days. In centralized policy management, a child node must obtain the value of this parameter from its parent node, and it cannot modify the value.
· Query Security Logs Before V3.60—Specify whether operators can query security logs generated by IMC V3.60 and earlier versions. When your IMC system is upgraded from V3.60 to V5.0, the security logs of the two versions use different structures and are stored separately.
¡ Yes—EAD offers a separate query module for security logs generated by IMC V3.60 and earlier versions.
¡ No—EAD does not offer the query module, and only allows queries for security logs generated by IMC V5.0 and later versions.
· Security Logs Lifetime—Specify how many days EAD keeps security logs. The default setting is 30 days. Expired logs are deleted automatically.
· Internet Access Audit Log Keeping Time (Days)—Specify the maximum number of days an Internet access audit log is kept in the system. Every morning, the system automatically deletes logs whose lifetime exceeds the specified keeping time. The default is 30 days.
· Max Internet Access Audit Logs (10000)—Specify the maximum number of Internet access audit logs (in increments of ten thousand) that can be kept in the system. When the specified number is reached, the system automatically deletes the earliest logs from the record. The default number is ten million.
· Generate logs after the security check is passed—Select this option to enable EAD to generate security logs for access users after they pass the security check. By default, EAD does not generate security logs for those users.
Configuring EAD service parameters
1. Click the User tab.
2. From the navigation tree, select User Security Policy > System Parameters > System Settings.
The System Settings page opens.
3. Configure the EAD service parameters.
4. Click OK.
Typically, the new EAD service parameters take effect immediately.
Validating EAD service parameters
If EAD service parameters fail to take effect automatically after they are modified, they must be manually validated. The failure(s) might occur because of a network failure in distributed IMC deployment.
To validate the parameters manually, use one of the following methods.
Method 1
1. Click the User tab.
2. From the navigation tree, select User Security Policy > System Parameters > Validate.
The Validate page opens, displaying the validation result.
Method 2
1. Click the User tab.
2. From the navigation tree, select User Security Policy > Service Parameters.
3. Click the Validate link in the Service Parameters area.
The Validate page opens, displaying the validation result.
DAM service parameters
DAM service has the following parameters:
· Auto Number—Select the asset numbering mode.
The asset numbering mode can be modified only when there is no asset entity in the system database. Therefore, operators must delete all assets from the system database before they can change the asset numbering mode. For more information, see "Managing assets."
¡ Enable—Use the automatic numbering mode. In this mode, when an access user logs in, DAM automatically numbers the asset of the user and prompts the user to enter asset information (including the asset model, position, vendor, type, and description) to complete registration.
¡ Disable—Use the manual numbering mode. In this mode, operators manually specify the number, owner, and asset group for assets in DAM. When an access user logs in, the iNode client prompts the user to enter the asset number to complete registration.
· Number Prefix—Enter the prefix for automatic numbering. This parameter is displayed only when Auto Number is set to Enable. Changes to this field do not affect existing asset numbers that are automatically assigned by DAM.
· Auto Register—Select the asset registration mode. This field is displayed only when Auto Number is set to Enable.
¡ Enable—Use the automatic registration mode. In this mode, when an access user logs in, DAM automatically numbers the asset to complete asset registration without manual intervention.
¡ Disable—Use the manual registration mode. In this mode, when an access user logs in, DAM automatically numbers the asset and prompts the user to enter the asset model, position, vendor, type, and description to complete registration.
· Verify Asset—Select this option to verify assets. When asset verification is enabled, only approved assets can be registered with DAM. Disapproved assets cannot be registered and users must resubmit asset information for registration.
· Scan Interval—Enter the interval, in minutes, at which the iNode client scans assets for software and hardware changes.
· Heartbeat Interval—Enter the interval, in minutes, at which the iNode client sends a heartbeat packet to the DAM server.
· Heartbeat Retries—Enter the maximum number of times the iNode client can try to send a heartbeat packet.
· Heartbeat Retry Interval—Enter the number of seconds the iNode client waits before retransmiting a heartbeat packet to the DAM server.
The iNode client for an online asset sends heartbeat packets to the DAM server at heartbeat retry intervals. To determine whether the asset is online, the DAM server responds to the heartbeat packet within the heartbeat retry interval. If the iNode client receives no response from the DAM server within that interval, it retransmits the heartbeat packet until the Heartbeat Retry Interval value is reached. The iNode client then disconnects from the DAM server, and the DAM server waits for one more interval to determine that the asset is offline.
· Life of Log—Enter the number of days DAM keeps logs in the database including peripheral monitoring logs, printer monitoring logs, and USB monitoring logs. The DAM server deletes expired logs on a daily basis.
· Asset Change Record Lifetime—Enter the number of days DAM keeps records of asset hardware and software changes in the database. The value range for the parameter is 7 to 3650.The DAM server deletes expired records on a daily basis.
· Asset Policy Request Period—Enter the interval, in minutes, at which iNode client requests are sent for the latest asset policy information from the DAM server.
For assets that stay online for a long period of time, the iNode client sends requests for up-to-date asset policy information at a specified interval. Examples of the information requested include new DAM service parameters and software deploy tasks.
· Server Port—Enter the listening port of the DAM server. DAM uses this port to listen for packets about changes made by the operator on the IMC GUI to the DAM settings and adjusts itself accordingly. This value must be the same as that in the configuration file.
· Proxy Server Port—Enter the port used by the DAM proxy server to listen for requests from the iNode client. This value must be the same as that in the configuration file.
To modify the DAM server port and proxy server port in the configuration file:
a. Locate the file \dam\conf\server.xml in the installation path of IMC.
b. Open the file with a text editor such as Notepad.
c. Search for Service name="Dam Server" and change the value of the notifyPort parameter.
d. Search for Service name="DAM Proxy" and change the value of the listenPort parameter.
e. Restart the damserver process.
· Packets Encrypted—Select this option to enable encryption and compression of packets exchanged between the DAM server and the iNode client. Enable this function to protect data transmission.
· Desktop Asset Server Log Level—Select the lowest level of logs to be recorded by DAM. Options are Fatal, Error, Warning, Info, and Debugging, in descending order of severity. The DAM server records logs of the selected level and all higher levels. Except for troubleshooting, do not use the debugging level because it consumes system resources.
· Send Syslogs—Select this option to allow DAM to send syslogs to a syslog server.
· Syslog Server IP—Enter the IP address of the syslog server. This field is displayed only when Send Syslogs is set to Enable.
Monitoring alarm policies requires a syslog server. These policies allow the DAM server to encapsulate monitoring information within syslogs and send them to the syslog server. The iNode client reports monitoring information including changes to software and hardware assets, and unauthorized copying and printing of sensitive files. For more information, see "Configuring monitoring alarm policies."
· Report Network Connection Changes—Select this option to enable the iNode client to report asset network connection changes to DAM. These include changes to NIC serial numbers, IP addresses, DHCP statuses, gateways, MAC addresses, and subnet masks. DAM records them as asset software changes for auditing. For more information, see "Asset software change record audit."
· Asset-Access Account Binding—Specify whether DAM checks the access account bound to each asset for authentication. This parameter is available only in manual numbering mode.
¡ Enable—Allows DAM to check the access account bound to each asset for registration. When an owner is bound to the asset, DAM allows only the access account of the owner to register the asset. When no owner is bound to the asset, DAM sets the owner as the first access account that passes authentication and completes registration for the asset.
¡ Disable—Prevents DAM from checking the access account bound to each asset for authentication. When this option is selected, DAM does not restrict what access account can register an asset.
· Asset File Check Records Lifetime—Enter the number of days the asset file check records are kept in the database. The DAM server deletes expired records on a daily basis.
· Display Asset Monitoring Information—Select this option to display the query feature for asset monitoring records on the asset owner's Access Account Info page. Operators can query the asset monitoring records by hour. Enable this feature with caution because if there are large numbers of asset monitoring records in the DAM database, it might cause serious delays to the Access Account Info page. For more information about the Access Account Info page, see HPE IMC User Access Manager Administrator Guide.
· DAM Service Group—Select this option to allow operators to group DAM services together for flexible management.
· Rank Assets by Startup Time—Specify whether or not to collect asset startup time and to rank assets by startup time. Options are:
¡ Yes—The iNode client collects asset startup time, ranks assets by startup time, and informs endpoint users of the ranking result. Operators can view the startup time and ranking information on the asset details page.
¡ No—The iNode client does not collect information about asset startup time.
· Startup Time Validity (Days)—Set the valid period in days for the startup time data collected from assets. After the startup time data expires, assets are not ranked. The default value is 7. This parameter is displayed only when Rank Assets by Startup Time is set to Yes.
· Asset Report Interval (Days)—Set the interval for the iNode client to report all asset information. A value of 0 disables periodic asset reporting.
· Identify an Asset Only by Disk Serial Number—Select Enable to uniquely identify an asset by only disk serial number. When you select Disable, an asset is uniquely identified by the collaboration of the disk serial number, computer name, and client ID.
Configuring DAM service parameters
1. Click the User tab.
2. From the navigation tree, select Desktop Asset Manager > Service Parameters > System Settings.
The System Settings page opens.
3. Configure the DAM service parameters.
4. Click OK.
In general, the new DAM service parameters take effect immediately.
Validating DAM service parameters
If DAM service parameters fail to take effect automatically after they are modified, they must be manually validated. The failure might occur because of a network failure in distributed IMC deployment.
To validate the parameter manually, use one of the following methods:
Method 1
1. Click the User tab.
2. From the navigation tree, select Desktop Asset Manager > System Parameters > Validate.
3. The Validate page opens, displaying the validation result.
Method 2
1. Click the User tab.
2. From the navigation tree, select Desktop Asset Manager > Service Parameters.
3. In the Service Parameters area, click the Validate link.
The Validate page opens, displaying the validation result.
