- Table of Contents
- Related Documents
-
| Title | Size | Download |
|---|---|---|
| 01-Text | 288.23 KB |
Contents
View the automatically created network topology
Manually create a network topology
View operation logs or login logs
View real-time client locations
About the H3C Oasis platform
H3C Oasis platform is a new IT operations platform targeted at Wi-Fi operations companies, O2O enterprises, and medium- and small-sized enterprises.
H3C Oasis platform merges H3C WLAN products into one platform, allowing for online network monitoring, device O&M, O2O services operation, and seamless incorporation with third-party platforms. It offers the following benefits:
· Manageability—You can monitor the entire network in real time for fast failure location and troubleshooting, deploy services as needed to monitor employee and user traffic, and tune your running services accordingly.
· Reliability—H3C Oasis platform provides only monitor and deployment services and does not process network services. When the network connection is unavailable, the system enables the portal fail-permit feature immediately so that authenticated users can continue to access the network and unauthenticated and new users can access the network without being authenticated. In addition, the Oasis platform is deployed across data centers for data backup and it uses the microservice architecture for distributed deployment to ensure uninterrupted services.
· High security—H3C Oasis platform uses Azure IaaS for deployment and provides attack prevent, ACL, microservice VLAN, virtual firewall, application firewall, and database access control to ensure application and data security.
· Cost effective—Provides tenants with free network management and authentication services in the cloud and incorporated third-party services. Users can customize the third-party services as needed, and only some applications are charged.
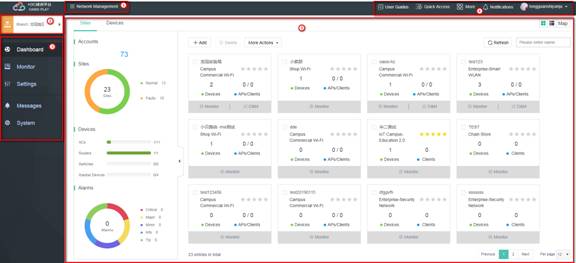
Webpage layout
The following is the webpage layout of the H3C Oasis platform:
Figure 1 Webpage layout
|
(1) Grid menu |
(2) Scenario menu |
(3) Navigation pane |
|
(4) Administrative section |
(5) Work pane |
|
· Grid menu—Contains functionality categories. If you click a category, the navigation pane displays all features and functionalities of that category.
· Scenario menu—Allows you select sites or branches as needed.
· Navigation pane—Contains menus of all features and functionalities. If you select one menu item, the right panel section displays the work pane for that item.
· Administrative section—Contains the link to access user guides, quick access functions, system notifications, and login account information.
·
Work pane—Provides an area for you to
manage, configure, and monitor the system, features, and services depending on
the menu item you select in the navigation pane. This area also allows you to
toggle among tile ![]() , list
, list ![]() , and map views as
needed.
, and map views as
needed.
Menus
Table 1 Network management
|
Level 2 |
Level 3 |
Branch |
Site |
|
|
Dashboard |
Network |
Automatically created topology |
× |
√ |
|
Manually created topology |
√ |
× |
||
|
Clients |
Guest Summary |
√ |
√ |
|
|
Guest Reports |
√ |
√ |
||
|
Guest Details |
× |
√ |
||
|
Traffic Summary |
√ |
√ |
||
|
Traffic Reports |
√ |
√ |
||
|
Traffic Details |
× |
√ |
||
|
Guest Probing |
√ |
√ |
||
|
Behavior Analysis |
√ |
√ |
||
|
Monitor |
ACs |
Summary |
× |
√ |
|
AP Summary |
√ |
√ |
||
|
AP Details |
√ |
√ |
||
|
Followers |
× |
√ |
||
|
AC Maintenance |
Upgrade |
× |
√ |
|
|
Maintenance |
× |
√ |
||
|
CLI Helper |
× |
√ |
||
|
File System |
× |
√ |
||
|
Device Logs |
× |
√ |
||
|
Restore |
× |
√ |
||
|
Bulk Upgrade |
√ |
× |
||
|
Bulk Reboot |
√ |
× |
||
|
Xiaobei Router Monitor |
Summary |
× |
√ |
|
|
Cloud Backup |
× |
√ |
||
|
Xiaobei Router Maintenance |
Optimization |
× |
√ |
|
|
Maintenance |
× |
√ |
||
|
Bulk Upgrade |
√ |
× |
||
|
Bulk Reboot |
√ |
× |
||
|
Settings |
ACs |
Wireless Services |
× |
√ |
|
App Settings |
× |
√ |
||
|
GUI |
√ |
× |
||
|
CLI |
√ |
× |
||
|
Xiaobei |
WLAN Settings |
× |
√ |
|
|
Apps |
× |
√ |
||
|
Guest Rate Limit |
× |
√ |
||
|
Operating Mode |
× |
√ |
||
|
Bulk Settings |
√ |
× |
||
|
Messages |
Alarms |
√ |
√ |
|
|
SMS Details |
√ |
√ |
||
|
Operation Logs |
√ |
√ |
||
|
System Messages |
√ |
√ |
||
|
System |
SMS Gateway |
√ |
√ |
|
|
Subaccounts |
√ |
√ |
||
|
Open Platforms |
√ |
√ |
||
|
Account |
√ |
√ |
||
Table 2 App center
|
Level 1 |
Level 2 |
|
App Center |
Reports |
|
Heatmaps |
|
|
Assets |
|
|
Data Export |
|
|
App Store |
|
|
My Apps |
|
|
Custom Apps |
|
|
Logging in to the Oasis app platform |
Restrictions and guidelines
· Some features in this document are restricted only to China mainland.
· The navigation pane menus are different if you select a branch and a site from the scenario menu. If you select a branch, you can perform bulk operations and view summary information about all sites in the branch. If you select a site, you can configure the devices in the site and view statistics about the devices.
· If you select a branch from the scenario menu and the branch contains multiple sites, you select all these sites.
·
To filter data in a table, click the filter
button ![]() and then enter a keyword in the target table header field.
and then enter a keyword in the target table header field.
· The system has predefined the Today, Yesterday, Last 7 Days, and Last 30 Days time periods. You can also manually specify a date by clicking the date twice or specify a time range. The available time period selection methods depend on the function you are using.
Manage your network
You are placed on the Network Management grid menu after you log in to the Oasis platform.
Dashboard
View the automatically created network topology
Perform this task to view the automatically created network topology for easy device management and maintenance in branches and sites.
Restrictions and guidelines
This function is supported only in 5412P01 or later versions and SmartMC must be enabled on the devices.
A registered device is a device that has been registered to the Oasis platform. An unregistered device is a device that has not been registered to the Oasis platform.
Procedure
1. Select a site from the scenario menu, and then select Dashboard > Network > Topology from the navigation pane.
2. To view the network topology, click Refresh. The system automatically obtains device information in the site and creates a topology.
3. To edit the topology, click Edit.
¡ To
add a device, click the Add button ![]() , select a device type, configure the device
name, IP address, and interface, and then click OK.
, select a device type, configure the device
name, IP address, and interface, and then click OK.
¡ To
edit a device, click the Edit button ![]() .
.
¡ To
delete a device, click the Delete button ![]() .
.
¡ To exit the topology edit page, click View.
4. To display information about APs associated with the AC, select Display AP Info. To display information about interfaces that connect APs and the AC, select Display Interface Info.
5. To export the topology, click Export As Picture in the upper right corner.
Manually create a network topology
Perform this task to manually create a network topology for easy device management and maintenance.
Procedure
1. Select a branch from the scenario menu and then select Dashboard > Network > Topology from the navigation pane.
2. To add a topology, click Add, configure topology information, and then click OK.
3. To add a device, perform either of the following tasks:
¡ Select a topology, click Edit, select a device, and then drag and drop the device.
You can drag a device in the topology to any location.
¡ Select a topology, right-click the blank area in the topology canvas and then select Add Device, select a device, and then drag and drop the device. You can drag a device in the topology to any location.
4. To edit a device, right-click on the device and then select Edit Device, configure a device alias, select a site, select a device to bind, and then click OK.
5. To connect a device, right-click on the device and then select Connect Device, select a line type, and then click OK.
6. To edit a line, right-click on the line and then select Edit Line, edit the line name and width, and then click OK.
7. To delete a device, right-click on the device and then select Delete Device.
8. To delete a line, right-click on the line and then select Delete Line.
9. To save the topology, click Save.
10. To clear the canvas, right-click on the blank area and then select Clear Canvas.
11. To delete the topology, click Delete.
12. To get help on how to edit a topology, click Help.
View client information
Perform this task to view network access information such guest and traffic statistics. You can also view unassociated clients through the WLAN probe feature.
General restrictions and guidelines
· Associated clients include clients that have passed and have not passed authentication.
· If no authentication is configured, authenticated clients are counted as 0.
· WLAN probe displays information about all clients that can be detected through WLAN probe, including associated clients.
View guest summary
Perform this task to view summary about new, regular, and total guests.
Restrictions and guidelines
· Data comparison
¡ You cannot compare statistics for the current day.
¡ You can compare guest statistics for the same site or for different sites as needed. When you compare statistics for the same site:
- You can compare the guest trend and average length of stay in one day by clicking the date twice.
- If you compare the guest trend and average length of stay in two different time ranges, the number of days in the time ranges must be the same.
¡ When you compare statistics for different sites, you can compare only statistics on the same day or in the same time range.
¡ If you specify a time range that spans multiple days, statistics about the current day are not collected.
· Guest distribution by week visit quantity/week visits trend
¡ If you select a single day, the system displays the guest data for the week that includes the specified day. For example, if you select 2018-05-23, the system displays the guest data from 2018-05-21 to 2018-05-27.
¡ If you select multiple days, the system displays the guest data for the weeks that include the specified days. For example, if you select 2018-05-20 to 2018-05-21, the system displays the guest data from 2018-05-14 to 2018-05-20 and 2018-05-21 to 2018-05-27.
Procedure
1. Select a branch or site from the scenario menu, and then select Dashboard > Clients > Guest Summary from the navigation pane.
2. To compare guest statistics in the specified time range, click Data Comparison in the Guest Trend area.
3. To compare the average length of stay for guests in the specified time range, click Data Comparison in the Average Length of Stay Trend area.
Parameters
· Guest statistics
¡ Realtime Guests: Number of guests in all sites in real time.
¡ Length of Stay per Guest: Daily length of stay per guest for each site. If you select a time range that spans more than one day, statistics on all these days are counted as a sum.
· Guest Ranking
¡ Top 5: Top 5 dates when a site has the most guests or top 5 sites with the most guests.
¡ Bottom 5: Top 5 dates when a site has the least guests or top 5 sites with the least guests. If the current day is selected, this graph displays statistics for the past 7 days.
· Online Duration Ranking: Top 10 users with the longest online duration in a single site or multiple sites.
· Guest Trend: Hourly guest trend for the selected day or the daily guest trend for the selected time range. A guest is counted as one guest even if the guest has accessed the network multiple times.
· Guest Distribution by Client Vendor: Distribution of guests by client vendor.
· Guest Distribution by SSID: Distribution of guests by SSID.
· Guest Distribution by Length of Stay: Distribution of guests by length of stay. The statistics are cumulative. For example, if a guest has accessed a site twice, the guest is counted as two guests and the length of stay is the sum of the two accesses.
· Average Length of Stay Trend: Average length of stay of all guests by day. If you select Today, the statistics for the past seven days are displayed.
· Guest Distribution by Week Visits/Week Visits Trend: Distribution of guests by number of week visits.
View guest reports
Perform this task to view daily, weekly, or monthly guest reports and export these reports for analysis.
Restrictions and guidelines
· You can select a single site or a branch that contains multiple sites.
· A daily report can display guest statistics within a maximum of 30 days (excluding today), and does not display guest visit quantity.
· A weekly report can display guest statistics within a maximum of 6 months (excluding the current week).
· A monthly report can display guest statistics from Apr. 2018 to the last month (excluding the current month) and does not display guest visit quantity.
· If you select multiple sites, you can click Site Details to view site details.
Procedure
1. Select a branch or site from the scenario menu, and then select Dashboard > Clients > Guest Reports from the navigation pane.
2. Select a time range.
Parameters
· Daily Report: Number of new, regular, and total guests and average length of stay for a single site or multiple sites by day.
· Weekly Report: Number of new, regular, and total guests, average length of stay, and number of visits for a single site or multiple sites by week.
¡ If you select a single day, the system displays the guest data for the week that includes the specified day. For example, if you select 2018-05-23, the system displays the guest data from 2018-05-21 to 2018-05-27.
¡ If you select multiple days, the system displays the guest data for the weeks that include the specified days. For example, if you select 2018-05-20 to 2018-05-21, the system displays the guest data from 2018-05-14 to 2018-05-20 and 2018-05-21 to 2018-05-27.
· Monthly Report: Number of new, regular, and total guests, and average length of stay for a single site or multiple sites by month.
View guest details
Perform this task to view online or offline client information and export the data for analysis.
Restrictions and guidelines
You can select only one site.
The tables display only default
information. To view more information, click the Columns
icon ![]() and then select the target columns to
display.
and then select the target columns to
display.
Procedure
1. Select a site from the scenario menu, and then select Dashboard > Clients > Guest Details from the navigation pane.
2. To view detailed information about associated clients, click Associated Clients.
3. To view detailed information about authenticated clients, click Authenticated Clients.
4. To view detailed information about WLAN probe, click WLAN Probe.
Parameters
· Online Clients: Detailed information about all online clients in the current site.
· Client History: Detailed information about all offline clients within the past one to seven days.
View traffic summary
Perform this task to view summary about real-time guest traffic or guest traffic trend in the specified time range and compare traffic statistics in one site or between different sites.
Restrictions and guidelines
· If you specify a time range that spans multiple days, day-on-day statistics are not displayed.
· If you select Today, the statistics for the past seven days are displayed.
· You cannot compare statistics for the current day.
· You can compare traffic statistics for the same site or for different sites as needed. When you compare statistics for one site:
¡ You can compare the traffic statistics in one day by clicking the date twice.
¡ If you compare the traffic statistics in two different time ranges, the number of days in the time ranges must be the same.
· When you compare statistics for different sites, you can compare only statistics on the same day or in the same time range.
Procedure
1. Select a branch or site from the scenario menu, and then select Dashboard > Clients > Traffic Summary from the navigation pane.
2. To compare traffic statistics in the specified time range, click Data Comparison in the Total Traffic Trend area.
3. To compare traffic statistics per person in the specified time range, click Data Comparison in the Total Traffic Trend or Trend for Traffic per Person area.
Parameters
· Traffic statistics: Total upload and download traffic, upload and download traffic per person, and day-on-day traffic ratio and peak traffic within 30 days.
· Total Traffic Ranking: Top 5 and bottom 5 traffic by day or by site.
· Client Traffic Ranking: Top 10 traffic by client or by site.
· Rank of Traffic per Person: Top 5 and bottom 5 traffic per person by day or by site.
View traffic reports
Perform this task to view daily, weekly, or monthly traffic reports and export these reports for analysis.
Restrictions and guidelines
· You can select a single site or a branch that contains multiple sites.
· A daily report can display traffic statistics within a maximum of 30 days (excluding today).
· A weekly report can display traffic statistics within a maximum of 6 months (excluding the current week).
· A monthly report can display traffic statistics from Apr. 2018 to the last month (excluding the current month).
· If you select multiple sites, you can click Site Details to view site details.
Procedure
1. Select a branch or site from the scenario menu, and then select Dashboard > Clients > Traffic Reports from the navigation pane.
2. Select a time range.
Parameters
· Daily Report: Total or average upload or download traffic for a single site or multiple sites by day.
· Weekly Report: Total or average upload or download traffic for a single site or multiple sites by week.
¡ If you select a single day, the system displays the traffic data for the week that includes the specified day. For example, if you select 2018-05-23, the system displays the traffic data from 2018-05-21 to 2018-05-27.
¡ If you select multiple days, the system displays the traffic data for the weeks that include the specified days. For example, if you select 2018-05-20 to 2018-05-21, the system displays the traffic data from 2018-05-14 to 2018-05-20 and 2018-05-21 to 2018-05-27.
· Monthly Report: Total or average upload or download traffic for a single site or multiple sites by month.
View traffic details
Perform this task to view online or offline client traffic information and export the data for analysis.
Restrictions and guidelines
You can select only one site.
Procedure
1. Select a site from the scenario menu and then select Dashboard > Clients > Traffic Details from the navigation pane.
2. To view detailed traffic information about associated clients, click Associated Clients.
3. To view detailed traffic information about authenticated clients, click Authenticated Clients.
Parameters
· Online Client Traffic: Detailed traffic information about all online clients in the current site.
· Client Traffic History: Detailed traffic information about all offline clients within the past one to seven days.
View guest probing statistics
Perform this task to view statistics about clients detected by WLAN probe in real time or within the specified time range.
Restrictions and guidelines
· Guest probing statistics are displayed only when WLAN probe is enabled.
· If you specify a time range that spans multiple days, statistics about the current day are not collected. To view statistics on the current day, you must select Today.
Procedure
1. Select a site from the scenario menu and then select Dashboard > Clients > Guest Probing from the navigation pane.
2. Select a time range.
Parameters
· Users: Number of associated, disassociated, active, and inactive clients detected by WLAN probe by day.
· User Statistics: Total clients quantity trend in one day or multiple days.
· Guest Distribution by Length of Stay: Distribution of guests by the length of stay.
· Guest Distribution by Client Vendor: Distribution of guests by vendor.
· Guest Distribution by Associated SSID: Distribution of guests by their associated SSID.
View user behavior analysis results
Perform this task to view users' frequently accessed websites and applications at a specific day (including today) or within the specified time range.
Restrictions and guidelines
User behavior statistics are displayed only when behavior analysis is enabled.
Procedure
1. Select a site from the scenario menu, and then select Dashboard > Clients > Behavior Analysis from the navigation pane.
2. To view detailed information about user behavior analysis, click Info in the upper right corner.
Parameters
· Website Statistics: MAC address, IP address, associated AP, association time, accessed website for clients, and the egress interface IP address.
· App Statistics: Basic app information and traffic statistics about the apps.
· User Traffic: Total uplink traffic, downlink traffic, and discarded traffic.
· Hottest Apps: Apps that users use most frequently. You can sort the apps by visits or by traffic.
· Hottest Websites: Most frequently accessed websites.
· Traffic Analysis: Total traffic, total uplink traffic, downlink traffic, and discarded traffic. The total traffic is the sum of uplink traffic and downlink traffic.
Monitor devices
Monitor ACs
Restrictions and guidelines
· If you specify a time range that spans multiple days, statistics about the current day are not collected.
· The system collects CPU and memory usage and uplink and downlink rates every 10 minutes. To view data in multiple days, shrink the horizontal scrollbar and then drag it left or right.
· To view the uplink and downlink rates at a specific time point, hover over that time point in the trend graph.
View AC summary
Perform this task to view summary about an AC and its associated APs.
Restrictions and guidelines
To obtain more information about an AC, connect the AC to the Oasis platform.
You can view operation logs within a maximum of one month.
Procedure
1. Select a site from the scenario menu, and then select Monitor > ACs > Summary from the navigation pane.
2. To view the most recent operation logs, click View More in the Operation Logs area.
3. To view detailed online and offline records, click Detailed Records in the Device Online and Offline Records area.
4. To view average values of the uplink and downlink rates, select a time range (one or multiple days), click View Average Values, and then select a time period in the Rate Statistics area.
Parameters
· Device Score
¡ Remaining Bandwidth: Ratio of the
egress bandwidth to the total available bandwidth. A lower ratio, a higher
score. To set the rated bandwidths, click ![]() next to this field.
next to this field.
¡ Online AP Ratio: Ratio of online APs to the total number of APs. More online APs, higher score.
¡ Client Rate: Rate of low-rate clients to the total number of APs. Fewer low-rate clients, higher score.
¡ Security State: Number of rogue APs in the WLAN. Less rogue APs, higher score.
¡ WLAN State: Current WLAN state. Less interference, higher score.
¡ System Health: CPU and memory usages. Lower CPU and memory usages, higher score. The system takes the lower score between them.
· Rate Statistics: Uplink and downlink rates of a device in the specified time range. To set the rated bandwidths, click Set Rated Bandwidth. After you set the rated bandwidths, the rated bandwidth values in the graph will change accordingly. You must configure the rated bandwidths to be the same those you have purchased from your service provider.
View AP summary
Restrictions and guidelines
· You can select a single site or a branch that contains multiple sites.
· The system does not count APs that go offline unexpectedly as offline APs.
Procedure
1. Select a site from the scenario menu, and then select Monitor > ACs > AP Summary from the navigation pane.
2.
To view real-time traffic ranking of all
APs, click the Info icon ![]() at the upper right corner of the Realtime AP Traffic Top 5 area.
at the upper right corner of the Realtime AP Traffic Top 5 area.
3.
To view real-time user ranking of all APs,
click the Info icon ![]() at the upper right corner of the Realtime AP User Top 5
area.
at the upper right corner of the Realtime AP User Top 5
area.
Parameters
· AP statistics: Number of online, offline, and total APs.
· Realtime AP Traffic Top 5: Top 5 APs with the most downlink traffic.
· Realtime AP User Top 5: Top 5 APs with the most associated clients.
· AP Distribution by Disassociations: Distribution of APs by the number of disassociations.
· AP Distribution by Disassociation Reason: Distribution of APs by disassociation reason.
· AP Disassociations Top 10: Top 10 APs with the most disassociations. The system counts AP disassociations by day.
View AP details
Restrictions and guidelines
You can view only event and disassociation details within 30 days.
Procedure
1. Select a site from the scenario menu, and then select Monitor > ACs > AP Details from the navigation pane. You can view AP details on the APs tab.
2. To view radio details, click the Radios tab.
3. To view AP event details, click the Events tab.
4. To view AP disassociation details, click the Disassociations tab.
5. To refresh the page, click Refresh.
6. To export AP or radio information, click Export. To export event or disassociation information, select a time range, and then click Export.
View follower information
Restrictions and guidelines
Official account statistics are displayed only after you import your official account.
Procedure
Select a site from the scenario menu, and then select Monitor > ACs > Followers from the navigation pane. You can view total number of followers, follow trend, and follow summary about your official account.
Maintain an AC
Upgrade software
1. Select a site from the scenario menu, and then select Monitor > ACs > Upgrade from the navigation pane.
2. Select an AC.
3. Select a version number, and then click Upgrade.
4. In the dialog box that opens, select an upgrade method, and then click OK. Options include Upgrade and Reboot, Upgrade, Save, and Reboot, and Upgrade Only.
5. To download a software version, select the version, and then click Offline Download.
Maintain an AC
|
|
CAUTION: During the AC reboot process, the services running on the AC will become unavailable and the data not saved on the AC will get lost. Use the Save and Reboot and Reboot functions with caution. |
To maintain an AC:
1. Select a site from the scenario menu, and then select Monitor > ACs > Maintenance from the navigation pane.
2. Select an AC.
3. To save the configuration and reboot the AC, click Save and Reboot.
4. To directly reboot the AC, click Reboot.
5. To reconnect the AC to the Oasis platform when the connection between them is abnormal, click Reset Cloud Connection.
Use the CLI helper
Restrictions and guidelines
· In non-Telnet mode, you can directly log in and configure the AC by using a username and password.
· If an error occurs in using the CLI helper (command input failure for example), click Troubleshoot in the lower right corner to resolve the issue.
· You cannot press Tab to complete a command or display logs as you can do in the CLI. Interactive operations such as saving the configuration and deleting files are not supported.
· To use Telnet mode, you must first enable Telnet on the AC.
Procedure
1. Select a site from the scenario menu, and then select Monitor > ACs > CLI Helper from the navigation pane.
2. Select an AC.
3. To view basic AC information, network information, or monitoring information, click Basic Info, Network Info, or Monitoring Info in the Common Commands area to the right of the page.
4. To enable Telnet mode, click the toggle button, click Connect, and then enter the username and password to log in to the AC.
5. To export operation records or set the cache size in Telnet mode, select Export Records or Set Cache from the Operation Records list.
Access the file system
1. Select a site from the scenario menu, and then select Monitor > ACs > File System from the navigation pane.
2. Select an AC.
3. To upload a file to the AC, make sure the AC has sufficient space, click Upload, and then select the file to upload.
4. To download a file, select the file, and then click Download.
5. To rename a file, select the file, and then click Rename. You cannot rename a folder.
6. To delete a file, select the file, and then click Delete. A deleted file cannot be restored. Use this function with caution.
View device logs
1. Select a site from the scenario menu, and then select Monitor > ACs > Device Logs from the navigation pane.
2. Select an AC.
3. Select a time range, alarm module, or log level, and then click Filter.
4. To configure device logging, click Set, enable log collection, and then set the log level.
Restore the configuration
1. Select a site from the scenario menu, and then select Monitor > ACs > Restore from the navigation pane.
2. Select an AC.
3. To add a restore point, click Create, enter the reason, and then click OK.
4. To restore the current configuration of the device to the specified restore point, select the target configuration file, and then click Restore.
5.
To view detailed information about a restore
point, click the Details icon ![]() .
.
6.
To delete a restore point, click the Delete icon ![]() .
.
Upgrade devices in bulk
Restrictions and guidelines
You can upgrade only online devices in bulk.
Procedure
1. Select a branch from the scenario menu, and then select Monitor > ACs > Bulk Upgrade from the navigation pane.
2. Select the devices to upgrade, and then click Upgrade. These devices will be upgraded to the most recent version.
3.
To view detailed information about a device,
click the More icon ![]() for the device.
for the device.
4.
To upgrade a single device, click the More icon ![]() for
the device, select the device, click Upgrade, select a version and upgrade
method, and then click OK.
for
the device, select the device, click Upgrade, select a version and upgrade
method, and then click OK.
5. To download the software version for the device, select the device, and then click Download. You will be redirected to the software download website. Select the target software version on the website.
Reboot devices in bulk
Restrictions and guidelines
· During the AC reboot process, the services running on the AC will become unavailable and the data not saved on the AC will get lost. Use the Save and Reboot and Reboot functions with caution.
· You can reboot only online ACs in bulk.
Procedure
1. Select a branch from the scenario menu, and then select Monitor > ACs > Bulk Reboot from the navigation pane.
2. Select the devices to reboot, click Reboot, and then click OK.
3.
To reboot a single device, click the Reboot icon ![]() for
the device, and then select a reboot method.
for
the device, and then select a reboot method.
Parameters
· Save Config and Reboot: Save the current configuration and reboot the device.
· Reboot: Reboot the device directly.
· Reset Cloud Connection: Reconnect the AC to the Oasis platform when the connection between them is abnormal.
Monitor Xiaobei devices
View Xiaobei device summary
Perform this task to view basic information and operating status for Xiaobei devices.
Restrictions and guidelines
· To obtain more information about an AC, connect the AC to the Oasis platform.
· If you specify a time range that spans multiple days, statistics about the current day are not collected.
· The system collects CPU and memory usage and uplink and downlink rates every 10 minutes. To view data in multiple days, shrink the horizontal scrollbar and then drag it left or right.
· To view the uplink and downlink rates at a specific time point, hover over that time point in the trend graph.
· You can view operation logs within a maximum of one month.
Procedure
1. Select a site from the scenario menu, and then select Monitor > Xiaobei > Summary from the navigation pane.
2. To view most recent operation logs, click View More in the Operation Logs area.
3. To view detailed online and offline records, click Detailed Records in the Device Online and Offline Records area.
4. To view detailed network settings for the device, click Details in the Device Network Info area.
5. To view average values of the uplink and downlink rates, select a time range (one or multiple days), click View Average Values, and then select a time period in the Rate Statistics area.
Parameters
· Device Score
¡ Bandwidth: Ratio of the egress
bandwidth to the total available bandwidth. A lower ratio, a higher score. To
set the rated bandwidths, click ![]() next to this field.
next to this field.
¡ Device Busyness: Number of online clients. Fewer online clients, higher score.
¡ High-Quality Client Ratio: Rate of low-rate clients to the total number of APs. Fewer low-rate clients, higher score.
¡ System Running State: CPU and memory usages. Lower CPU and memory usages, higher score. The system takes the lower score between them.
· Device Network Info: Radio information, device operating mode, internal Wi-Fi and commercial Wi-Fi settings, and Internet access settings.
· Rate Statistics: Uplink and downlink rates of a device in the specified time range. To set the rated bandwidths, click Set Rated Bandwidth. After you set the rated bandwidths, the rated bandwidth values in the graph will change accordingly. You must configure the rated bandwidths to be the same those you have purchased from your service provider.
Perform cloud backup
1. Select a site from the scenario menu, and then select Monitor > Xiaobei > Cloud Backup from the navigation pane.
2. To back up the settings of all APs in the site, click Back Up, and then click OK.
3. To restore the settings of all APs in the site, click Restore, and then click OK.
Maintain a Xiaobei device
Optimize the WLAN
Restrictions and guidelines
You can edit the WLAN optimization mode for a Xiaobei device only on the Web interface of the Xiaobei device.
Procedure
Select a site from the scenario menu, and then select Monitor > Xiaobei > Optimization from the navigation pane.
Parameters
· Wakeup Mode: This mode improves data throughput by disabling clients from entering sleep mode but increases power consumption. As a best practice, use this mode if high real-time performance is required.
· High-Rate Mode: This mode improves data throughput by disabling low-rate clients. As a best practice, disable this mode if wireless interference is strong.
Maintain Xiaobei devices
1. Select a site from the scenario menu, and then select Monitor > Xiaobei > Maintenance from the navigation pane.
2. Click the toggle button, set the reboot time, and then click OK.
Upgrade Xiaobei devices in bulk
Restrictions and guidelines
· You can upgrade only online devices in bulk.
· Make sure the Xiaobei devices are powered on during the upgrade process.
· Make sure the network service is not interrupted during the upgrade process.
· As a best practice, use this function only for Xiaobei device deployment.
Procedure
1. Select a branch from the scenario menu, and then select Monitor > Xiaobei > Bulk Upgrade from the navigation pane.
2. Select the devices to upgrade, and then click Upgrade. These devices will be upgraded to the most recent version.
3.
To view detailed information about a device,
click the More icon ![]() for the device.
for the device.
4.
To upgrade a single device, click the More icon ![]() for
the device, select the device, click Upgrade, select a version and upgrade
method, and then click OK.
for
the device, select the device, click Upgrade, select a version and upgrade
method, and then click OK.
5. To download the software version for the device, select the device, and then click Download. You will be redirected to the software download website. Select the target software version on the website.
6. To perform automatic upgrade, click the Automatic Upgrade toggle button. Xiaobei devices (WAP422, WAP422S, and WAP422S-OASIS) will be upgraded to the most recent version when they are reconnected to the Oasis platform or connected to the Oasis platform for the first time.
Reboot Xiaobei devices in bulk
Restrictions and guidelines
During the device reboot process, the services running on the device will become unavailable and the data not saved on the device will get lost. Use the Save and Reboot and Reboot functions with caution.
You can reboot only online Xiaobei devices in bulk.
Procedure
1. Select a branch from the scenario menu, and then select Monitor > Xiaobei > Bulk Reboot from the navigation pane.
2. Select the devices to reboot, click Reboot, and then click OK.
3.
To reboot a single device, click the Reboot icon ![]() for
the device, and then select a reboot method.
for
the device, and then select a reboot method.
Parameters
· Save Config and Reboot: Save the current configuration and reboot the device.
· Reboot: Reboot the device directly.
· Reset Cloud Connection: Reconnect the device to the Oasis platform when the connection between them is abnormal.
Configure devices
For more information about authentication and user configuration, see H3C Oasis Platform Authentication User Guide.
Configure an AC
Configure wireless services
1. Select a site from the scenario menu, and then select Settings > ACs > Wireless Services from the navigation pane.
2. Select a device from the upper right corner of the page.
3. To add a wireless service, click Add, configure wireless service settings as needed, and then click OK. To bind APs to this wireless service, you must select Yes from the Bind Wireless Service field. Then, click the Unbound APs tab, select APs (radios), and then click Bind.
4.
To bind an existing wireless service, click
the Bind icon ![]() for the wireless service, click the Unbound APs tab, select APs (radios), and then click Bind.
for the wireless service, click the Unbound APs tab, select APs (radios), and then click Bind.
5.
To unbind a wireless service, click the Bind icon ![]() for
the wireless service, select APs (radios) on the Bound APs
tab, and then click Unbound.
for
the wireless service, select APs (radios) on the Bound APs
tab, and then click Unbound.
6. To view information about bound APs, click the number in the Bound APs column.
7.
To edit a wireless service, click the Edit icon ![]() for
the wireless service.
for
the wireless service.
8.
To delete a wireless service, click the Delete icon ![]() for
the wireless service.
for
the wireless service.
9. To synchronize information about locally created wireless services to the Oasis platform, click Sync SSID Info.
You can synchronize only wireless services that have an SSID configured.
Configure service settings
Procedure
1. Select a site from the scenario menu, and then select Settings > ACs > Service Settings from the navigation pane.
2. Select a device from the upper right corner of the page.
3. Configure guest behavior analysis and WLAN probe as needed.
4. To view the collected statistics, select Dashboard > Clients > Behavior Analysis or Dashboard > Clients > Guest Probing from the navigation pane.
Parameters
· DPI Report Statistics: With DPI enabled, the device can analyze and collect statistics about guest access behaviors.
· WLAN Probe: Enables APs to report environment information to the AC.
Configure ACs
1. Select a branch from the scenario menu, and then select Settings > ACs > Bulk Settings from the navigation pane.
2. Click GUI or CLI.
|
|
CAUTION: Use the CLI function under the guidance of professionals. |
3. To add a configuration template, click Add, configure the template settings as needed, and then click Save. To apply the configuration template, click OK in the confirmation dialog box that opens, select target devices, and then click Apply.
4.
To apply a configuration template that has
been created, click the Apply icon ![]() for the template, select target devices, and
then click Apply.
for the template, select target devices, and
then click Apply.
5. To view template deployment results, click History. To reapply a history template that has failed to be applied, click Reapply. To export the history, click Export.
6.
To edit a configuration template, click the Edit icon ![]() for
the template.
for
the template.
7.
To delete a configuration template, click
the Delete icon ![]() for the template.
for the template.
Configure a Xiaobei router
Configure wireless services
Restrictions and guidelines
To avoid interference, do not configure radios on adjacent APs to use the same working channel.
Procedure
1. Select a site from the scenario menu, and then select Settings > Xiaobei > WLAN Settings from the navigation pane.
2. To configure wireless settings, click the Wireless Configuration tab, select a device from the upper right corner of the page, and configure the wireless settings as needed.
3.
To configure radio settings, click the Radio Configuration tab and select a radio mode. To edit a radio, click the Edit icon ![]() for
the radio.
for
the radio.
Parameters
· Wi-Fi Timer: Configure scheduled turn-on or turn-off of wireless services.
· Internal Wi-Fi: Configure the wireless service for internal users to manage the Xiaobei router locally. For more information about Xiaobei router login, see the installation guide for the Xiaobei router.
· Commercial Wi-Fi: Configure commercial wireless services for guests. Commercial Wi-Fi supports pushing ads to clients.
· Radio Mode: Specify the power mode. Options include:
¡ Weak—Uses only 10% of the transmit power. This mode is applicable to scenarios requiring a small coverage and low radiation.
¡ Normal—Uses 32% of the transmit power.
¡ Strong—Uses the full transmit power. This mode is applicable to scenarios that require a large coverage but do not have high requirements on radiation.
Configure service settings
Restrictions and guidelines
Only industry WAP422S-OASIS devices support audit.
The device supports only Surfilter and Exands audit.
Procedure
1. Select a site from the scenario menu, and then select Settings > Xiaobei > Service Settings from the navigation pane.
2. Configure app analysis, WLAN probe, and audit settings as needed.
3. To view the statistics, select Dashboard > Clients > Behavior Analysis or Dashboard > Clients > Guest Probing from the navigation pane.
Parameters
· DPI Report Statistics: Enables the device to analyze guest behaviors and collect statistics.
· WLAN Probe: Enable report of environment information to the Oasis platform.
· Random MAC Filtering: For security purposes, devices of some vendors use random MAC addresses to send probe requests, which might cause interference to WLAN probing. To avoid interference, enable this feature.
· Cache State: If you enable caching, the device sends WLAN probing statistics to the cache server for analysis. The cache port number is 21.
Configure guest rate limit
Procedure
1. Select a site from the scenario menu, and then select Settings > Xiaobei > Guest Rate Limit from the navigation pane.
2. Configure guest rate limit as needed.
Parameters
· Global: With global guest rate limit enabled, the device guarantees the bandwidth of internal users and rate limits commercial Wi-Fi users. This ensures that internal users can access the Internet even if the network is busy. The minimum guaranteed bandwidth for internal users cannot be lower than 1 Mbps.
· Client Based: With client-based guest rate limit enabled, the device limits the uplink and downlink rates of only commercial Wi-Fi users and do not limit the bandwidth of internal users.
Set the operating mode
Restrictions and guidelines
Only devices of version Feature 1109 or higher support this feature.
Procedure
1. Select a site from the scenario menu, and then select Settings > Xiaobei > Operating Mode from the navigation pane.
2.
Click the Edit icon ![]() for the target
device.
for the target
device.
3. Select an operating mode.
Parameters
· Normal Mode: In normal mode, the Xiaobei router operates independently. It connects to the Internet via the WAN port and connects to terminals via LAN ports.
· Bridge Mode: In bridge mode, the Xiaobei router operates as a bridge to expand wireless network coverage and it allows for more terminals. The unused LAN port can connect to terminals.
¡ Bridge Mode (Top Layer)—Uses the WAN port to connect to the Internet and uses a LAN port (LAN 1 or LAN 2) to connect to a non-top layer bridge device.
¡ Bridge Mode (Non-Top Layer)—Uses a LAN port (LAN 1 or LAN 2) to connect to a non-top layer bridge device and uses the WAN port to connect to an upper-layer bridge device.
Configure Xiaobei routers
1. Select a branch from the scenario menu, and then select Settings > Xiaobei > Bulk Settings from the navigation pane.
2. To add a bulk configuration template, click Add and then configure template settings as needed. You can configure the following settings on the page:
¡ WLAN—See "Configure wireless services."
¡ Probe—See "Configure service settings."
¡ Probe Caching—See "Configure service settings."
¡ Guest Rate Limit—See "Configure guest rate limit."
¡ Whitelist—See H3C Oasis Platform Authentication User Guide.
¡ Blacklist—See H3C Oasis Platform Authentication User Guide.
¡ Audit (Surfilter)—See "Configure service settings."
¡ Audit (Exands)—See "Configure service settings."
3.
To apply a configuration template to a site,
click the Apply to Site icon ![]() for the template, select sites, and then
click Apply.
for the template, select sites, and then
click Apply.
4.
To view configuration template application
history, click the History icon ![]() for the template.
for the template.
5.
To edit a configuration template, click the Edit icon ![]() for the template.
for the template.
6.
To delete a configuration template, click
the Delete icon ![]() for the template.
for the template.
Manage messages
Manage alarm logs
View or export alarms
1. To view alarms, select a branch from the scenario menu, and then select Messages > Alarms from the navigation pane. The Alarm List tab displays alarm statistics.
2. To export alarms, click Export.
The alarms will be exported in the .xmsl format.
Subscribe alarms
Procedure
1. Click the Subscription tab.
2. To add an alarm policy, click Add and then configure policy settings as needed.
3. To edit an alarm policy, click the Edit icon for the policy. Then, configure policy settings as needed.
Parameters
· Notification By: Select the method through which alarms are notified. Options include:
¡ SMS—To use this method, you must purchase an SMS package. For more information, see "Configure SMS gateways."
¡ WeChat—If this method is selected, click Bind Official Account to bind a WeChat official account.
¡ Email—Send alarm emails to the email addresses bound to the selected accounts.
· Triggered At: Select the time during which alarms can be notified.
· Accounts: Select the accounts that can receive the alarms.
· Alarm Info: Select types and severity levels of alarms to be notified.
Manage SMS records
1. Select a branch from the scenario menu, and then select Messages > SMS Details from the navigation pane.
2. To export the records, click Export.
3.
To delete a record, click the Delete icon ![]() for the record.
for the record.
View operation logs or login logs
1. Select a branch from the scenario menu, and then select Messages > Operation Logs from the navigation pane.
2. To view operation logs, click the Operation Logs tab. You can click User Operation Logs to view site or device import logs.
3. To view login logs, click the Login Logs tab.
View system messages
Select a branch from the scenario menu, and then select Messages > System Messages from the navigation pane.
Configure system settings
Configure SMS gateways
1. Select a branch from the scenario menu, and then select System > SMS Gateway from the navigation pane.
2. To purchase an SMS package, click Emay website to access the website at www.emay.cn.
3. To create an SMS gateway, click Add and then configure gateway settings as needed.
4. Contact Emay support to bind the SMS package to Oasis URLs oasis.h3c.com (IP address 139.217.27.153) and oasisauth.h3c.com (IP address 139.217.11.74).
Manage subaccounts
The Oasis platform provides three levels of accounts: tenants (parent accounts), level-1 subaccounts, and level-2 subaccounts. A parent account has the following permissions:
· Manage its subaccounts.
· View subaccounts and sites created by the level-1 subaccounts, if any.
· View operation logs about its subaccounts.
For a subaccount, the supported Oasis features are determined by its role and the manageable branches and sites are authorized by its parent account.
To manage subaccounts:
1. Select a branch from the scenario menu, and then select System > Subaccounts from the navigation pane.
2.
To add a subaccount, click the Add icon ![]() for the account and then configure subaccount
settings as needed.
for the account and then configure subaccount
settings as needed.
3.
To assign branch and
site permissions to a subaccount, click the Permission icon ![]() for the account and
then select branches and sites as needed.
for the account and
then select branches and sites as needed.
4.
To edit a subaccount, click the Edit icon ![]() for the account and then configure account
settings as needed.
for the account and then configure account
settings as needed.
5.
To delete a subaccount, click the Delete icon ![]() for the account.
for the account.
Configure open platforms
1. Select a branch from the scenario menu, and then select System > Open Platforms from the navigation pane.
2. To activate open APIs for third-party platforms, click Activate. The page displays the authentication key if open APIs have been activated.
3. To download the API file, click Download File. The file provides information about H3C Oasis platform APIs and the methods to configure API-related settings.
Manage your account
1. Select a branch from the scenario menu, and then select System > Account from the navigation pane.
2. Edit account settings, such as password, phone number, and profile photo, as needed.
Manage the app center
To manage the app center, hover over the
grid icon ![]() and then select App
Center.
and then select App
Center.
For more information about the Authentication feature, see H3C Oasis Platform Authentication User Guide.
Manage O&M reports
This feature enables the system to send the daily report on network operations & maintenance (O&M) to specific email addresses every day.
To manage O&M reports:
1. Select O&M Reports from the navigation pane.
2. To add a report, click Add and then configure report settings as needed.
3.
To edit a report, click the Edit icon ![]() for the report. You can edit only the report
name, site, and email addresses.
for the report. You can edit only the report
name, site, and email addresses.
4.
To delete a report, click the Delete icon ![]() for the report.
for the report.
5.
To preview a report, click the Preview icon ![]() for the report.
for the report.
Configure heatmaps
Manage maps
1. Select Heatmaps from the navigation pane.
2. To add a map, click Add on the Map Management tab, and then configure map settings as needed.
3.
To edit a map, click the Edit icon ![]() for the map. You can edit only the map name,
description, address, and scale.
for the map. You can edit only the map name,
description, address, and scale.
4.
To delete a map, click the Delete icon ![]() for the map.
for the map.
You cannot delete a map if it is used by WLAN probe. To delete such a map, first unbind the map on the Location Service tab.
Configure location services
Perform this task to configure the WLAN probe location service, which enables real-time client location display on the bound maps.
Bind a map to a site
1. Click the Location Service tab.
2.
Click the Edit Map
icon ![]() for the target site.
for the target site.
3.
Click the Map Management icon ![]() .
.
4.
Click the Bind Probe Map icon ![]() for
the target map.
for
the target map.
Edit a map bound to a site
1. Click the Location Service tab.
2.
Click the Edit Map
icon ![]() for the target site.
for the target site.
3.
Click the Map Management icon ![]() .
.
4. Click Edit for the target map.
5. Right click on the map and then perform one of the following tasks:
¡ To add an AP, click Add AP, select the target AP from the AP list, and then click Add. You can drag an AP to move its location on the map.
¡ To edit the scale, click Edit Scale.
¡ To delete the map, click Delete Map.
6. To edit an existing AP, right click on the AP. You can view AP information, edit AP coordinates, or delete the AP.
7. Click Save.
View real-time client locations
1.
Click the Edit Map
icon ![]() for the target site.
for the target site.
2. Click Client Map for the target map.
3. Right click on the map and then click Stop Updating.
4. Right click on the map and then click Start Updating.
The most up-to-date client locations will be displayed in the map.
5. To view the heatmap, click Heat at the upper right corner.
Unbind a map from a site
1.
Click the Edit Map
icon ![]() for the target site.
for the target site.
2. On the page that opens, click Del for the target map.
Manage your assets
1. Select Assets from the navigation pane.
2. To add an asset, click Add and then configure asset settings as needed.
3.
To edit an asset, click the Edit icon ![]() for the asset.
for the asset.
4. To export the asset list, click Export.
The Safari browser does not support the export feature.
5. To delete assets, select the assets and then click Delete.
Export data
1. Select Data Export from the navigation pane.
2. Select a branch or site, and then select a device from the upper right corner of the page.
3. Select the columns to export, and then click Export.
Purchase an app
1. Select App Store from the navigation pane.
2. Click the target app and the purchase the app as instructed.
View your apps
Select My Apps from the navigation pane. The page displays all apps you have purchased except for template apps. You can click an app to configure it.
Customize an app
Restrictions and guidelines
If the App Template list does not contain the required template, purchase the template from the App Store first.
Procedure
1. Select Custom App from the navigation pane.
2. Click Add, and then configure app settings as needed.
Log in to the app platform
1. Click More in the administrative section of the page, and then select App Platform.
2. Enter your Oasis platform username and password.
3. To access an app, click the app.
4.
To mark an app as a favorite, click the star
icon ![]() for the app.
for the app.
Bind a map to a site,22
Configure a Xiaobei router,17
Configure an AC,16
Configure location services,22
Configure open platforms,21
Configure SMS gateways,20
Edit a map bound to a site,23
Maintain a Xiaobei device,15
Maintain an AC,12
Manage alarm logs,19
Manage maps,22
Manage SMS records,20
Manage subaccounts,21
Manage your account,21
Manually create a network topology,4
Monitor ACs,10
Monitor Xiaobei devices,14
Unbind a map from a site,23
View client information,5
View operation logs or login logs,20
View real-time client locations,23
View system messages,20
View the automatically created network topology,4
