- Released At: 15-01-2024
- Page Views:
- Downloads:
- Related Documents
-
UniServer R4900 G3 Server Monitoring in U-Center 2.0
Configuration Example
Document version: 5W102-20230922
Copyright © 2023 New H3C Technologies Co., Ltd. All rights reserved.
No part of this manual may be reproduced or transmitted in any form or by any means without prior written consent of New H3C Technologies Co., Ltd.
Except for the trademarks of New H3C Technologies Co., Ltd., any trademarks that may be mentioned in this document are the property of their respective owners.
The information in this document is subject to change without notice.
Introduction
H3C UniServer R4900 G3 is a 2U 2-processor rack server independently developed by H3C. It is based on CPU platform of Intel Xeon Scalable Processor Series or Montage Jintide Processor Series. The server can be widely used in various fields such as the Internet, cloud computing, Internet data centers, enterprise markets, and telecommunications.
This document describes the configuration process and monitoring report of UniServer R4900 G3 server monitoring in U-Center 2.0.
Usage guidelines
Application scenarios
This document is applicable in the scenario where U-Center 2.0 monitors UniServer R4900 G3 servers in a data center environment.
Prerequisites
· Make sure the R4900 G3 server has been installed, deployed, and can start up normally.
· Make sure U-Center 2.0 has been installed and deployed.
· Make sure U-Center 2.0 can communicate with the R4900 G3 server correctly.
· To manage a server in U-Center 2.0, make sure users have IPMI protocol permissions. You can contact the server administrator to obtain the username, password, and port number.
¡ Verify if you can log in to HDM with the given username and password, as shown in Figure 1.
¡ Verify that you can view server information on webpages, as shown in Figure 2.
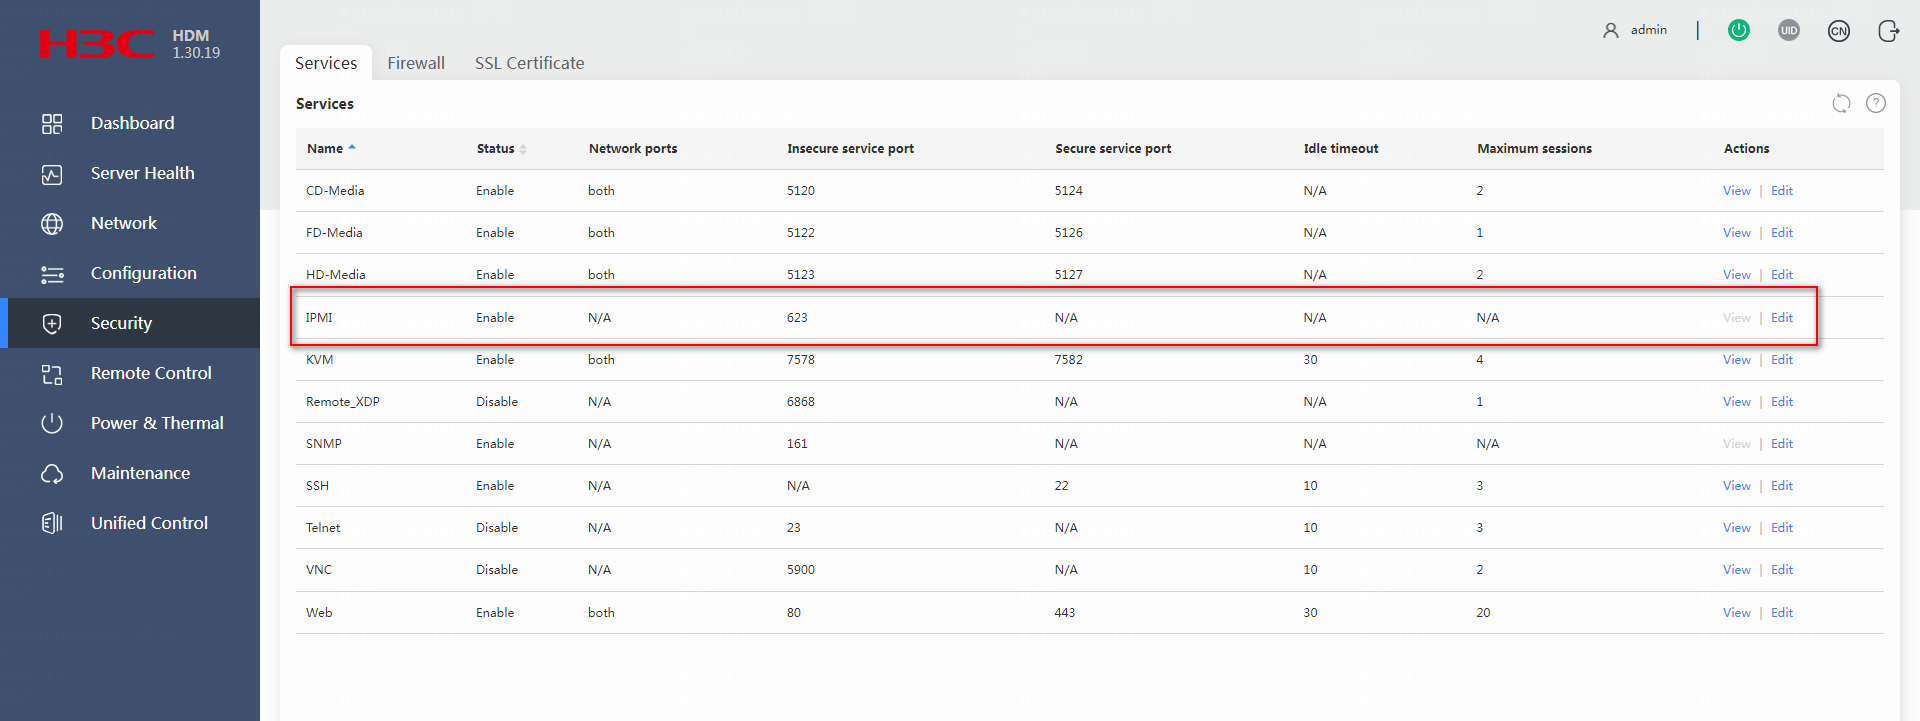
¡ The R4900 G3 server uses the default IPMI port number 623. You can access the HDM server settings menu to view or change the port number to use, as shown in Figure 3. The method for viewing or modifying the port number varies by HDM version.
|
|
NOTE: Intelligent Platform Management Interface (IPMI) is a standard used for server management systems. With this interface standard, unified management of different types of server hardware systems can be achieved. IPMI utilizes an independently powered Baseboard Management Controller (BMC) chip on the system board and its own logging system to retrieve hardware information. Due to proprietary attributes of servers from different manufacturers, supplementing IPMI with SNMP protocol and REST interface may be necessary to ensure comprehensive management of information. |
Figure 1 Logging in to the HDM server
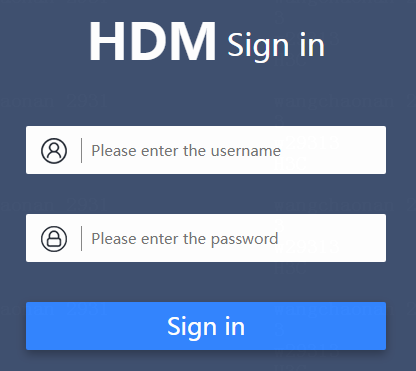
Figure 2 Basic server information
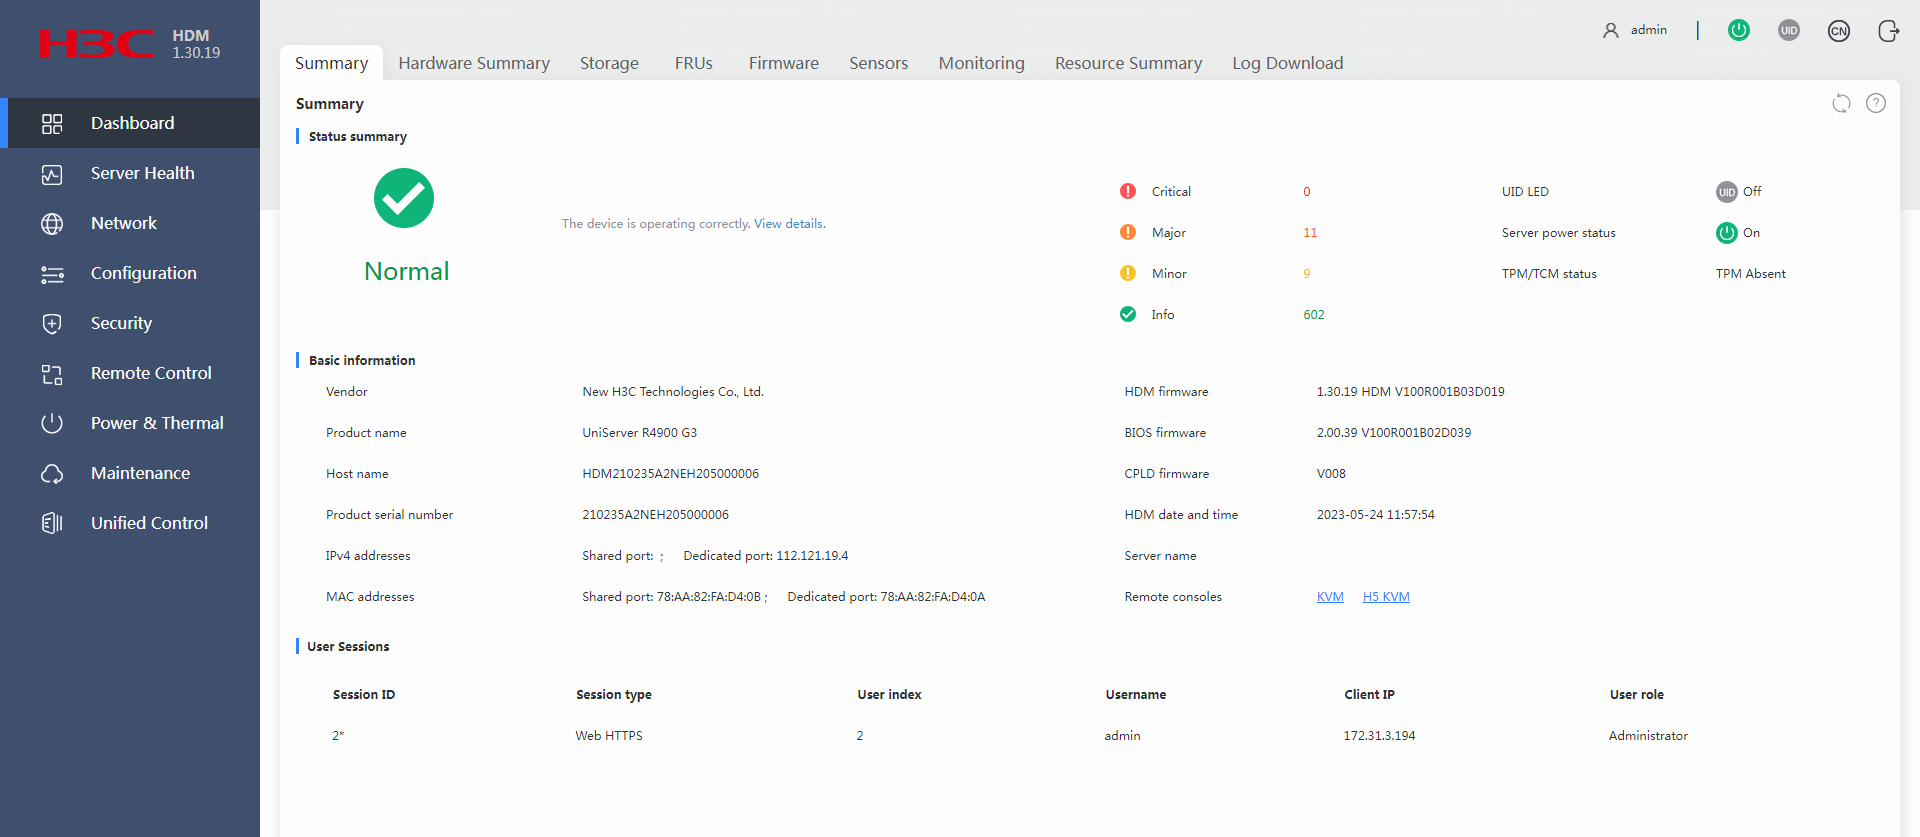
Figure 3 Viewing the service ports
Configuration example
Network configuration
As shown in Figure 4, an R4900 G3 server is installed in the DC of a company to provide services for the company. The server administrator needs to use U-Center 2.0 to monitor the R4900 G3 server, as shown in Table 1.
Figure 4 Network diagram
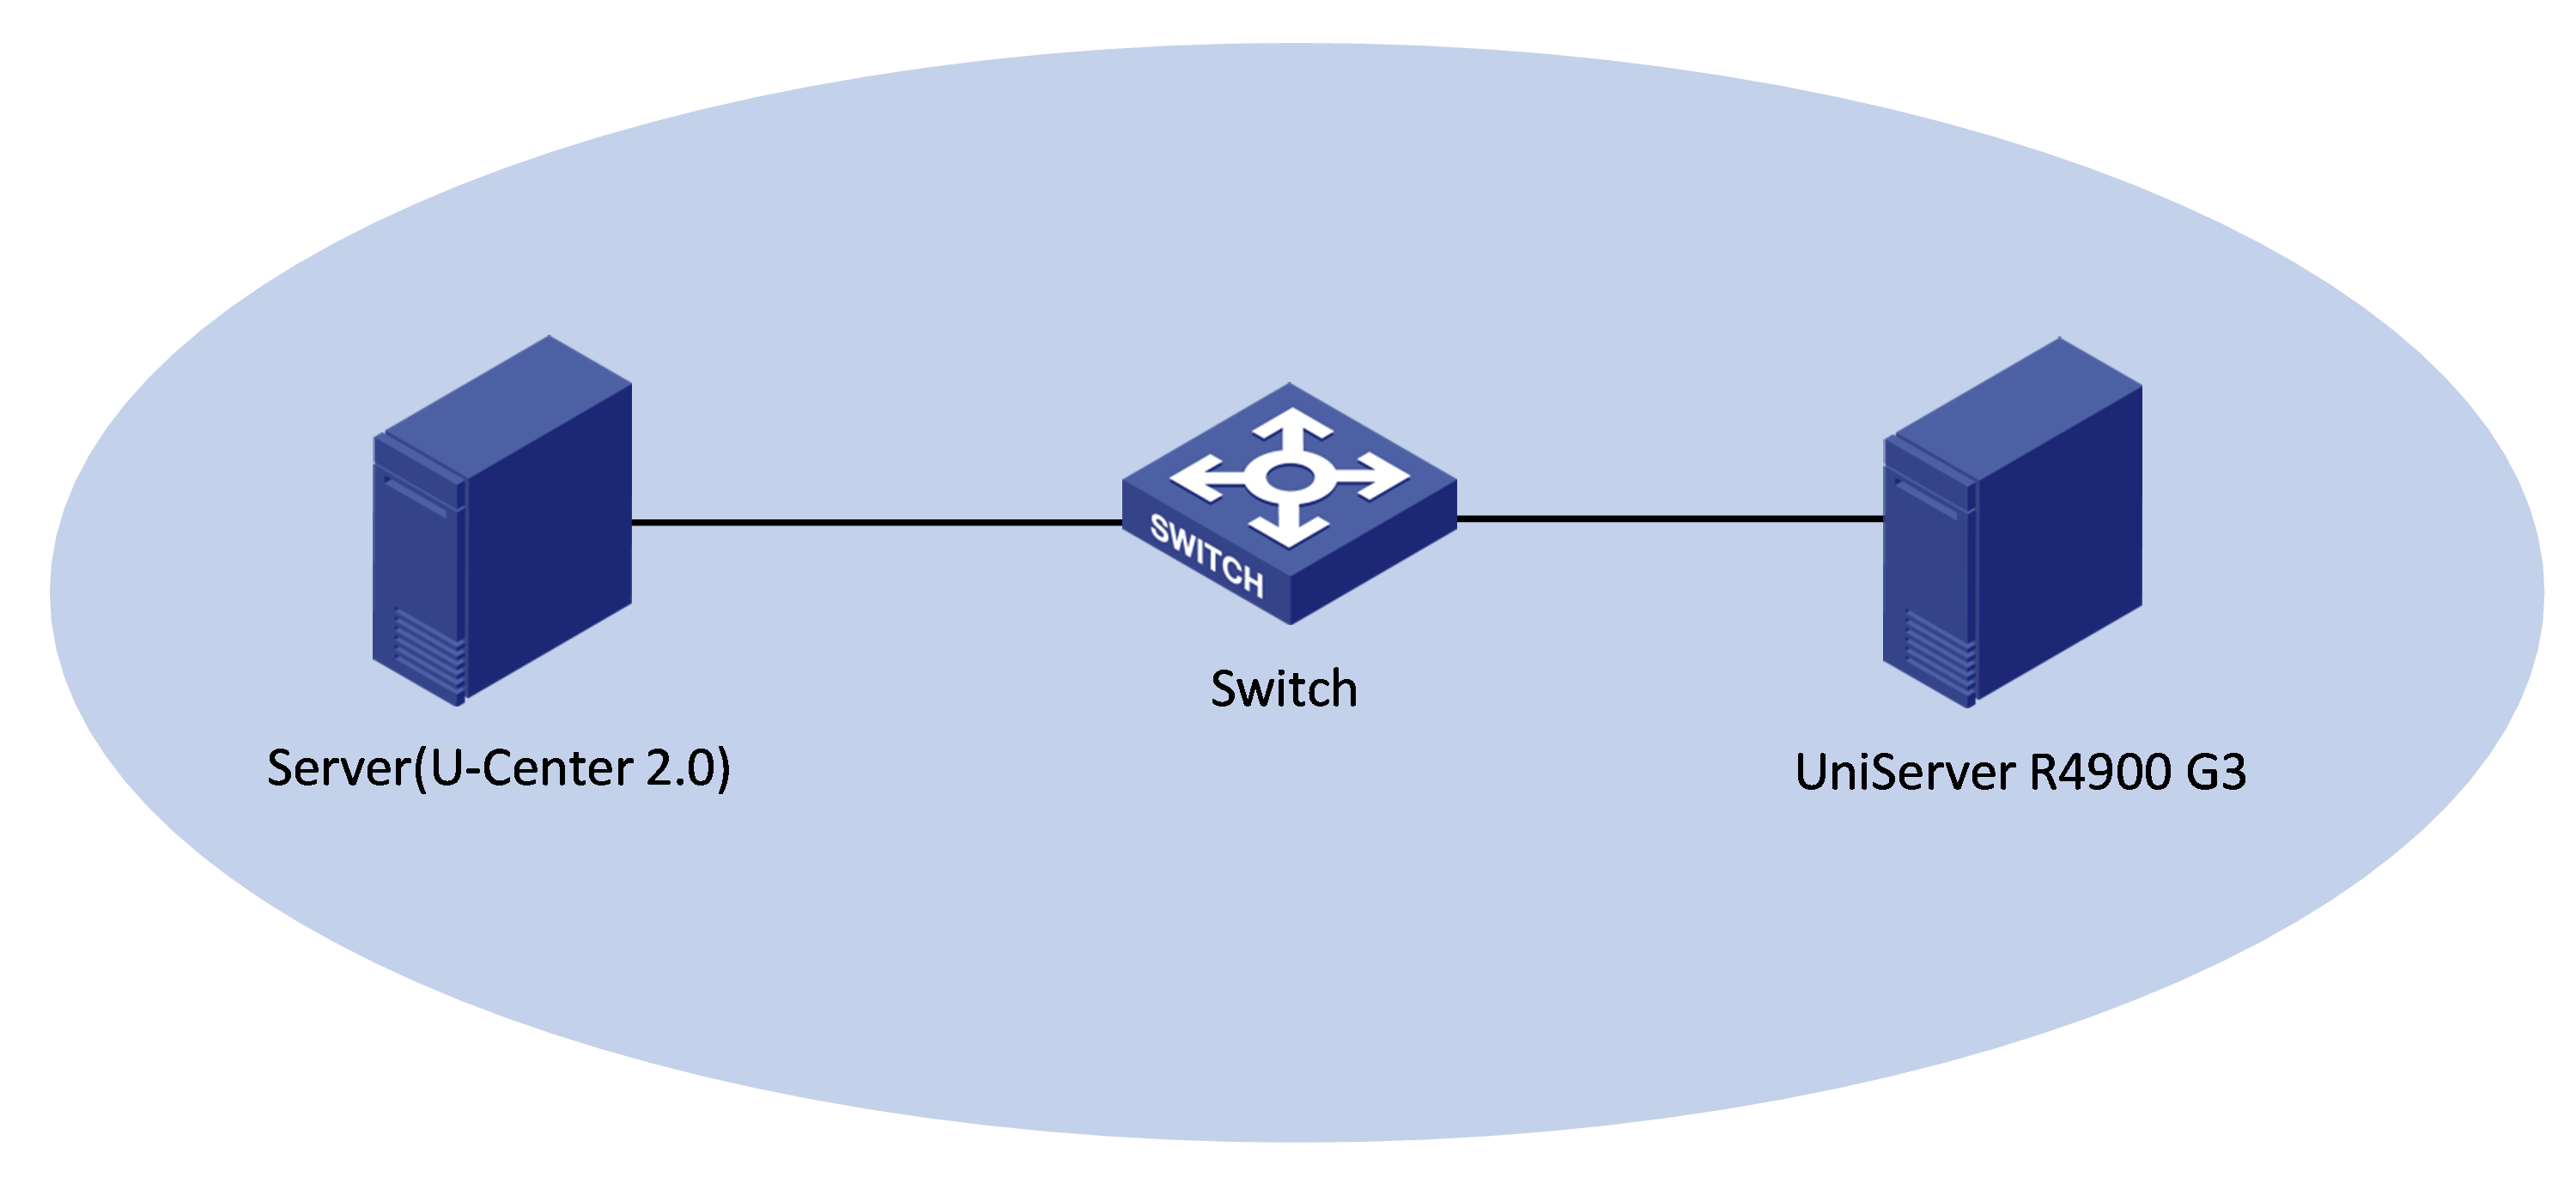
Table 1 Network deployment details
|
Host name |
IP address |
Application |
|
Server (U-Center 2.0) |
192.167.15.44 |
U-Center IOM 2.0 (E0711) |
|
UniServer R4900 G3 |
112.121.19.4 |
HDM 1.30.19 |
Procedure
Adding a server monitor
1. Log in to U-Center 2.0.
2. Click the Monitor tab.
3. From the left navigation pane, select Basic Monitor > Servers.
4. Click Add, and select H3C Server as the monitor template and UniServer R4900 G3 as the submodel.
The server monitoring adding page opens as shown in Figure 5.
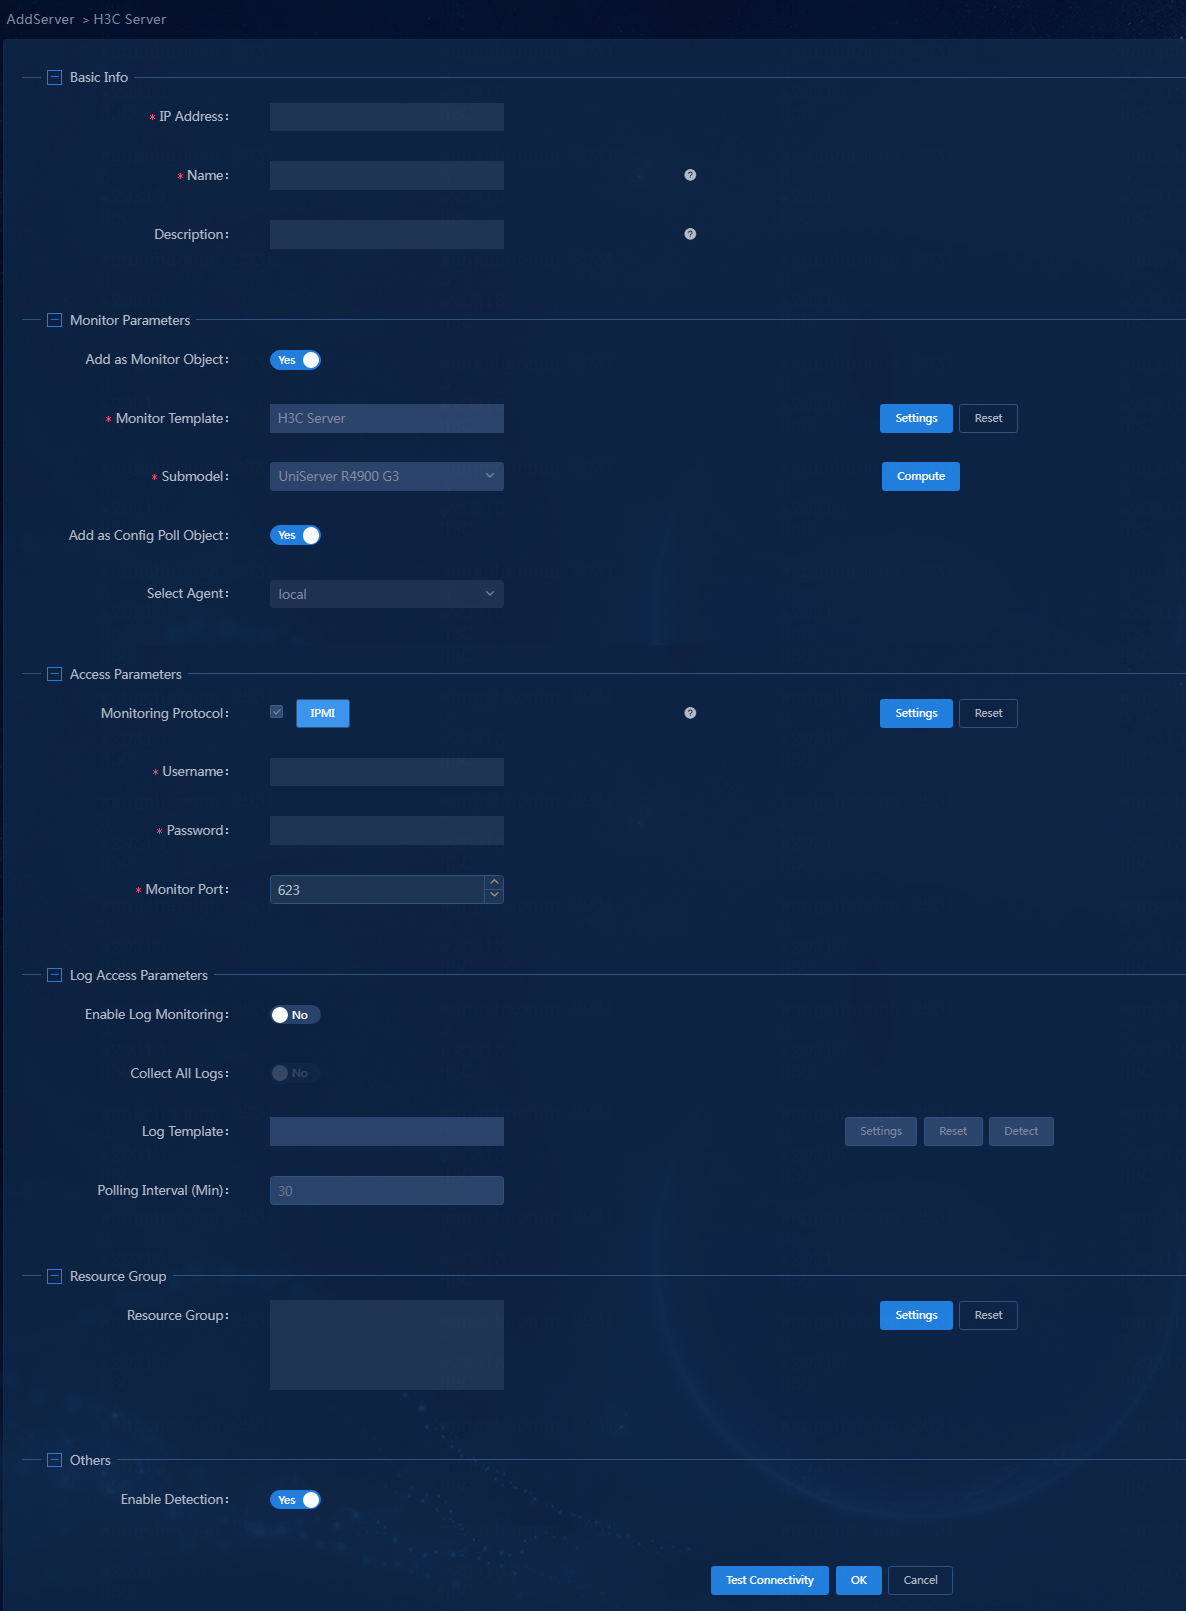
5. Configure basic information, as shown in Figure 6.
Figure 6 Configuring basic information
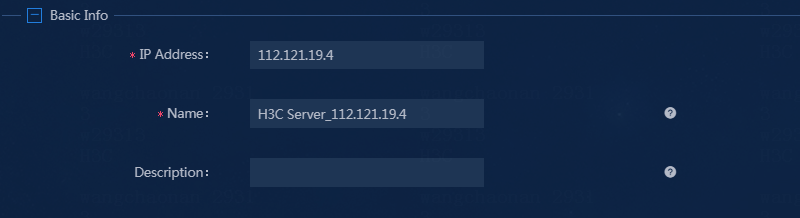
¡ IP Address: Enter the IP address of the UniServer R4900 G3 server. In this example, the address is 112.121.19.4.
¡ Name: Use the automatically generated server name in U-Center 2.0. In this example, the name is H3C Server_112.121.19.4. You can change the name as needed. This example uses the default name.
¡ Description: Enter the application description as needed. In this example, this field is empty.
6. Configure monitoring parameters, as shown in Figure 7.
Figure 7 Configuring monitoring parameters
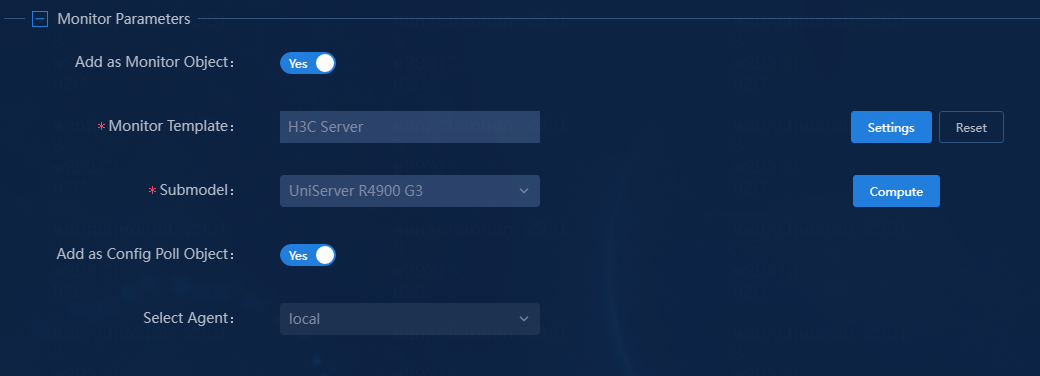
¡ Add as Monitor Object: Select whether to add resource objects as monitor objects. You must enable Add as Monitor Object, Add as Config Poll Object, or both. By default, resource objects are added as monitor objects.
¡ Monitor Template: Use the default H3C Server template predefined U-Center 2.0. You can click Settings to select another monitor template or edit the monitor template settings. For more information about how to edit a monitor template, see "Configuring an H3C Server monitor template."
¡ Submodel: Specify the model of the server to be monitored. Click Compute to calculate and obtain the unit indicator set for units that are not supported by this model.
¡ Add as Config Poll Object: By default, this option is enabled. To use the Add as Config Poll Object function, you must purchase the corresponding license for the CMDB product to obtain the quantity-based authorization and functional authorization. Without the license, the page does not display the parameter.
¡ Select Agent: Specify the management station for the monitor. The default agent is Local. In the proxy scenario, you must use proxy to incorporate applications (select Proxy as the agent for the monitor).
7. Configure access parameters, as shown in Figure 8.
Figure 8 Configuring the access parameters
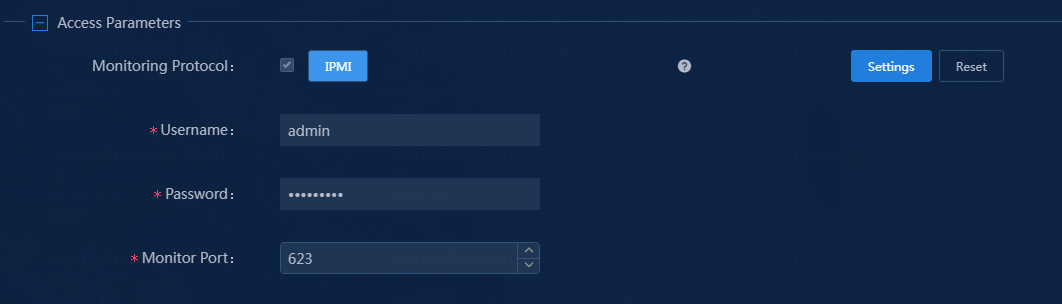
¡ Monitoring Protocol: IPMI is preset in the system. The R4900 G3 server is a pure IPMI-managed device and does not require SNMP parameter configuration.
¡ Monitor Template: Click Settings to select another monitor template or edit the monitor template settings.
¡ Username/Password: Enter the username of an HDM operator account and the password. For more information about the acquisition method and verification method, see "Prerequisites."
¡ Port: The R4900 G3 server uses the default IPMI port number 623. Enter the port number as needed. For more information about how to view and edit the port number, see "Prerequisites." This example uses the default setting.
8. Configure log access parameters, as shown in Figure 9.
Figure 9 Configuring log access parameters

¡ Enable Log Monitoring: Monitor and collect server logs. By default, this feature is disabled. This example uses the default settings.
¡ Collect All Logs: This option is configurable only when log monitoring is enabled. By default, this feature is disabled.
- If you select not to enable this feature, the system collects only logs generated afterwards.
- If you select to enable this feature, the system collects all logs, including logs that have been generated.
¡ Log Template: A template saves log access parameters to help operators quickly configure log access for servers. Click Settings to select a log template or edit log template settings.
¡ Polling Interval (Min): Interval at which server logs are collected.
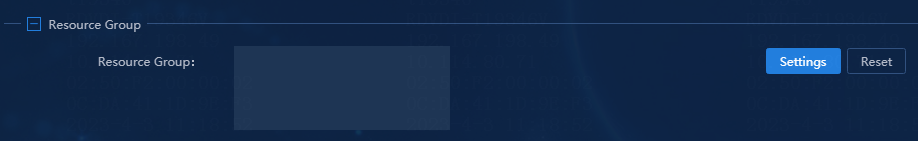
9. Configure resource group settings for the monitored object as needed to facilitate resource management, as shown in Figure 10. This parameter is not specified in this example.
Figure 10 Configuring resource group settings
10. Enable detection as needed. The default setting is enabled, as shown in Figure 11. This example uses the default settings.
Figure 11 Configuring other information

11. Click Test Connectivity to identify whether the parameters are correctly configured.
12. If the connectivity test is passed, click OK.
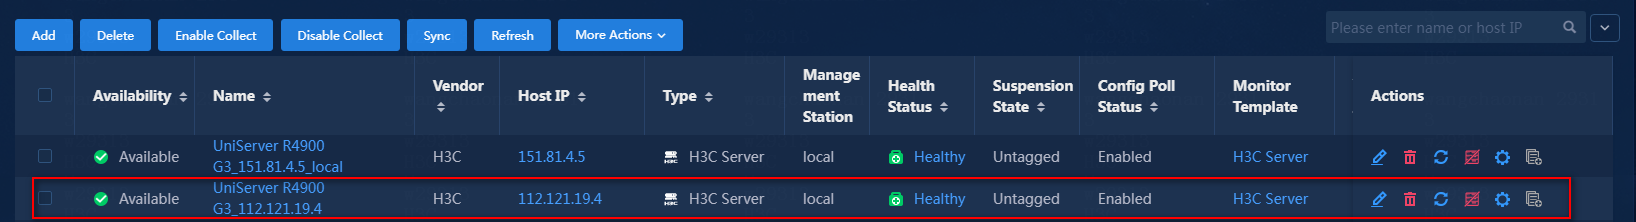
The monitoring list displays the added monitoring information, as shown in Figure 12.
Configuring an H3C Server monitor template
U-Center 2.0 uses monitor templates to control the collection indexes and their threshold values, and provides a large number of monitor templates available for use. You can also modify the monitor templates as needed for personalized monitoring.
You can set threshold values for the concerned indexes to monitor the application running status by monitoring the resource alarm status. Common operations include:
· Copy a monitor template and edit the threshold settings. For more information, see "Editing threshold settings."
· Edit the index collection interval. For more information, see "Editing the collection interval for an index."
To configure an H3C Server monitor template:
1. Click the Monitor tab.
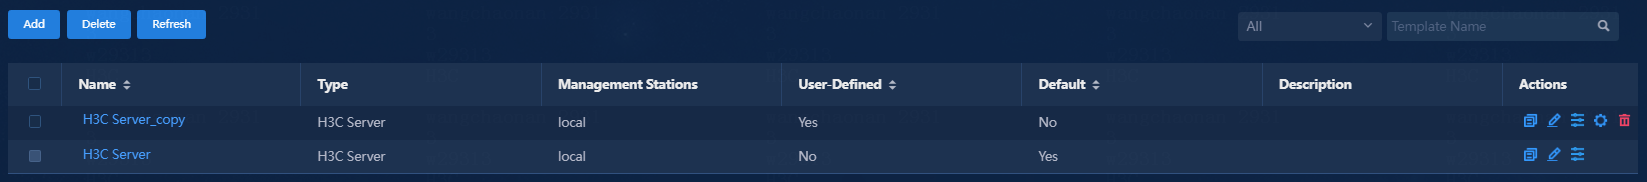
2. From the left navigation pane, select Monitor Options > Monitor Templates, as shown in Figure 13.
Figure 13 Monitor template list
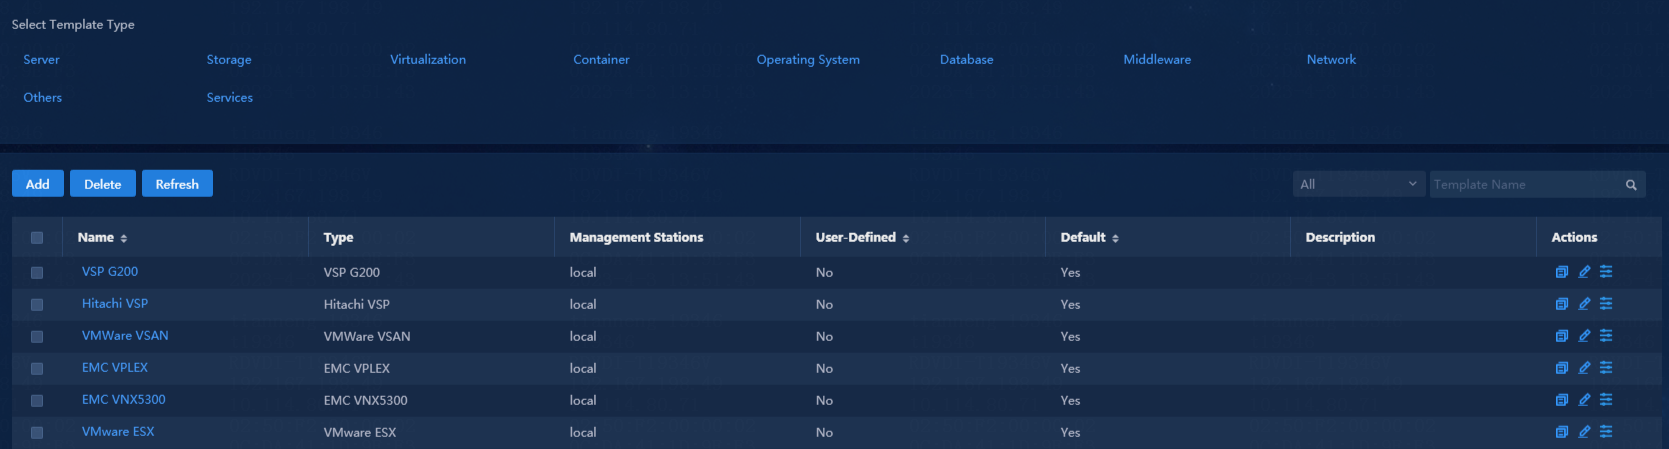
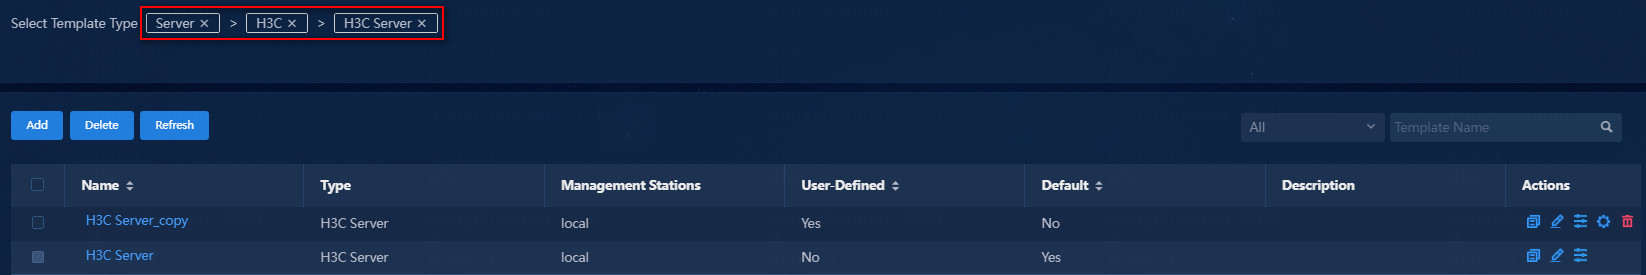
3. In the Select Template Type area, select Server > H3C > H3C Server to view the H3C Server monitor template, as shown in Figure 14. The Actions column provides the following functions:
¡ To
edit a monitor template, click the ![]() icon.
icon.
¡ To
copy a monitor template, click the ![]() icon. For
example, if you copy monitor template A, the system generates monitor template A_copy.
You can edit and save the new template on the page for copying the template.
icon. For
example, if you copy monitor template A, the system generates monitor template A_copy.
You can edit and save the new template on the page for copying the template.
¡ To
edit the threshold settings of a monitor template, click the ![]() icon.
icon.
Figure 14 Configuring an H3C Server monitor template

4. To edit a monitor template, click the ![]() icon in the Actions column, as shown in Figure 15.
icon in the Actions column, as shown in Figure 15.
Figure 15 Editing a monitor template
Editing threshold settings
As a best practice, do not edit the indexes in the predefined monitor templates of the system. As a best practice to edit multiple parameters, first copy the monitor template, edit the parameters in the copied template, and then configure the edited monitor template for the application.
This example modifies the Current Value index in Temperature index group as an example.
To edit threshold settings:
1. Click the copy icon ![]() to
access the template monitoring page.
to
access the template monitoring page.
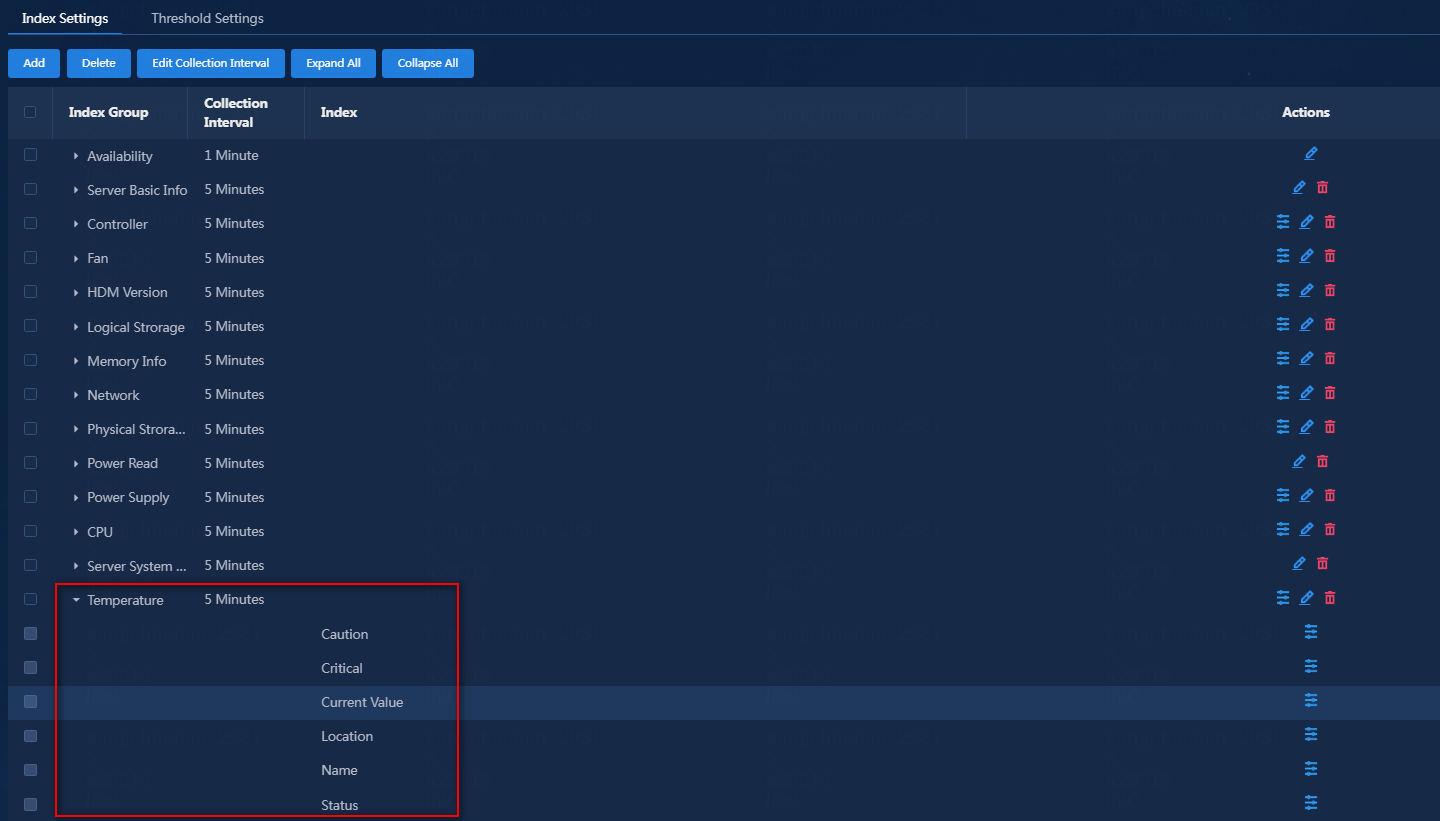
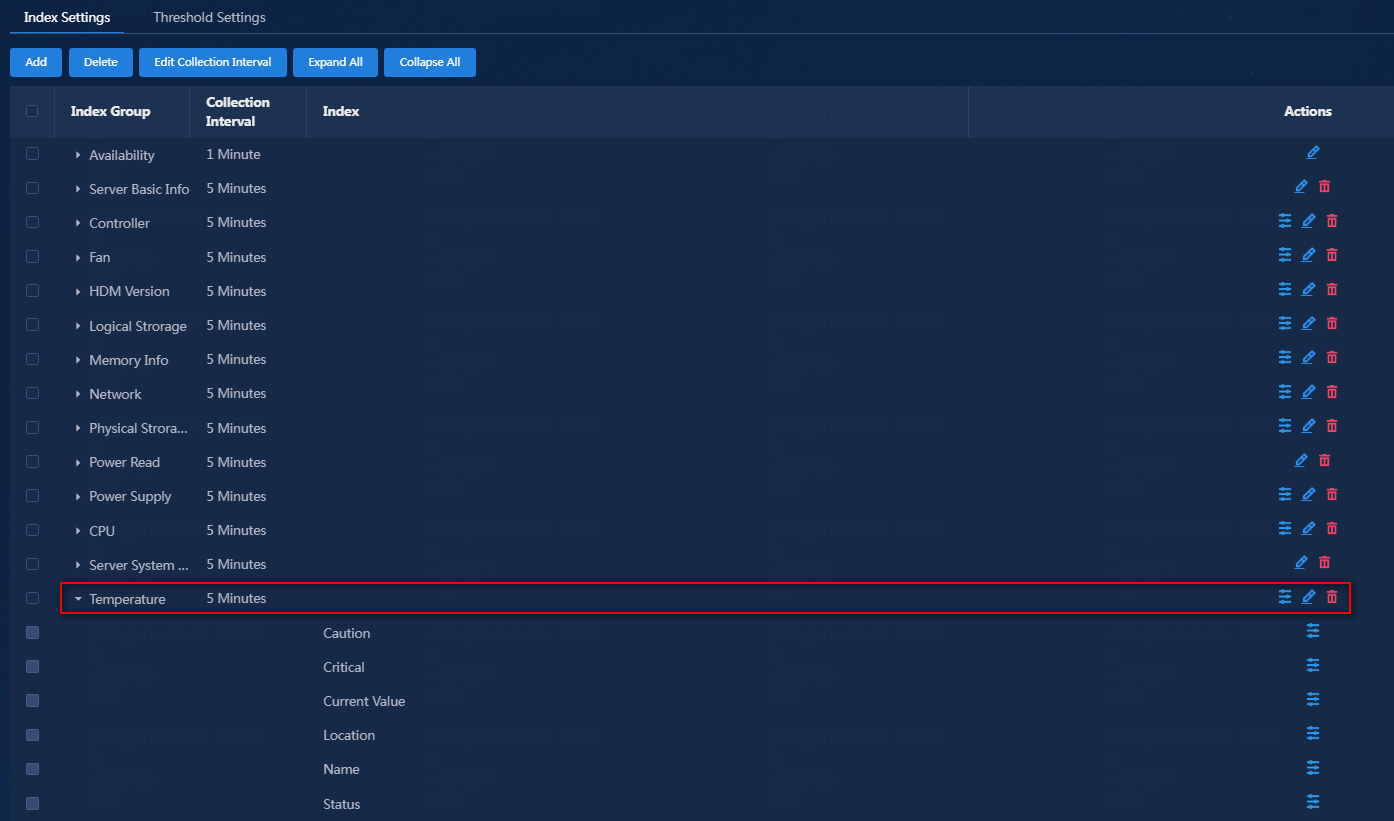
2. On the Index Settings tab, expand Temperature item, as shown in Figure 16.
Figure 16 Temperature index group
3. Click the ![]() icon in the Actions
column for the Current Value index, and configure the following
parameters in the window that opens. See Figure 17.
icon in the Actions
column for the Current Value index, and configure the following
parameters in the window that opens. See Figure 17.
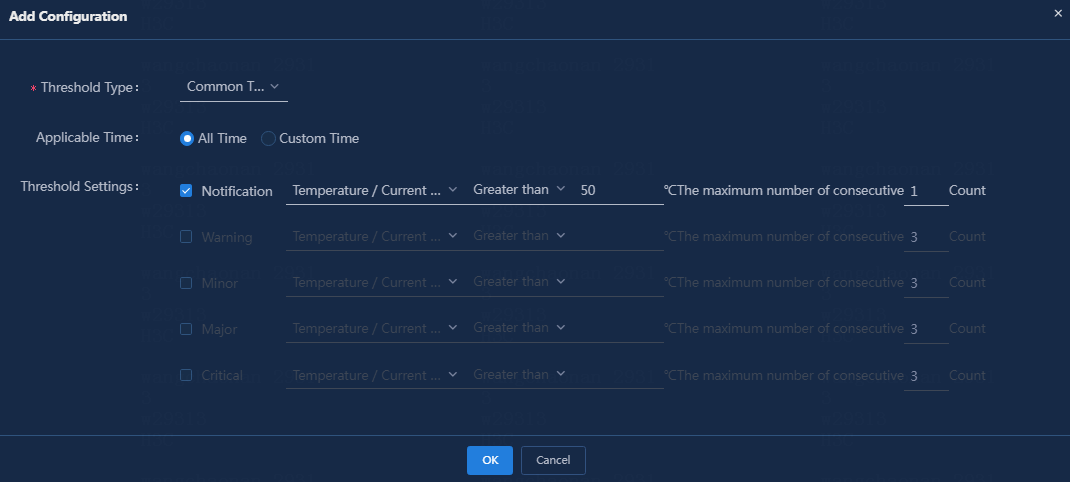
¡ Threshold Type: U-Center 2.0 supports multiple threshold types, including Common Threshold, Composite Threshold, Index-Based Rule, and Instance Loss Threshold. Different types require different configurations. Choose the threshold value type as needed, set the operator, and select the threshold level. The threshold types of some indexes have been predefined in U-Center 2.0, and cannot be edited.
¡ Applicable Time: You can select all time or customize a time range. For custom time, any time period from Monday to Sunday is supported. In this example, all time is selected.
¡ Threshold Settings: For the current value index, this example enables the Notification level and sets the threshold value and trigger times. The operator is set to Larger than. When the temperature exceeds the threshold and the trigger count is reached, the system generates a notification alarm.
Figure 17 Editing threshold settings
4. Click OK to save the edited parameters.
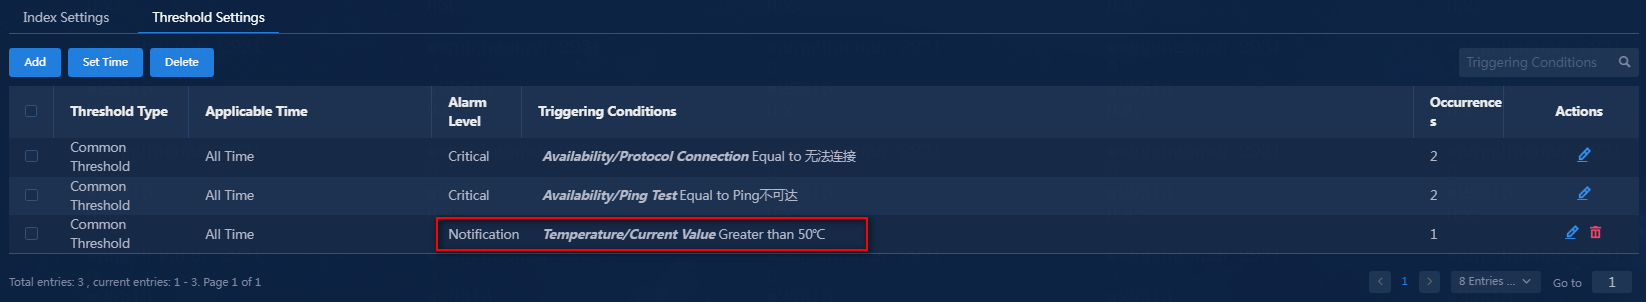
5. Click the Threshold Settings tab to view the configured threshold information, as shown in Figure 18.
Figure 18 Edited threshold settings
6. If you do not need to edit other parameters in the monitor template, you must click OK at the bottom of the page to save your modification.
The copied monitor template is created successfully, as shown in Figure 19.
Figure 19 Added monitor template
7. From the left navigation pane, select Basic Monitor > Servers to enter the server page to replace the monitor template of the resource and save it, as shown in Figure 20. The system will use the new monitor template at the next collection interval.
Figure 20 Editing the monitor template

Editing the collection interval for an index
U-Center 2.0 controls the interval for collecting indexes through monitor templates. You can specify different collection intervals for different index groups.
To edit the collection interval for an index group:
1. Click the Monitor tab.
2. From the left navigation pane, select Monitor Options > Monitor Templates.
3. In the Select Template Type area, select Server > H3C > H3C Server, as shown in Figure 21.
Figure 21 Accessing to the monitor template page
4. Click the edit icon ![]() in the
Actions column of a template to enter the page for editing the monitor template, as shown in Figure 22.
in the
Actions column of a template to enter the page for editing the monitor template, as shown in Figure 22.
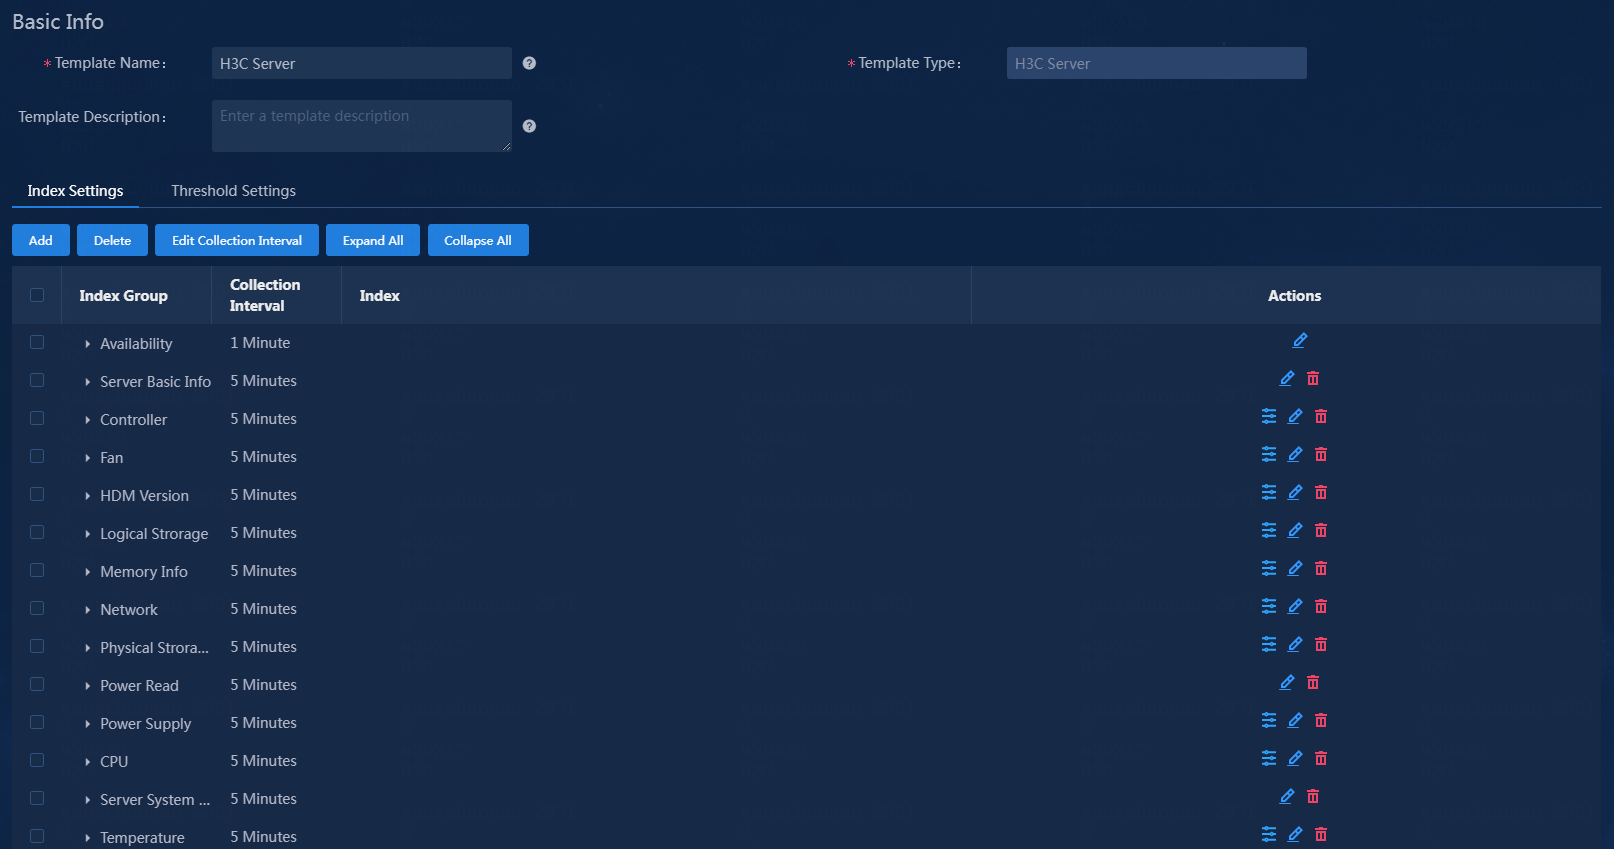
The list displays monitor indexes for the monitor template. This example configures the collection interval for the Temperature index group.
Figure 22 Editing the monitor template
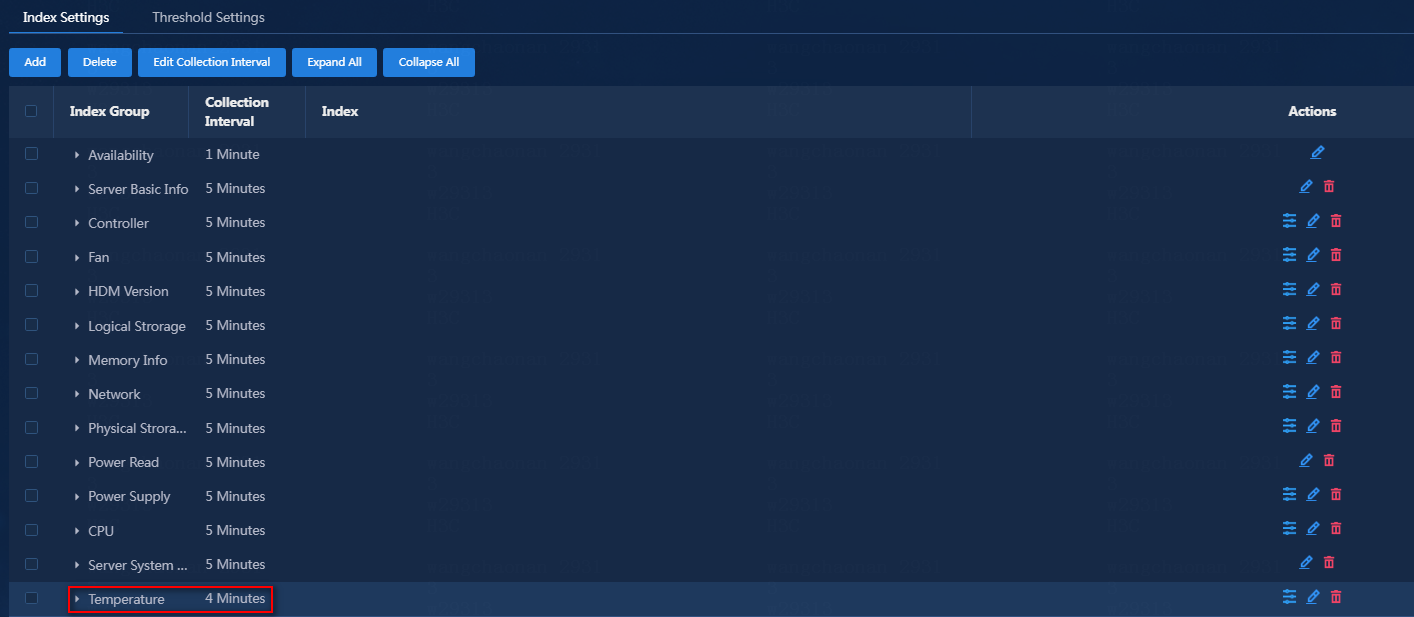
5. Select the Temperature index group, and click Edit Collection Interval. The Edit Collection Interval page opens, as shown in Figure 23.
Figure 23 Editing the collection interval
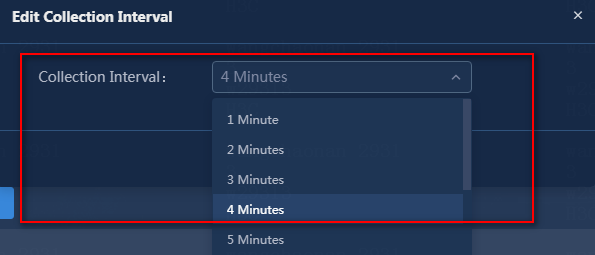
6. Select a collection interval from the Collection Interval field. In this example, the interval is set to 4 minutes.
7. Click OK. The edited collection interval is as shown in Figure 24.
Figure 24 Collection interval modified successfully
8. Click OK in the monitor template editing page. The system prompts that the editing of the monitor template is successful. The edited monitor template automatically takes effect at the next collection interval.
Verifying the configuration
Viewing the monitor report
|
|
NOTE: · If the value of an index exceeds the corresponding threshold, the background color of the value in the monitor report changes to the color for alarms of the corresponding level defined in U-Center 2.0. · If an application has triggered alarms of different levels, the alarm state field displays the highest level alarm that has been triggered. |
1. Click the Monitor tab.
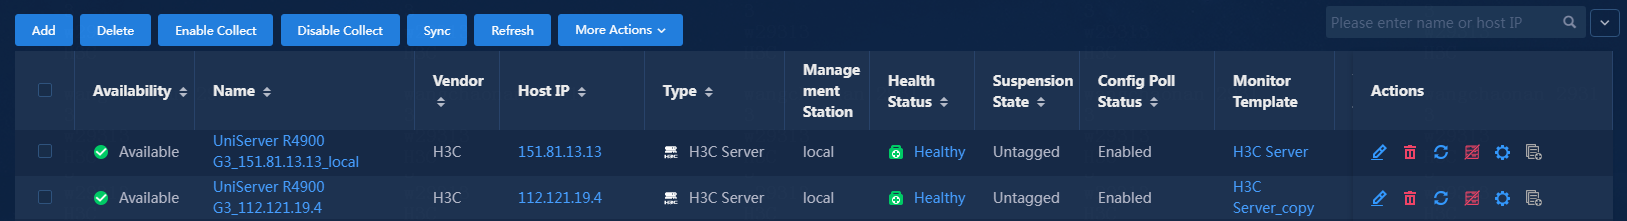
2. From the left navigation pane, select Basic Monitor > Servers. Verify that the alarm state has changed after a period of collection, as shown in Figure 25.
Figure 25 Viewing the monitoring list

3. Click the name link. In the dialog box that opens, view the monitor report, as shown in Figure 26.
This section uses indexes defined in the default monitor template to describe fields in the monitor report.
Figure 26 Server resource details (part)

Monitor information
View basic server information on the monitoring dashboard, as shown in Figure 27.

· Product Name: Model of the server.
· Serial Number: Serial number of the server.
· System Status: System state of the server.
· Classis Power: Whether the server is powered on.
· Temperature Status: Temperature status of the server.
· Power Status: Power status of the server.
· Fan Status: Fan status of the server.
· Memory Status: Memory status of the server.
· Storage Status: Storage status of the server.
· Processor Status: Processor status of the server.
Availability Today
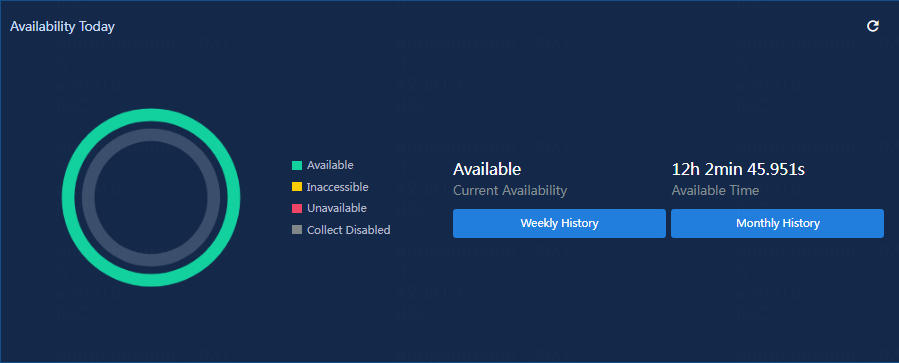
· Pie Chart: Percentage of availability status in the current day. You can view the corresponding percentage data for each pie slice by hovering over it with the mouse.
· Current Availability: Availability of the current application.
¡ Available: The resource object can be properly connected and the monitoring data can be collected.
¡ Inaccessible: The monitoring target cannot be pinged, and the system generates ping unreachable alarms.
¡ Unavailable: The system cannot establish a connection with the monitored target, and the system generates monitoring management protocol connectivity alarms.
¡ Collect Disabled: Monitoring and statistics collection for the resource object is stopped. The alarm state is unknown.
· Availability Time:
¡ Available: Cumulative normal running time of the application since 00:00 today.
¡ Inaccessible: Cumulative unreachable time of the application since 00:00 today.
¡ Unavailable: Cumulative protocol connection failure time of the application since 00:00 today.
¡ Collect Disabled: Cumulative duration of data collection suspension by the application since the moment when the user manually disables monitoring data collection.
|
|
NOTE: For a newly added application monitor, the system starts collecting statistics for the Available, Unavailable, and Collect Disabled fields since the monitor is successfully added on the current day. The availability status data with duration of 0 are not displayed. |
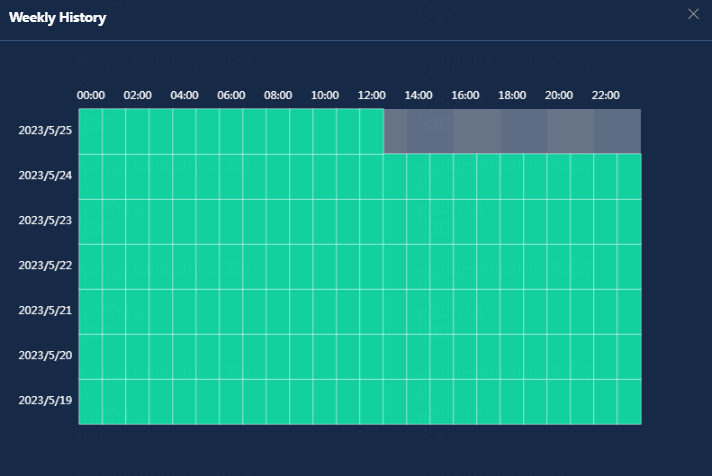
· Weekly History: To view the availability of the application in the past 7 days, click Weekly History. The system calculates the availability of an application for the past 7 days by hour. To view the percentage of each server's availability status, hover over a corresponding time period, as shown in Figure 29.
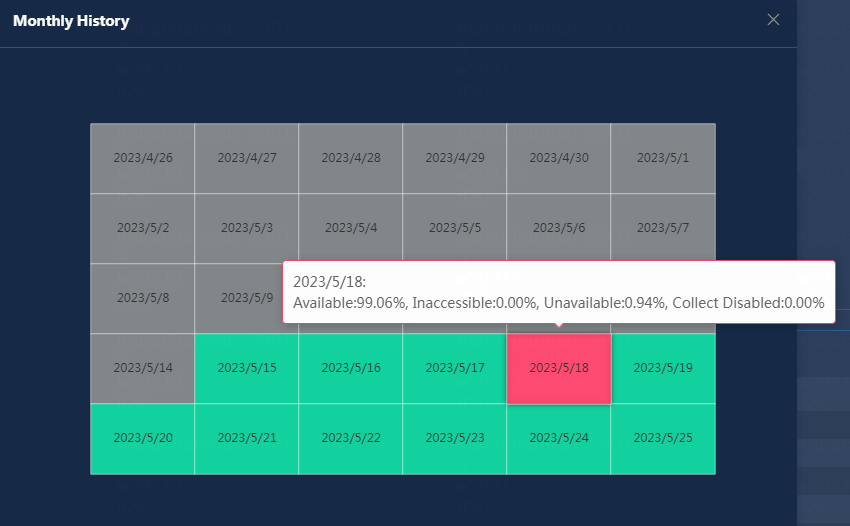
· Monthly History: To view the availability of the application in the past 30 days, click Monthly History. The monthly availability data is collected in days. To view the percentage of each application's availability status, hover over a corresponding time period.
Fan information
Figure 31 Fan information
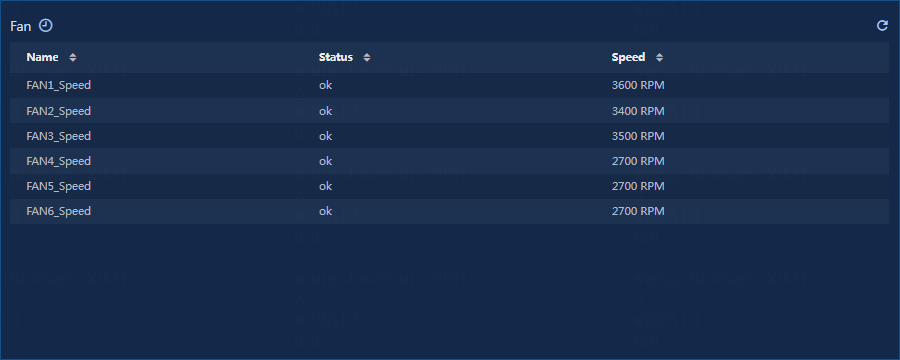
· Name: Fan name.
· Status: Fan status.
· Speed: Rotation speed.
Temperature information
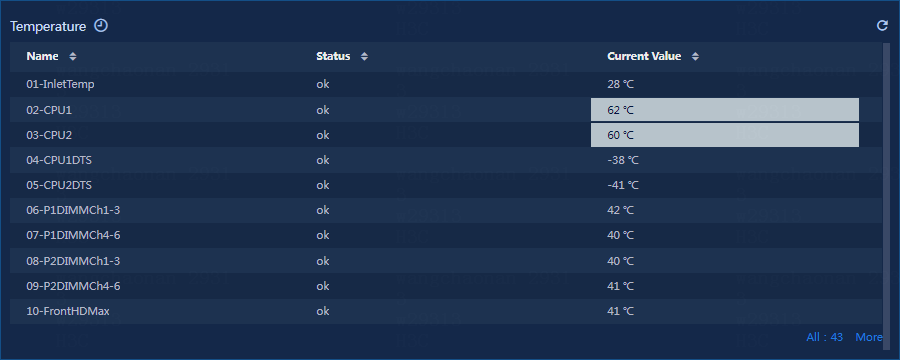
· Name: Temperature sensor name.
· Status: Temperature sensor status.
· Current Value: Current temperature of the Temperature sensor.
CPU information
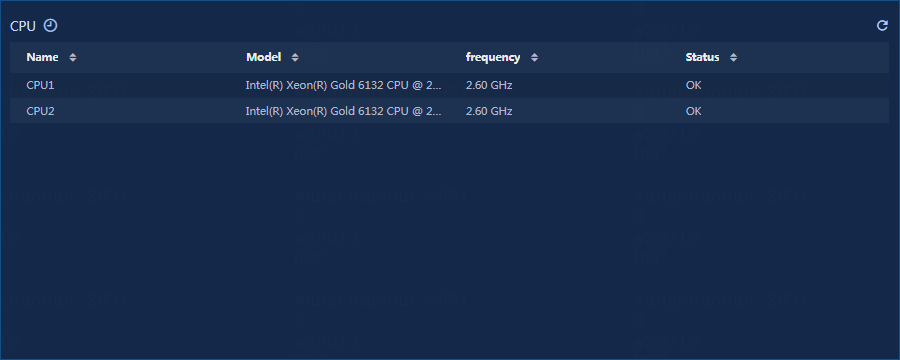
· Name: CPU name.
· Model: CPU model.
· Frequency: CPU frequency.
· Status: CPU status.
Memory information
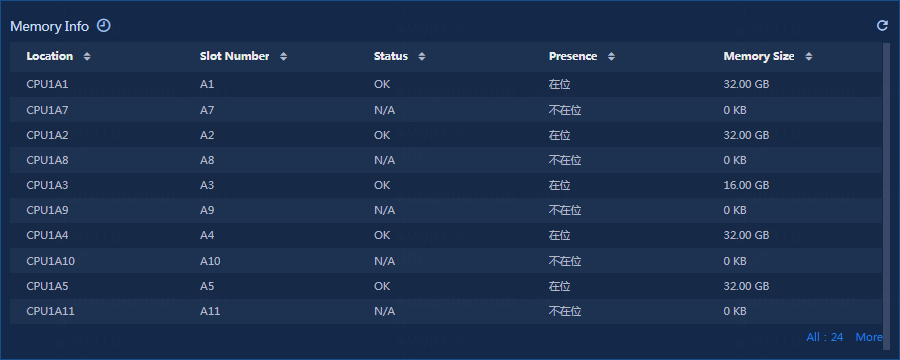
· Location: Memory location.
· Slot Number: Memory slot number.
· Status: Memory status.
· Presence: In-position status of the memory.
· Memory Size: Memory size.
Power supply information
Figure 35 Power supply information
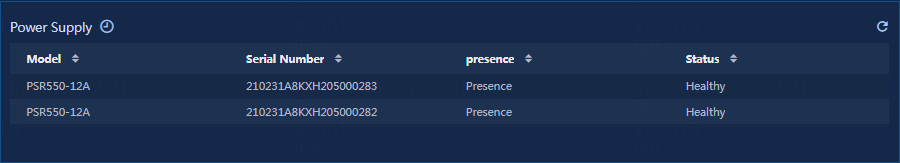
· Model: Power supply model.
· Serial Number: Power supply serial number.
· Presence: In-position status of the power supply.
· Status: Power supply status.
Power read information
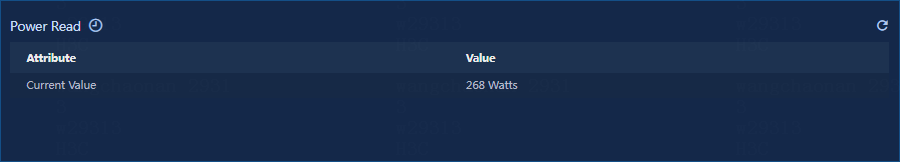
Current Value: Current power read.
Network adapter information

· Port: Port on the network adapter.
· Mac Address: MAC address of the network adapter.
Controller information
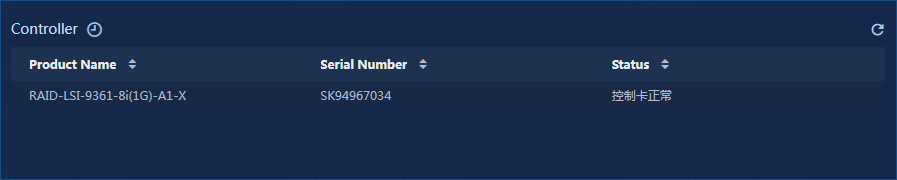
· Product Name: Product name of the controller.
· Serial Number: Serial number of the controller.
· Status: Status of the controller.
Logical storage information
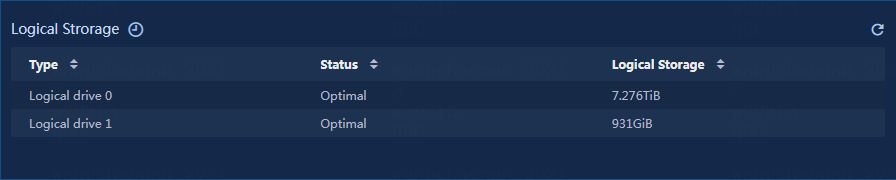
· Type: Type of the logical storage.
· Status: Status of the logical storage.
· Logical Storage: Capacity of logical storage.
Physical storage information
Figure 40 Physical storage

· Location: Location of the physical storage.
· Serial Number: Serial number of the physical storage.
· Status: Status of the physical storage.
· Physical Storage: Capacity of the physical storage.
HDM version information

HDM Version: HDM version.
Viewing threshold alarms
1. Access the resource details page.
The monitor dashboard tab displays the name, type, health status, and suspension state of the monitored application. If an application has triggered alarms of different levels, the Health Status field displays the highest level of alarms triggered.
Based on the configuration in this example, the R4900 G3 will generate alarms of the Notification level and display alarms of the Notification level in the health status field, as shown in Figure 42.
Figure 42 Monitor dashboard

2. Click the health status link or select the alarm information tab to enter the alarm information page, as shown in Figure 43.
![]()
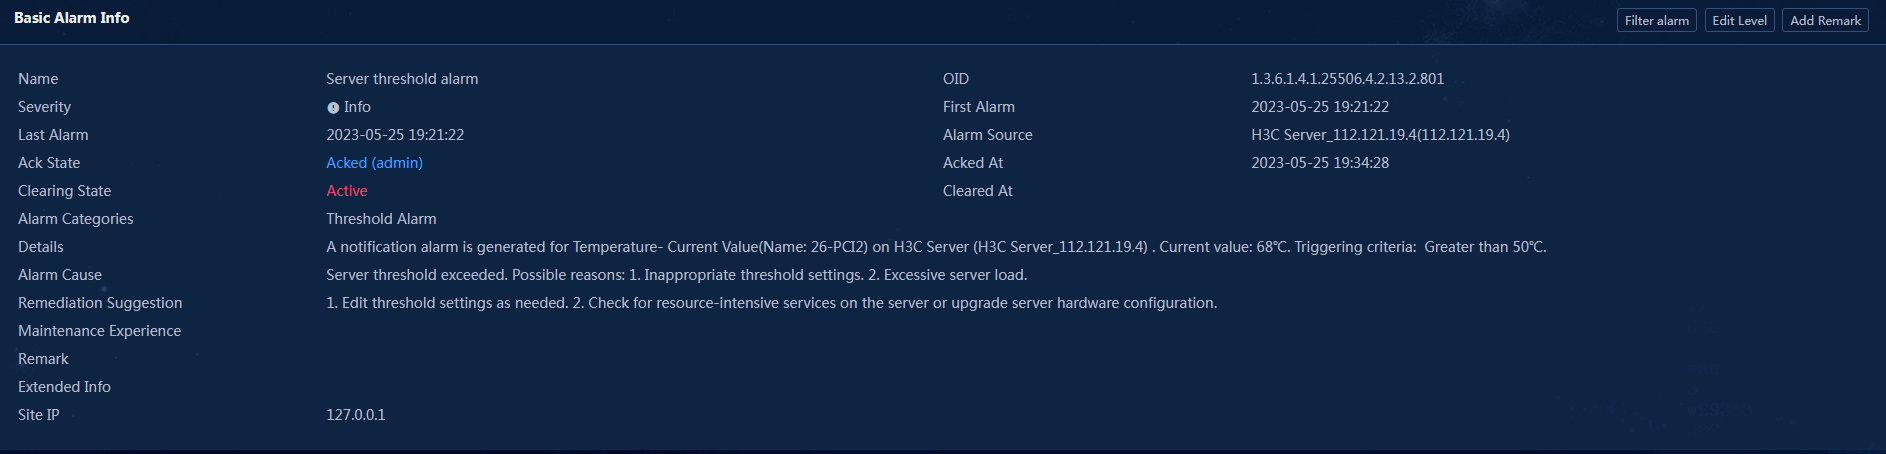
3. Click the alarm information link to view the alarm details, as shown in Figure 44.
Figure 44 Notification-Alarm details

4. After you receive a threshold alarm, verify if the related information is correct, and then click the Unacked link in the Ack State column to acknowledge the alarm.
5. Resolve issues that trigger the alarm or adjust the alarm threshold, and then click Active in the Clearing State column to clear the alarm.

U-Center 2.0 periodically monitors applications. If the collected index values do not meet the threshold conditions in the next collection interval, the alarm status will be automatically restored and new index values will be recorded.
After all alarms are recovered, the health status of the application will also be restored to normal, as shown in Figure 47.
Figure 47 Alarm status recovered