- Released At: 15-01-2024
- Page Views:
- Downloads:
- Table of Contents
- Related Documents
-
|
|
|
CloudOS Monitoring in U-Center 2.0 |
|
Configuration Example |
|
|
|
|
Document version: 5W102-20230922
Copyright © 2023 New H3C Technologies Co., Ltd. All rights reserved.
No part of this manual may be reproduced or transmitted in any form or by any means without prior written consent of New H3C Technologies Co., Ltd.
Except for the trademarks of New H3C Technologies Co., Ltd., any trademarks that may be mentioned in this document are the property of their respective owners.
The information in this document is subject to change without notice.
Contents
Configuring the CloudOS platform
Configuring the CloudOS monitor template
Viewing the CloudOS monitor reports
Viewing the CloudOS threshold alarms
Introduction
H3C CloudOS is a cloud platform product designed and developed by H3C based on a microservices architecture.
This document introduces how to use U-Center 2.0 to monitor CloudOS, view monitor reports, and configure threshold alarms.
Usage guidelines
Application scenarios
This document is applicable in the scenario where U-Center 2.0 monitors CloudOS.
Prerequisites
· The CloudOS platform is deployed and configured correctly, and it is running correctly.
· The U-Center 2.0 server is installed and deployed correctly.
· The U-Center 2.0 server supports monitoring for the CloudOS version E3106P02.
· The U-Center 2.0 server communicates correctly with the CloudOS server.
¡ Make sure the U-Center 2.0 server and the CloudOS server are connected through the network. You can use the ping command to verify their connection.
¡ Ensure that the port number currently used by CloudOS is enabled. In this example, the default port value 8000 is used.
Configuration example
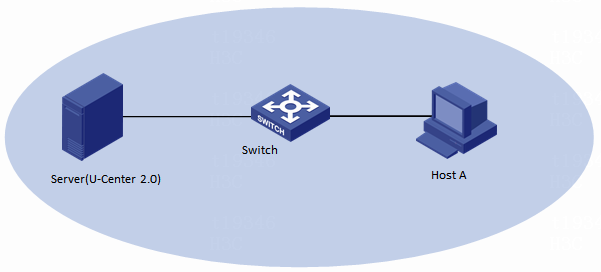
Network configuration
As shown in Figure 1, a host in the DC of a company is installed with CloudOS to carry services of the company. The server administrator needs to use U-Center 2.0 to incorporate and monitor the CloudOS server, as shown in Table 1.
Figure 1 Network configuration
|
Host name |
IP address |
Application |
|
Server(U-Center 2.0) |
192.167.253.159 |
U-Center IOM 2.0(E0709) |
|
Host |
192.167.15.64 |
E5135 |
Procedures
Configuring the CloudOS platform
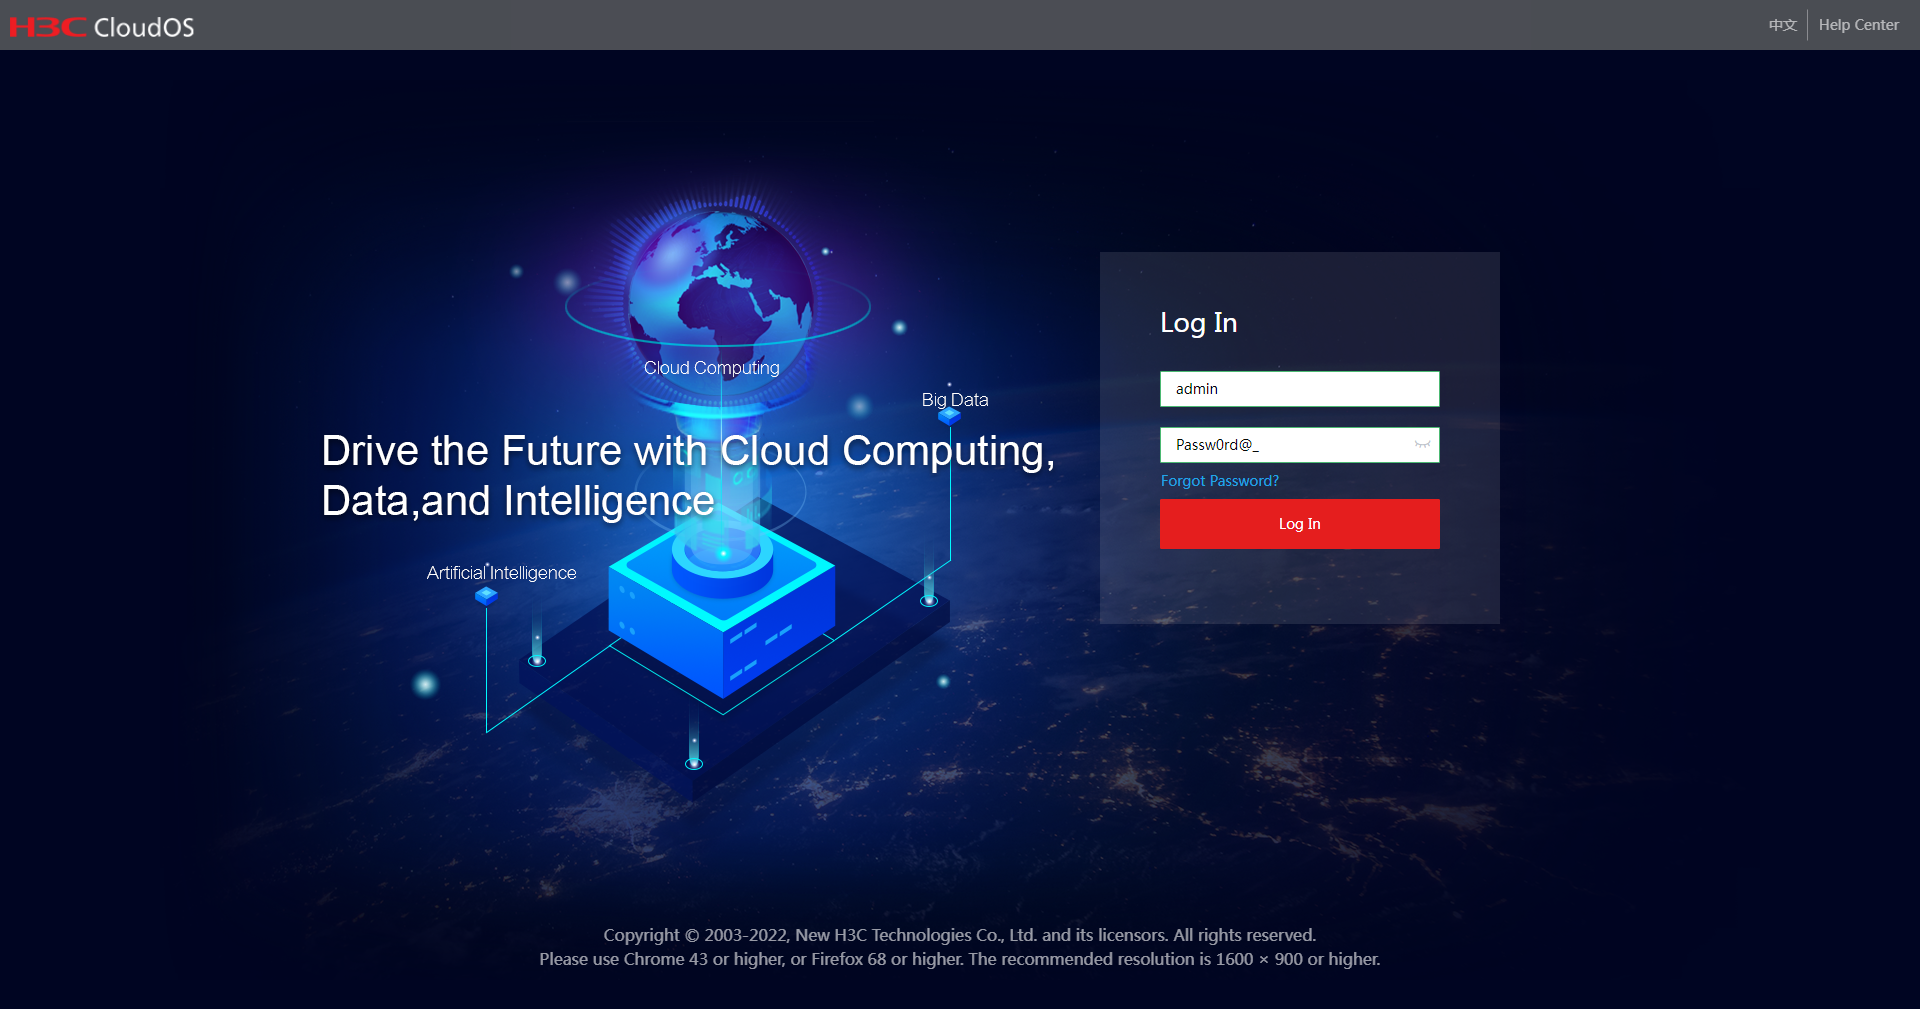
1. Log in to CloudOS by using the username and password of an administrator on the CloudOS platform.
Figure 2 Logging in to CloudOS
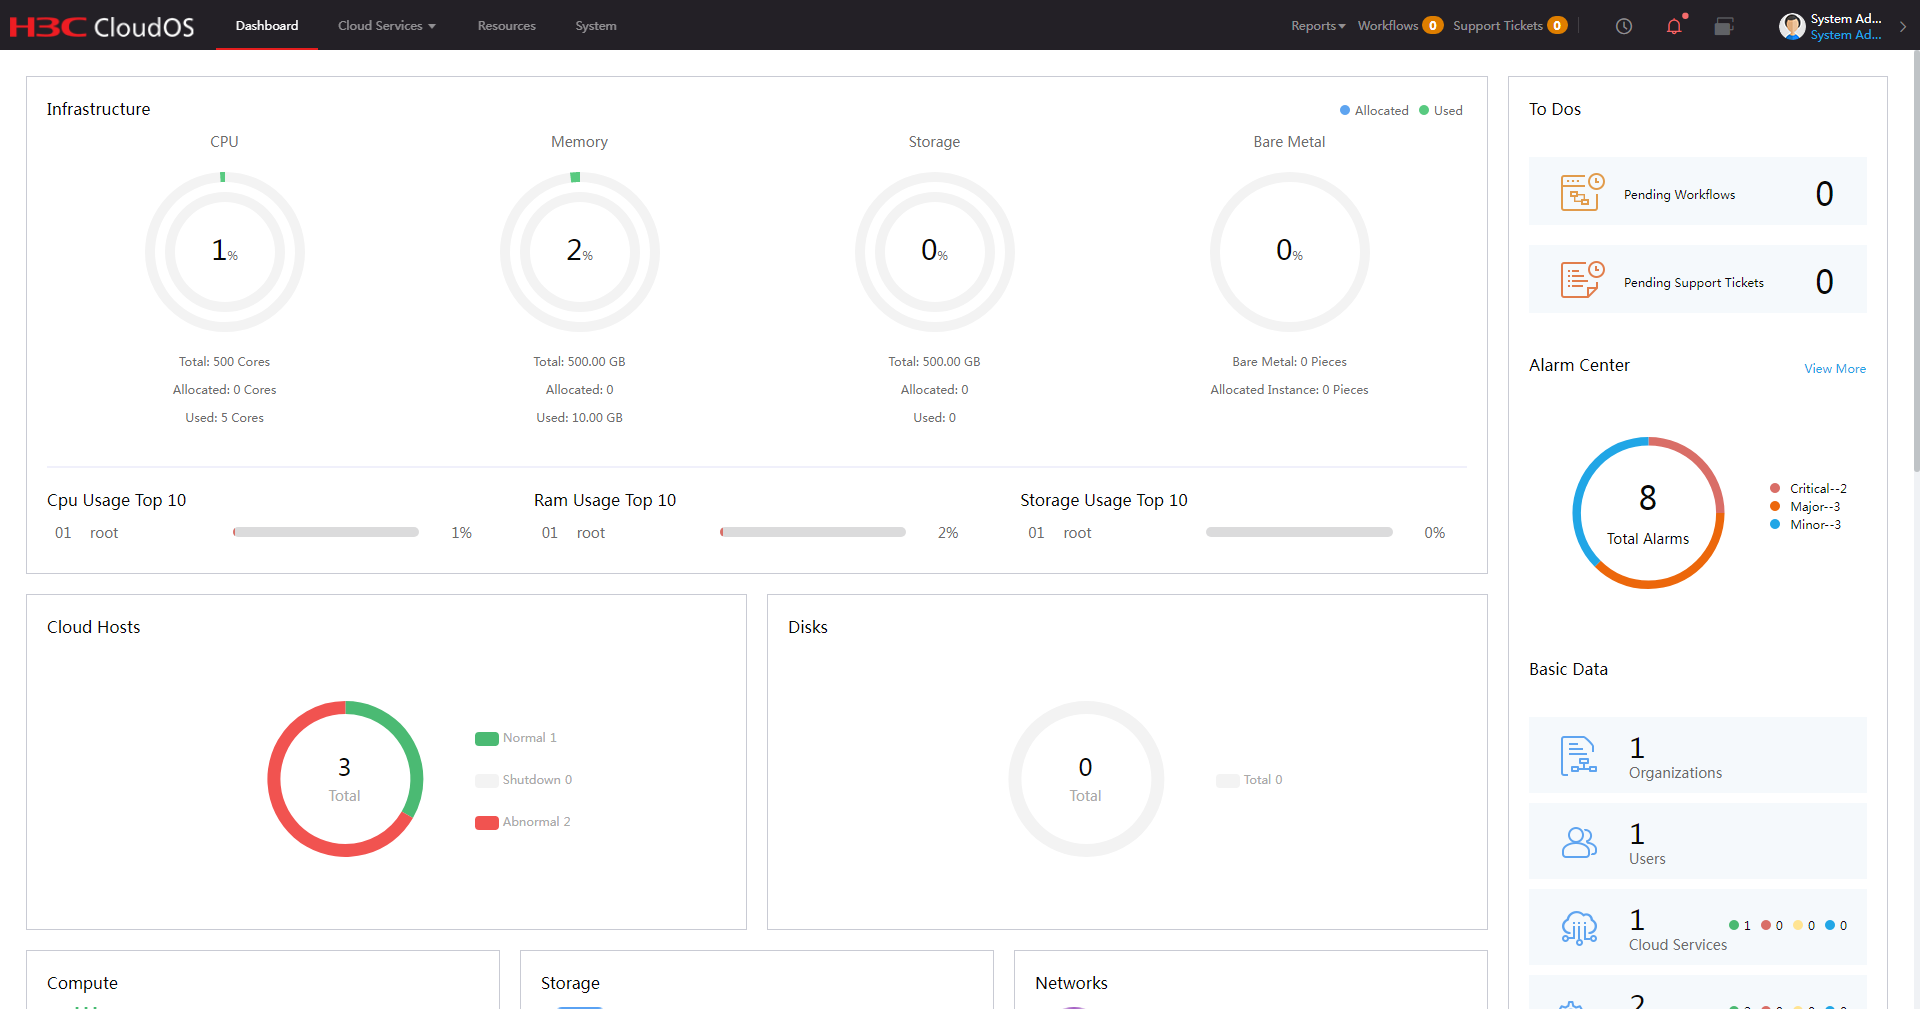
2. Verify that you can view information on the CloudOS platform from the console.
Figure 3 CloudOS dashboard
Adding CloudOS
1. Log in to U-Center 2.0.
2. Click the Monitor tab.
3. From the left navigation pane, select Basic Monitor > Virtualization.
Figure 4 Virtualization
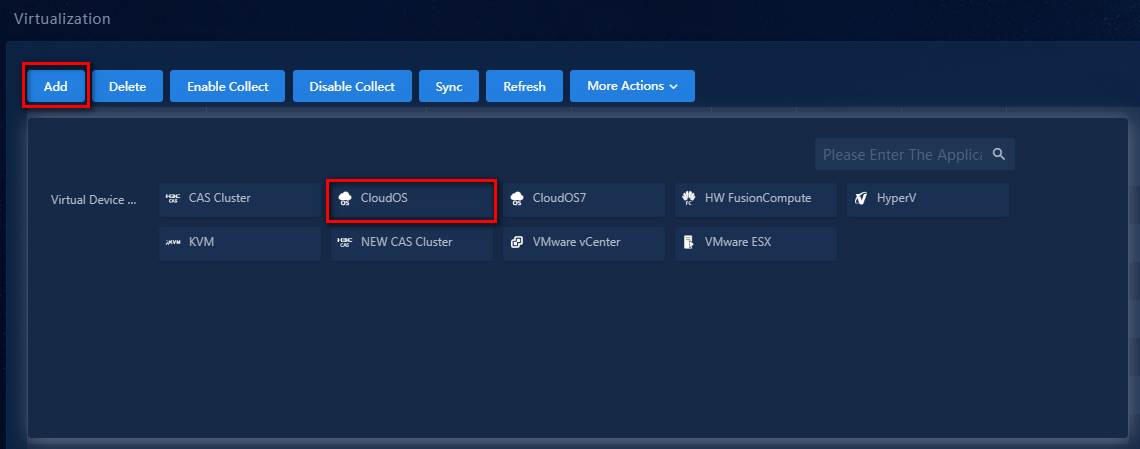
4. Click Add.
5. Click CloudOS below virtual device monitoring category.
Figure 5 Adding CloudOS
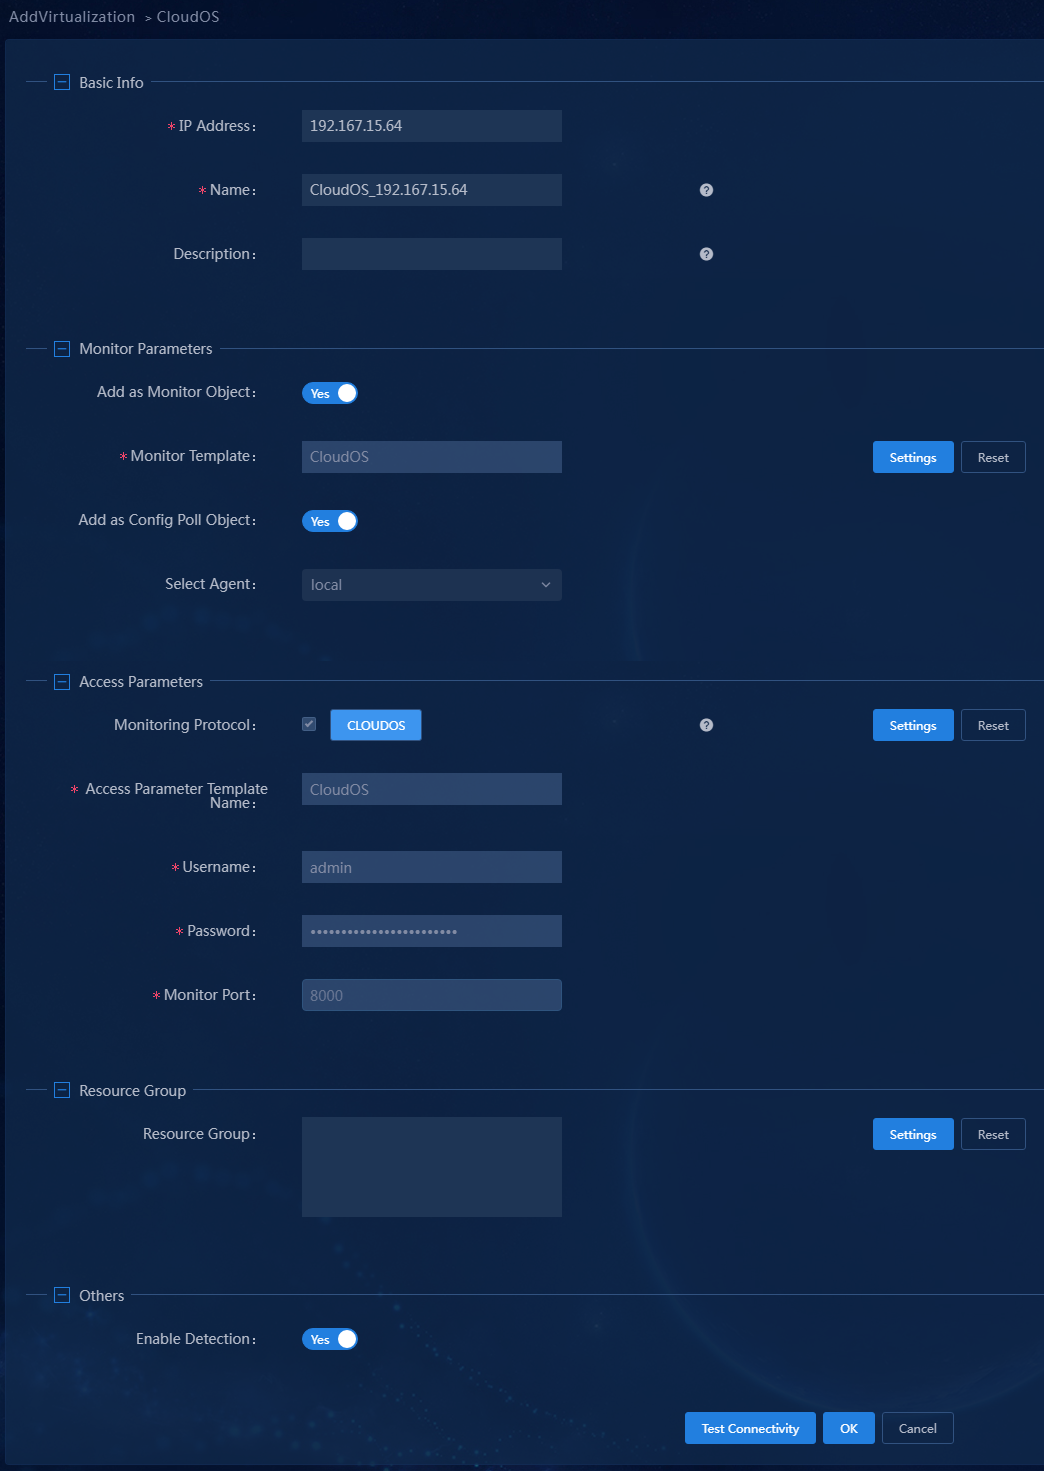
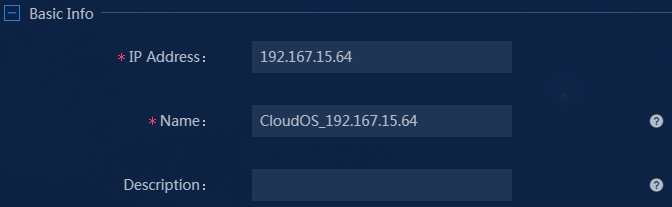
6. Configure the following basic parameters:
¡ IP Address: Enter the IP address of CloudOS. In this example, enter 192.167.15.64.
¡ Name: Enter the name of CloudOS. In this example, enter CloudOS_192.167.15.64.
¡ Description: Enter a description. In this example, skip this parameter.
Figure 6 Configuring basic parameters
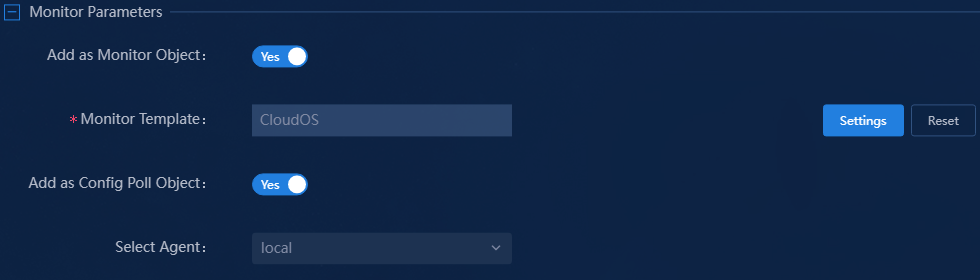
7. Manually configure the monitor parameters, or select a monitor template.
¡ Add as Monitor Object: Select whether to add the CloudOS as a monitor object. You must add the CloudOS as a monitor object or configuration poll object.
¡ Monitor Template: In this example, use the default monitor template CloudOS. To select a different monitor template or modify the monitor template, click Settings. For information about modifying a monitor template, see "Configuring the CloudOS monitor template."
¡ Add as Config Poll Object: Select whether to add the CloudOS as a configuration pool object. This parameter is enabled by default. In this example, use the default setting. The CloudOS will be added to the monitor and resource management tabs, and its data will be collected periodically. This parameter is available only after CMDB licenses are used for resource quantity-based and feature-based licensing.
¡ Select Agent: Select a monitor agent. In this example, use the default local agent. Configure this parameter if a proxy is required for monitoring.
Figure 7 Configuring monitoring parameters
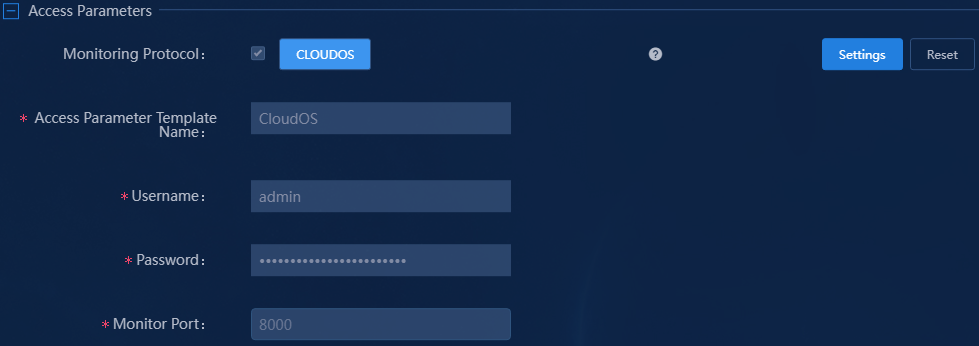
8. Select a monitoring protocol, and manually configure the access parameters or select an access parameter template.
¡ Monitoring Protocol: Use the default protocol CLOUDOS.
¡ Access Parameter Template Name: Select an access parameter template. In this example, use template CloudOS. To select a different access parameter template or add a new access parameter template, click Settings.
¡ Username: Enter the username of the CloudOS.
¡ Password: Enter the password of the CloudOS.
¡ Monitor Port: Enter the port number of the CloudOS. In this example, use the default port number 8000.
Figure 8 Configuring access parameters
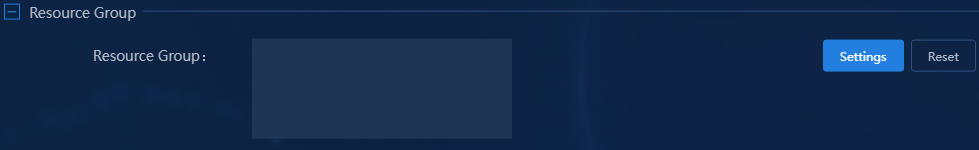
9. Assign the monitor object to a resource group. In this example, skip this parameter.
Figure 9 Assigning the monitor object to a resource group
10. Set the state of detection. Detection enables U-Center to test connectivity to the monitor object, and connectivity detection might take a short period of time. In this example, use the default setting.
Figure 10 Setting the state of detection

11. Click Test Connectivity to verify correctness of the configuration.
12. After the network connectivity is verified, click OK.

Configuring the CloudOS monitor template
U-Center 2.0 uses the monitor template to control the collected indexes and their thresholds. The system has predefined a large number of monitor templates that can be directly used. You can also edit a monitor template as needed to customize the monitor template.
You can set thresholds for concerned indexes. By monitoring the alarm state of monitored resources, you can timely learn the application running state. Common operations include:
· Access the CloudOS monitor template page, as shown in "Accessing the CloudOS monitor template."
· Select existing index groups on the index settings tab, and edit the collection interval for the index groups, as shown in "Editing the collection interval of an index group."
· Select an existing index on the index settings tab, and add the threshold settings for the index, as shown in "Adding an index threshold."
· Edit the existing threshold configuration, as shown in "Editing index thresholds."
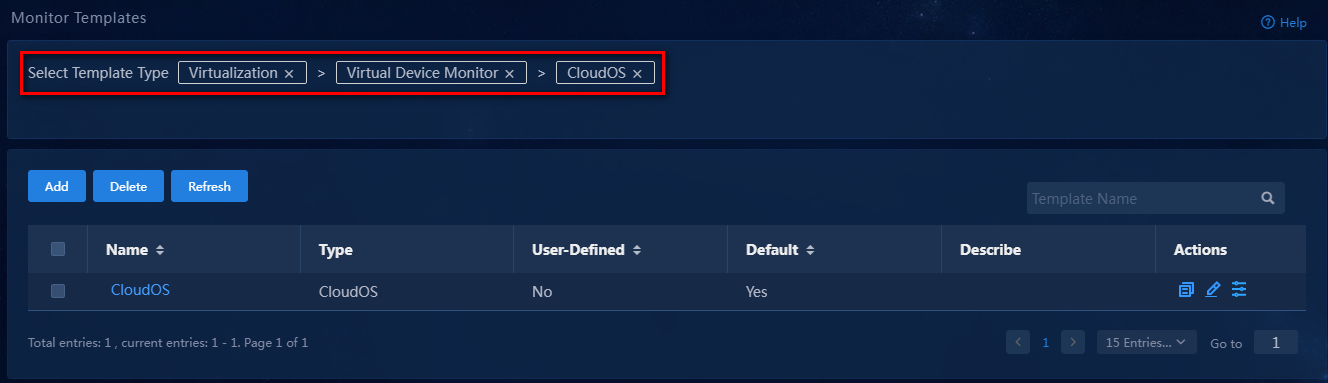
Accessing the CloudOS monitor template
1. Click the Monitor tab.
2. From the left navigation pane, select Monitor Options > Monitor Templates.
3. Select Virtualization > Virtual Device Monitor > CloudOS as the template type.
Figure 12 Select the CloudOS monitor template
4. Operate the CloudOS monitor template from the Actions column as follows:
¡ To
copy the monitor template, click ![]() . The new
monitor template is named CloudOS_copy, and you can modify and save the new monitor template.
. The new
monitor template is named CloudOS_copy, and you can modify and save the new monitor template.
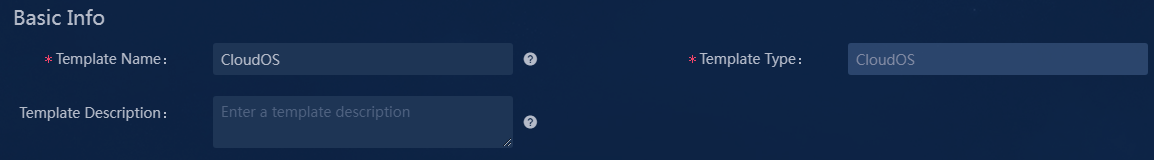
¡ To edit the basic information and indicator
thresholds of the monitor template, click ![]() . The new monitor template will be applied at the next collection
interval after the monitor template is edited successfully.
. The new monitor template will be applied at the next collection
interval after the monitor template is edited successfully.
¡ To
edit the thresholds of the monitor template, click ![]() .
.
Figure 13 Basic information of the monitor template
|
|
NOTE: You can change the monitor template for a resource by using the following methods: · To change the monitor template for a single resource, click · To change the monitor template for a multiple resources of the same type in bulk, select the resources, click More, and then select Change Monitor Template. |
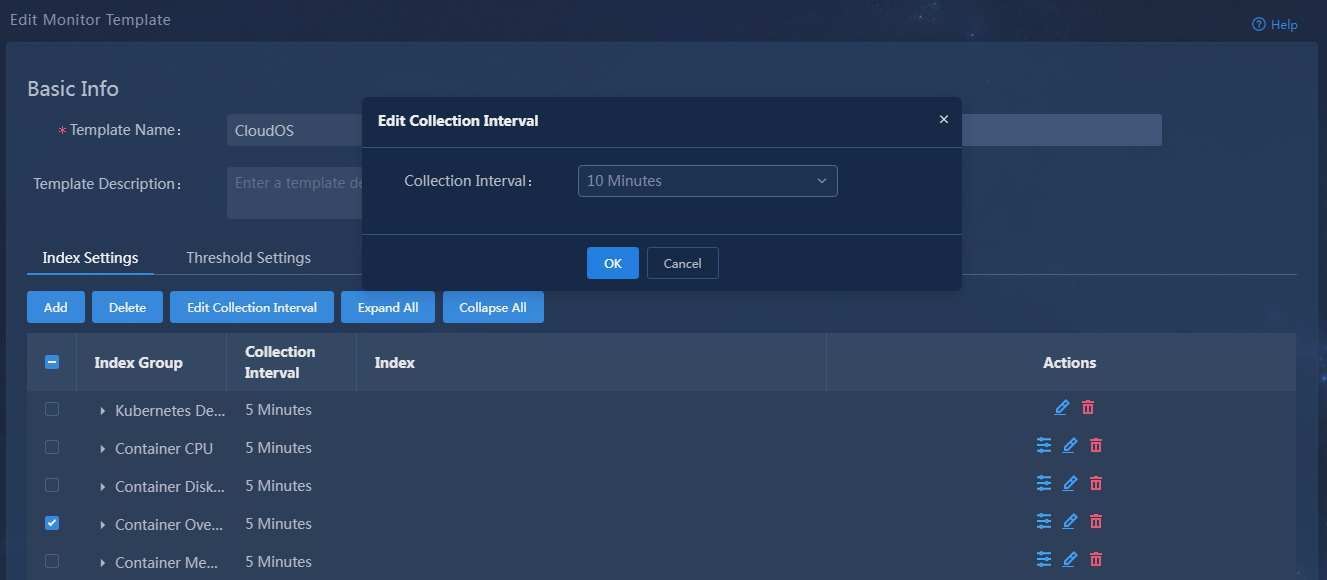
Editing the collection interval of an index group
The following procedure uses the Container Overview Information index group as an example.
1. Select the Container Overview Information index group on the Index Settings tab.
2. Click Edit Collection Interval, and then edit the collection interval, In this example, set the collection interval to 10 minutes.
Figure 14 Editing the collection interval
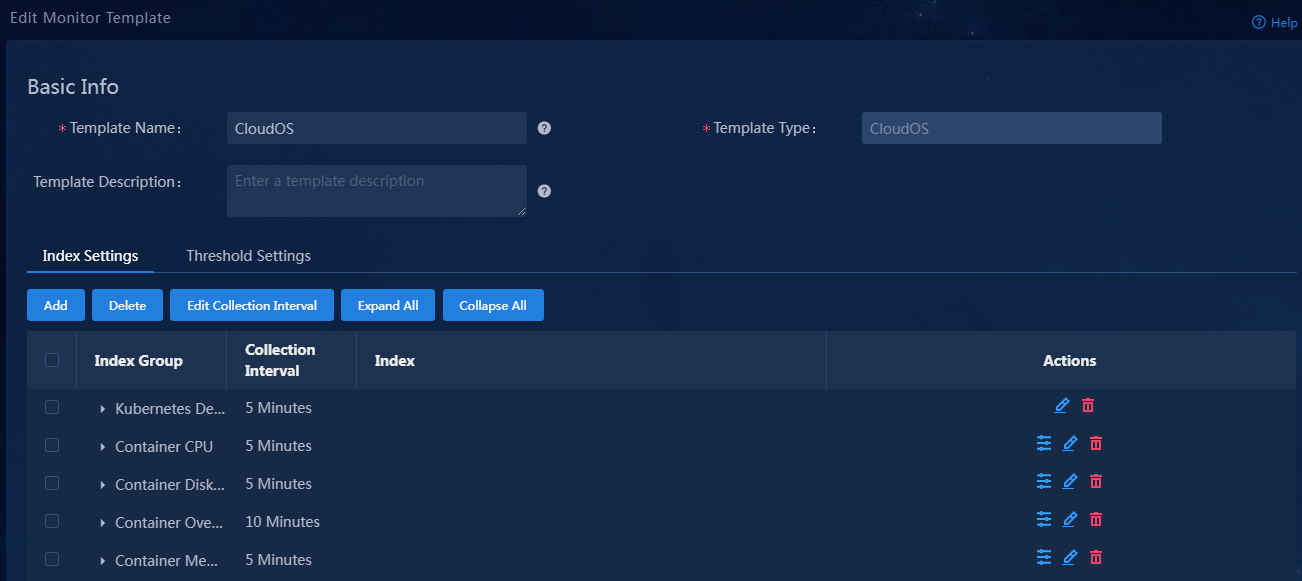
3. Click OK. The new monitor template will be applied at the next collection interval after the monitor template is edited successfully.
Figure 15 Collection interval after modification
Adding an index threshold
The following procedure adds the container memory usage index as an example.
1. Expand the Container Memory index group.
Figure 16 Indexes in the index group
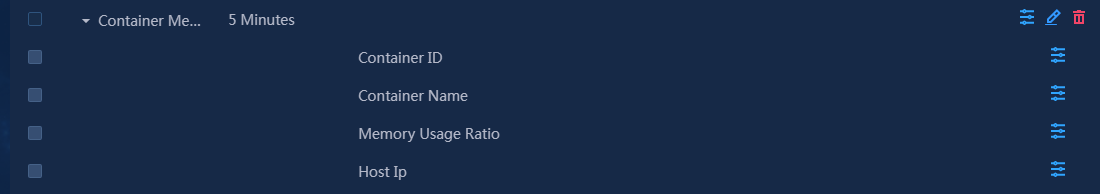
2. Click the ![]() icon
for the container memory usage index.
icon
for the container memory usage index.
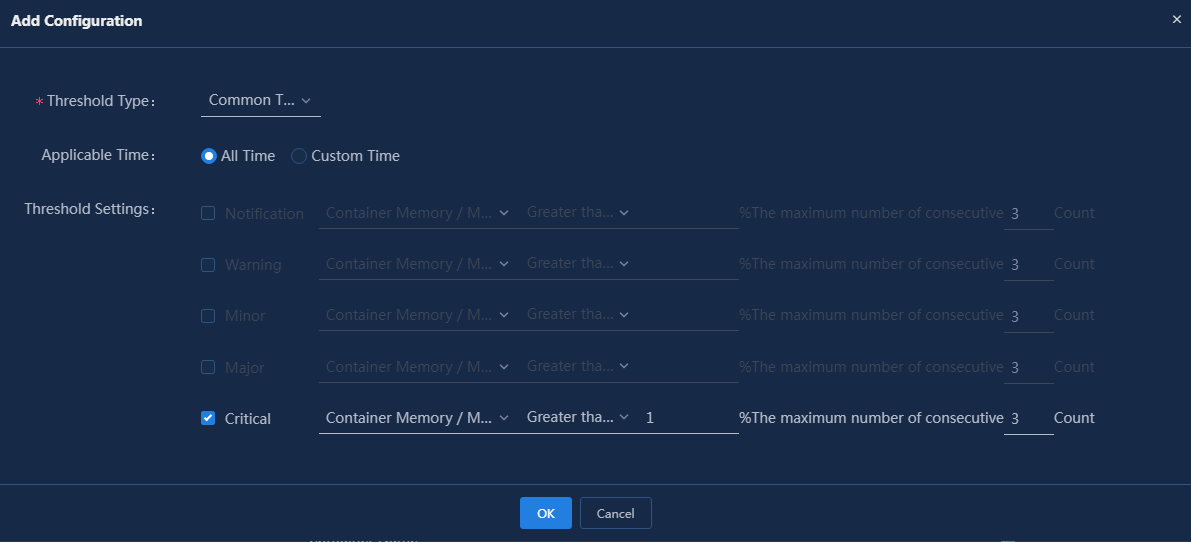
3. Click Add.
4. Configure the following parameters:
¡ Threshold Type: Select a threshold type. The threshold configuration varies by threshold type. The threshold types for certain indexes are predefined and not configurable. In this example, select the common threshold type.
¡ Applicable Time: Apply the configuration to all time spans or custom time spans. In this example, select All Time.
¡ Threshold Settings: Configure the thresholds. In this example, set the critical alarm threshold to 1%, and set the triggering condition to three consecutive occurrences.
Figure 17 Adding configuration
5. Click OK.
Figure 18 Added threshold configuration
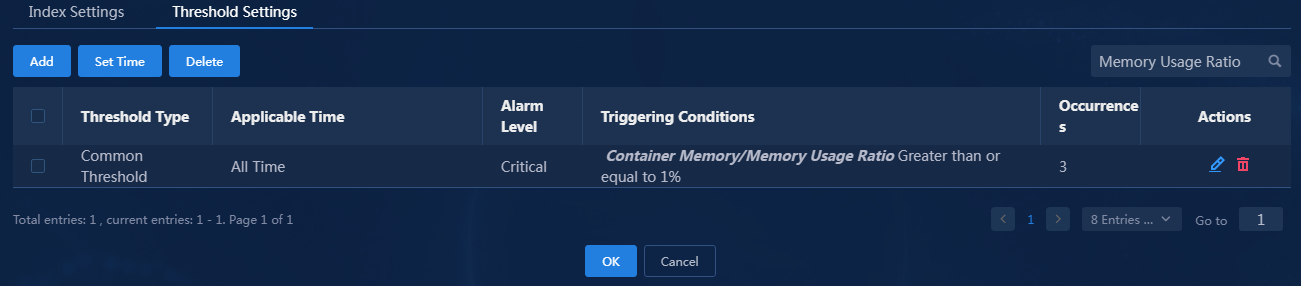
6. Click OK. Modification to the monitor template takes effect in the next collection interval.
Editing index thresholds
The following procedure adds the container memory usage index as an example.
1. Expand the Container Memory index group.
2. Click the ![]() icon
for the memory usage index.
icon
for the memory usage index.
3. Click the ![]() icon
in the Actions column.
icon
in the Actions column.
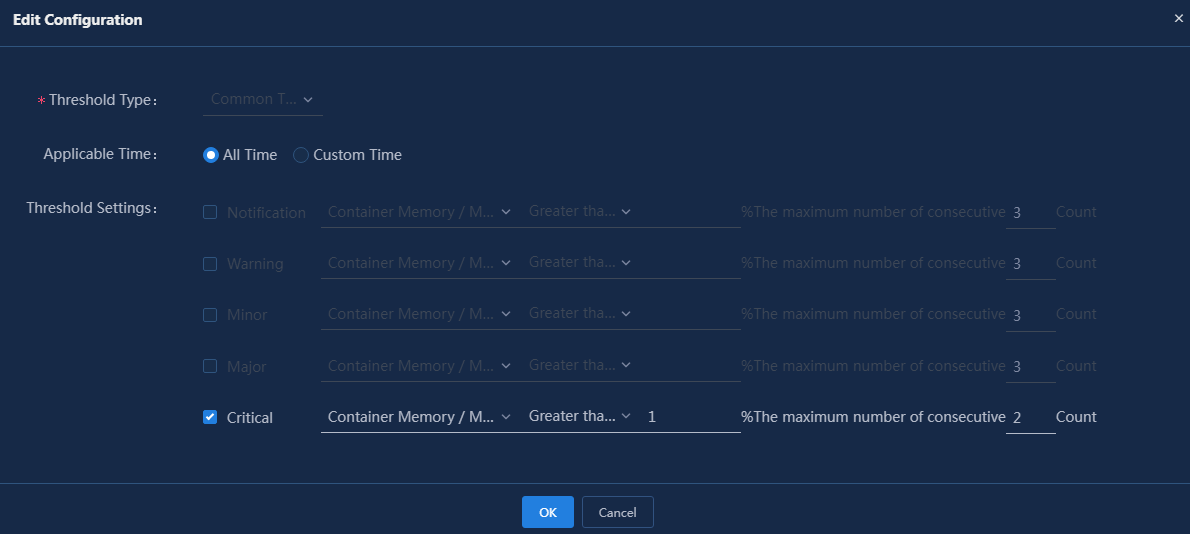
4. Modify the following parameters:
¡ Threshold Type: This parameter is not configurable.
¡ Applicable Time: Apply the configuration to all time spans or custom time spans. In this example, do not edit this parameter. Alternatively, you can select a threshold, and then click Set Time to modify the applicable time.
¡ Threshold Settings: Edit the thresholds. In this example, set the triggering condition to two consecutive occurrences.
Figure 19 Modifying threshold settings
5. Click OK.
Figure 20 Modified threshold configuration

6. Click OK. The new monitor template will be applied at the next collection interval after the monitor template is edited successfully.
Verifying the configuration
Viewing the CloudOS monitor reports
Viewing CloudOS resource details
1. Click the Monitor tab.
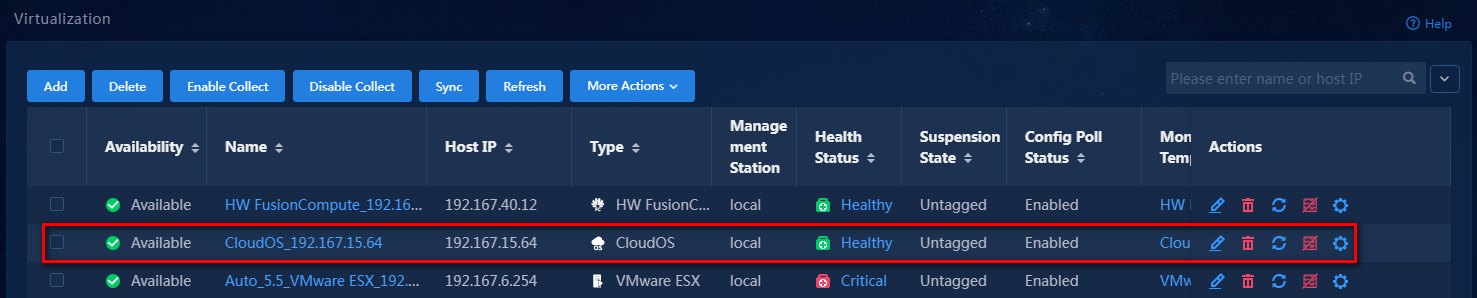
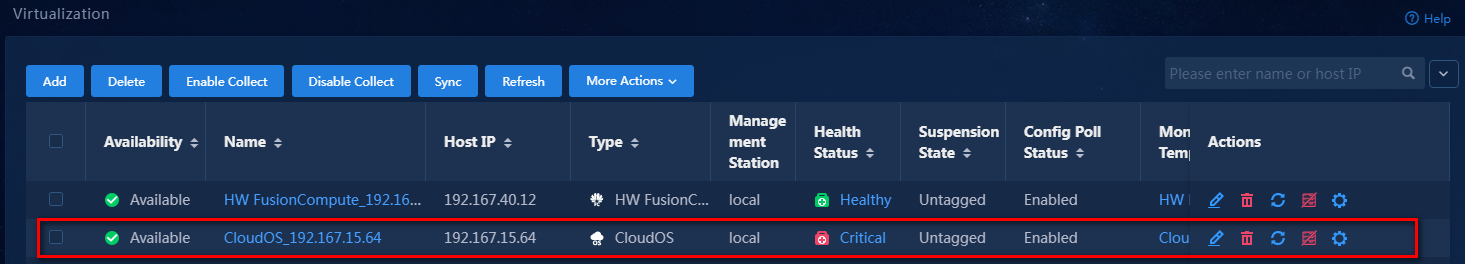
2. From the navigation pane, select Basic Monitor > Virtualization.
3. On the virtualization page, view the virtualization monitor list.
After a period of collection time, the alarm state has changed, as shown in Figure 21.
Figure 21 Viewing the virtualization monitor list
4. Click the CloudOS_192.167.15.64 link. On the resource details page that opens, view the monitor reports, as shown in Figure 22.
Figure 22 CloudOS resource details (partial)
|
|
NOTE: · If the value of an index exceeds the corresponding threshold, the background color of the value in the monitor report changes to the color for alarms of the corresponding level defined in U-Center 2.0. · If an application has triggered alarms of different levels, the alarm state displays the highest level of alarms triggered. · U-Center 2.0 provides multiple time spans for an index, including
Past 1 hour |
Viewing the availability today section
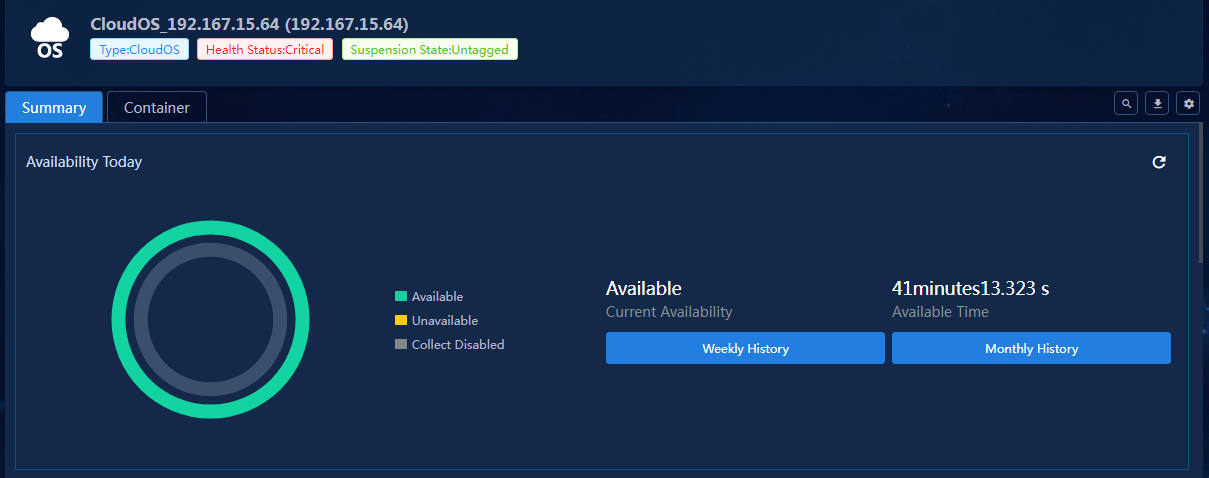
View the Availability Today section in the monitor summary, as shown in Figure 23.
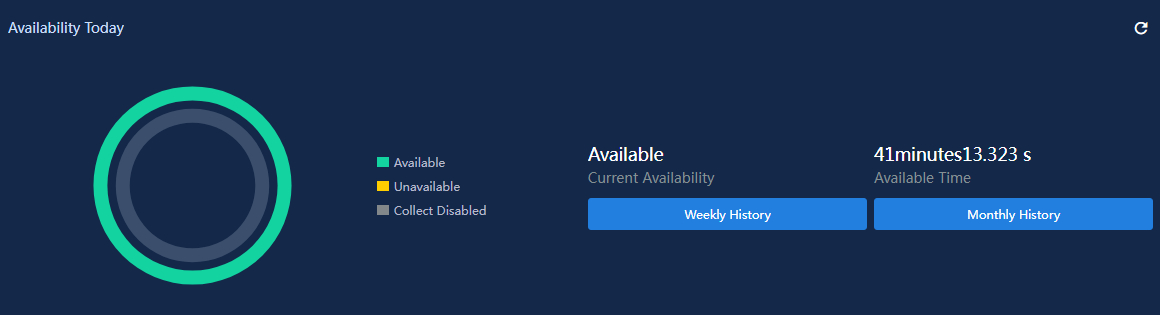
· Pie Chart: Displays the percentage of each availability state of the application today. To view the percentage of an availability state, hover over the slice in the pie chart.
· Current Availability: Current availability of the application.
¡ Available: Total normal running time of the application since 00:00 today.
¡ Unavailable: Total protocol connection failure time of the application since 00:00 today.
¡ Collect Disabled: Total connection disabled time of the application since you manually disabled the collection state for the monitor on the device.
For a newly added application monitor, the Available, Unavailable, and Collect Disabled fields are collected since the time when the application monitor was added today. An availability state with the time of 0 is not displayed.
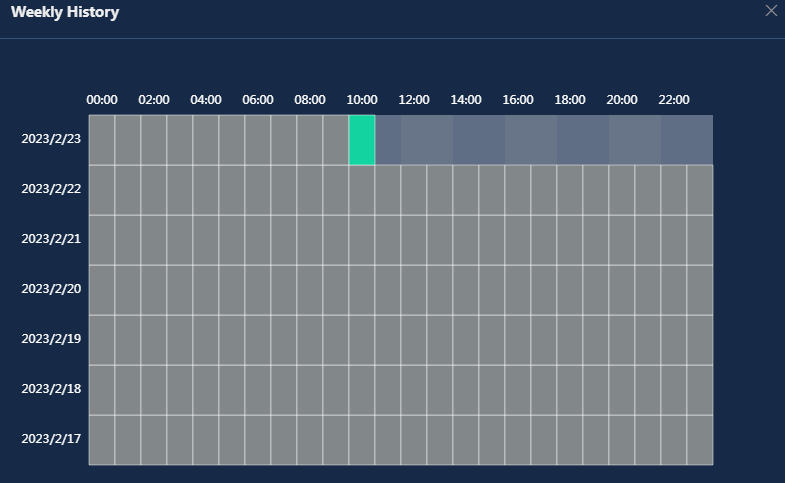
· Weekly History: Click this button to view the availability of the application in the last 7 days. The weekly history collects the application availability in the unit of hours, as shown in Figure 24. When you hover over a time span, you can view the percentage of each availability state of the CloudOS within the time span.
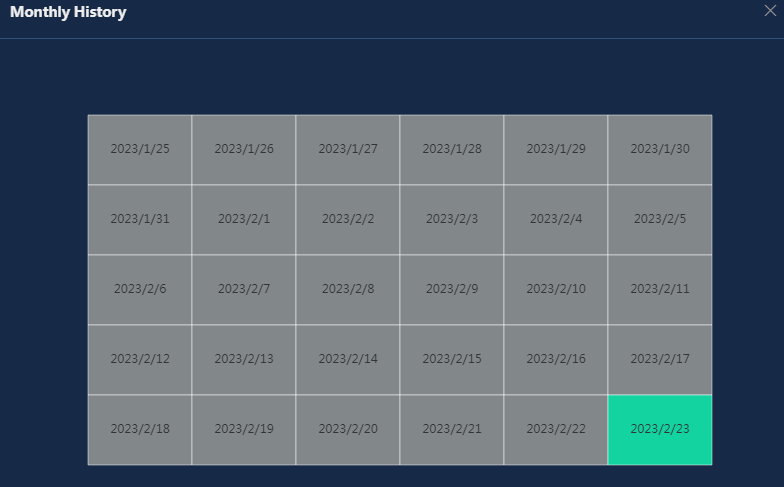
· Monthly History: Click this button to view the availability of the application in the last 30 days. The monthly history collects the application availability in the unit of days. When you hover over a time span, you can view the percentage of each availability state of the CloudOS within the time span, as shown in Figure 25.
Viewing the Kubernetes cluster details
View the Kubernetes cluster details, as shown in Figure 26.
Figure 26 Kubernetes cluster details
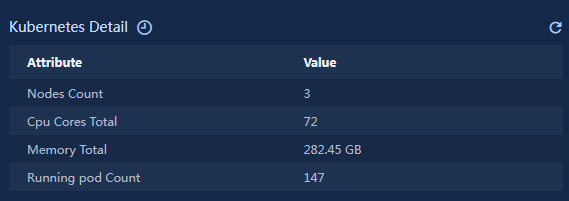
· Nodes Count: The number of server nodes in this Kubernetes cluster.
· Cpu Cores Total: The total number of CPU cores for server nodes in this Kubernetes cluster.
· Memory Total: The total memory of server nodes in this Kubernetes cluster.
· Running pod Count: The number of running pods in this Kubernetes cluster.
Viewing the total container count
View the total container count, as shown in Figure 27.
Figure 27 Total container count
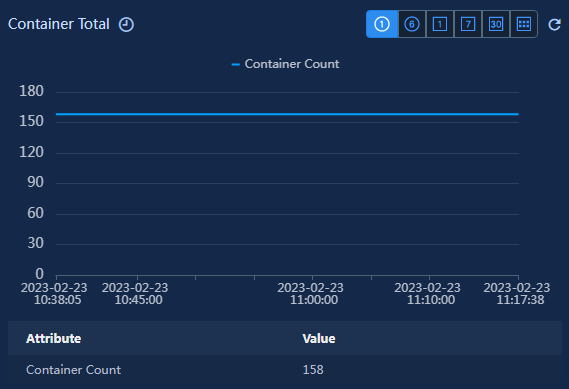
· Container Count: The total number of containers running on server nodes in this Kubernetes cluster.
Viewing the node overview
View the node overview, as shown in Figure 28.
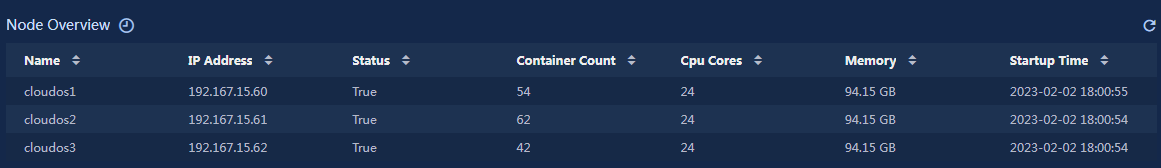
· Name: The name of a server node in this Kubernetes cluster.
· IP Address: The IP address of a server node in this Kubernetes cluster.
· Status: The status of a server node in this Kubernetes cluster.
· Container Count: The number of containers on the current Kubernetes cluster server node.
· Cpu Cores: The number of CPU cores on the server node of this Kubernetes cluster.
· Memory: The memory of the server node in this Kubernetes cluster.
· Startup Time: The startup time of the server node in this Kubernetes cluster.
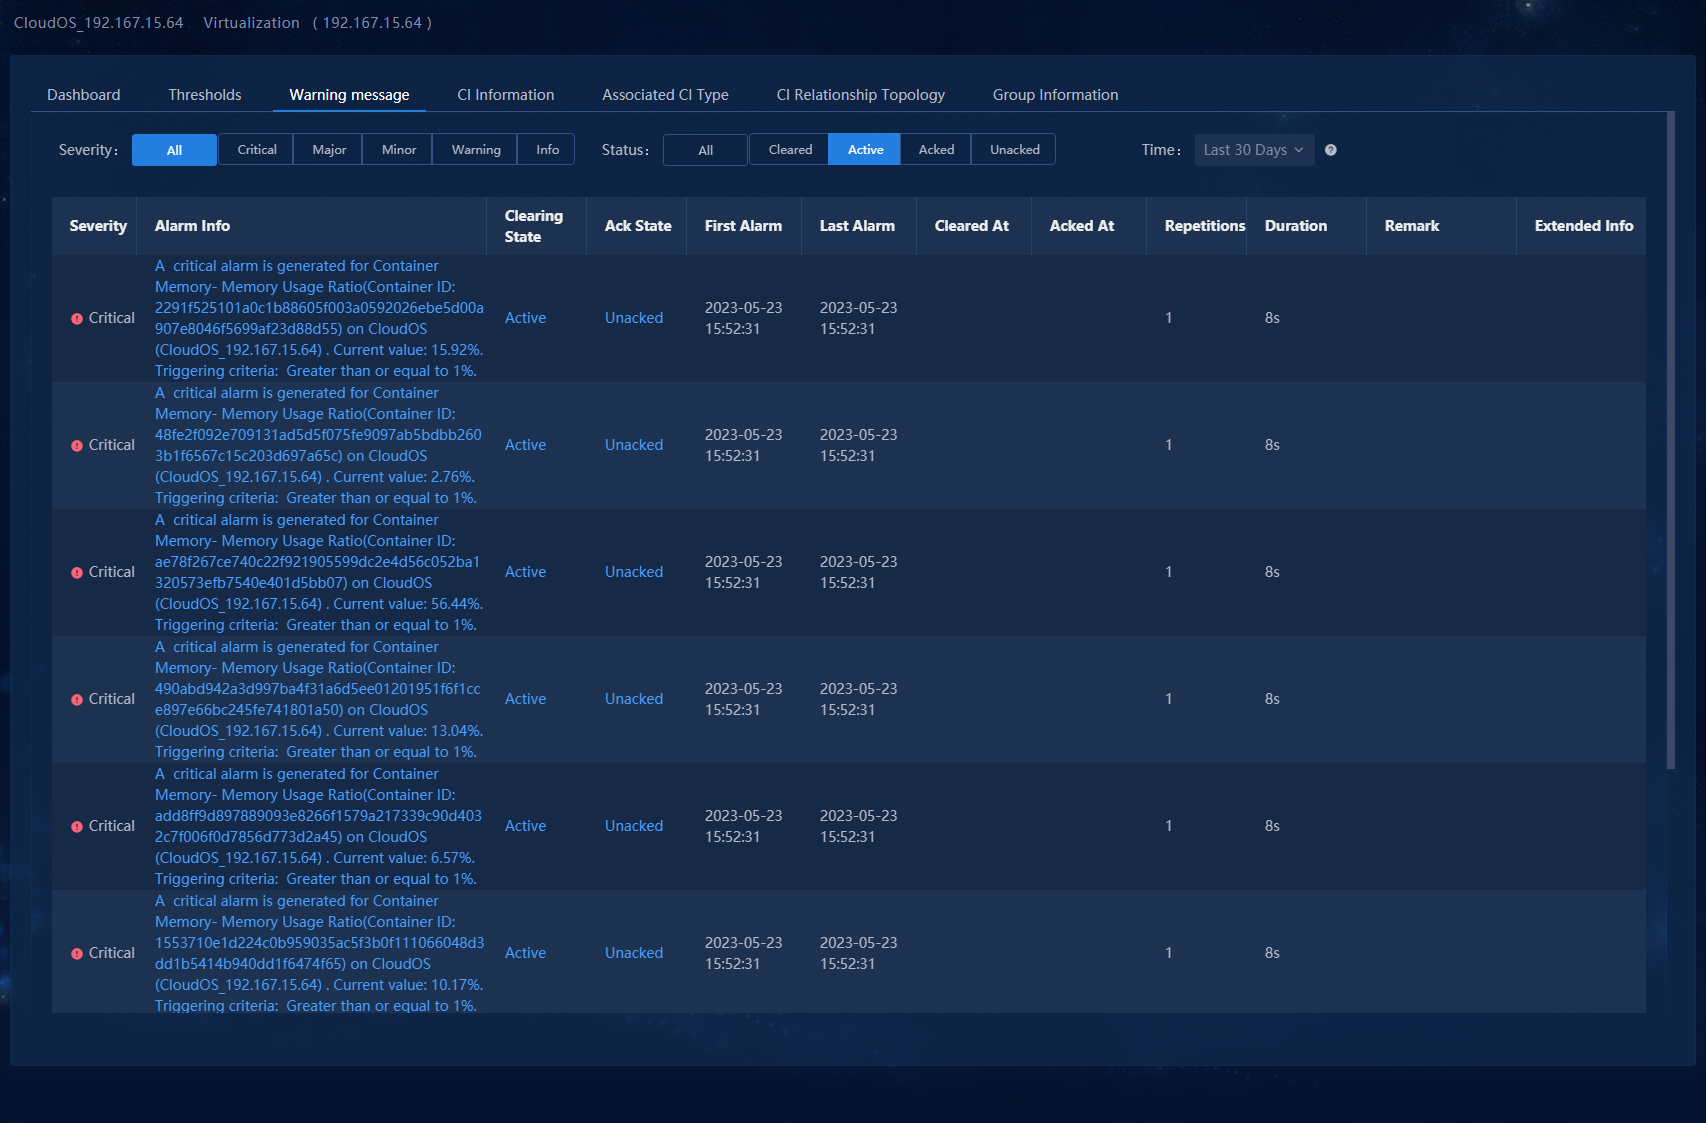
Viewing the CloudOS threshold alarms
In the CloudOS resource details window, the Dashboard tab displays the name, type, health status, and suspension state of the monitored application. If an application has triggered alarms of different levels, the health status displays the highest level of alarms triggered.
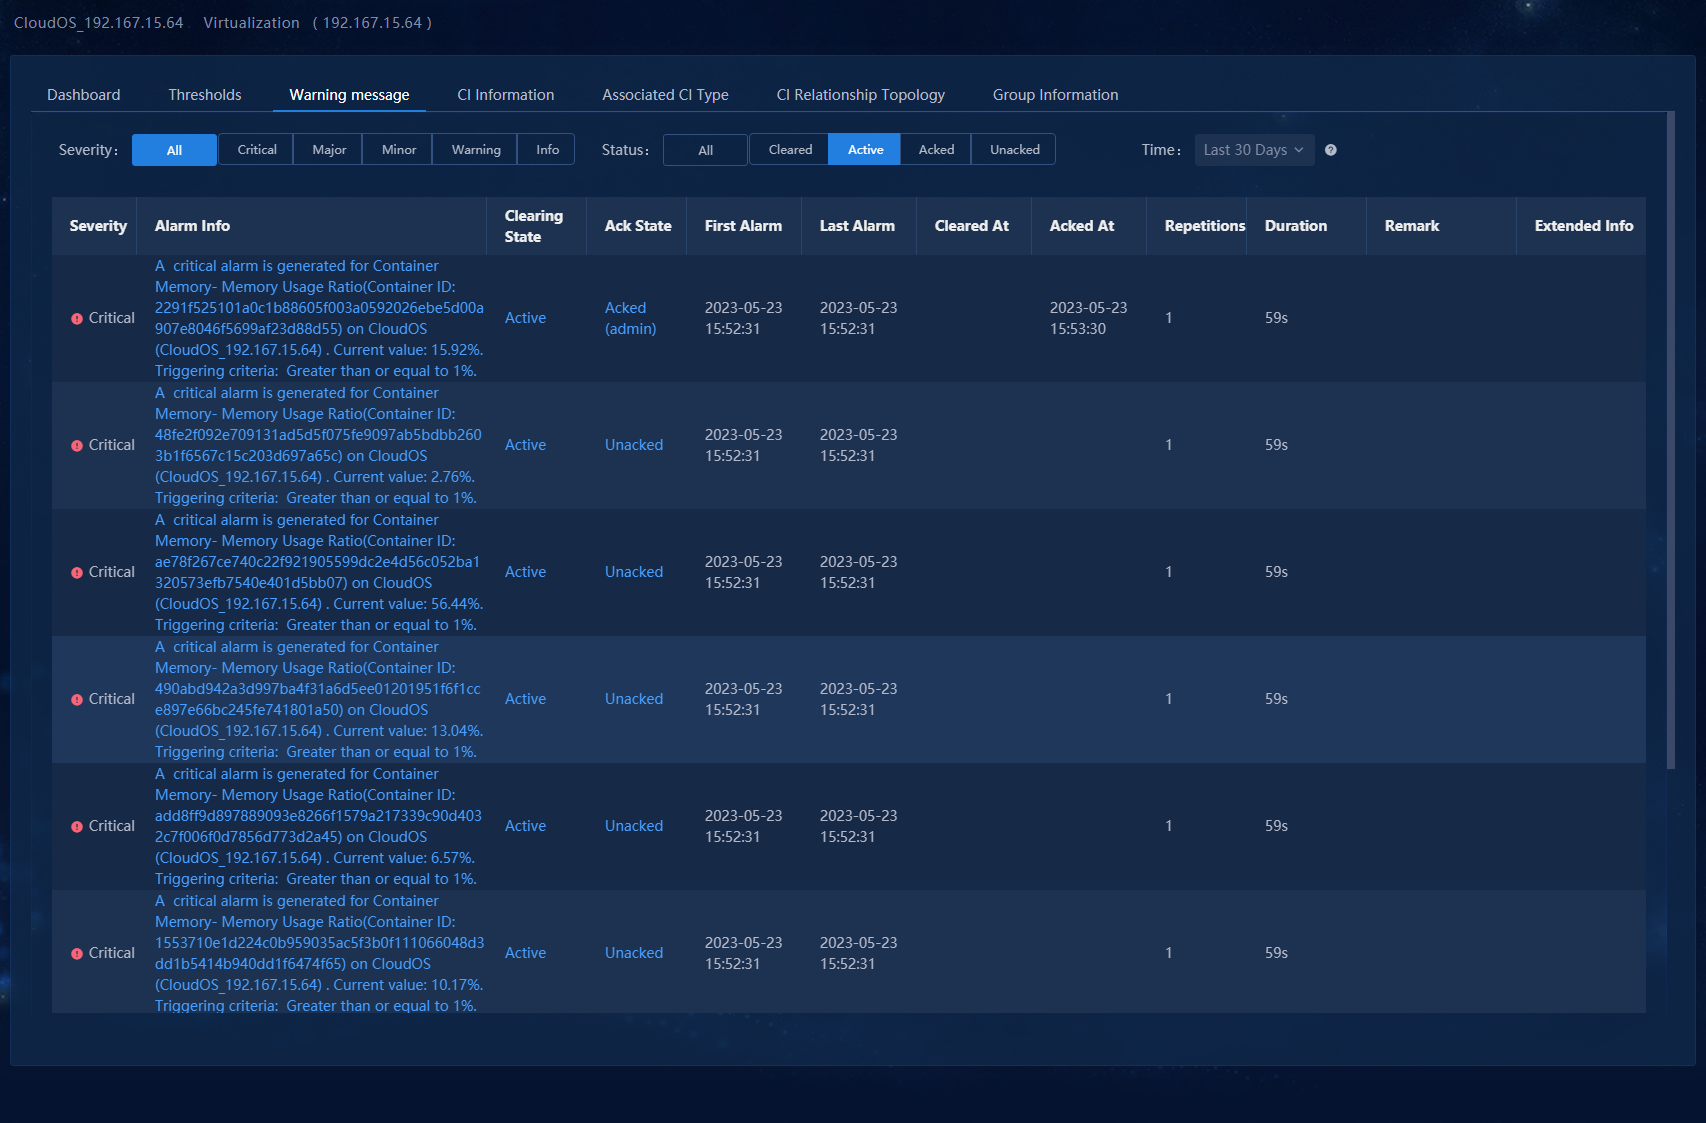
1. Click the health status link or click the warning message tab.
The warning message page opens, as shown in Figure 29.
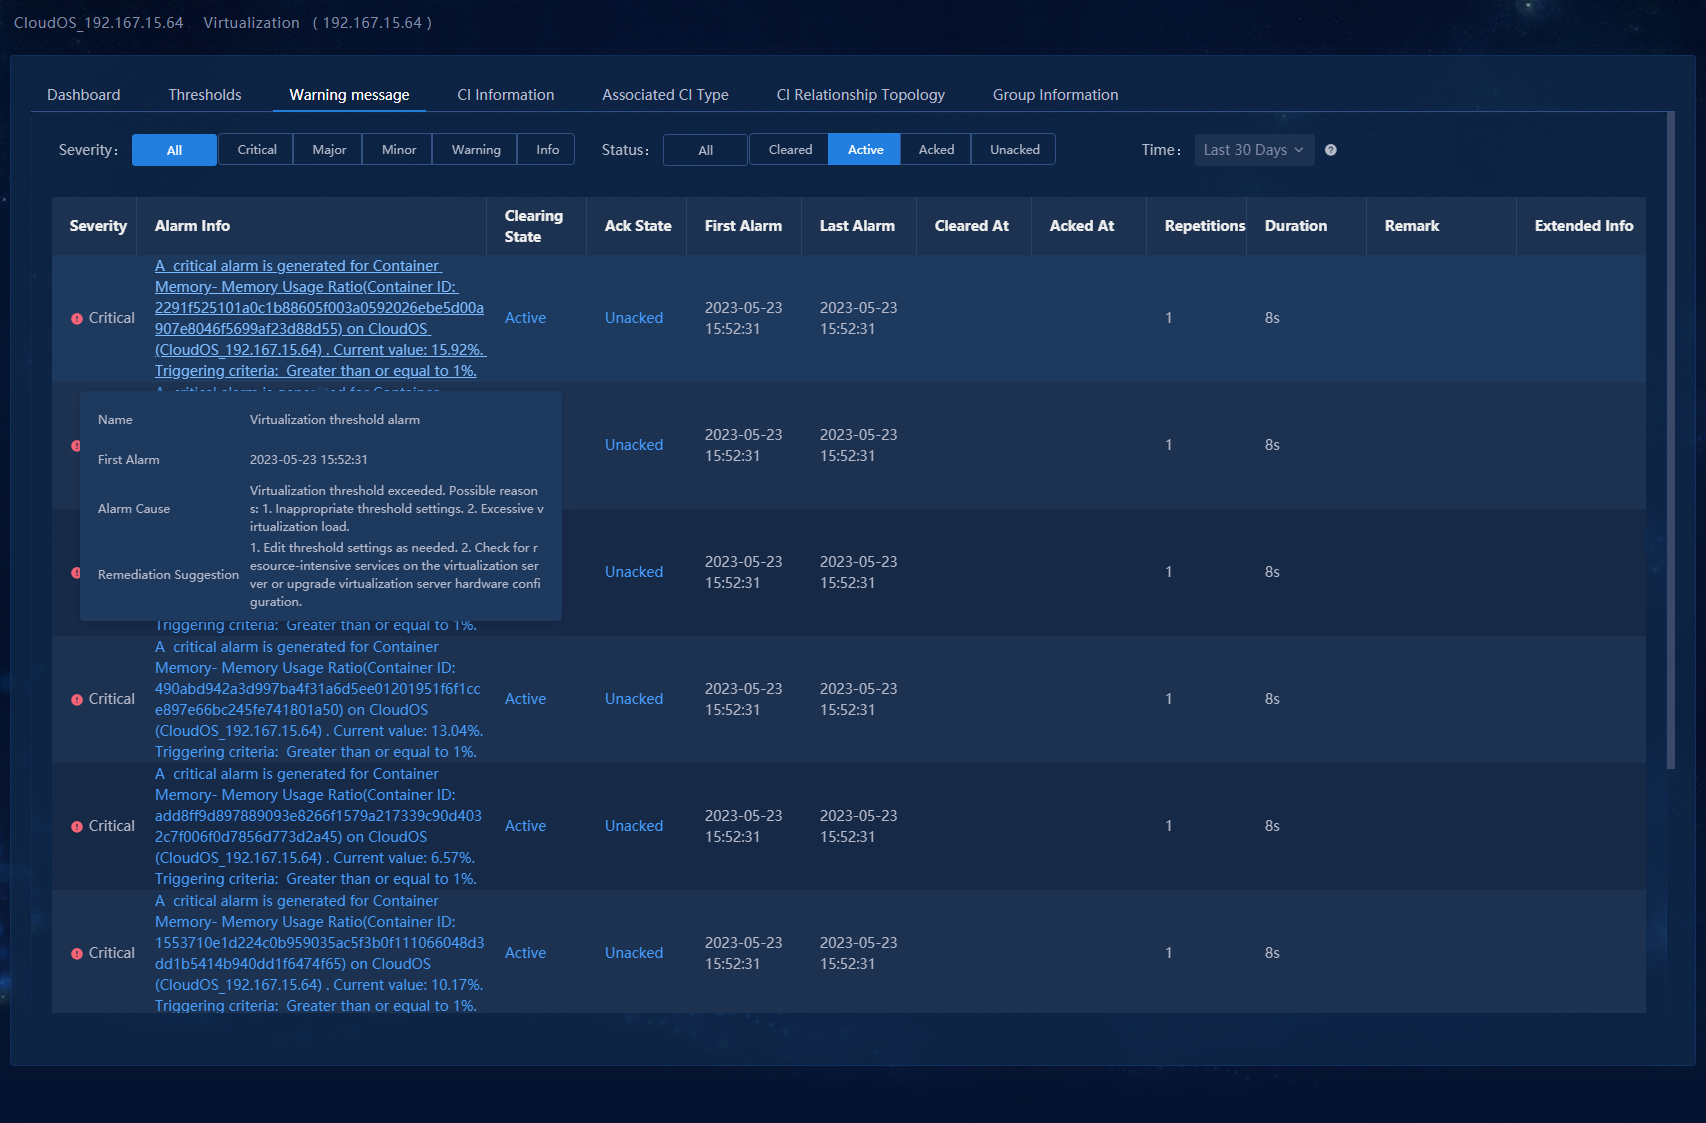
2. Hover over the link in the Alarm Info column to view the details. Alternatively, click the link in the Alarm Info column to directly view the alarm details, as shown in Figure 30.
Figure 30 Alarm details displayed in the floating window
3. After you receive the virtualization threshold alarm generated by the memory usage ratio and confirm that the related information is correct, you click the Unacked link in the Ack State column to acknowledge the alarm, as shown in Figure 31.
Figure 31 Virtualization threshold alarm - Acknowledging the alarm
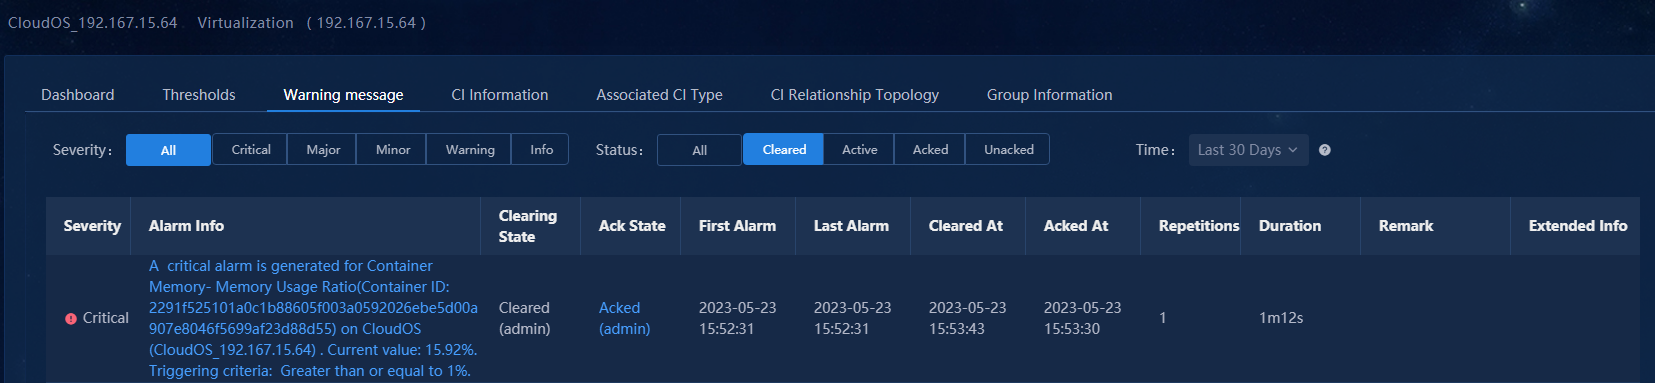
4. After you resolve issues in the environment or set the threshold again, you can click the Active link in the Clearing State column to clear the alarm, as shown in Figure 32.
Figure 32 Virtualization threshold alarm - Clearing the alarm
|
|
NOTE: Automatically clear and acknowledge alarms: · U-Center 2.0 periodically monitors applications. If the metric values collected in the next period no longer meet the threshold conditions, the alarm will be automatically cleared, and the new metric value will be recorded. · After viewing related information, click the Unacked link in the Ack State column to acknowledge the alarm, |
5. After all alarms are cleared, the alarm state of the CloudOS will be restored to normal, as shown in Figure 33.